Systematic Review

Prevalence of Malnutrition in Patients with Parkinson’s Disease: A Systematic Review

by
Karolina Wioletta Kacprzyk
1,
Magdalena Milewska
1,*,
Alicja Zarnowska
1,
Mariusz Panczyk
2,
Gabriela Rokicka
1 and
Dorota Szostak-Wegierek
1
1
Department of Clinical Dietetics, Faculty of Health Sciences, Medical University of Warsaw, 00-581 Warsaw, Poland
2
Department of Education and Research in Health Sciences, Faculty of Health Science, Medical University of Warsaw, 00-581 Warsaw, Poland
*
Author to whom correspondence should be addressed.
Nutrients 2022, 14(23), 5194; https://doi.org/10.3390/nu14235194
Submission received: 4 October 2022 / Revised: 19 November 2022 / Accepted: 21 November 2022 / Published: 6 December 2022
(This article belongs to the Section Geriatric Nutrition)

Abstract

:
Objectives: This systematic review analyzed the prevalence of malnutrition in patients with Parkinson’s Disease. Study design: a systematic review. Method: Four databases—Cochrane, PubMed, Embase and Web of Science—were searched from October 2021 to June 2022 by two independent researchers. The inclusion criteria were as follows: patients above 18 years old with confirmed Parkinson’s Disease, performed screening nutritional assessment, cohort studies, case-control studies, and cross-sectional studies. Patients without Parkinson’s Disease and with other parkinsonian syndromes were excluded. Results: 49 studies were included in this systematic review. Patients ranged in age from 20 to 96 years. There were 5613 subjects included. According to Mini Nutritional Assessment, 23.9% (n = 634) participants were at risk of malnutrition and 11.1% (n = 294) were malnourished. According to BMI score, most patients were either obese or overweight. Conclusions: the prevalence of malnutrition or risk of malnutrition in the study group was significant. Therefore, more specific and detailed studies on the prevalence of malnutrition in patients with Parkinson’s Disease are needed.

1. Introduction

Parkinson’s disease is described as a progressive disorder characterized by degeneration of the dopaminergic neurons of the substantia nigra in the midbrain [1] and the presence of alpha-synuclein-positive cytoplasmic inclusions called Lewy bodies [2]. It was first described by British doctor James Parkinson in the “Essay on Shaking Palsy” in 1817. [3] Patients experience progressing decreases in motor and cognitive functions and higher mortality [1]. The most common symptoms are bradykinesia, rigidity, postural reflex impairment, and resting tremor [1,3]. Some psychiatric symptoms, such as anxiety, dementia and depression, can be noted in patients with Parkinson’s disease [3], as well as sleep disorders, especially insomnia and REM behavioral disorder [2]. Other noticeable symptoms are fatigue, constipation, hypotension, cramps, and seborrheic dermatitis [3].
The diagnosis is especially hard in the early stages of the disease because its symptoms are common to other conditions such as vascular parkinsonism, essential tremor, or progressive supranuclear palsy [1]. The diagnostics are based on clinical criteria, such as parkinsonism and no history of drugs, toxins, or infections, also excluding the signs of other neurological damage [3]. Most PD cases are caused sporadically, and only a small number of patients carry disease-causing genetic mutations [2].
There are two groups of substances that can be used in the treatment of Parkinson’s disease: levodopa and monoamine oxidase-B inhibitors. Levodopa is an agonist of dopamine and is administered with carbidopa. It inhibits the metabolism of levodopa and allows the therapeutic concentration of the drug to enter the brain [1]. It is the most effective drug used in Parkinson’s disease treatment. Its chemical structure allows it to compete with neutral amino acids for intestinal absorption. Due to that, levodopa should be administered at least 30 min before each meal. This facilitates the avoidance of drug interaction with dietary protein. Side effects of antiparkinsonian drugs are often reported by patients as symptoms contributing to an increased risk of weight loss. Among the most frequently mentioned side effects are: abdominal pain, vomiting, dyspepsia, dry mouth, diarrhea or constipation, and other gastrointestinal disorders [4,5,6].
One of the conditions which leads to an increased risk of malnutrition in PD patients is oropharyngeal dysphagia. It is estimated that around 80% of patients suffer from this kind of issue in the early stages of the disease. The incidence increases to 95% in later stages. Delayed oropharyngeal transition time and reduced muscle strength are most common in this group of patients. Due to dehydration, malnutrition, possible silent penetration, and aspiration of consumed foods to the lungs, the mortality rate increases significantly [7]. Swallowing dysfunctions in PD patients are diagnosed using the VFSS and FEES tests. A multidisciplinary approach is necessary for the proper management of dysphagia in PD patients [8].
Patients with Parkinson’s disease are at high risk of weight loss and malnutrition. Weight loss may be present at diagnosis and is associated with increased energy expenditure due to tremors and rigidity. It leads to an increase in the daily dose of levodopa, which results in the worsening of dyskinesias. Weight gain can be noticed as well. It usually occurs because of dopaminergic treatment or deep brain stimulation (DBS). This should be taken into consideration, since it usually results in a fat mass gain, mostly in the abdominal area, and leads to an increased risk of metabolic syndrome [9].
Due to the many negative aspects of Parkinson’s disease (such as the aforementioned unintentional changes in body weight, swallowing difficulties, drug side effects, and more), there is a need for regular evaluation of nutritional status among this group of patients.
This study aimed to review the nutritional status of patients with Parkinson’s disease and to determine the prevalence of malnutrition in the mentioned group—and to assess the need for nutritional status screening.

2. Materials and Methods

This study was written based on the Preferred Reporting Items for Systematic Reviews and Meta-analyses (PRISMA) guidelines and was not registered in PROSPERO.

2.1. Literature Search and Strategy

A literature search was conducted via four databases: Cochrane, PubMed, Embase and Web of Science. We included papers that were published between 2000 and 2020. The search was conducted using Medical Science Heading (MeSH) terms (Table 1). Relevant articles were accessed in full text and checked for eligibility criteria. The analysis began in October 2021 and ended in June 2022. Figure 1 presents the methodology if the search.

2.2. Inclusion and Exclusion Criteria

Studies included in our review had to include a nutritional status assessment method: use of a specific questionnaire or measurement of the BMI. Some studies did not involve the exact topic (the prevalence of malnutrition in PD patients), but had to include participants with this condition.
Studies were included based on the following criteria:
  • adult patients above the age of 18,
  • patients diagnosed with Parkinson’s disease, and
  • screening nutritional assessment,
  • Exclusion criteria were:
  • animal research,
  • wrong study publication (such as posters or conference abstracts),
  • studies on cells in vitro,
  • patients diagnosed with other parkinsonian syndromes, and
  • unavailability of the abstract and full text.
We also excluded studies if there was no response from the authors after 14 days from contact. Language was not considered an exclusion criterion in our study.
We contacted the corresponding authors via correspondence e-mail or other e-mail addresses found on the internet. After 14 days without reply, we either excluded the study or marked lacking information as “nd” (no data).

2.3. Eligibility Criteria

The PICOS framework was used to specify qualification requirements. The population eligible for inclusion was only the adult population (P). Screening tools that were taken into consideration were: MNA, MNA-SF, SGA, PG-SGA, MUST, MEONF-II, SCREEN-II and Body Mass Index (I). There was no comparison (C), and the outcome of interest (O) was the prevalence of malnutrition and risk of malnutrition. As for the methodology of the study, the cross-sectional studies, cohort studies and case-control studies were acceptable. Posters and clinical cases were excluded. The PICOS structure criteria for inclusion are shown in Table 2.

2.4. Data Extraction

All eligible abstracts were transferred to Rayyan, where two independent reviewers (KK and AZ) conducted an analysis based on title and abstract. All studies that met the inclusion criteria were included in further searches, while those that met the exclusion criteria were excluded. The uncertainties were resolved by two other researchers (MM and GR).
If the data were not clear, full text was reviewed, based on which the study was either excluded or included.
Further searches consisted of the analysis of full text of papers included in the abstract analysis. All articles were consulted between all participating reviewers (KK, AZ, GR and MM) and all discrepancies were resolved.
The data were maintained in a Microsoft Excel spreadsheet. The following data were collected: author, year of the study, country, study type, study sample, Hoehn & Yahr stage, UPDRS total score, age (minimum, maximum, standard deviation), sex, assessment method, scores of each questionnaire (mean, minimum, maximum, standard deviation), and BMI score.
In case of absence of data needed for study inclusion, authors were contacted via e-mail provided for correspondence or other address found on the Internet. Lack of response from the corresponding authors within 14 days resulted in exclusion of the study due to absence of required data.

2.5. Quality Assessment and Statistical Analysis

Quality assessment of the included studies was carried out using the Critical Appraisal tools for use in JBI Systematic Reviews. The means of this assessment was to see how the study assessed the probability of bias in its planning, analysis, and execution. Only scores over 50% were included. Detailed data are provided in Figure 2, Figure 3, Figure 4 and Figure 5.
Results were reported with standard deviation (SD), further combined, and analyzed in MS Excel.

3. Results

There were 49 studies included, evaluating patients’ nutritional status using different assessment methods (body mass index, questionnaires: MNA, MNA-SF, SGA, PG-SGA, MUST, MEONF-II and SCREEN-II), resulting in various study designs (cross sectional: 33; case control: 10; cohort studies: 6).

3.1. Group Characteristics

There were 5727 patients in all. Studies assessed originated from all continents except Africa and Antarctica; 57.3% of patients were men and 40.9% were women. Most studies were conducted in Asia (24 studies), with the second most in Europe (16 studies). There were 2 studies in Australia, 4 in North America, and 3 in South America. More detailed data are presented in Table 3.

3.2. Nutritional Status Assessment

3.2.1. Malnutrition Universal Screening Tool (MUST)

Only two studies [15,29] assessed nutritional status using the Malnutrition Universal Screening Tool (MUST). In this section, there were 343 participants, but the authors of each study showed different results. In the first study [15], 17.2% of patients were at risk of malnutrition and 5% were already malnourished. The second study [29] pointed out that 15.4% of patients were at medium risk of malnutrition, 8,1% were at high risk of malnutrition, and the rest (76.5%) were at low risk of malnutrition.
There was a problem with comparing the two studies, as one provided more specific data (such as mean score of MUST questionnaire for the group of patients [15]) than the other. Additionally, the authors described nutritional status in different ways. Nonetheless, both studies presented less than 10% of their groups at either high risk of malnutrition or already malnourished, and between 15 and 17% at moderate risk or at risk in general.
More detailed data are provided in the table below (Table 4).

3.2.2. Subjective Global Assessment (SGA) and Patient Generated Subjective Global Assessment (PG-SGA)

In this section, there were only two studies [30,31]. These were conducted by the same authors, and included a total of 250 patients, of which 58.8% were male and 41.2% were female. The median score of both questionnaires was 3. In the first study, 15% of patients were categorized as SGA-B, i.e., at risk of malnutrition or moderate malnutrition [30]. The second study showed similar results, with 15.2% of patients categorized as SGA-B [31]. No participants were assigned to the SGA-C group, which referred to severe malnutrition [30,31].
More specific data are available in Table 5 and Table 6.

3.2.3. SCREEN-II and MEONF-II

Seniors in the Community: Risk Evaluation for Eating and Nutrition (SCREEN-II) and Minimal Eating Observation and Nutrition Form—Version II (MEONF—II) were used in only one study by Lindskov, S.; Sjöberg, K. et. al. [16]. The study provided data on the onset of the study and at a follow up one year later. SCREEN-II results showed that 69.4% were at high risk of malnutrition and 22.6% at moderate risk; these later rose to 75.8% and fell to 21%, respectively. MEONF-II was used to assess the risk of undernutrition; 96.9% of participants were at low risk of undernutrition and 0% were at high risk at the baseline. Follow-up assessment showed a slight drop in undernutrition low risk group (95.4%), while high risk rose to 1.5% [16].
More specific data are provided in the Table (Table 7) below.

3.2.4. Mini Nutritional Assessment (MNA)

Mini Nutritional Assessment is used for assessing the nutritional status of patients. There were 22 studies included in which MNA assessments were conducted [10,11,12,16,17,18,19,21,32,33,34,35,36,37,38,39,40,41,42,43,44,45]. There was a total of 2713 participants, of which 39.2% were female and 60.8% were male. The youngest patient included was 20 years old [17], while the oldest was 92 years old [10]. The highest reported number of malnourished patients was 39.2% [10]; at risk of malnutrition was 59% [32], and the lowest were 0% and 14%, respectively [21]. A significant number of studies (6 out of 22) did not report on the prevalence of malnutrition or risk of malnutrition [16,17,19,35,37,44]. The summarized results of MNA questionnaire are shown in Table 8. One study reported the nutritional risk levels as low, moderate, and high, respectively, on each stage of the study: baseline and follow-up [16]. The nutritional status report of this study [16] is not included in the table below summarizing nutritional status of patients using the MNA questionnaire (Table 9). It can be found in Table 10.

MNA-SF

Three studies reported the nutritional status of PD patients using the MNA Short Form (MNA-SF) [22,32,46]. In this section, 147 patients were included, consisting of 54.4% male participants and 45.6% female participants. The maximum age was 94 years [46] and minimum was 65 [22]. One study reported an inclusion criteria minimal age of 45 but did not state the exact lowest age of its subjects [32]. Only one study reported on the percentage of patients at risk of malnutrition and malnourished patients: 14.8% and 5.6%, respectively [22]. One study reported only on the number of those at risk of malnutrition, and the last did not contain that information [32].
The number of studies using MNA-SF as assessment tool were insufficient to compare the results in adequate and valuable way.
The combined results are shown in Table 11.

Body Mass Index (BMI)

We took into consideration 49 studies [10,11,12,13,14,15,16,17,18,19,20,21,22,23,24,25,26,27,28,29,30,31,32,33,34,35,36,37,38,39,40,41,42,43,44,45,46,47,48,49,50,51,52,53,54,55,56,57,58] in which BMI was assessed, resulting in 5727 patients, 57.3% of whom were men and 40.9% of whom were women. The lowest reported mean BMI was 17.84 kg/m2 [46] and the highest was 30.17 kg/m2 [23]. Five studies did not report BMI score despite using it in the process of the study as an assessment tool [11,17,30,34,44]. Wang G. et al. reported the BMI scores for a group of MNA ≤ 23.5 but did not provide the same data for MNIA > 23.5 [40]. Some studies reported the mean BMI score as the median instead of the mean [31,56]. This resulted in difficulties comparing the data of all studies in this section and, along with the absence of data from other studies, made it impossible to assess the mean BMI of the entire group of participants included in our study.
More detailed data are provided in the table (Table 12) below.

4. Discussion

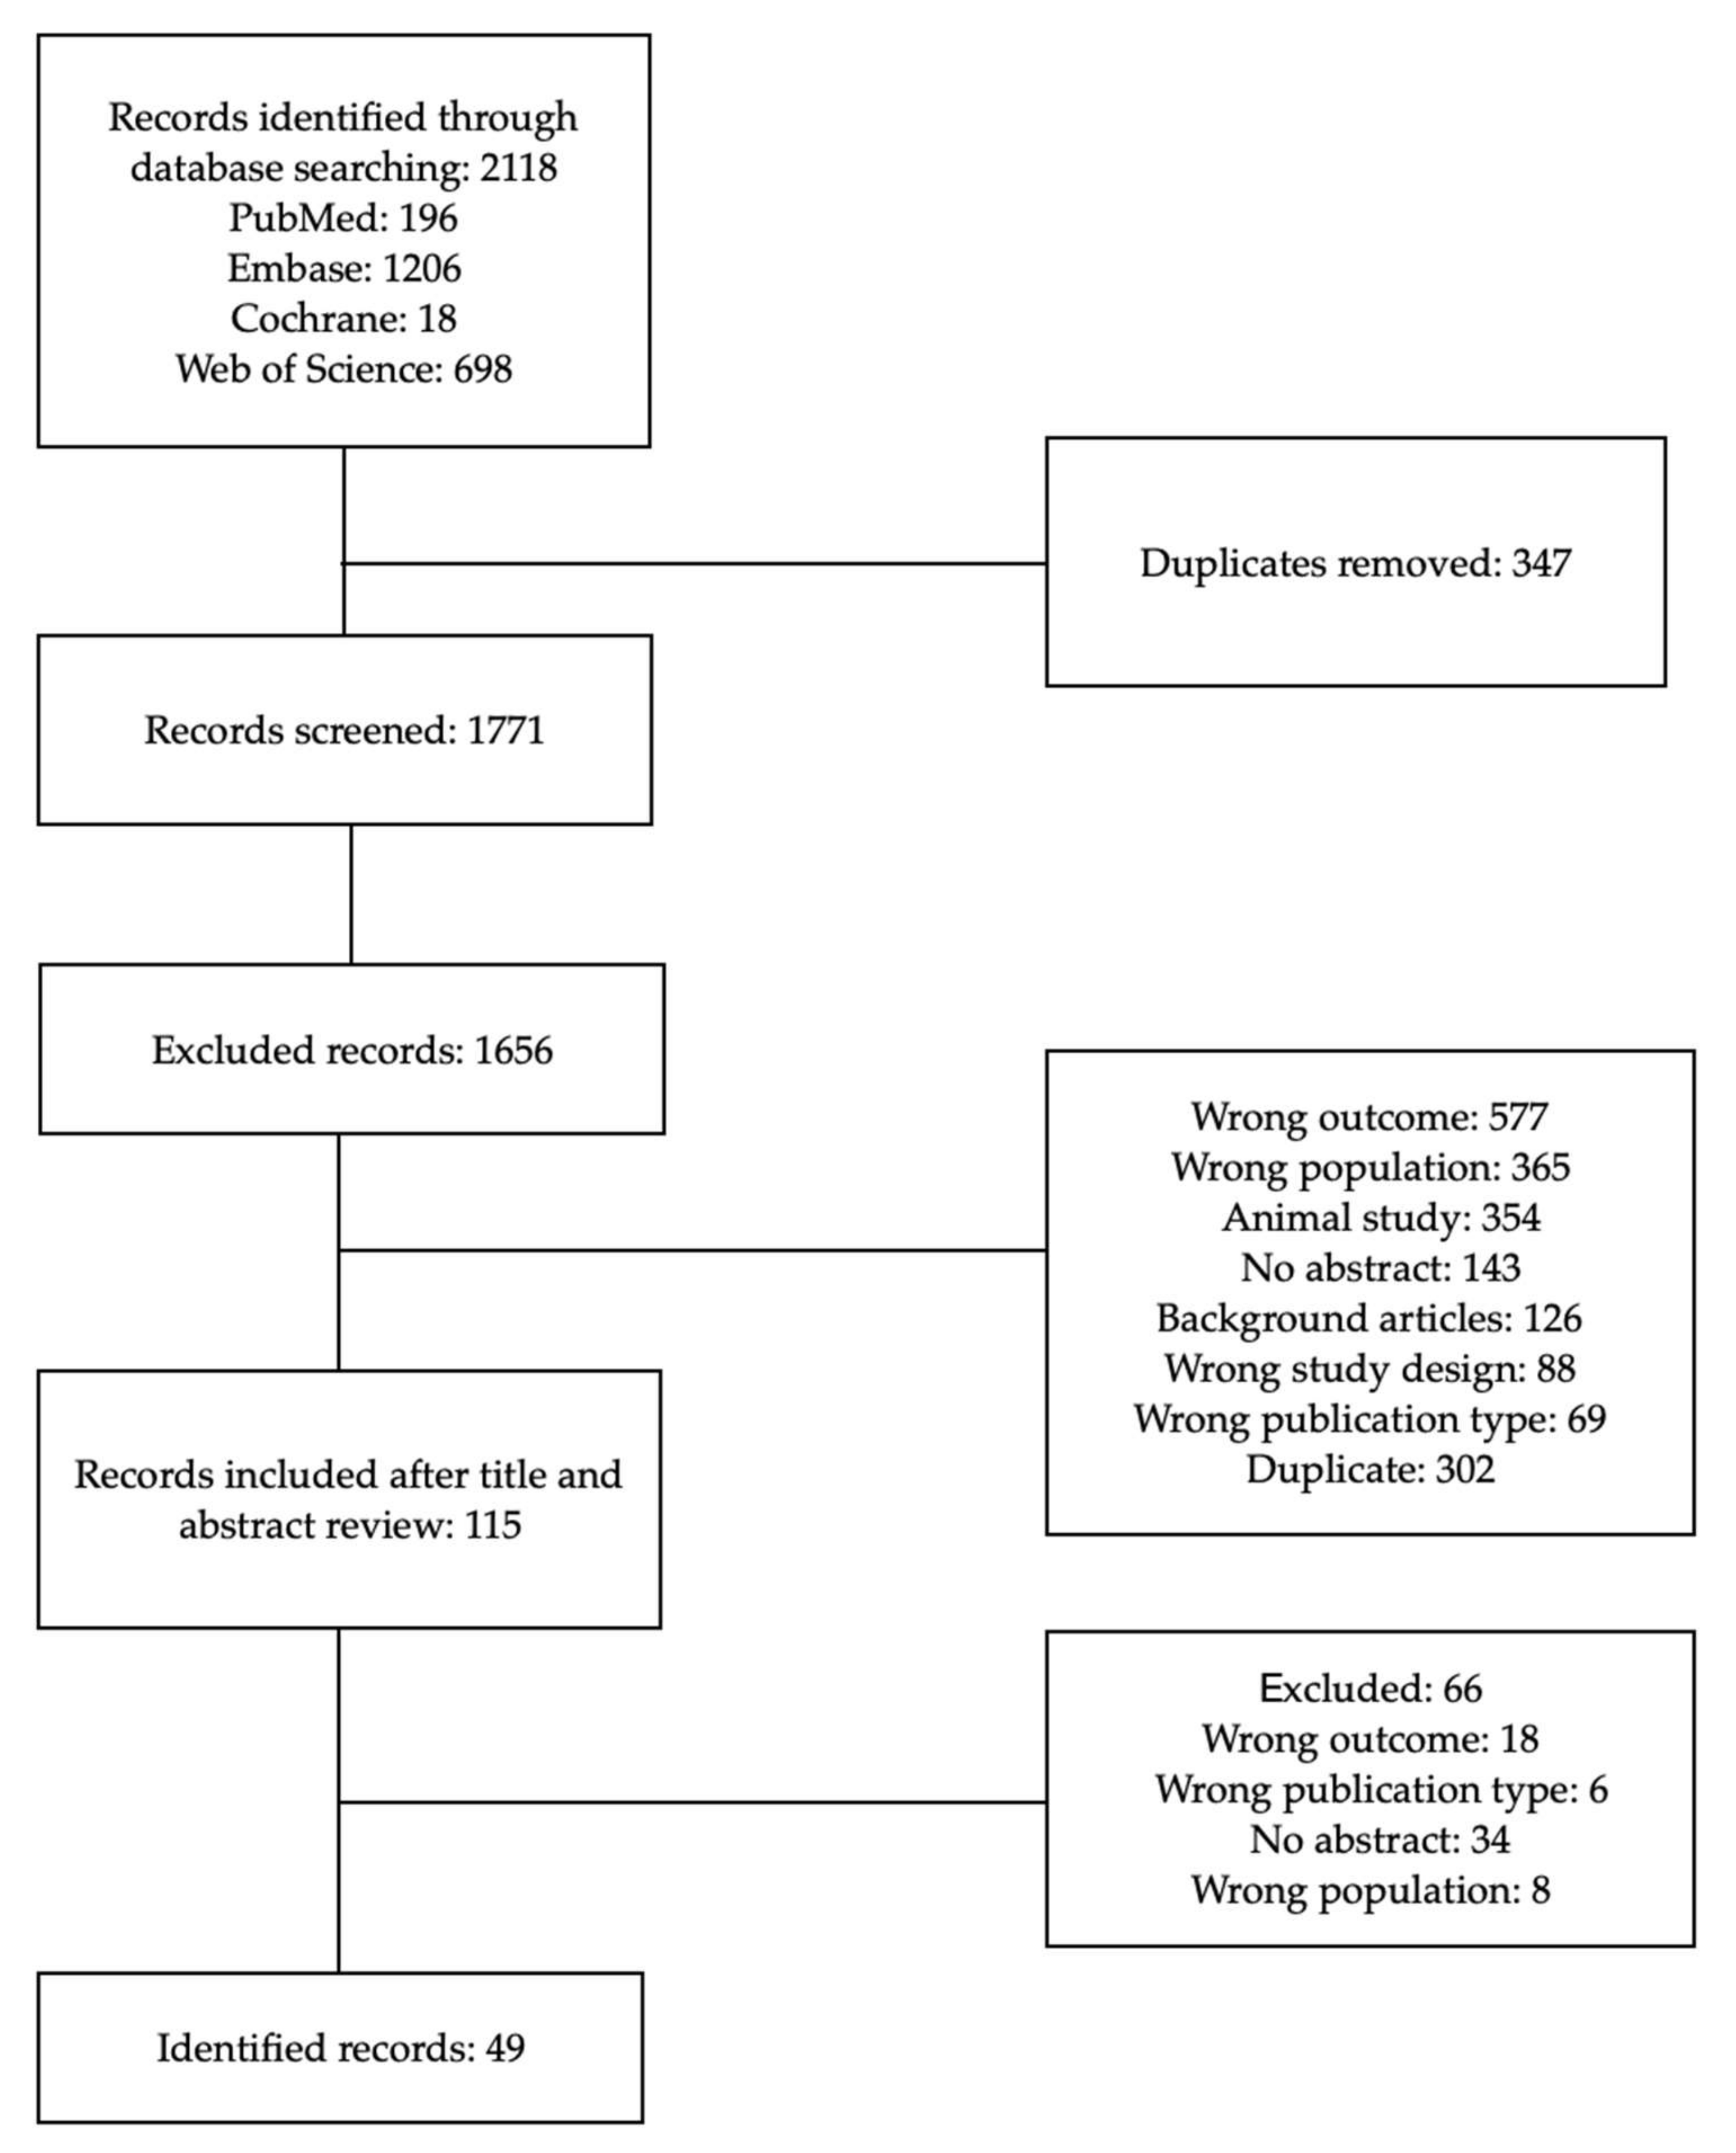
Our systematic review aimed to show the prevalence of malnutrition among patients suffering from Parkinson’s disease. We included 49 studies from 21 countries. We noted that there were disbalances in the results of each questionnaire and method of nutritional status assessment.
Malnutrition is a common issue experienced by patients suffering from Parkinson’s Disease which results in poor health of the patients. Adequate assessment methods and management strategies are needed, as malnutrition affects these groups excessively. There are many coexisting factors that should be taken into consideration at the onset of the disease and during evaluations, such as probable swallowing disorders. Dysphagia affects a significant number of PD patients, and severe dysphagia appears mostly in advanced stages of Parkinson’s disease. Hoehn and Yahr stages 4 and 5, recent weight loss, sialorrhea, and BMI < 20 kg/m2 have been considered to predict dysphagia in the mentioned group [8].
Weight loss is another factor strongly associated with malnutrition in PD patients, as it results in cognitive decline, orthostatic hypotension, and dyskinesia. These, in turn, lead to the intake of a higher dosage of levodopa. Both weight loss and malnutrition are a result of negative energy balance, meaning that the intake is lower than the expenditure of energy [59]. It can also be related to hyposmia, which is a decrease in the capability to sense a smell. Hyposmia is also considered to be one of the earliest non-motor symptoms of PD [60].
Energy balance is known as homeostasis and is a process in which the human body adjusts food intake and energy expenditure. In healthy individuals, the input of energy equals the output. In PD patients, both disease-related and treatment-related factors can contribute to disturbed energy balance correlated with dopaminergic deficit. In early stages of Parkinson’s disease, symptoms like sensory disfunction or gastrointestinal disfunction are associated with weight loss due to decreased food consumption. In later stages, when motor symptoms are more common, energy expenditure increases. [59] Resting energy expenditure (REE) is hard to assess. Some authors pointed out that REE was higher in untreated patients than in those treated with L-dopa [61], while some authors suggested that REE remained unchanged between untreated and treated individuals [62]. REE is associated with tremor and rigidity. Those two symptoms are strongly associated with Parkinson’s disease and contribute to increased energy expenditure and weight loss.
Another predictor of weight loss and future risk of malnutrition is gastrointestinal dysfunction, which is common in PD patients and can precede motor defects by years. Parkinson’s Disease is associated with intestinal inflammation and other gastrointestinal abnormalities, such as constipation or dysbiosis [63].
Early detection of weight loss can lead to early notice of malnutrition risk, which makes it possible to improve a patient’s quality of life. Nutritional intervention is meant to improve negative aspects of Parkinson’s disease (e.g., managing swallowing difficulties or maintaining proper body weight), resulting in better quality of life and helping to reduce the progression of the disease. A study by Sheard J. et al. showed that malnourished patients experienced lower life quality than well-nourished patients—and that nutritional intervention helped to improve emotional well-being [64]. The authors concluded that early detection of weight loss could help to prevent malnutrition and reduction in quality of patients’ lives.
Various tools are used to screen the nutritional status of patients. Aside from biochemical factors or recent weight loss, specific questionnaires are currently in use. One of the most common is the Malnutrition Universal Screening Tool (MUST), which was developed to assess patients in all kinds of ambulatory care [65]. It includes body mass index value, weight loss for the past 3–6 months, and anorexia associated with an illness in the past 5 days. It also includes two questions about unintentional weight loss and a decrease in food intake [66].
The Seniors in Community: Risk Evaluation for Eating and Nutrition (SCREEN II) questionnaire consists of seventeen questions and assesses the risk of malnutrition based on the number of eaten meals, difficulties in eating such as dysphagia, changes in body mass, and social aspects of food intake in patients, e.g., living alone in their homes [66].
Subjective Global Assessment (SGA) is the most commonly used tool for assessing nutritional status. It includes two kinds of information: medical history and physical examination. The first part includes recent weight loss, functional impairment, and changes in dietary intake, whereas the following part brings up loss of subcutaneous fat, oedema, and muscle wasting. Patients are classified as well nourished (SGA A), suspected or moderately malnourished (SGA B), or severely malnourished (SGA C). The downside of this questionnaire is that it does not monitor changes in nutritional status and does not include biochemical values [28].
The MEONF-II screening tool was designed to determine the risk of undernutrition in hospital inpatients. The score ranges from 0 to 8 points. A score of 0–2 is considered a low risk of undernutrition, 3–4 a moderate risk and ≥5 is a high risk of undernutrition [67].
The highest sensitivity can be found in the Mini Nutritional Assessment (MNA) questionnaire. It was first introduced to assess the risk of malnutrition in institutionalized geriatric patients and became useful in detecting probable malnutrition in senior patients when other parameters, such as biochemical factors and BMI, are still correct [65]. It includes diverse components, such as: weight loss and depletion in food access in the past 3 months, changes in physical activity, psychological stress, and acute illness in the mentioned period, as well as anthropometric measurements, altered sense of smell and taste, or frailty. The MNA consists of eighteen questions divided into four domains. On the contrary, a shorter version called the MNA-SF consists of six questions and is considered to be as effective as the full sheet. If the MNA-SF score is 11 points or less, then the full version should be applied for proper assessment, and the patient is considered at risk of malnutrition [65].
As can be seen from the characteristics of each questionnaire, some assess the risk of malnutrition among patients (MNA, MUST, and SCREEN-II), and others assess nutritional status in general (SGA). MEONF-II, on the other hand, assesses the risk of undernutrition.
One of the included studies, written by Yang T., Zhan Z. et al., showed 39.2% of patients assessed for malnutrition using the MNA questionnaire as malnourished and 30% as at risk of malnutrition, whereas 30.8% had good nutritional status [10]. On the contrary, a study by Vikdahl M., Carlsson M. et al. showed no patients with malnutrition, and only 14% of the cohort were deemed at risk of malnutrition [21].
Only one study that used MNA-SF showed the number of patients with malnutrition or at risk. Umay E., Yigman Z. A et al. pointed out that 14.8% of patients were at risk of malnutrition and 5.6% were already malnourished [22].
Two studies included in our review in which authors used the MUST questionnaire showed comparable results. Barichella M., Cereda E. et al. showed 17.2% of patients at risk of malnutrition and 5% already malnourished [15], while Jaafar A.F., Gray W.K. et al. showed 8.1% of patients at high risk of malnutrition and 15.4% of patients at moderate risk of malnutrition [29].
We took into consideration only two studies where authors assessed the patients with SGA and PG-SGA questionnaires. The results showed around 15% of all cohorts, respectively, identified as level B (moderate malnutrition or at risk of malnutrition) and 0% as level C (severely malnourished) [30,31].
There was a problem with comparing results using SCREEN-II and MEONF-II due to an insufficient number of studies that used those tools in the assessment of patients [16].
On the other hand, studies where authors used body mass index as a tool to measure malnutrition did not offer specific data, other than the fact that, in most studies, the mean BMI score showed patients as overweight or obese, with the highest score of 30.17 kg/m2 [23] and lowest 17.84 kg/m2 [46]. No study that measured only BMI showed the percentage of those malnourished or at risk of malnutrition. The overall results for BMI did not suggest any of the patients to be malnourished or at risk of malnutrition. BMI is used for measuring the weight category, but it is not a reliable way of measuring nutritional status. Thus, BMI is not an adequate assessment tool for assessing patients for malnutrition.
Many authors opted not to provide information on the exact number of patients at risk of malnutrition or malnourished, only the mean score of the questionnaire for the entire cohort studied [13,14,17,19,20,23,24,25,26,27,28,35,37,44,46,47,48,49,50,51,52,53,54,55,56,57,58].
Comorbidities and community could have affected the results, but those were not taken into consideration while preparing this review.
Most studies provided information about disease severity in their cohorts. There were two scales used: Hoehn and Yahr scale and the MDS-Unified Parkinson’s Disease Rating Scale (MDS-UPDRS). Some studies only provided the Hoehn and Yahr scale [31,32,37,41,45,51]. Sometimes authors reported the mean score, sometimes the median [17,21,31,38,39,41], and sometimes the percentage of patients on each level of the scale [24,50,54,56]. The same issue applied for the UPDRS scale, where various aspects of the scale were reported. A few studies did not provide any information on the disease severity of the cohort included in their research [11,16,18,19,26,27,30,34,42,46,47,49,52,55]. The authors showed no correlations between the disease severity and the nutritional status of the patients, leading to the conclusion that no connection existed between disease severity and the prevalence of malnutrition.
Biochemical markers are important factors that could provide more detailed insight into the problem of malnutrition. Albumin, prealbumin, total cholesterol, hemoglobin, and total protein could be useful in screening for malnutrition [68], but were not included in our study. Screening assessments alone could be inadequate, pointing to a need for more precise markers, such as biochemical markers; however, due to limitations these needs could not be met. Additionally, weight loss may be hard to observe in overweight or obese patients; due to that more in-depth analysis will be needed.
Due to the absence of unified diagnostic criteria for malnutrition, ESPEN, ASPEN, PENSA and FELANPE created the Global Leadership Initiative on Malnutrition (GLIM). The first thing needed for diagnosing malnutrition is a screening tool of choice to determine those at risk of malnutrition. The GLIM authors pointed out criteria to look for in patients marked as at risk. Those are as follows: low body mass index, unintentional weight loss, reduced muscle mass, reduced food intake or assimilation, inflammation, or disease burden. The first three were categorized as phenotypic criteria, and the last two as etiologic criteria. For the diagnosis of malnutrition, the authors recommended that a combination of at least one phenotypic and one etiologic criterion is required [69]. Weight loss is easy to assess by a doctor or caretaker of a patient. More attention should be paid to this criterion, as fast detection can be crucial in the proper management of malnutrition.
The GLIM diagnostic criteria for malnutrition should be applied to every patient diagnosed with Parkinson’s Disease, as all criteria mentioned by the authors are common in this group of patients. None of the studies reviewed in our study mentioned the GLIM criteria, and hardly any study was based solely on the problem of malnutrition in PD patients.
Another important guideline that mentioned the importance of screening for malnutrition in Parkinson’s Disease patients are the ESPEN guidelines for clinical nutrition in neurology. The authors mentioned that malnutrition was underreported in this group of patients and could be found in at least 15% of community-dwelling patients. The other 24% were at medium or high risk of malnutrition. They also pointed out the importance of screening for oropharyngeal dysphagia and gastrointestinal dysmotility. The first recommendation in this group pointed out the need for regular screening of nutritional status and vitamin levels during the disease, with extra attention paid to recent changes in body weight. The guidelines also recommended screening for dysphagia, as early detection can help in proper intervention and prevention of malnutrition [70].
The main issue during the writing of this systematic review was the absence of studies investigating the actual problem and prevalence of malnutrition in a group of Parkinson’s disease patients. Most of the data had to be extracted from a variety of studies describing different issues experienced by patients with PD. We also came across a problem when separating the results of only patients with confirmed Parkinson’s Disease. Some studies included larger cohorts with various diseases. We contacted the authors, often with negative results. In the end, studies that lacked necessary information, or in which it was impossible to isolate PD patients from a larger cohort, were excluded from our research.
Currently, only screening tests are available. However, in-depth research is needed to provide adequate, detailed information on the nutritional status of PD patients. Due to the absence of homogeneous studies, it was impossible to conduct results synthesis and meta-analysis.
Our study assessed the prevalence of malnutrition among patients with Parkinson’s Disease by considering 7 questionnaires (MNA, MNA-SF, SGA, PG-SGA, MUST, MEONF-II and SCREEN-II) and BMI. The outcome of this study showed the need for further and more detailed studies on the prevalence of malnutrition in this group of patients. Additionally, it highlighted the lack of adequate assessment tools. Research in this area should be increased, with more care applied to nutritional assessment, as it can determine the quality of life of a patient. A multidisciplinary approach should be applied, and screening for malnutrition should be a routine test, both in the early stages of the disease and throughout the course of the disease, as the prevalence of malnutrition rises with the progression and severity of the disease.

5. Conclusions

This systematic review showed a limited number of papers dedicated to the assessment of nutritional status in patients with Parkinson’s Disease. The studies ranged widely due to the use of several different questionnaires to assess the nutritional status of patients. It was not possible to assess differences in sex, diet, region, economic status, or the severity of Parkinson’s disease. These factors could provide even more insight and help to differentiate more aspects that determine the at-risk level of a patient. Furthermore, it is important to note that many patients tend to be overweight or obese, which should not be ignored while assessing nutritional status. Increased body weight can be seen as a marker of good nutritional status. However, it can be the opposite, and is quite common in patients with Parkinson’s disease. According to available data, the prevalence of malnutrition in patients with Parkinson’s disease is significant, despite many patients displaying excessive body mass. Our results were based on screening assessments. Due to that, further, more detailed research (with greater attention paid to data, methodology, and study design) is needed in this area to provide better insight into the prevalence of malnutrition in patients suffering from Parkinson’s disease. Other, more detailed assessments should be employed which use, for example, biochemical markers or anthropometric measurements. Moreover, it is crucial to properly assess patients’ nutritional status from the onset of the disease in order to apply proper intervention and help to improve patients’ quality of life.

Author Contributions

Conceptualization, K.W.K. and M.M.; methodology, M.M., M.P. and D.S.-W.; formal analysis, K.W.K., A.Z., M.M., G.R. and M.P.; writing—original draft, K.W.K. and A.Z.; writing—review and editing, K.W.K., M.M. and D.S.-W. All authors have read and agreed to the published version of the manuscript.

Funding

This research received no external funding.

Institutional Review Board Statement

Not applicable.

Informed Consent Statement

Not applicable.

Data Availability Statement

Not applicable.

Conflicts of Interest

The authors declare no conflict of interest.

References

  1. Gazewood, J.D.; Richards, D.R.; Clebak, K. Parkinson disease: An update. Am. Fam. Physician 2013, 87, 267–273. [Google Scholar] [PubMed]
  2. Cerri, S.; Mus, L.; Blandini, F. Parkinson’s Disease in Women and Men: What’s the Difference? J. Parkinson’s Dis. 2019, 9, 501–515. [Google Scholar]
  3. Wirdefeldt, K.; Adami, H.O.; Cole, P.; Trichopoulos, D.; Mandel, J. Epidemiology and etiology of Parkinson’s disease: A review of the evidence. Eur. J. Epidemiol. 2011, 26, 1. [Google Scholar]
  4. Grosset, D.G.; Macphee, G.J.A.; Nairn, M.; Guideline Development Group. Diagnosis and pharmacological management of Parkinson’s disease: Summary of SIGN guidelines. BMJ 2010, 340, b5614. [Google Scholar] [CrossRef] [PubMed]
  5. Gilhus, N.E.; Barnes, M.P.; Brainin, M. European Handbook of Neurological Management; Wiley-Blackwell: Hoboken, NJ, USA, 2011. [Google Scholar]
  6. Pahwa, R.; Factor, S.A.; Lyons, K.E.; Ondo, W.G.; Gronseth, G.; Bronte-Stewart, H.; Hallett, M.; Miyasaki, J.; Stevens, J.; Weiner, W.J. Practice parameter: Treatment of parkinson disease with motor fluctuations and dyskinesia (an evidence-based review): Report of the quality standards subcommittee of the american Academy of Neurology. Neurology 2006, 66, 983–995. [Google Scholar] [CrossRef] [PubMed] [Green Version]
  7. Heijnen, B.J.; Speyer, R.; Baijens, L.W.; Bogaardt, H.C. Neuromuscular electrical stimulation versus traditional therapy in patients with Parkinson’s disease and oropharyngeal dysphagia: Effects on quality of life. Dysphagia 2012, 27, 336–345. [Google Scholar] [CrossRef] [PubMed] [Green Version]
  8. Umemoto, G.; Furuya, H. Management of Dysphagia in Patients with Parkinson’s Disease and Related Disorders. Intern. Med. 2020, 59, 7–14. [Google Scholar] [CrossRef] [Green Version]
  9. Balestrino, R.; Baroncini, D.; Fichera, M.; Donofrio, C.A.; Franzin, A.; Mortini, P.; Comi, G.; Volontè, M. Weight gain after subthalamic nucleus deep brain stimulation in Parkinson’s disease is influenced by dyskinesias’ reduction and electrodes’ position. Neurol. Sci. 2017, 38, 2123–2129. [Google Scholar] [CrossRef]
  10. Yang, T.; Zhan, Z.; Zhang, L.; Zhu, J.; Liu, Y.; Zhang, L.; Ge, J.; Zhao, Y.; Zhang, L.; Dong, J. Prevalence and Risk Factors for Malnutrition in Patients with Parkinson’s Disease. Front. Neurol. 2020, 11, 533731. [Google Scholar] [CrossRef]
  11. Paul, B.S.; Singh, T.; Paul, G.; Jain, D.; Singh, G.; Kaushal, S.; Chhina, R.S. Prevalence of Malnutrition in Parkinson’s Disease and Correlation with Gastrointestinal Symptoms. Ann. Indian Acad. Neurol. 2019, 4, 447–452. [Google Scholar] [CrossRef] [PubMed]
  12. Fereshtehnejad, S.M.; Ghazi, L.; Sadeghi, M.; Khaefpanah, D.; Shahidi, G.A.; Delbari, A.; Lökk, J. Prevalence of malnutrition in patients with Parkinson’s disease: A comparative study with healthy controls using Mini Nutritional Assessment (MNA) questionnaire. J. Parkinson’s Dis. 2014, 4, 473–481. [Google Scholar] [CrossRef] [PubMed]
  13. Wu, Q.; Yu, M.; Fu, J.; Liu, M. Prevalence, risk factors and clinical correlations of underweight in Chinese newly diagnosed and drug-naïve patients with Parkinson’s disease. Neurol. Sci. 2021, 42, 1097–1102. [Google Scholar] [CrossRef] [PubMed]
  14. Peball, M.; Mahlknecht, P.; Werkmann, M.; Marini, K.; Murr, F.; Herzmann, H.; Stockner, H.; de Marzi, R.; Heim, B.; Djamshidian, A.; et al. Prevalence and Associated Factors of Sarcopenia and Frailty in Parkinson’s Disease: A Cross-Sectional Study. Gerontology 2019, 65, 216–228. [Google Scholar] [CrossRef] [PubMed]
  15. Barichella, M.; Cereda, E.; Madio, C.; Iorio, L.; Pusani, C.; Cancello, R.; Caccialanza, R.; Pezzoli, G.; Cassani, E. Nutritional risk and gastrointestinal dysautonomia symptoms in Parkinson’s disease outpatients hospitalised on a scheduled basis. Br. J. Nutr. 2013, 110, 347–353. [Google Scholar] [CrossRef] [PubMed] [Green Version]
  16. Lindskov, S.; Sjöberg, K.; Hagell, P.; Westergren, A. Weight stability in Parkinson’s disease. Nutr. Neurosci. 2016, 19, 11–20. [Google Scholar] [CrossRef] [PubMed]
  17. Fereshtehnejad, S.M.; Hadizadeh, H.; Farhadi, F.; Shahidi, G.A.; Delbari, A.; Lökk, J. Comparison of the Psychological Symptoms and Disease-Specific Quality of Life between Early- and Typical-Onset Parkinson’s Disease Patients. Parkinson’s Dis. 2014, 2014, 819260. [Google Scholar] [CrossRef] [PubMed]
  18. Barichella, M.; Villa, M.C.; Massarotto, A.; Cordara, S.E.; Marczewska, A.; Vairo, A.; Baldo, C.; Mauri, A.; Savardi, C.; Pezzoli, G. Mini Nutritional Assessment in patients with Parkinson’s disease: Correlation between worsening of the malnutrition and increasing number of disease-years. Nutr. Neurosci. 2008, 11, 128–134. [Google Scholar] [CrossRef]
  19. Vikdahl, M.; Domellöf, M.E.; Forsgren, L.; Håglin, L. Olfactory Function, Eating Ability and Visceral Obesity Associated with MMSE Three Years after Parkinson’s Disease Diagnosis. J. Nutr. Health Aging 2015, 19, 894–900. [Google Scholar] [CrossRef]
  20. Yoo, H.S.; Chung, S.J.; Lee, P.H.; Sohn, Y.H.; Kang, S.Y. The Influence of Body Mass Index at Diagnosis on Cognitive Decline in Parkinson’s Disease. J. Clin. Neurol. 2019, 15, 517–526. [Google Scholar] [CrossRef]
  21. Vikdahl, M.; Carlsson, M.; Linder, J.; Forsgren, L.; Håglin, L. Weight gain and increased central obesity in the early phase of Parkinson’s disease. Clin. Nutr. 2014, 33, 1132–1139. [Google Scholar] [CrossRef]
  22. Umay, E.; Yigman, Z.A.; Ozturk, E.A.; Gundogdu, I.; Koçer, B.G. Is Dysphagia in Older Patients with Parkinson’s Disease Associated with Sarcopenia? J. Nutr. Health Aging 2021, 25, 742–747. [Google Scholar] [CrossRef]
  23. Ozdilek, B.; Kenangil, G. Serum leptin concentrations in Turkish Parkinson’s disease population. Parkinson’s Dis. 2014, 2014, 576020. [Google Scholar] [CrossRef] [PubMed]
  24. Tan, Y.J.; Lim, S.Y.; Yong, V.W.; Choo, X.Y.; Ng, Y.D.; Sugumaran, K.; Md Shah, M.N.; Raja Aman, R.R.A.; Paramasivam, S.S.; Mohd Ramli, N.; et al. Osteoporosis in Parkinson’s Disease: Relevance of Distal Radius Dual-Energy X-ray Absorptiometry (DXA) and Sarcopenia. J. Clin. Densitom. 2021, 24, 351–361. [Google Scholar] [CrossRef] [PubMed]
  25. Küsbeci, Ö.Y.; Çolakoğlu, B.D.; İnci, İ.; Duran, E.; Çakmur, R. Sarcopenia in Parkinson’s disease patients. Neurol. Sci. Neurophysiol. 2019, 36, 28–32. [Google Scholar] [CrossRef]
  26. Cereda, E.; Cassani, E.; Barichella, M.; Spadafranca, A.; Caccialanza, R.; Bertoli, S.; Battezzati, A.; Pezzoli, G. Low cardiometabolic risk in Parkinson’s disease is independent of nutritional status, body composition and fat distribution. Clin. Nutr. 2012, 31, 699–704. [Google Scholar] [CrossRef]
  27. Cheshire, W.P., Jr.; Wszolek, Z.K. Body mass index is reduced early in Parkinson’s disease. Parkinsonism Relat. Disord. 2005, 11, 35–38. [Google Scholar] [CrossRef] [PubMed]
  28. Wu, Q.; Liu, M.; Yu, M.; Fu, J. Sex differences in underweight and body mass index in Chinese early de novo patients with Parkinson’s disease. Brain Behav. 2020, 10, e01893. [Google Scholar] [CrossRef] [PubMed]
  29. Jaafar, A.F.; Gray, W.K.; Porter, B.; Turnbull, E.J.; Walker, R.W. A cross-sectional study of the nutritional status of community-dwelling people with idiopathic Parkinson’s disease. BMC Neurol. 2010, 30, 124. [Google Scholar] [CrossRef] [Green Version]
  30. Sheard, J.M.; Ash, S.; Mellick, G.D.; Silburn, P.A.; Kerr, G.K. Markers of disease severity are associated with malnutrition in Parkinson’s disease. PLoS ONE 2013, 8, e57986. [Google Scholar] [CrossRef] [Green Version]
  31. Sheard, J.M.; Ash, S.; Mellick, G.D.; Silburn, P.A.; Kerr, G.K. Malnutrition in a sample of community-dwelling people with Parkinson’s disease. PLoS ONE 2013, 8, e53290. [Google Scholar] [CrossRef] [Green Version]
  32. Albay, V.B.; Tutuncu, M. MNA-SF is not sufficient without questioning protein and fruit-vegetable consumption to detect malnutrition risk in Parkinson’s Disease. Acta Neurol. Belg. 2021, 121, 71–78. [Google Scholar] [CrossRef] [PubMed]
  33. Bazán-Rodríguez, L.; Cruz-Vicioso, R.; Cervantes-Arriaga, A.; Alcocer-Salas, A.; Pinto-Solís, D.; Rodríguez-Violante, M. Malnutrition and Associated Motor and Non-Motor Factors in People with Parkinson’s Disease. Rev. Investig. Clin. 2020, 5, 72. [Google Scholar] [CrossRef]
  34. Pisciotta, M.S.; Fusco, D.; Grande, G.; Brandi, V.; Lo Monaco, M.R.; Laudisio, A.; Onder, G.; Bentivoglio, A.R.; Ricciardi, D.; Bernabei, R.; et al. Untangling the relationship between fat distribution, nutritional status and Parkinson’s disease severity. Aging Clin. Exp. Res. 2020, 32, 77–84. [Google Scholar] [CrossRef] [PubMed] [Green Version]
  35. Tomic, S.; Pekic, V.; Popijac, Z.; Pucic, T.; Vinkovic, M.P.; Kuric, T.G.; Popovic, Z. Hyperhomocysteinemia influenced malnutrition in Parkinson’s disease patients. Neurol. Sci. 2018, 39, 1691–1695. [Google Scholar] [CrossRef] [PubMed]
  36. Tomic, S.; Pekic, V.; Popijac, Z.; Pucic, T.; Petek, M.; Kuric, T.G.; Misevic, S.; Kramaric, R.P. What increases the risk of malnutrition in Parkinson’s disease? J. Neurol. Sci. 2017, 375, 235–238. [Google Scholar] [CrossRef] [PubMed]
  37. Ghazi, L.; Fereshtehnejad, S.M.; Abbasi Fard, S.; Sadeghi, M.; Shahidi, G.A.; Lökk, J. Mini Nutritional Assessment (MNA) is Rather a Reliable and Valid Instrument to Assess Nutritional Status in Iranian Healthy Adults and Elderly with a Chronic Disease. Ecol. Food Nutr. 2015, 54, 342–357. [Google Scholar] [CrossRef]
  38. Fereshtehnejad, S.M.; Ghazi, L.; Shafieesabet, M.; Shahidi, G.A.; Delbari, A.; Lökk, J. Motor, psychiatric and fatigue features associated with nutritional status and its effects on quality of life in Parkinson’s disease patients. PLoS ONE 2014, 9, e91153. [Google Scholar] [CrossRef] [Green Version]
  39. Van Steijn, J.; van Harten, B.; Flapper, E.; Droogsma, E.; van Walderveen, P.; Blaauw, M.; van Asselt, D. The nutritional status of Dutch elderly patients with Parkinson’s disease. J. Nutr. Health Aging 2014, 18, 601–607. [Google Scholar] [CrossRef] [PubMed]
  40. Wang, G.; Wan, Y.; Cheng, Q.; Xiao, Q.; Wang, Y.; Zhang, J.; Ma, J.F.; Wang, X.J.; Zhou, H.Y.; Chen, S.D. Malnutrition and associated factors in Chinese patients with Parkinson’s disease: Results from a pilot investigation. Parkinsonsism Relat. Disord. 2010, 16, 119–123. [Google Scholar] [CrossRef]
  41. Gruber, M.T.; Witte, O.W.; Grosskreutz, J.; Prell, T. Association between malnutrition, clinical parameters and health-related quality of life in elderly hospitalized patients with Parkinson’s disease: A cross-sectional study. PLoS ONE 2020, 15, e0232764. [Google Scholar] [CrossRef]
  42. Lin, T.K.; Chang, Y.Y.; Chen, N.C.; Liou, C.W.; Lan, M.Y.; Chen, Y.F.; Tsai, C.L. Nutritional Status Associated with Molecular Biomarkers, Physiological Indices and Clinical Severity in Parkinson’s Disease Patients. Int. J. Environ. Res. Public Health 2020, 17, 5727. [Google Scholar] [CrossRef] [PubMed]
  43. Bril, A.; Perez-Lloret, S.; Rossi, M.; Fariña, S.; Morisset, P.; Sorrentino, L.; Iglesias, M.; Escobar, A.M.; Vernetti, P.M.; Cerquetti, D.; et al. A multifactorial study on nutritional status, binge eating and physical activity as main factors directly influencing body weight in Parkinson’s disease. NPJ Parkinson’s Dis. 2017, 3, 17. [Google Scholar] [CrossRef] [PubMed]
  44. Fereshtehnejad, S.M.; Shafieesabet, M.; Shahidi, G.A.; Delbari, A.; Lökk, J. Restless legs syndrome in patients with Parkinson’s disease: A comparative study on prevalence, clinical characteristics, quality of life and nutritional status. Acta Neurol. Scand. 2015, 131, 211–218. [Google Scholar] [CrossRef] [PubMed]
  45. Kim, S.R.; Chung, S.J.; Yoo, S.H. Factors contributing to malnutrition in patients with Parkinson’s disease. Int. J. Nurs. Pract. 2016, 22, 129–137. [Google Scholar] [CrossRef] [PubMed]
  46. Wakabayashi, H.; Matsushima, M. Dysphagia Assessed by the 10-Item Eating Assessment Tool Is Associated with Nutritional Status and Activities of Daily Living in Elderly Individuals Requiring Long-Term Care. J. Nutr. Health Aging 2016, 20, 22–27. [Google Scholar] [CrossRef]
  47. Petroni, M.L.; Albani, G.; Bicchiega, V.; Baudo, S.; Vinci, C.; Montesano, A.; Izzo, G.; Bertocco, P.; Mazzotta, S.; Zorzetto, E.; et al. Body composition in advanced-stage Parkinson’s disease. Acta Diabetol. 2003, 40, S187–S190. [Google Scholar] [CrossRef]
  48. Salari, M.; Barzegar, M.; Etemadifar, M.; Mirmosayyeb, O. Serum leptin levels in Iranian patients with Parkinson’s disease. Iran. J. Neurol. 2018, 17, 71–77. [Google Scholar] [PubMed]
  49. Wilczynski, J.; Polrola, P.J. Body composition assessment by bioelectrical impedance analysis among patients treated with L-dopa for Parkinson’s disease. Med. Stud. 2018, 34, 120–126. [Google Scholar] [CrossRef]
  50. Lopez-Botello, C.K.; Estrada-Bellmann, I.; Chavez-Luevanos, B.E.; Castillo-Torres, S.A.; Ancer-Rodriguez, P.R. Nutritional status in patients with Parkinson’s disease at a third-level hospital in Northeastern Mexico. Med. Univ. 2017, 19, 45–49. [Google Scholar] [CrossRef]
  51. Morales-Briceño, H.; Cervantes-Arriaga, A.; Rodríguez-Violante, M.; Calleja-Castillo, J.; Corona, T. Overweight is more prevalent in patients with Parkinson’s disease. Arq. Neuro-Psiquiatr. 2012, 70, 843–846. [Google Scholar] [CrossRef] [PubMed]
  52. Barichella, M.; Marczewska, A.; Vairo, A.; Canesi, M.; Pezzoli, G. Is underweightness still a major problem in Parkinson’s disease patients? Eur. J. Clin. Nutr. 2003, 57, 543–547. [Google Scholar] [CrossRef] [PubMed] [Green Version]
  53. Tan, A.H.; Hew, Y.C.; Lim, S.Y.; Ramli, N.M.; Kamaruzzaman, S.B.; Tan, M.P.; Grossmann, M.; Ang, B.H.; Tan, J.Y.; Manap, M.A.A.A.; et al. Altered body composition, sarcopenia, frailty and their clinico-biological correlates, in Parkinson’s disease. Parkinsonism Relat. Disord. 2018, 56, 58–64. [Google Scholar] [CrossRef] [PubMed]
  54. Yong, V.W.; Tan, Y.J.; Ng, Y.D.; Choo, X.Y.; Sugumaran, K.; Chinna, K.; Md Shah, M.N.; Raja Aman, R.R.A.; Moy, F.M.; Mohd Ramli, N.; et al. Progressive and accelerated weight and body fat loss in Parkinson’s disease: A three-year prospective longitudinal study. Parkinsonism Relat. Disord. 2020, 77, 28–35. [Google Scholar] [CrossRef]
  55. Yazar, T.; Yazar, H.O.; Zayimoğlu, E.; Çankaya, S. Incidence of sarcopenia and dynapenia according to stage in patients with idiopathic Parkinson’s disease. Neurol. Sci. 2018, 39, 1415–1421. [Google Scholar] [CrossRef] [PubMed]
  56. Zilli Canedo Silva, M.; Carol Fritzen, N.; de Oliveira, M.; Paes da Silva, M.; Rasmussen Petterle, R.; Teive, H.A.; de Mesquita Barros Almeida Leite, C.; Rabito, E.I.; Madalozzo Schieferdecker, M.E.; Carvalho, M. Protein intake, nitrogen balance and nutritional status in patients with Parkinson’s disease: Time for a change? Nutr. Hosp. 2015, 31, 2764–2770. [Google Scholar]
  57. Lee, C.Y.; Chen, H.L.; Chen, P.C.; Chen, Y.S.; Chiang, P.L.; Wang, C.K.; Lu, C.H.; Chen, M.H.; Chou, K.H.; Huang, Y.C.; et al. Correlation between Executive Network Integrity and Sarcopenia in Patients with Parkinson’s Disease. Int. J. Environ. Res. Public Health 2019, 16, 4884. [Google Scholar] [CrossRef] [PubMed] [Green Version]
  58. Da Luz, M.C.L.; Bezerra, G.K.A.; Asano, A.G.C.; Chaves de Lemos, M.D.C.; Cabral, P.C. Determinant factors of sarcopenia in individuals with Parkinson’s disease. Neurol. Sci. 2021, 42, 979–985. [Google Scholar] [CrossRef] [PubMed]
  59. Ma, K.; Xiong, N.; Shen, Y.; Han, C.; Liu, L.; Zhang, G.; Wang, L.; Guo, S.; Guo, X.; Xia, Y.; et al. Weight Loss and Malnutrition in Patients with Parkinson’s Disease: Current Knowledge and Future Prospects. Front. Aging Neurosci. 2018, 10, 1. [Google Scholar] [CrossRef] [PubMed]
  60. Xiao, Q.; Chen, S.; Le, W. Hyposmia: A possible biomarker of Parkinson’s disease. Neurosci. Bull. 2014, 30, 134–140. [Google Scholar] [CrossRef] [Green Version]
  61. Capecci, M.; Petrelli, M.; Emanuelli, B.; Millevolte, M.; Nicolai, A.; Provinciali, L.; Ceravolo, M.G. Rest energy expenditure in Parkinson’s disease: Role of disease progression and dopaminergic therapy. Parkinsonism Relat. Disord. 2013, 19, 238–241. [Google Scholar] [CrossRef] [PubMed]
  62. Delikanaki-Skaribas, E.; Trail, M.; Wong, W.W.; Lai, E.C. Daily energy expenditure, physical activity and weight loss in Parkinson’s disease patients. Mov. Disord. 2009, 24, 667–671. [Google Scholar] [CrossRef] [PubMed]
  63. Sampson, T.R.; Debelius, J.W.; Thron, T.; Janssen, S.; Shastri, G.G.; Ilhan, Z.E.; Challis, C.; Schretter, C.E.; Rocha, S.; Gradinaru, V.; et al. Gut Microbiota Regulate Motor Deficits and Neuroinflammation in a Model of Parkinson’s Disease. Cell 2016, 167, 1469–1480. [Google Scholar] [CrossRef] [Green Version]
  64. Sheard, J.M.; Ash, S.; Mellick, G.D.; Silburn, P.A.; Kerr, G.K. Improved nutritional status is related to improved quality of life in Parkinson’s disease. BMC Neurol. 2014, 14, 212. [Google Scholar] [CrossRef] [PubMed]
  65. Reber, E.; Gomes, F.; Vasiloglou, M.F.; Schuetz, P.; Stanga, Z. Nutritional Risk Screening and Assessment. J. Clin. Med. 2019, 8, 1065. [Google Scholar] [CrossRef] [PubMed] [Green Version]
  66. Mziray, M.; Żuralska, R.; Książek, J.; Domagała, P. Malnutrition among the elderly, the methods of assessment, prevention and treatment. Ann. Acad. Med. Sedan. 2016, 46, 95–105. [Google Scholar]
  67. Vallén, C.; Hagell, P.; Westergren, A. Validity and user-friendliness of the minimal eating observation and nutrition form—Version II (MEONF-II) for undernutrition risk screening. Food. Nutr. Res. 2011, 55, 5801. [Google Scholar] [CrossRef] [PubMed] [Green Version]
  68. Zhang, Z.; Pereira, S.L.; Luo, M.; Matheson, E.M. Evaluation of Blood Biomarkers Associated with Risk of Malnutrition in Older Adults: A Systematic Review and Meta-Analysis. Nutrients 2017, 9, 829. [Google Scholar] [CrossRef] [PubMed]
  69. Cederholm, T.; Jensen, G.L.; Correia, M.I.T.D.; Gonzalez, M.C.; Fukushima, R.; Higashiguchi, T.; Baptista, G.; Barazzoni, R.; Blaauw, R.; Coats, A.; et al. GLIM criteria for the diagnosis of malnutrition—A consensus report from the global clinical nutrition community. Clin. Nutr. 2019, 10, 207–217. [Google Scholar]
  70. Burgos, R.; Bretón, I.; Cereda, E.; Desport, J.C.; Dziewas, R.; Genton, L.; Gomes, F.; Jésus, P.; Leischker, A.; Muscaritoli, M.; et al. ESPEN guideline clinical nutrition in neurology. Clin. Nutr. 2018, 37, 354–396. [Google Scholar]
Figure 1. Flowchart.
Nutrients 14 05194 g001
Figure 2. Quality assessment for prevalence studies [10,11,12,13,14].
Nutrients 14 05194 g002
Figure 3. Quality assessment for cohort studies [15,16,17,18,19,20].
Nutrients 14 05194 g003
Figure 4. Quality assessment of case control studies [21,22,23,24,25,26,27,28].
Nutrients 14 05194 g004
Figure 5. Quality assessment of cross-sectional studies [29,30,31,32,33,34,35,36,37,38,39,40,41,42,43,44,45,46,47,48,49,50,51,52,53,54,55,56,57,58].
Nutrients 14 05194 g005
Table 1. Medical Science Heading (MeSH) terms.
PubMed
#1“Parkinson Disease”[MeSH Terms]
#2“Weight Loss”[MeSH Terms] OR “Nutritional Status”[MeSH Terms] OR “Cachexia”[MeSH Terms] OR “Malnutrition”[MeSH Terms] OR “Frailty”[MeSH Terms] OR “Sarcopenia”[MeSH Terms] OR “Muscular Atrophy”[MeSH Terms]
#3“case reports”[Publication Type] OR “comment”[Publication Type] OR “meta analysis”[Publication Type] OR “retracted publication”[Publication Type] OR “retraction of publication”[Publication Type] OR “systematic review”[Publication Type] OR “review”[Publication Type]
(#1 AND #2) NOT #3(“Parkinson Disease”[MeSH Terms] AND (“Weight Loss”[MeSH Terms] OR “Nutritional Status”[MeSH Terms] OR “Cachexia”[MeSH Terms] OR “Malnutrition”[MeSH Terms] OR “Frailty”[MeSH Terms] OR “Sarcopenia”[MeSH Terms] OR “Muscular Atrophy”[MeSH Terms])) NOT (“case reports”[Publication Type] OR “comment”[Publication Type] OR “meta analysis”[Publication Type] OR “retracted publication”[Publication Type] OR “retraction of publication”[Publication Type] OR “systematic review”[Publication Type] OR “review”[Publication Type])
Embase
#1parkinson disease’/exp
#2body weight loss’/exp OR ‘nutritional status’/exp OR ‘cachexia’/exp OR ‘malnutrition’/exp OR ‘frailty’/exp OR ‘sarcopenia’/exp OR ‘muscle atrophy’/exp
#3(2000–2022)/py
#4(‘editorial’/exp OR ‘editorial’ OR ‘review’/exp OR ‘review’ OR ‘letter’/exp OR ‘letter’ OR ‘case report’/exp OR ‘meta analysis’/exp)
(#1 AND #2 AND #3) NOT #4(‘parkinson disease’/exp OR ‘parkinson disease’) AND (‘body weight loss’/exp OR ‘body weight loss’ OR ‘nutritional status’/exp OR ‘nutritional status’ OR ‘cachexia’/exp OR ‘cachexia’ OR ‘malnutrition’/exp OR ‘malnutrition’ OR ‘frailty’/exp OR ‘frailty’ OR ‘sarcopenia’/exp OR ‘sarcopenia’ OR ‘muscle atrophy’/exp OR ‘muscle atrophy’) NOT (‘editorial’/exp OR ‘editorial’ OR ‘review’/exp OR ‘review’ OR ‘letter’/exp OR ‘letter’ OR ‘case report’/exp OR ‘meta analysis’/exp) AND (2000–2022)/py
Cochrane
#1“Parkinson Disease”[MeSH Terms]
#2“Weight Loss”[MeSH Terms] OR “Nutritional Status”[MeSH Terms] OR “Cachexia”[MeSH Terms] OR “Malnutrition”[MeSH Terms] OR “Frailty”[MeSH Terms] OR “Sarcopenia”[MeSH Terms] OR “Muscular Atrophy”[MeSH Terms]
#1 AND #2(“Parkinson Disease”[MeSH Terms] AND (“Weight Loss”[MeSH Terms] OR “Nutritional Status”[MeSH Terms] OR “Cachexia”[MeSH Terms] OR “Malnutrition”[MeSH Terms] OR “Frailty”[MeSH Terms] OR “Sarcopenia”[MeSH Terms] OR “Muscular Atrophy”[MeSH Terms]))
Web of Science
#1TS = (‘parkinson disease’)
#2((((((TS = (‘body weight loss’)) OR TS = (‘nutritional status’)) OR TS = (‘cachexia’)) OR TS = (‘malnutrition’)) OR TS = (‘frailty’)) OR TS = (‘sarcopenia’)) OR TS = (‘muscle atrophy’)
#3PY = (2000–2022)
#4DT = (Review)
(((#1) AND #2) AND #3) NOT #4
Table 2. PICOS structure’s criteria for study inclusion.
PopulationAdults
InterventionScreening tools: MNA, MNA-SF, SGA, PG-SGA, MUST, MEONF-II, SCREEN-II and Body Mass Index
ComparisonNot applicable
OutcomeMalnutrition, risk of malnutrition
Study designCross-sectional, case-control, cohort
Table 3. Group characteristics.
Total Number of Subjects5613
Men n (%)3216 (57.3%)
Women n (%)2296 (40.9%)
Not given100 (1.8%)
Age
Minimum age (yrs)20
Maximum age (yrs)96
Origin
Asia 24
Europe16
North America4
South America3
Africa0
Australia2
Table 4. MUST results.
AuthorSubgroupsParticipants (n)Hoehn & YahrMDS-UPDRS (Total)Age ± SD (min, max)Male n (%)Female n (%)Mean MUST Score ± SD% Risk of Malnutrtion% Malnourished% Normal% Medium Risk% High Risk% Low Risk
Barichella M. et al., 2013 [15] 2082.313.7 (II), 23.2 (III)67.8 ± 9.20 (32.88)141 (67.8)67 (322)0.27 ± 0.5417.2577.8NdNdNd
Jaafar A.F. et al., 2010 [29]North Tyneside822.4930.9674.59 ± 8.87 (50.96)34 (41.5)48 (58.5)NdNdNdNd15.48.176.5
North Northumberland532.636.9675.33 ± 9.25 (53.93)32 (46.3)21 (53.7)NdNdNdNd
Nd—no data; SD—standard deviation; II—part II of MDS-UPDRS; III—part III of MDS-UPDRS.
Table 5. SGA results.
AuthorParticipants (n)Hoehn & YahrMDS-UPDRS (Total)Age ± SD (min, max)—MedianMale n (%)Female n (%)Median SGA Score ± SD% SGA-B% SGA-C% risk of Malnutrition% Malnutrition% Normal
Sheard, J.M. et al., 2013 [30]125NdNd70 ± nd (35, 92)73 (58.4)52 (41.6)3 ± nd150NdNd85
Sheard, J.M. et al., 2013 [31]1252 (median)Nd70 ± nd (35, 92)74 (59.2)51 (40.8)3 ± nd15.20NdNd84.8
Nd—no data; SD—standard deviation.
Table 6. PG-SGA results.
AuthorParticipants (n)Hoehn & YahrMDS-UPDRS (Total)Age ± SD (min, max)—MedianMale n (%)Female n (%)Median PG-SGA Score ± SD% SGA-B% SGA-C% risk of Malnutrition% Malnutrition% Normal
Sheard, J.M. et al., 2013 [31]1252 (median)Nd70 ± nd (35, 92)74 (59.2)51 (40.8)3 ± nd15,20NdNd84,8
Nd—no data; SD—standard deviation.
Table 7. SCREEN-II and MEONF-II.
AuthorSubgroupsParticipants (n)Hoehn & YahrMDS-UPDRS (Total)Age ± SD (min, max)Male n (%)Female n (%)SCREEN-II Score (Median) ± SDMEONF-II Score (Median) ± SD% risk of Malnutrition% Malnutrition% Normal% Moderate Risk% High Risk
Lindskov, S. et al., 2015 [16]SCREEN-II baseline65NdNd68.1 ± 8.1 (48.9)35 (53.8)30 (46.2)46 ± ndNdNdNd8.122.669.4
SCREEN-II follow up46 ± ndNd2175.83.2NdNd
MEONF-II baselineNd0 ± nd31096.9NdNd
MEONF-II follow upNd0 ± nd1.595.4
Nd—no data; SD—standard deviation.
Table 8. Nutritional status of patients using the MNA questionnaire.
Nutritional StatusNumber of PatientsPercentage of Patients
Normal100738%
At risk of malnutrition63423.9%
Malnourished29411.1%
Not given71327%
Table 9. MNA questionnaire results.
AuthorSubgroupsParticipants (n)Hoehn & YahrMDS-UPDRS (Total)Age ± SD (min, max)Male n (%)Female n (%)Mean MNA Score ± SD% Risk of Malnutrition % Malnourished% Normal
Albay V.B. et al., 2020 [32] 752.5Nd66.84 ± 10.1 (nd)42 (56)33 (44)23 ± 3.659NdNd
Yang, T. et al., 2020 [10] 5562.4125.02 (III)68.37 ± 10.47 (36.92)324 (58.3)232 (41.7)19.82 ± 2.183039.230.8
Bazán-Rodríguez, L. et al., 2020 [33]normal nutritional status492.146.264.4 ± 12.3 (nd)35 (71.4)14 (28.6)26.4 ± 1.534.3856.3
abnormal nutritional status382.463.666 ± 13.9 (nd)23 (60.5)15 (39.5)19.8 ± 3.2
Pisciotta, M.S. et al., 2019 [34] 195NdNd73.6 ± 7.2 (nd)124 (64)71 (36)Nd29NdNd
Paul, B. et al., 2019 [11] 75NdNd63 ± 10.5 (30.80)40 (53.3)35 (46.6)Nd45.31242.7
Tomic, S. et al., 2018 [35] 34Nd19.5 (III)71.18 ± 7.2 (56.82)19 (55.9)15 (44.1)22.1 ± 4.2NdNdNd
Tomic, S. et al., 2017 [36] 96219.34 (III)70.22 ± 8.6 (41.86)57 (59.4)39 (40.6)22.14 ± 3.9855.28.336.5
Ghazi, L. et al., 2015 [37] 1432Nd61.44 ± 10.47 (35.91)96 (67.1)47 (32.9)NdNdNdNd
Fereshtehnejad S.M. et al., 2015 [17]Early onset452 (median)34.361.3 ± 10.4 (20.77)28 (62.2)17 (37.8)24.4 ± 4.3NdNdNd
Typical onset952 (median)30.667 (70.5)28 (29.5)25.5 ± 2.8
Fereshtehnejad, S.M. et al., 2014 [38] 1502 (median)31.760.8 ± 10.8 (32.84)103 (68.7)47 (31.3)25.1 ± 3.325.32.172.6
Vikdahl M. et al., 2014 [21] 582 (median)23.5 (III)68.4 ± 8 (nd)36 (62.1)22 (37.9)25.8 ± 2.314086
Fereshtehnejad, S.M. et al., 2014 [12] 1431.98Nd61.44 ± 10.47 (35, nd)96 (67.1)47 (32.9)25.14 ± 3.3718.23.578.3
van Steijn J. et al., 2013 [39] 1022 (median)Nd76.4 ± 6 (65, nd)54 (59.2)48 (48.1)26.5 ± nd20.5277.5
Wang, G. et al., 2010 [40]MNA > 23.51171.79Nd64.74 ± 9.61 (28.83)75 (64.1)42 (35.9)Nd19.661.7178.63
MNA ≤ 23.52.0865.08 ± 8.9 (28.83)
total2 (median)64.81 ± 9.42 (28.83)
Barichella M. et al., 2008 [18]200461NdNd70.5 ± 5.5 (65.87)37 (59.2)24 (40.8)24.9 ± 1.622.9Nd77.1
20073572.5 ± 4.6 (68.86)20 (57.1)15 (42.9)24 ± 2.5NdNdNd
Gruber, M.T. et al., 2020 [41] 923 (median)Nd73.6 ± 6.7 (56.83)52 (56.5)40 (43.5)12 median ± nd39.16.554.3
Lin, T.K. et al. [42] 82NdNd67.4 ± 9.06 (nd)58 (70.7)24 (29.3)24.78 ± 2.2729.27070.73
Bril A. et al., 2017 [43] 1142I 7.8, II 10, III 21.2, IV 5.466.1 ± 9.8 (nd)60 (53)54 (47)24.7 ± 3.828.1764.9
Fereshtehnejad S.M. et al., 2015 [44] 108233.160.9 ± 10.7 (nd)77 (71.3)31 (28.7)25.4 ± 3.7NdNdNd
Kim S.R. et al., 2014 [45] 1022Nd61.2 ± 10.1 (31.81)45 (44.1)57 (55.9)21.4 ± 6.226.525.548
Vikdahl M. et al., 2014 [19] 118235.768.5 ± 9 (nd)67 (56.8)51 (43.2)25.4 ± 2.4NdNdNd
Nd—no data; SD—standard deviation; I—part I of MD-UPDRS; II—part II of MDS-UPDRS; III—part III of MDS-UPDRS; IV—part IV of MDS-UPDRS.
Table 10. Risk of malnutrition in study by Lindskov S. et al., 2015 [16].
AuthorSubgroupsParticipants (n)Hoehn & YahrMDS-UPDRS (Total)Age ± SD (min, max)Male n (%)
Female n (%)
Mean MNA Score ± SD% No Risk of Malnutrition% High Risk of Malnutrition% High Risk of Malnutrition
Lindskov S. et al., 2015 [16]SCREEN-II baseline65NdNd68.1 ± 8.1 (48.9)35 (53.8)30 (46.2)45 ± nd (median)8.122.669.4
SCREEN-II follow up46 ± nd (median)3.22175.8
MEONF-II baseline0 ± nd96.93.10
MEONF-II follow up0 ± nd95.43.11.5
Nd—no data; SD—standard deviation.
Table 11. MNA-SF results.
AuthorSubgroupsParticipants (n)Hoehn & YahrMDS-UPDRS (Total)Age ± SD (min, max)Male n (%)Female n (%)Mean MNA-SF Score ± SD% Risk of Malnutrition% Malnourished% Normal
Albay V.B. et al., 2020 [32] 752.5Nd66.84 ± 10.1 (nd)42 (56)33 (44)11.4 ± 2.0659NdNd
Umay E. et al., 2021 [22] 54NdNd67.25 ± 3.32 (65.80)35 (64.8)19 (35.2)Nd14.85.6Nd
Wakabayashi H. et al., 2016 [46] 18NdNd81.27 ± nd (70.94)3 (16.7)15 (83.3)6.11 ± ndNdNdNd
Nd—no data; SD—standard deviation.
Table 12. BMI results.
AuthorSubgroupsParticipants (n)Hoehn and YahrMDS-UPDRS (Total)Age ± SD (min, max)Male n (%)Female n (%)BMI (kg/m2) ± SD% Risk of Malnutrition% Malnourished% Normal
Barichella M. et al., 2013 [15] 2082.313.7 (II), 23.2 (III)67.8 ± 9.2 (32.88)141 (67.8)67 (32.2)26.8 ± 4.217.2577.8
Jaafar A.F. et al., 2010 [29]North Tyneside822.330.9674.59 ± 8.84 (50.96)34 (41.5)48 (58.5)24.88 ± 4.8NdNdNd
North Northumberland532.4936.9675.33 ± 9.25 (53.93)32 (46.3)21 (53.7)26.49 ± 5.2
Albay V.B. et al., 2020 [32] 752.5Nd66.84 ± 10.1 (nd)42 (56)33 (44)28.6 ± 4.1351Nd41
Yang, T. et al., 2020 [10] 5562.4125.02 (III)68.37 ± 10.47 (36.92)324 (58.3)232 (41.7)23.07 ± 3.333039.230.8
Bazán-Rodríguez, L. et al., 2020 [33]normal nutritional status492.146.264.4 ± 12.3 (nd)35 (71.4)14 (28.6)28.1 ± 4.934.3856.3
abnormal nutritional status382.463.666 ± 13.9 (nd)23 (60.5)15 (39.5)25.8 ± 4.3
Pisciotta, M.S. et al., 2019 [34] 195NdNd73.6 ± 7.2 (nd)124 (64)71 (36)Nd29071
Paul, B. et al., 2019 [11] 75NdNd63 ± 10.5 (30.80)40 (53.3)35 (46.6)Nd45.31242.7
Tomic, S. et al., 2018 [35] 34Nd19.5 (III)71.18 ± 7.2 (56.82)19 (55.9)15 (44.1)28.53 ± 4.9NdNdNd
Tomic, S. et al., 2017 [36] 96219.34 (III)70.22 ± 8.6 (41.86)57 (59.4)39 (40.6)29.5 ± 5.955.28.336.5
Ghazi, L. et al., 2015 [37] 1432Nd61.44 ± 10.47 (35.91)96 (67.1)47 (32.9)25.86 ± 4.3NdNdNd
Fereshtehnejad S.M. et al., 2015 [17]Early onset452 (median)34.361.3 ± 10.4 (20.77)28 (62.2)17 (37.8)NdNdNdNd
Typical onset952 (median)30.667 (70.5)28 (29.5)
Fereshtehnejad, S.M.et al., 2014 [38] 1502 (median)31.760.8 ± 10.8 (32.84)103 (68.7)47 (31.3)25.8 ± 4.225.32.172.6
Vikdahl M. et al., 2014 [21] 582 (median)23.5 (III)68.4 ± 8 (nd)36 (62.1)22 (37.9)26.3 ± 3.814086
Fereshtehnejad, S.M. et al., 2014 [12] 1431.98Nd61.44 ± 10.47 (35, nd)96 (67.1)47 (32.9)25.86 ± 4.318.23.578.3
van Steijn J. et al., 2013 [39] 1022 (median)Nd76.4 ± 6 (65, nd)54 (52.9)48 (48.1)25.2 ± 3.620.5277.5
Wang, G. et al., 2010 [40]MNA > 23.51171.79Nd64.74 ± 9.61 (28.83)75 (64.1)42 (35.9)Nd19.661.7178.63
MNA ≤ 23.52.0865.08 ± 8.9 (28.83)23.54 ± 2.7
total2 (median)64.81 ± 9.42 (28.83)20.06 ± 2.8
Barichella M. et al., 2008 [18]200461NdNd70.5 ± 5.5 (65.87)37 (59.2)24 (40.8)27.1 ± 3.122.9Nd77.1
20073572.5 ± 4.6 (68.86)20 (57.1)15 (42.9)25.9 ± 3.5NdNdNd
Gruber, M.T. et al., 2020 [41] 923 (median)Nd73.6 ± 6.7 (56.83)52 (56.5)40 (43.5)25.7 ± 3.439.16.554.3
Lin, T.K. et al., 2020 [42] 82NdNd67.4 ± 9.06 (nd)58 (70.7)24 (29.3)23.93 ± 3.129.27070.73
Sheard, J.M. et al., 2013 [30] 125NdNd70 ± nd (35.92) (median)73 (58.4)52 (41.6)NdNdNd85
Sheard, J.M. et al., 2013 [31] 1252 (median)Nd70 ± nd (35.92) (median)74 (59.2)51 (40.8)26.1 ± nd (median)NdNd84.8
Bril A et al., 2017 [43] 1142I 7.8, II 10, III 21.2, IV 5.466.1 ± 9.8 (nd)60 (53)54 (47)29.4 ± 4.628.1764.9
Petroni M.L. et al., 2003 [47] 35NdNd69.7 ± 5.8 (nd)20 (57.1)15 (42.9)25.3 ± 4.3NdNdNd
Salari M. et al., 2018 [48] 351.949.159.8 ± 11.4 (36.80)25 (57.1)10 (42.9)24.8 ± 3.4NdNdNd
Ozdilek B. et al., 2014 [23]UPDRS male40Nd27.660.8 ± 9.4 (42.82)28 (70)12 (30)30.17 ± 5.1NdNdNd
UPDRS femaleNd21.9
Wilczynski J. et al., 2018 [49] 32NdNd54.28 ± 12.24 (32.85)6 (18.75)26 (81.25)24.12 ± 3.49NdNdNd
Tan Y.J. et al., 2020 [24] 102I 1%, II 61.4%, III 23.8%, IV 8.9%, V 4%36,168.2 ± 8.8 (41.87)57 (55.9)45 (44.1)23.3 ± 3.7NdNdNd
Küsbeci Ö.Y. et al., 2019 [25]Male100Nd24.54 (III)67.37 ± 8.47 (nd)61 (61)39 (39)27.4 ± 3.58NdNdNd
Female63.35 ± 9.01 (nd)28.89 ± 5.29
Lopez-Botello C.K. et al., 2017 [50]< 60 y.o.15I 27%; II 53%; III 20%Nd63.33 ± 9.4 (nd)7 (47)8 (53)27.42 ± 5.28NdNdNd
> 60 y.o.27.75 ± 6.07
Lindskov S. et al., 2015 [16]BMI baseline65NdNd68.1 ± 8.1 (48.90)35 (53.8)30 (46.2)27.7 ± 4.4NdNdNd
BMI follow up28 ± 4.8
Cereda E. et al., 2012 [26] 80NdNd61.5 ± 10.5 (39.84)42 (52.5)38 (47.5)27.6 ± 5.1NdNdNd
Morales-Briceño H. et al., 2012 [51] 1772.3Nd64.8 ± 12 (nd)100 (56.5)77 (43.5)27.2 ± 4.7NdNdNd
Barichella M. et al., 2003 [52] 364NdNd65.9 ± 8.9 (35.93)184 (50.5)180 (49.5)27.3 ± 4.4NdNdNd
Tan A.H. et al., 2018 [53] 932,3I 11.8, II 14.1, III 32.9, IV 3.466 ± 8.5 (38.84)51 (54.8)42 (45.2)24 ± 0.4NdNdNd
Cheshire W.P. et al., 2004 [27] 100NdNd74 ± 7.3 (59.89)NdNd25.4 ± 4.1NdNdNd
Wu Q. et al., 2020 [13]H&Y underweight2453.2Nd64.5 ± 10.9 (nd)143 (58.4)102 (41.6)22.6 ± 3.4NdNdNd
H&Y not underweight2.4Nd
UPDRS motor underweightNd23.7 (III)
UPDRS motor not underweightNd17.1 (III)
Yoo HS. et al., 2019 [20]Underweight70Nd17.05 (III)66.05 ± 6.79 (nd)39 (55.7)31 (44.3)21.22 ± 1.82NdNdNd
Normal weight17.05 (III)66.05 ± 6.79 (nd)21.22 ± 1.82
Overweight15.73 (III)64.84 ± 6.48 (nd)23.99 ± 0.72
Obese18.48 (III)64.94 ± 8.29 (nd)27.21 ± 2.25
Wu Q. et al., 2020 [28]Male2532.618.9 (III)63.8 ± 10.7 (nd)146 (57.7)107 (42.3)22.2 ± 3.3NdNdNd
Female2.517.2 (III)62 ± 9.9 (nd)23.2 ± 3.5
Yong, V.W. et al., 2020 [54]Baseline77I 1.3%, II 64.5%, III 32.9%, IV 0%, V 1.3%32,965.6 ± 8.9 (38.84)43 (55.8)34 (44.2)24.3 ± 3.9NdNdNd
Follow upI 1.3%, II 52.6%, III 30.3%, IV 9.2%, V 5.3%39.323.1 ± 4
Yazar T. et al., 2018 [55]Male166NdNd72.76 ± 4.42 (nd)83 (50)83 (50)26.41 ± 3.38NdNdNd
Female71.57 ± 5.2 (nd)26.45 ± 4.6
Zilli Canedo Silva M. et al., 2015 [56] 17I 47%, II 47%, III 6%Nd58.9 ± 12.8 (nd)9 (52.9)8 (47.1)26.3 ± nd (median)NdNdNd
Fereshtehnejad S.M. et al., 2015 [44] 108233.160.9 ± 10.7 (nd)77 (71.3)31 (28.7)NdNdNdNd
Lee, C.Y. et al., 2019 [57]No sarcopenia311.628.261.7 ± 10.6 (nd)21 (40.4)31 (59.6)26.1 ± 3.1NdNdNd
Sarcopenia211.642.721.4 ± 3.5
Peball M. et al., 2018 [14]Total1042.5I 12.7, II 17.1, III 38.4, IV 4.173.8 ± 5.2 (nd)64 (61.5)40 (38.5)25.1 ± 3.6NdNdNd
No sarcopenia461.9Nd73.3 ± 5.7 (nd)25 ± 3.3
Sarcopenia582.9Nd74.2 ± 4.8 (nd)25.2 ± 3.9
da Luz, M.C.L. et al., 2020 [58]No sarcopenia77Nd36.565.4 ± 8.9 (nd)45 (58.4)32 (41.6)27.7 ± 4.5NdNdNd
Sarcopenia41.324.8 ± 1.9
Kim S.R. et al., 2014 [45] 1022Nd61,2 ± 10.1 (31.81)45 (44.1)57 (55.9)23.2 ± 3.726.525.548
Umay E. et al., 2021 [22] 54NdNd67.25 ± 3.32 (65.80)35 (64.8)19 (35.2)26.55 ± 3.6914.85.679.6
Vikdahl M. et al., 2014 [19] 118235.768.5 ± 9 (nd)67 (56.8)51 (43.2)26.3 ± 3.9NdNdNd
Wakabayashi H. et al., 2016 [46] 18NdNd81.27 ± nd (70.94)3 (16.7)15 (83.3)17.84 ± ndNdNdNd
Nd—no data; SD—standard deviation; I—part I of MD-UPDRS; II—part II of MDS-UPDRS; III—part III of MDS-UPDRS; IV—part IV of MDS-UPDRS; I%—a percentage of patients at stage I determined by Hoehn & Yahr scale, II%—a percentage of patients at stage II determined by Hoehn & Yahr scale, III%—a percentage of patients at stage III determined by Hoehn & Yahr scale, IV%—a percentage of patients at stage IV determined by Hoehn & Yahr scale.
Publisher’s Note: MDPI stays neutral with regard to jurisdictional claims in published maps and institutional affiliations.

