
Comparison of Three Dietary Assessment Methods to Estimate Meat Intake as Part of a Meat Reduction Intervention among Adults in the UK


Abstract
:1. Introduction
2. Materials and Methods
2.1. Participants
2.2. Dietary Measurements
- Disaggregating the quantity of meat from meat-containing composite products recorded in 7 day food diaries (high investigator/participant burden);
- Counting the frequency of meals containing meat recorded in 7 day food diaries, multiplied by a standard portion size of meat (medium investigator burden, high participant burden);
- Asking participants to retrospectively recall how many times they consumed meat in the preceding 7 days through a questionnaire, multiplied by a standard portion size of meat (low investigator/participant burden).
2.3. Disaggregated Food Diaries
2.4. Frequency Meal Counts from Food Diaries
2.5. Retrospective 7 Day Dietary Recalls
2.6. Statistical Analysis
2.6.1. Baseline Comparisons
2.6.2. Difference in Intervention Effectiveness Analyses
3. Results
3.1. Demographics
3.2. Baseline Comparisons
3.3. Comparison of Intervention Effects
4. Discussion
5. Conclusions
Supplementary Materials
Author Contributions
Funding
Institutional Review Board Statement
Informed Consent Statement
Data Availability Statement
Conflicts of Interest
References
- Ekmekcioglu, C.; Wallner, P.; Kundi, M.; Weisz, U.; Haas, W.; Hutter, H.P. Red meat, diseases, and healthy alternatives: A critical review. Crit. Rev. Food Sci. Nutr. 2018, 58, 247–261. [Google Scholar] [CrossRef] [PubMed]
- Gerber, P.J.; Steinfeld, H.; Henderson, B.; Mottet, A.; Opio, C.; Dijkman, J.; Falcucci, A.; Tempio, G. Tackling Climate Change through Livestock—A Global Assessment of Emissions and Mitigation Opportunities; Food and Agriculture Organization of the United Nations (FAO): Rome, Italy, 2013. [Google Scholar]
- NIHR/MRC. Diet, Anthropometry and Physical Activity (DAPA) Measurement Toolkit. Available online: https://dapa-toolkit.mrc.ac.uk/diet/subjective-methods/24-hour-dietary-recall (accessed on 6 January 2022).
- Naska, A.; Lagiou, A.; Lagiou, P. Dietary assessment methods in epidemiological research: Current state of the art and future prospects. F1000Res. 2017, 6, 926. [Google Scholar] [CrossRef] [PubMed] [Green Version]
- Bates, B.; Collins, D.; Cox, L.; Nicholson, S.; Page, P.; Roberts, C.; Steer, T.; Swan, G. Appendix A Dietary Data Collection and Editing for Year 9 of the NDNS RP. National Diet and Nutrition Survey Years 1 to 9 of the Rolling Programme (2008/2009–2016/2017): Time trend and income analyses; Public Health England: London, UK, 2019. [Google Scholar]
- Bingham, S.A.; Welch, A.A.; McTaggart, A.; Mulligan, A.A.; Runswick, S.A.; Luben, R.; Oakes, S.; Khaw, K.T.; Wareham, N.; Day, N.E. Nutritional methods in the European Prospective Investigation of Cancer in Norfolk. Public Health Nutr. 2001, 4, 847–858. [Google Scholar] [CrossRef] [PubMed]
- Glynn, L.; Emmett, P.; Rogers, I. Food and nutrient intakes of a population sample of 7-year-old children in the south-west of England in 1999/2000—What difference does gender make? J. Hum. Nutr. Diet. 2005, 18, 7–19. [Google Scholar] [CrossRef]
- Price, G.M.; Paul, A.A.; Cole, T.J.; Wadsworth, M.E. Characteristics of the low-energy reporters in a longitudinal national dietary survey. Br. J. Nutr. 1997, 77, 833–851. [Google Scholar] [CrossRef] [Green Version]
- Shim, J.-S.; Oh, K.; Kim, H.C. Dietary assessment methods in epidemiologic studies. Epidemiol. Health 2014, 36, e2014009-e. [Google Scholar] [CrossRef] [PubMed]
- Prynne, C.J.; Wagemakers, J.J.; Stephen, A.M.; Wadsworth, M.E. Meat consumption after disaggregation of meat dishes in a cohort of British adults in 1989 and 1999 in relation to diet quality. Eur. J. Clin. Nutr. 2009, 63, 660–666. [Google Scholar] [CrossRef] [Green Version]
- Bradbury, K.E.; Young, H.J.; Guo, W.; Key, T.J. Dietary assessment in UK Biobank: An evaluation of the performance of the touchscreen dietary questionnaire. J. Nutr. Sci. 2018, 7, e6. [Google Scholar] [CrossRef] [Green Version]
- Timon, C.M.; Blain, R.J.; McNulty, B.; Kehoe, L.; Evans, K.; Walton, J.; Flynn, A.; Gibney, E.R. The Development, Validation, and User Evaluation of Foodbook24: A Web-Based Dietary Assessment Tool Developed for the Irish Adult Population. J. Med. Internet Res. 2017, 19, e158. [Google Scholar] [CrossRef] [PubMed] [Green Version]
- Bianchi, F.; Aveyard, P.; Astbury, N.M.; Cook, B.; Cartwright, E.; Jebb, S.A. Replacing meat with alternative plant-based products (RE-MAPs): Protocol for a randomised controlled trial of a behavioural intervention to reduce meat consumption. BMJ Open 2019, 9, e027016. [Google Scholar] [CrossRef] [PubMed]
- Bianchi, F.; Stewart, C.; Astbury, N.M.; Cook, B.; Aveyard, P.; Jebb, S.A. Replacing meat with alternative plant-based products (RE-MAP): A randomized controlled trial of a multicomponent behavioral intervention to reduce meat consumption. Am. J. Clin. Nutr. 2021, nqab414. [Google Scholar] [CrossRef] [PubMed]
- Stewart, C.; Frie, K.; Piernas, C.; Jebb, S.A. Development and Reliability of the Oxford Meat Frequency Questionnaire. Nutrients 2021, 13, 922. [Google Scholar] [CrossRef] [PubMed]
- Bouvard, V.; Loomis, D.; Guyton, K.Z.; Grosse, Y.; Ghissassi, F.E.; Benbrahim-Tallaa, L.; Guha, N.; Mattock, H.; Straif, K. Carcinogenicity of consumption of red and processed meat. Lancet Oncol. 2015, 16, 1599–1600. [Google Scholar] [CrossRef] [Green Version]
- Bland, M.J.; Altman, D. Statistical methods for assessing agreement between two methods of clinical measurement. Lancet 1986, 327, 307–310. [Google Scholar] [CrossRef]
- Bland, J.M.; Altman, D.G. Measuring agreement in method comparison studies. Stat. Methods Med. Res. 1999, 8, 135–160. [Google Scholar] [CrossRef] [PubMed]
- Freedman, L.S.; Commins, J.M.; Moler, J.E.; Willett, W.; Tinker, L.F.; Subar, A.F.; Spiegelman, D.; Rhodes, D.; Potischman, N.; Neuhouser, M.L.; et al. Pooled results from 5 validation studies of dietary self-report instruments using recovery biomarkers for potassium and sodium intake. Am. J. Epidemiol. 2015, 181, 473–487. [Google Scholar] [CrossRef] [Green Version]
- Andrew, A.H.; Borriello, G.; Fogarty, J. Simplifying mobile phone food diaries. In Proceedings of the 7th International Conference on Pervasive Computing Technologies for Healthcare and Workshops, Venice, Italy, 5–8 May 2013. [Google Scholar]
- Holmes, B.; Dick, K.; Nelson, M. A comparison of four dietary assessment methods in materially deprived households in England. Public Health Nutr. 2008, 11, 444–456. [Google Scholar] [CrossRef] [PubMed] [Green Version]
- Park, Y.; Dodd, K.W.; Kipnis, V.; Thompson, F.E.; Potischman, N.; Schoeller, D.A.; Baer, D.J.; Midthune, D.; Troiano, R.P.; Bowles, H.; et al. Comparison of self-reported dietary intakes from the Automated Self-Administered 24-h recall, 4-d food records, and food-frequency questionnaires against recovery biomarkers. Am. J. Clin. Nutr. 2018, 107, 80–93. [Google Scholar] [CrossRef] [Green Version]
- McNaughton, S.A.; Mishra, G.D.; Bramwell, G.; Paul, A.A.; Wadsworth, M.E. Comparability of dietary patterns assessed by multiple dietary assessment methods: Results from the 1946 British Birth Cohort. Eur. J. Clin. Nutr. 2005, 59, 341–352. [Google Scholar] [CrossRef] [Green Version]
- Ambrosini, G.L.; Hurworth, M.; Giglia, R.; Trapp, G.; Strauss, P. Feasibility of a commercial smartphone application for dietary assessment in epidemiological research and comparison with 24-h dietary recalls. Nutr. J. 2018, 17, 5. [Google Scholar] [CrossRef]
- Teixeira, V.; Voci, S.M.; Mendes-Netto, R.S.; da Silva, D.G. The relative validity of a food record using the smartphone application MyFitnessPal. Nutr. Diet. 2018, 75, 219–225. [Google Scholar] [CrossRef] [PubMed]
- Evenepoel, C.; Clevers, E.; Deroover, L.; Van Loo, W.; Matthys, C.; Verbeke, K. Accuracy of Nutrient Calculations Using the Consumer-Focused Online App MyFitnessPal: Validation Study. J. Med. Internet Res. 2020, 22, e18237.27. [Google Scholar] [CrossRef] [PubMed]
- Office of National Statistics. 2011 Census: Key Statistics and Quick Statistics for Local Authorities in the United Kingdom 2013. Available online: https://www.ons.gov.uk/employmentandlabourmarket/peopleinwork/employmentandemployeetypes/bulletins/keystatisticsandquickstatisticsforlocalauthoritiesintheunitedkingdom/2013-12-04#qualifications (accessed on 15 October 2020).

| Control (N = 57) | Intervention (N = 58) | |
|---|---|---|
| Age in Years | 37 (12) | 33 (10) |
| Gender | ||
| Female | 37 (65%) | 38 (66%) |
| Male | 19 (33%) | 19 (33%) |
| Other/prefer not to say | 1 (2%) | 1 (2%) |
| Ethnic origin | ||
| White | 45 (79%) | 50 (86%) |
| Chinese | 2 (4%) | 4 (7%) |
| Black African/Caribbean | 1 (2%) | 1 (2%) |
| Other/prefer not to say | 9 (16%) | 3 (5%) |
| Highest educational degree | ||
| GCSE or equivalent | 1 (2%) | 4 (7%) |
| A-level or equivalent | 5 (9%) | 7 (12%) |
| BSc or equivalent | 23 (40%) | 28 (48%) |
| Higher degree (MSc, PhD or equivalent) | 28 (49%) | 19 (33%) |
| Disaggregated Food Diaries | Frequency Meal Counts | Dietary Recalls | |||||||
|---|---|---|---|---|---|---|---|---|---|
| Total | Control | Intervention | Total | Control | Intervention | Total | Control | Intervention | |
| Total meat | 132 (75) | 134 (72) | 130 (78) | 102 (37) | 102 (39) | 101 (34) | 98 (53) | 102 (45) | 94 (59) |
| Red and processed meat | 83 (62) | 82 (57) | 84 (66) | 64 (32) | 63 (34) | 64 (31) | 61 (41) | 65 (40) | 57 (42) |
| Unprocessed white meat | 49 (38) | 51 (38) | 46 (37) | 38 (24) | 39 (21) | 37 (25) | 37 (29) | 36 (25) | 37 (32) |
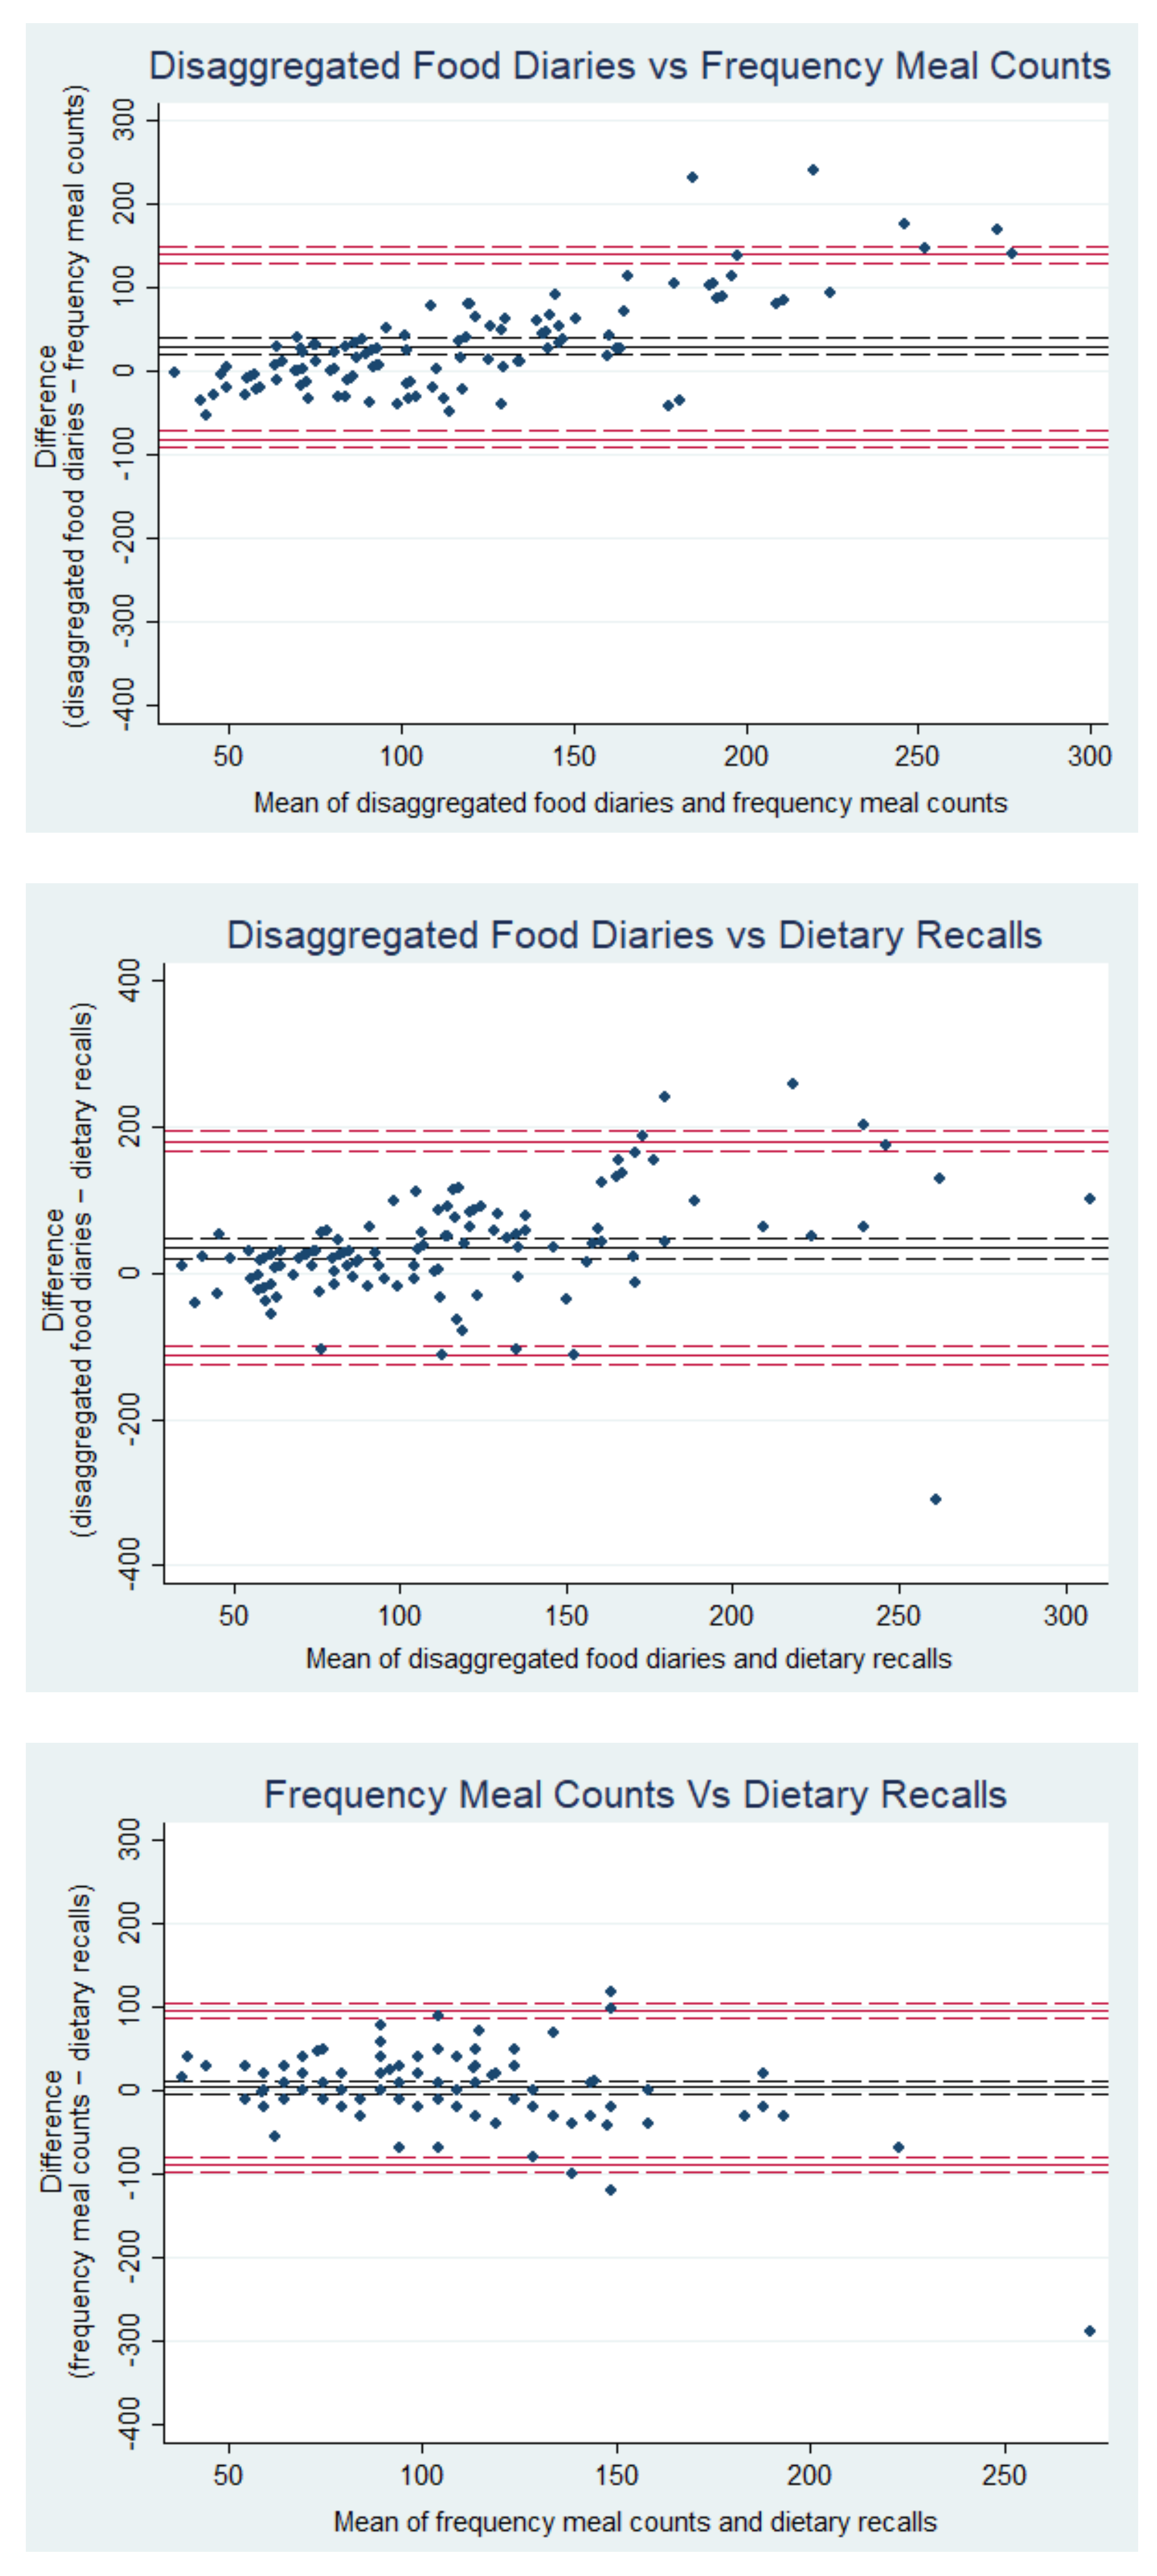
| Mean Difference (bias) in g/day | Regression Coefficient | p-Value | 95% CI | |
|---|---|---|---|---|
| Disaggregated food diaries vs. frequency meal counts | 29.8 | 0.78 | <0.001 | 0.71, 0.86 |
| Disaggregated food diaries vs. dietary recalls | 33.8 | 0.50 | <0.001 | 0.36, 0.63 |
| Frequency meal counts vs. dietary recalls | 4.0 | −0.47 | <0.001 | −0.58, −0.35 |
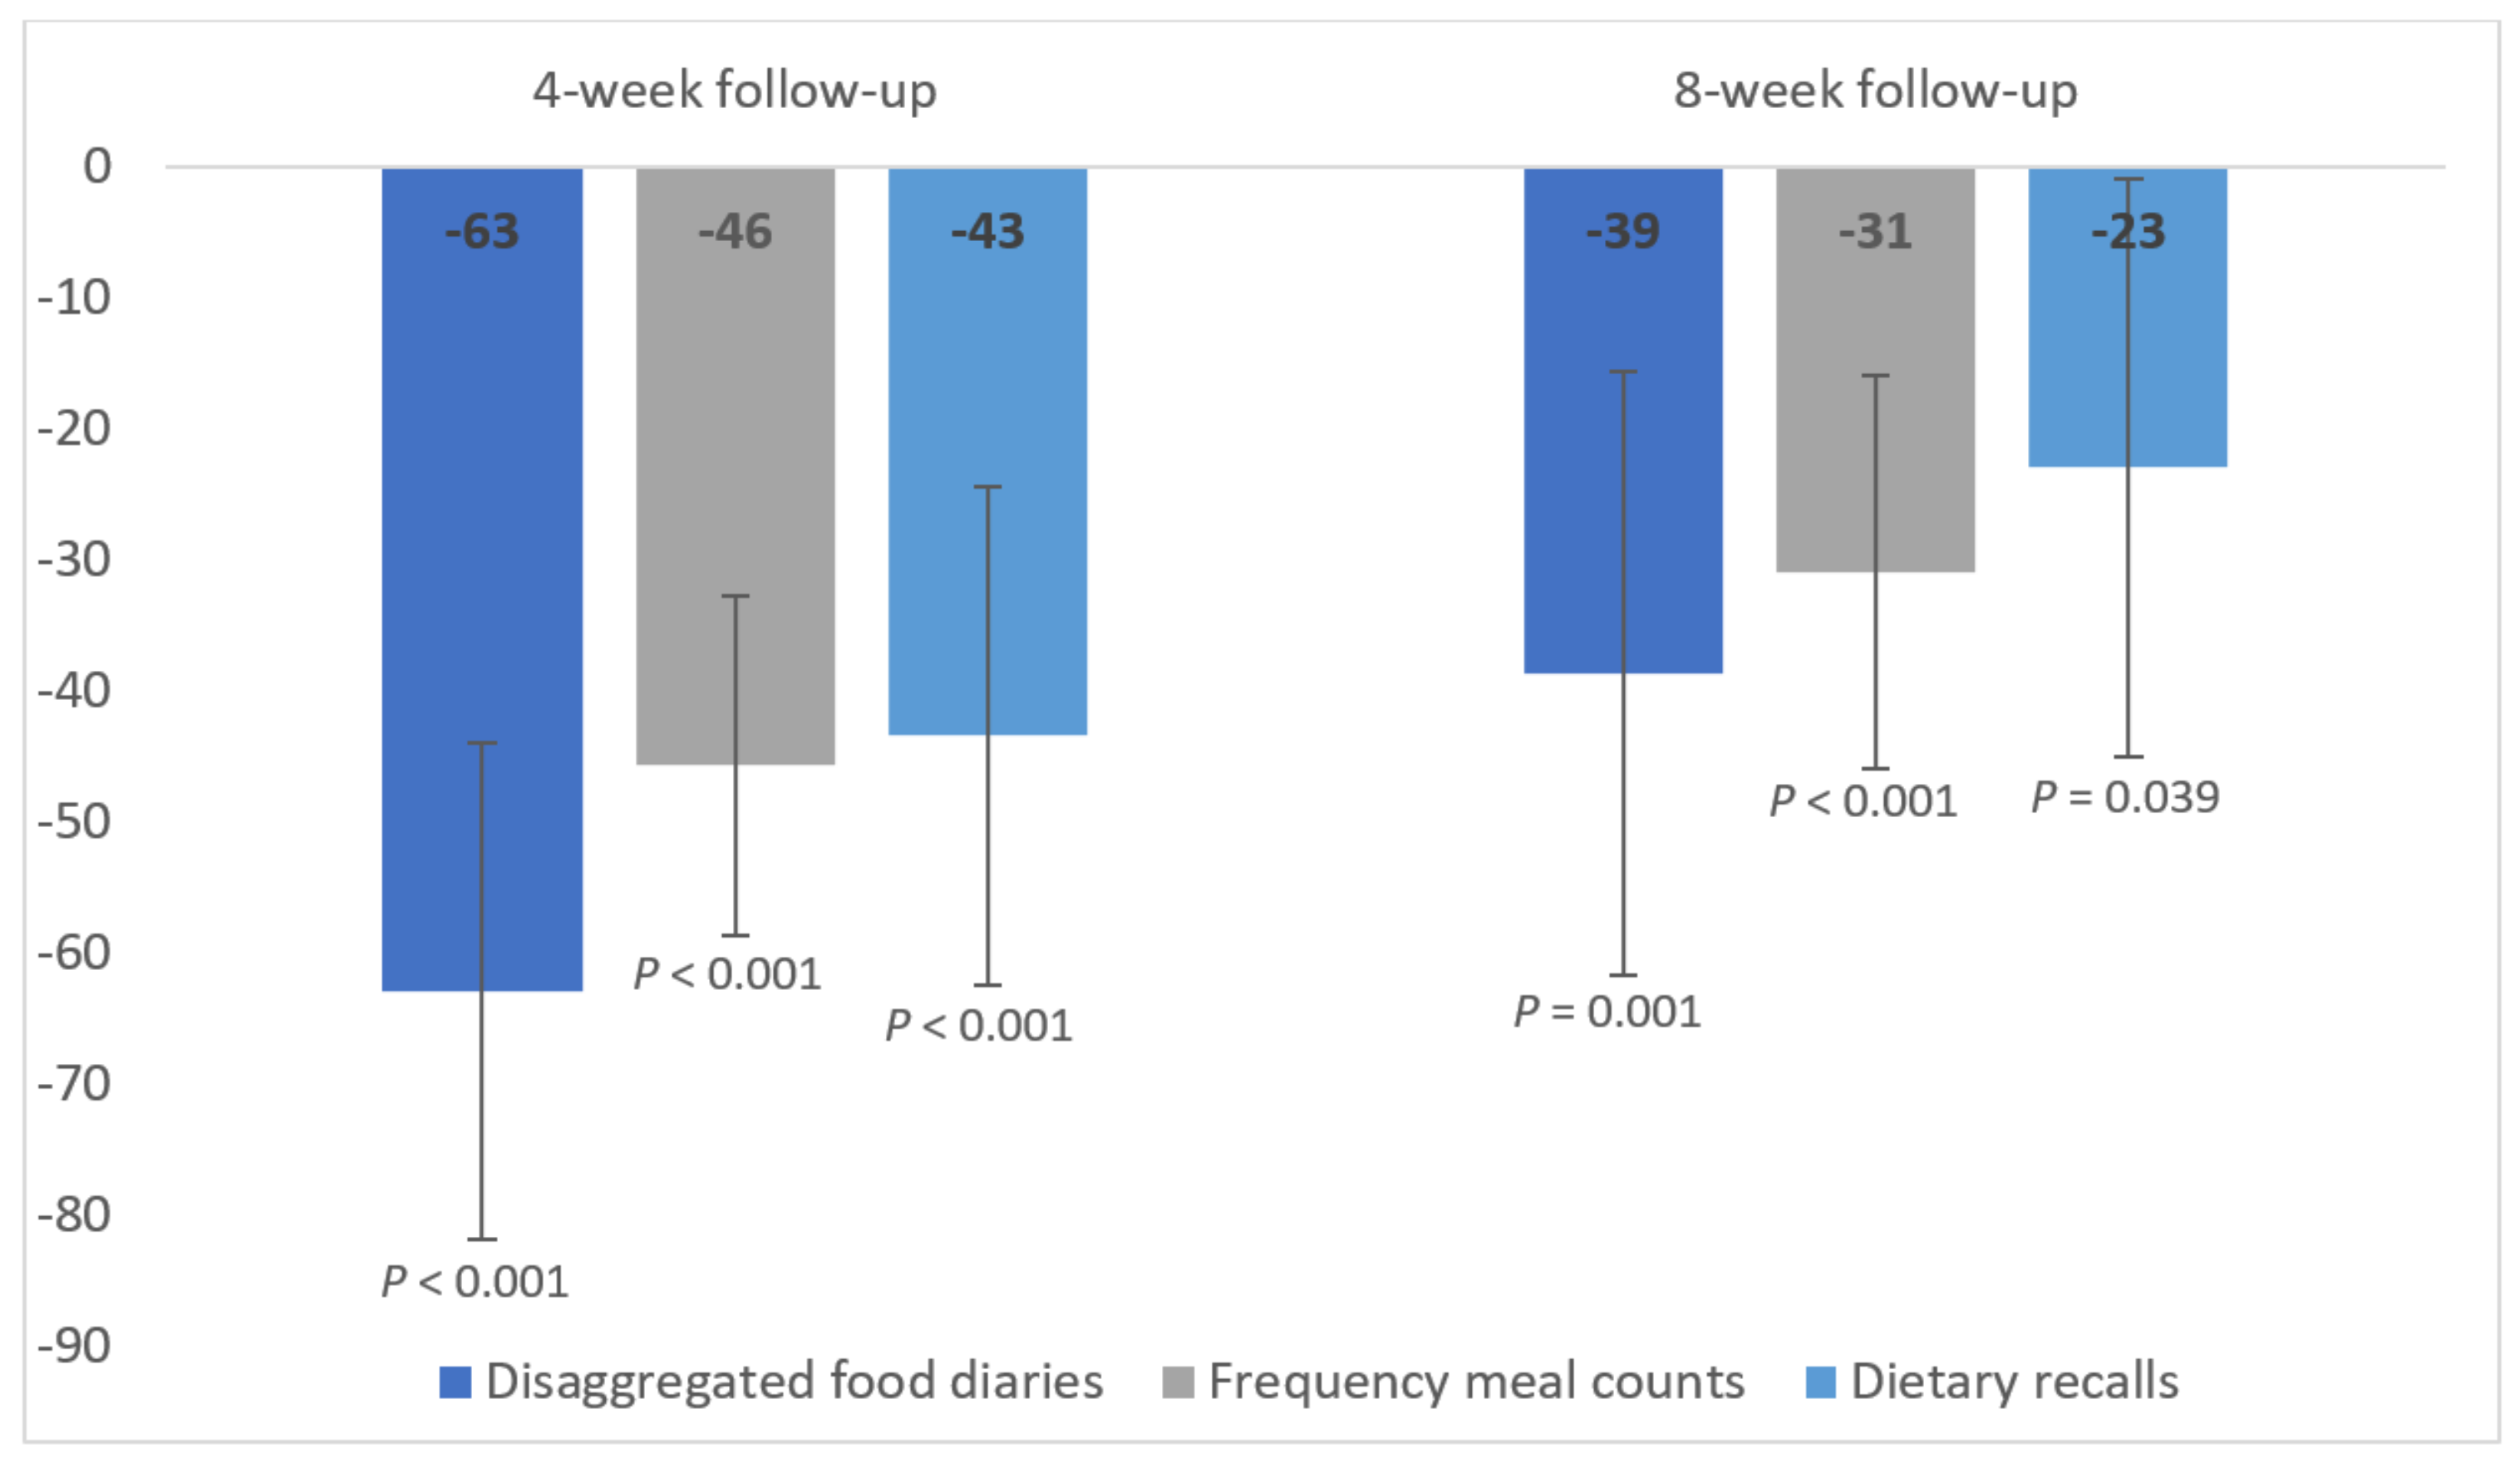
| Control | Intervention | Difference between Groups | ||||
|---|---|---|---|---|---|---|
| Mean | 95% CI | Mean | 95% CI | Mean | 95% CI | |
| Disaggregated food diaries | ||||||
| 4 weeks | 115 | 102, 128 | 52 | 39, 66 | −63 | −82, −44 |
| 8 weeks | 120 | 104, 137 | 82 | 66, 98 | −39 | −62, −16 |
| Frequency meal counts | ||||||
| 4 weeks | 88 | 79, 97 | 43 | 34, 52 | −46 | −58, −33 |
| 8 weeks | 95 | 84, 105 | 64 | 53, 74 | −31 | −46, −16 |
| Dietary recalls | ||||||
| 4 weeks | 86 | 72, 99 | 42 | 29, 56 | −43 | −63, −24 |
| 8 weeks | 91 | 75, 107 | 67 | 51, 83 | −23 | −46, −1 |
Publisher’s Note: MDPI stays neutral with regard to jurisdictional claims in published maps and institutional affiliations. |
© 2022 by the authors. Licensee MDPI, Basel, Switzerland. This article is an open access article distributed under the terms and conditions of the Creative Commons Attribution (CC BY) license (https://creativecommons.org/licenses/by/4.0/).
Share and Cite
Stewart, C.; Bianchi, F.; Frie, K.; Jebb, S.A. Comparison of Three Dietary Assessment Methods to Estimate Meat Intake as Part of a Meat Reduction Intervention among Adults in the UK. Nutrients 2022, 14, 411. https://doi.org/10.3390/nu14030411
Stewart C, Bianchi F, Frie K, Jebb SA. Comparison of Three Dietary Assessment Methods to Estimate Meat Intake as Part of a Meat Reduction Intervention among Adults in the UK. Nutrients. 2022; 14(3):411. https://doi.org/10.3390/nu14030411
Chicago/Turabian StyleStewart, Cristina, Filippo Bianchi, Kerstin Frie, and Susan A. Jebb. 2022. "Comparison of Three Dietary Assessment Methods to Estimate Meat Intake as Part of a Meat Reduction Intervention among Adults in the UK" Nutrients 14, no. 3: 411. https://doi.org/10.3390/nu14030411
APA StyleStewart, C., Bianchi, F., Frie, K., & Jebb, S. A. (2022). Comparison of Three Dietary Assessment Methods to Estimate Meat Intake as Part of a Meat Reduction Intervention among Adults in the UK. Nutrients, 14(3), 411. https://doi.org/10.3390/nu14030411