
COVID-19 Mortality in Europe, by Latitude and Obesity Status: A Geo-Spatial Analysis in 40 Countries

 , , , ,
  and
and
Abstract
:1. Introduction
2. Materials and Methods
2.1. Epidemiological Data Sources
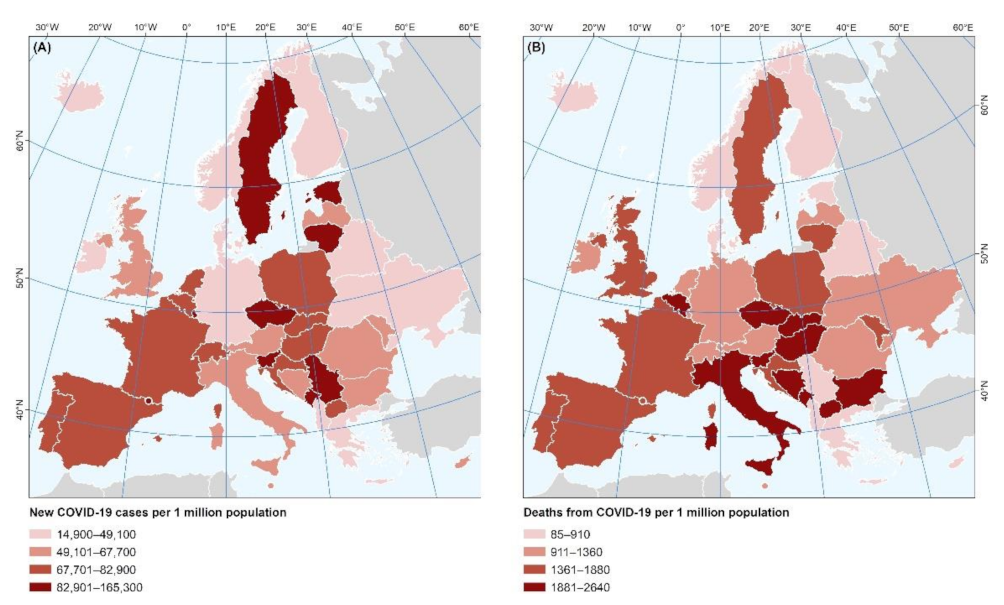
2.1.1. Incidence, and Fatality of COVID-19 in Europe
2.1.2. Prevalence of Overweight/Obesity in Europe
2.1.3. Government Response to the COVID-19 Pandemic, Stringency Index
2.2. Spatial Data
Latitude
2.3. Statistical Analysis
3. Results
4. Discussion
Limitations
5. Conclusions
Author Contributions
Funding
Institutional Review Board Statement
Informed Consent Statement
Data Availability Statement
Conflicts of Interest
References
- WHO Announces COVID-19 Outbreak a Pandemic. 2020. Available online: http://www.euro.who.int/en/health-topics/health-emergencies/coronavirus-covid-19/news/news/2020/3/who-announces-covid-19-outbreak-a-pandemic (accessed on 11 April 2020).
- Statement on the Second Meeting of the International Health Regulations (2005) Emergency Committee Regarding the Outbreak of Novel Coronavirus (2019-nCoV). Available online: https://www.who.int/news-room/detail/30-01-2020-statement-on-the-second-meeting-of-the-international-health-regulations-(2005)-emergency-committee-regarding-the-outbreak-of-novel-coronavirus-(2019-ncov) (accessed on 21 June 2020).
- Novel Coronavirus (2019-nCoV) Situation Reports. Available online: https://www.who.int/emergencies/diseases/novel-coronavirus-2019/situation-reports (accessed on 11 April 2020).
- Coronavirus: Newspaper Round-Up after COVID-19 Epicentre Shifts to Europe|Euronews. Available online: https://www.euronews.com/2020/03/20/coronavirus-newspaper-round-up-after-covid-19-epicentre-shifts-to-europe (accessed on 11 April 2020).
- Holshue, M.L.; DeBolt, C.; Lindquist, S.; Lofy, K.H.; Wiesman, J.; Bruce, H.; Spitters, C.; Ericson, K.; Wilkerson, S.; Tural, A.; et al. First Case of 2019 Novel Coronavirus in the United States. N. Engl. J. Med. 2020, 382, 929–936. [Google Scholar] [CrossRef]
- Tyrovolas, S.; Giné-Vázquez, I.; Fernández, D.; Morena, M.; Koyanagi, A.; Janko, M.; Haro, J.M.; Lin, Y.; Lee, P.; Pan, W.; et al. Estimating the COVID-19 spread through real-time population mobility patterns: Surveillance in Low- and Middle- income countries. J. Med. Internet Res. 2021, 23, e22999. [Google Scholar] [CrossRef] [PubMed]
- Fernández, D.; Giné-Vázquez, I.; Liu, I.; Yucel, R.; Nai Ruscone, M.; Morena, M.; García, V.G.; Haro, J.M.; Pan, W.; Tyrovolas, S. Are environmental pollution and biodiversity levels associated to the spread and mortality of COVID-19? A four-month global analysis. Environ. Pollut. 2021, 271, 116326. [Google Scholar] [CrossRef]
- Dye, C.; Cheng, R.C.H.; Dagpunar, J.S.; Williams, B.G. The scale and dynamics of COVID-19 epidemics across Europe. R. Soc. Open Sci. 2020, 7, 201726. [Google Scholar] [CrossRef]
- Tian, T.; Zhang, J.; Hu, L.; Jiang, Y.; Duan, C.; Li, Z.; Wang, X.; Zhang, H. Risk factors associated with mortality of COVID-19 in 3125 counties of the United States. Infect. Dis. Poverty 2021, 10, 3. [Google Scholar] [CrossRef]
- Jin, J.; Agarwala, N.; Kundu, P.; Harvey, B.; Zhang, Y.; Wallace, E.; Chatterjee, N. Individual and community-level risk for COVID-19 mortality in the United States. Nat. Med. 2021, 27, 264–269. [Google Scholar] [CrossRef]
- Kass, D.A.; Duggal, P.; Cingolani, O. Obesity could shift severe COVID-19 disease to younger ages. Lancet 2020, 395, 1544–1545. [Google Scholar] [CrossRef]
- Muniyappa, R.; Gubbi, S. COVID-19 pandemic, coronaviruses, and diabetes mellitus. Am. J. Physiol. Endocrinol. Metab. 2020, 318, E736–E741. [Google Scholar] [CrossRef] [PubMed] [Green Version]
- Chowdhury, A.I.; Alam, M.R.; Rabbi, M.F.; Rahman, T.; Reza, S. Does higher Body Mass Index increase COVID-19 severity? A systematic review and meta-analysis. Obes. Med. 2021, 23, 100340. [Google Scholar] [CrossRef] [PubMed]
- Zhang, J.-J.; Dong, X.; Cao, Y.-Y.; Yuan, Y.-D.; Yang, Y.-B.; Yan, Y.-Q.; Akdis, C.A.; Gao, Y.-D. Clinical characteristics of 140 patients infected with SARS-CoV-2 in Wuhan, China. Allergy 2020, 75, 1730–1741. [Google Scholar] [CrossRef]
- McCarthy, C.; O’Donnell, C.P.; Kelly, N.E.W.; O’Shea, D.; Hogan, A.E. COVID-19 severity and obesity: Are MAIT cells a factor? Lancet Respir. Med. 2021, 9, 445–447. [Google Scholar] [CrossRef]
- Aranow, C. Vitamin D and the Immune System. J. Investig. Med. Off. Publ. Am. Fed. Clin. Res. 2011, 59, 881–886. [Google Scholar] [CrossRef] [Green Version]
- Teshome, A.; Adane, A.; Girma, B.; Mekonnen, Z.A. The Impact of Vitamin D Level on COVID-19 Infection: Systematic Review and Meta-Analysis. Front. Public Health 2021, 9, 624559. [Google Scholar] [CrossRef]
- Liu, N.; Sun, J.; Wang, X.; Zhang, T.; Zhao, M.; Li, H. Low vitamin D status is associated with coronavirus disease 2019 outcomes: A systematic review and meta-analysis. Int. J. Infect. Dis. 2021, 104, 58–64. [Google Scholar] [CrossRef] [PubMed]
- Meltzer, D.O.; Best, T.J.; Zhang, H.; Vokes, T.; Arora, V.; Solway, J. Association of Vitamin D Status and Other Clinical Characteristics with COVID-19 Test Results. JAMA Netw. Open 2020, 3, e2019722. [Google Scholar] [CrossRef]
- Simonnet, A.; Chetboun, M.; Poissy, J.; Raverdy, V.; Noulette, J.; Duhamel, A.; Labreuche, J.; Mathieu, D.; Pattou, F.; Jourdain, M.; et al. High Prevalence of Obesity in Severe Acute Respiratory Syndrome Coronavirus-2 (SARS-CoV-2) Requiring Invasive Mechanical Ventilation. Obesity 2020, 28, 1195–1199. [Google Scholar] [CrossRef] [PubMed]
- Our World in Data. Available online: https://ourworldindata.org/ (accessed on 21 May 2021).
- Hotamisligil, G.S. Inflammation and metabolic disorders. Nature 2006, 444, 860–867. [Google Scholar] [CrossRef]
- Tay, M.Z.; Poh, C.M.; Rénia, L.; MacAry, P.A.; Ng, L.F.P. The trinity of COVID-19: Immunity, inflammation and intervention. Nat. Rev. Immunol. 2020, 20, 363–374. [Google Scholar] [CrossRef]
- O’Shea, D.; Hogan, A.E. Dysregulation of Natural Killer Cells in Obesity. Cancers 2019, 11, 573. [Google Scholar] [CrossRef] [PubMed] [Green Version]
- Kara, M.; Ekiz, T.; Ricci, V.; Kara, Ö.; Chang, K.-V.; Özçakar, L. “Scientific Strabismus” or two related pandemics: Coronavirus disease and vitamin D deficiency. Br. J. Nutr. 2020, 124, 736–741. [Google Scholar] [CrossRef] [PubMed]
- O’Sullivan, F.; Laird, E.; Kelly, D.; van Geffen, J.; van Weele, M.; McNulty, H.; Hoey, L.; Healy, M.; McCarroll, K.; Cunningham, C.; et al. Ambient UVB Dose and Sun Enjoyment Are Important Predictors of Vitamin D Status in an Older Population. J. Nutr. 2017, 147, 858–868. [Google Scholar] [CrossRef] [Green Version]
- Mendes, M.M.; Hart, K.H.; Lanham-New, S.A.; Botelho, P.B. Exploring the Impact of Individual UVB Radiation Levels on Serum 25-Hydroxyvitamin D in Women Living in High Versus Low Latitudes: A Cross-Sectional Analysis from the D-SOL Study. Nutrients 2020, 12, 3805. [Google Scholar] [CrossRef]
- Chen, J.; Mei, K.; Xie, L.; Yuan, P.; Ma, J.; Yu, P.; Zhu, W.; Zheng, C.; Liu, X. Low vitamin D levels do not aggravate COVID-19 risk or death, and vitamin D supplementation does not improve outcomes in hospitalized patients with COVID-19: A meta-analysis and GRADE assessment of cohort studies and RCTs. Nutr. J. 2021, 20, 89. [Google Scholar] [CrossRef]
- Akbar, M.R.; Wibowo, A.; Pranata, R.; Setiabudiawan, B. Low Serum 25-hydroxyvitamin D (Vitamin D) Level Is Associated with Susceptibility to COVID-19, Severity, and Mortality: A Systematic Review and Meta-Analysis. Front. Nutr. 2021, 8, 660420. [Google Scholar] [CrossRef] [PubMed]
- Hastie, C.E.; Mackay, D.F.; Ho, F.; Celis-Morales, C.A.; Katikireddi, S.V.; Niedzwiedz, C.L.; Jani, B.D.; Welsh, P.; Mair, F.S.; Gray, S.R.; et al. Vitamin D concentrations and COVID-19 infection in UK Biobank. Diabetes Metab. Syndr. 2020, 14, 561–565. [Google Scholar] [CrossRef] [PubMed]
- Walrand, S. Autumn COVID-19 surge dates in Europe correlated to latitudes, not to temperature-humidity, pointing to vitamin D as contributing factor. Sci. Rep. 2021, 11, 1981. [Google Scholar] [CrossRef] [PubMed]
- Grant, W.B.; Lahore, H.; McDonnell, S.L.; Baggerly, C.A.; French, C.B.; Aliano, J.L.; Bhattoa, H.P. Evidence that Vitamin D Supplementation Could Reduce Risk of Influenza and COVID-19 Infections and Deaths. Nutrients 2020, 12, 988. [Google Scholar] [CrossRef] [PubMed] [Green Version]
- Beard, J.A.; Bearden, A.; Striker, R. Vitamin D and the anti-viral state. J. Clin. Virol. 2011, 50, 194–200. [Google Scholar] [CrossRef]
- Eurostat. European Health Interview Survey—Almost 1 Adult in 6 in the EU Is Considered Obese—Share of Obesity Increases with Age and Decreases with Education Level; Eurostat News Release, 20 October 2016; Eurostat: Luxembourg, 2016. [Google Scholar]
- Walsh, J.S.; Bowles, S.; Evans, A.L. Vitamin D in obesity. Curr. Opin. Endocrinol. Diabetes Obes. 2017, 24, 389–394. [Google Scholar] [CrossRef]
- Woolf, S.H.; Chapman, D.A.; Sabo, R.T.; Weinberger, D.M.; Hill, L.; Taylor, D.D.H. Excess Deaths From COVID-19 and Other Causes, March–July 2020. JAMA 2020, 324, 1562. [Google Scholar] [CrossRef]
- Woolf, S.H.; Chapman, D.A.; Lee, J.H. COVID-19 as the Leading Cause of Death in the United States. JAMA 2020, 325, 123–124. [Google Scholar] [CrossRef] [PubMed]

| Indicators of Stringency Index | Scoring-Description |
|---|---|
| School closures | 0—No measures, 1—recommend closing, 2—Require closing (only some levels or categories, e.g., just high school, or just public schools), 3—Require closing all levels |
| Workplace closures | 0—No measures, 1—recommend closing (or work from home), 2—require closing (or work from home) for some sectors or categories of workers, 3—require closing (or work from home) all but essential workplaces (eg grocery stores, doctors) |
| Cancel public events | 0- No measures, 1—Recommend cancelling, 2—Require cancelling |
| Restrictions on gatherings | 0—No restrictions, 1—Restrictions on very large gatherings (the limit is above 1000 people), 2—Restrictions on gatherings between 100–1000 people, 3—Restrictions on gatherings between 10–100 people, 4—Restrictions on gatherings of less than 10 people, |
| Close public transport | 0—No measures, 1—Recommend closing (or significantly reduce volume/route/means of transport available), 2—Require closing (or prohibit most citizens from using it) |
| Public information campaigns | 0—No COVID-19 public information campaign, 1—public officials urging caution about COVID-19, 2—coordinated public information campaign (e.g., across traditional and social media) |
| Stay at home | 0—No measures, 1—recommend not leaving house, 2—require not leaving house with exceptions for daily exercise, grocery shopping, and ‘essential’ trips, 3—Require not leaving house with minimal exceptions (e.g., allowed to leave only once every few days, or only one person can leave at a time, etc.) |
| Restrictions on internal movement | 0—No measures, 1—Recommend movement restriction, 2—Restrict movement, |
| International travel controls | 0—No measures, 1—Screening, 2—Quarantine arrivals from high-risk regions, 3—Ban on high-risk regions, 4—Total border closure |
| Testing policy | 0—No testing policy, 1—Only those who both (a) have symptoms AND (b) meet specific criteria (e.g., key workers, admitted to hospital, came into contact with a known case, returned from overseas), 2—testing of anyone showing COVID-19 symptoms, 3—open public testing (e.g., “drive through” testing available to asymptomatic people) |
| Contract tracing | 0—No contact tracing, 1—Limited contact tracing—not done for all cases, 2—Comprehensive contact tracing—done for all cases |
| Face coverings | 0—No policy, 1—Recommended, 2—Required in some specified shared/public spaces outside the home with other people present, or some situations when social distancing not possible, 3—Required in all shared/public spaces outside the home with other people present or all situations when social distancing not possible, 4—Required outside the home at all times regardless of location or presence of other people |
| Vaccination policy | 0—No availability, 1—Availability for ONE of following: key workers/clinically vulnerable groups/elderly groups, 2—Availability for TWO of following: key workers/clinically vulnerable groups/elderly groups, 3—Availability for ALL of following: key workers/clinically vulnerable groups/elderly groups, 4—Availability for all three plus partial additional availability (select broad groups/ages), 5—Universal availability |
| IRR (95% CI) | Incidence of COVID-19 per 1 Million Population | Fatality of COVID-19 per 1 Million Population | Adjusted for: | |||
|---|---|---|---|---|---|---|
| Whole Time Period (1 January 2020–17 April 2021) | Time Period of Interest (1 November 2020–31 March 2021) | Whole Time Period (1 January 2020–17 April 2021) | Time Period of Interest (1 November 2020–31 March 2021) | |||
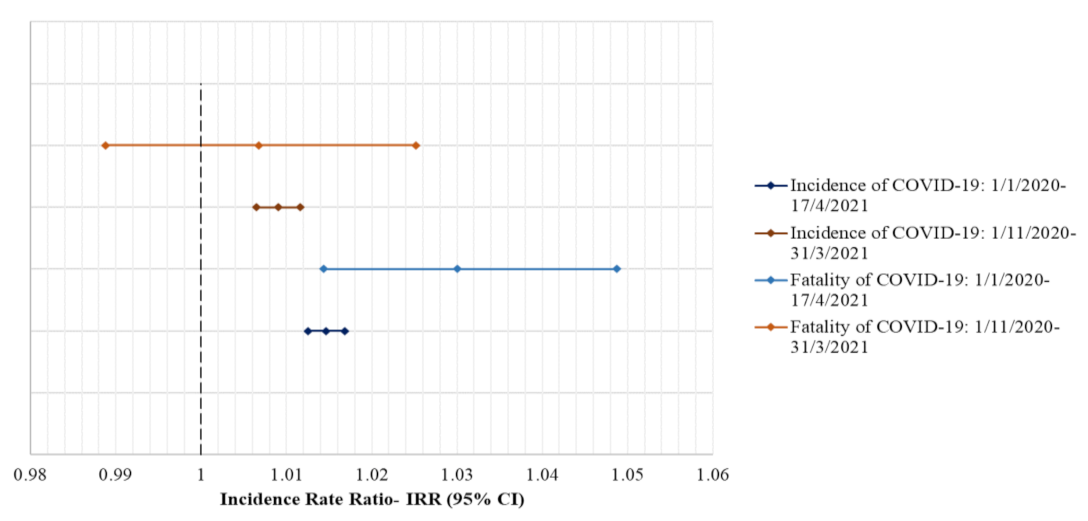
| Total sample | Model 1 | 1.01275 (1.01271, 1.01279) | 1.01194 (1.01189, 1.01199) | 1.0091 (1.0088, 1.0094) | 1.01202 (1.01169, 1.01235) | Univariable |
| Model 2 | 1.07037 (1.07032, 1.07056) | 1.07581 (1.07560, 1.07592) | 1.08664 (1.08618, 1.08699) | 1.09222 (1.09148, 1.09289) | Median population’s age, Stringency index, Population density, GDP per capita | |
| Overweight/Obesity ≤ 62.3% | Model 1 | 1.00212 (1.00206, 1.00218) | 1.00194 (1.00188, 1.00201) | 1.00498 (1.00461, 1.00534) | 1.00243 (1.00199, 1.00288) | Univariable |
| Model 2 | 1.02637 (1.02616, 1.02648) | 1.03833 (1.03811, 1.03848) | 1.04060 (1.04001, 1.04122) | 1.05597 (1.05519, 1.05733) | Median population’s age, Stringency index, Population density, GDP per capita | |
| Overweight/Obesity > 62.3% | Model 1 | 1.05132 (1.05126, 1.05139) | 1.04314 (1.04306, 1.04323) | 1.05303 (1.05255, 1.05352) | 1.04673 (1.04615, 1.04731) | Univariable |
| Model 2 | 1.18022 (1.17975, 1.18048) | 1.16453 (1.16422, 1.16488) | 1.19495 (1.19371, 1.19623) | 1.17938 (1.17768, 1.18232) | Median population’s age, Stringency index, Population density, GDP per capita | |
Publisher’s Note: MDPI stays neutral with regard to jurisdictional claims in published maps and institutional affiliations. |
© 2022 by the authors. Licensee MDPI, Basel, Switzerland. This article is an open access article distributed under the terms and conditions of the Creative Commons Attribution (CC BY) license (https://creativecommons.org/licenses/by/4.0/).
Share and Cite
Tyrovolas, S.; Tsiampalis, T.; Morena, M.; Leung, A.Y.M.; Faka, A.; Chalkias, C.; Tsiodras, S.; Panagiotakos, D. COVID-19 Mortality in Europe, by Latitude and Obesity Status: A Geo-Spatial Analysis in 40 Countries. Nutrients 2022, 14, 471. https://doi.org/10.3390/nu14030471
Tyrovolas S, Tsiampalis T, Morena M, Leung AYM, Faka A, Chalkias C, Tsiodras S, Panagiotakos D. COVID-19 Mortality in Europe, by Latitude and Obesity Status: A Geo-Spatial Analysis in 40 Countries. Nutrients. 2022; 14(3):471. https://doi.org/10.3390/nu14030471
Chicago/Turabian StyleTyrovolas, Stefanos, Thomas Tsiampalis, Marianthi Morena, Angela Y. M. Leung, Antigoni Faka, Christos Chalkias, Sotirios Tsiodras, and Dimosthenes Panagiotakos. 2022. "COVID-19 Mortality in Europe, by Latitude and Obesity Status: A Geo-Spatial Analysis in 40 Countries" Nutrients 14, no. 3: 471. https://doi.org/10.3390/nu14030471