
Effects of Isocaloric Fructose Restriction on Ceramide Levels in Children with Obesity and Cardiometabolic Risk: Relation to Hepatic De Novo Lipogenesis and Insulin Sensitivity

 , and
, and
Abstract
:1. Introduction
2. Materials and Methods
3. Results
4. Discussion
5. Conclusions
Supplementary Materials
Author Contributions
Funding
Institutional Review Board Statement
Informed Consent Statement
Data Availability Statement
Acknowledgments
Conflicts of Interest
References
- Virani, S.S.; Alonso, A.; Aparicio, H.J.; Benjamin, E.J.; Bittencourt, M.S.; Callaway, C.W.; Carson, A.P.; Chamberlain, A.M.; Cheng, S.; Delling, F.N.; et al. Heart disease and stroke statistics—2021 update: A report from the American Heart Association. Circulation 2021, 143, e254–e743. [Google Scholar] [CrossRef] [PubMed]
- Camhi, S.M.; Katzmarzyk, P.T. Tracking of cardiometabolic risk factor clustering from childhood to adulthood. Int. J. Obes. 2010, 5, 122–129. [Google Scholar] [CrossRef] [PubMed]
- New Research Uncovers Concerning Increases in Youth Living with Diabetes in the U.S. cdc.gov. Published 24 August 2021. Available online: https://www.cdc.gov/media/releases/2021/p0824-youth-diabetes.html (accessed on 21 December 2021).
- Curtin, S.C. Trends in Cancer and Heart Disease Death Rates Among Adults Aged 45–64: United States, 1999–2017. Natl. Vital-Stat. Rep. 2019, 68, 1–9. [Google Scholar] [PubMed]
- Meikle, P.J.; Summers, S.A. Sphingolipids and phospholipids in insulin resistance and related metabolic disorders. Nat. Rev. Endocrinol. 2017, 13, 79–91. [Google Scholar] [CrossRef] [PubMed]
- Mottillo, S.; Filion, K.B.; Genest, J.; Joseph, L.; Pilote, L.; Poirier, P.; Rinfret, S.; Schiffrin, E.L.; Eisenberg, M.J. The Metabolic Syndrome and Cardiovascular Risk: A Systematic Review and Meta-Analysis. J. Am. Coll. Cardiol. 2010, 56, 1113–1132. [Google Scholar] [CrossRef] [PubMed] [Green Version]
- Lim, J.S.; Mietus-Snyder, M.; Valente, A.; Schwarz, J.-M.; Lustig, R.H. The role of fructose in the pathogenesis of NAFLD and the metabolic syndrome. Nat. Rev. Gastroenterol. Hepatol. 2010, 7, 251–264. [Google Scholar] [CrossRef] [PubMed]
- Drake, I.; Sonestedt, E.; Ericson, U.; Wallström, P.; Orho-Melander, M. A Western dietary pattern is prospectively associated with cardio-metabolic traits and incidence of the metabolic syndrome. Br. J. Nutr. 2018, 119, 1168–1176. [Google Scholar] [CrossRef] [Green Version]
- Wang, L.; Martínez Steele, E.; Du, M.; Pomeranz, J.L.; O’Connor, L.E.; Herrick, K.A.; Luo, H.; Zhang, X.; Mozaffarian, D.; Zhang, F.F. Trends in Consumption of Ultraprocessed Foods Among US Youths Aged 2–19 Years, 1999–2018. JAMA 2021, 326, 519. [Google Scholar] [CrossRef]
- Hannou, S.A.; Haslam, D.E.; McKeown, N.M.; Herman, M.A. Fructose metabolism and metabolic disease. J. Clin. Investig. 2018, 128, 545–555. [Google Scholar] [CrossRef]
- Micha, R.; Peñalvo, J.L.; Cudhea, F.; Imamura, F.; Rehm, C.D.; Mozaffarian, D. Association Between Dietary Factors and Mortality From Heart Disease, Stroke, and Type 2 Diabetes in the United States. JAMA 2017, 317, 912–924. [Google Scholar] [CrossRef] [Green Version]
- Bremer, A.A.; Mietus-Snyder, M.; Lustig, R.H. Toward a Unifying Hypothesis of Metabolic Syndrome. Pediatrics 2012, 129, 557–570. [Google Scholar] [CrossRef] [PubMed] [Green Version]
- Wigger, L.; Cruciani-Guglielmacci, C.; Nicolas, A.; Denom, J.; Fernandez, N.; Fumeron, F.; Marques-Vidal, P.; Ktorza, A.; Kramer, W.; Schulte, A.; et al. Plasma Dihydroceramides Are Diabetes Susceptibility Biomarker Candidates in Mice and Humans. Cell Rep. 2017, 18, 2269–2279. [Google Scholar] [CrossRef] [PubMed]
- Meeusen, J.W.; Donato, L.J.; Bryant, S.C.; Baudhuin, L.M.; Berger, P.B.; Jaffe, A.S. Plasma Ceramides: A Novel Predictor of Major Adverse Cardiovascular Events After Coronary Angiography. Arterioscler. Thromb. Vasc. Biol. 2018, 38, 1933–1939. [Google Scholar] [CrossRef] [PubMed] [Green Version]
- Othman, A.; Saely, C.H.; Muendlein, A.; Vonbank, A.; Drexel, H.; von Eckardstein, A.; Hornemann, T. Plasma 1-deoxysphingolipids are predictive biomarkers for type 2 diabetes mellitus. BMJ Open Diabetes Res. Care 2015, 3, e000073. [Google Scholar] [CrossRef] [PubMed] [Green Version]
- Lustig, R.H.; Mulligan, K.; Noworolski, S.M.; Tai, V.W.; Wen, M.J.; Erkin-Cakmak, A.; Gugliucci, A.; Schwarz, J.-M. Isocaloric fructose restriction and metabolic improvement in children with obesity and metabolic syndrome. Obesity 2016, 24, 453–460. [Google Scholar] [CrossRef]
- Schwarz, J.-M.; Noworolski, S.M.; Erkin-Cakmak, A.; Korn, N.J.; Wen, M.J.; Tai, V.W.; Jones, G.M.; Palii, S.P.; Velasco-Alin, M.; Pan, K.; et al. Effects of Dietary Fructose Restriction on Liver Fat, De Novo Lipogenesis, and Insulin Kinetics in Children With Obesity. Gastroenterology 2017, 153, 743–752. [Google Scholar] [CrossRef] [PubMed] [Green Version]
- Gugliucci, A.; Lustig, R.H.; Caccavello, R.; Erkin-Cakmak, A.; Noworolski, S.M.; Tai, V.W.; Wen, M.J.; Mulligan, K.; Schwarz, J.-M. Short-term isocaloric fructose restriction lowers apoC-III levels and yields less atherogenic lipoprotein profiles in children with obesity and metabolic syndrome. Atherosclerosis 2016, 253, 171–177. [Google Scholar] [CrossRef] [Green Version]
- Bielawski, J.; Pierce, J.S.; Snider, J.; Rembiesa, B.; Szulc, Z.M.; Bielawska, A. Sphingolipid Analysis by High Performance Liquid Chromatography-Tandem Mass Spectrometry (HPLC-MS/MS). In Sphingolipids as Signaling and Regulatory Molecules; Advances in Experimental Medicine and Biology; Chalfant, C., Poeta, M.D., Eds.; Springer: New York, NY, USA, 2010; Volume 688, pp. 46–59. [Google Scholar] [CrossRef]
- Matsuda, M.; DeFronzo, R.A. Insulin sensitivity indices obtained from oral glucose tolerance testing: Comparison with the euglycemic insulin clamp. Diabetes Care 1999, 22, 1462–1470. [Google Scholar] [CrossRef]
- Choi, Y.S.; Beltran, T.A.; Klaric, J.S. Prevalence of Optimal Metabolic Health in U.S. Adolescents, NHANES 2007–2016. Metab. Syndr. Relat. Disord. 2021, 19, 56–63. [Google Scholar] [CrossRef]
- Ahmad, F.B.; Anderson, R.N. The Leading Causes of Death in the US for 2020. JAMA 2021, 325, 1829. [Google Scholar] [CrossRef]
- Roth, G.A.; Forouzanfar, M.H.; Moran, A.E.; Barber, R.; Nguyen, G.; Feigin, V.L.; Naghavi, M.; Mensah, G.A.; Murray, C.J. Demographic and Epidemiologic Drivers of Global Cardiovascular Mortality. N. Engl. J. Med. 2015, 372, 1333–1341. [Google Scholar] [CrossRef] [PubMed] [Green Version]
- Xanthakos, S.A.; Lavine, J.E.; Yates, K.P.; Schwimmer, J.B.; Molleston, J.P.; Rosenthal, P.; Murray, K.F.; Vos, M.B.; Jain, A.K.; Scheimann, A.O.; et al. Progression of Fatty Liver Disease in Children Receiving Standard of Care Lifestyle Advice. Gastroenterology 2020, 159, 1731–1751.e10. [Google Scholar] [CrossRef] [PubMed]
- TODAY Study Group. Long-Term Complications in Youth-Onset Type 2 Diabetes. N. Engl. J. Med. 2021, 385, 416–426. [Google Scholar] [CrossRef]
- Lawrence, J.M.; Divers, J.; Isom, S.; Saydah, S.; Imperatore, G.; Pihoker, C.; Marcovina, S.M.; Mayer-Davis, E.J.; Hamman, R.F.; Dolan, L.; et al. Trends in Prevalence of Type 1 and Type 2 Diabetes in Children and Adolescents in the US, 2001–2017. JAMA 2021, 326, 717–727. [Google Scholar] [CrossRef] [PubMed]
- Lustig, R.H. Ultraprocessed Food: Addictive, Toxic, and Ready for Regulation. Nutrients 2020, 12, 3401. [Google Scholar] [CrossRef]
- Joseph, P.; Leong, D.; McKee, M.; Anand, S.S.; Schwalm, J.-D.; Teo, K.; Mente, A.; Yusuf, S. Reducing the Global Burden of Cardiovascular Disease, Part 1. Circ. Res. 2017, 121, 677–694. [Google Scholar] [CrossRef]
- Rutledge, A.C.; Adeli, K. Fructose and the Metabolic Syndrome: Pathophysiology and Molecular Mechanisms. Nutr. Rev. 2008, 65, S13–S23. [Google Scholar] [CrossRef]
- Luukkonen, P.K.; Sädevirta, S.; Zhou, Y.; Kayser, B.; Ali, A.; Ahonen, L.; Lallukka, S.; Pelloux, V.; Gaggini, M.; Jian, C.; et al. Saturated Fat Is More Metabolically Harmful for the Human Liver Than Unsaturated Fat or Simple Sugars. Diabetes Care 2018, 41, 1732–1739. [Google Scholar] [CrossRef] [Green Version]
- Lai, H.; Otto, M.C.D.O.; Lee, Y.; Wu, J.; Song, X.; King, I.B.; Psaty, B.M.; Lemaitre, R.N.; McKnight, B.; Siscovick, D.S.; et al. Serial Plasma Phospholipid Fatty Acids in the De Novo Lipogenesis Pathway and Total Mortality, Cause-Specific Mortality, and Cardiovascular Diseases in the Cardiovascular Health Study. J. Am. Hearth Assoc. 2019, 8, e012881. [Google Scholar] [CrossRef]
- Donnelly, K.L.; Smith, C.I.; Schwarzenberg, S.J.; Jessurun, J.; Boldt, M.D.; Parks, E.J. Sources of fatty acids stored in liver and secreted via lipoproteins in patients with nonalcoholic fatty liver disease. J. Clin. Investig. 2005, 115, 1343–1351. [Google Scholar] [CrossRef] [Green Version]
- Walker, E.M.; Xanthakis, V.; Moore, L.L.; Vasan, R.S.; Jacques, P.F. Cumulative sugar-sweetened beverage consumption is associated with higher concentrations of circulating ceramides in the Framingham Offspring Cohort. Am. J. Clin. Nutr. 2019, 111, 420–428. [Google Scholar] [CrossRef] [PubMed]
- Hanada, K. Serine palmitoyltransferase, a key enzyme of sphingolipid metabolism. Biochim. Biophys. Acta (BBA)—Mol. Cell Biol. Lipids 2003, 1632, 16–30. [Google Scholar] [CrossRef]
- Summers, S.A.; Chaurasia, B.; Holland, W.L. Metabolic Messengers: Ceramides. Nat. Metab. 2019, 1, 1051–1058. [Google Scholar] [CrossRef]
- Bikman, B.T.; Guan, Y.; Shui, G.; Siddique, M.M.; Holland, W.L.; Kim, J.Y.; Fabrias, G.; Wenk, M.R.; Summers, S.A. Fenretinide Prevents Lipid-induced Insulin Resistance by Blocking Ceramide Biosynthesis. J. Biol. Chem. 2012, 287, 17426–17437. [Google Scholar] [CrossRef] [PubMed] [Green Version]
- Chun, L.; Junlin, Z.; Aimin, W.; Niansheng, L.; Benmei, C.; Minxiang, L. Inhibition of ceramide synthesis reverses endothelial dysfunction and atherosclerosis in streptozotocin-induced diabetic rats. Diabetes Res. Clin. Pract. 2011, 93, 77–85. [Google Scholar] [CrossRef] [PubMed]
- Park, T.-S.; Rosebury, W.; Kindt, E.K.; Kowala, M.C.; Panek, R.L. Serine palmitoyltransferase inhibitor myriocin induces the regression of atherosclerotic plaques in hyperlipidemic ApoE-deficient mice. Pharmacol. Res. 2008, 58, 45–51. [Google Scholar] [CrossRef] [PubMed]
- Hilvo, M.; Vasile, V.C.; Donato, L.J.; Hurme, R.; Laaksonen, R. Ceramides and Ceramide Scores: Clinical Applications for Cardiometabolic Risk Stratification. Front. Endocrinol. 2020, 11, 570628. [Google Scholar] [CrossRef] [PubMed]
- Poss, A.M.; Maschek, J.A.; Cox, J.E.; Hauner, B.J.; Hopkins, P.N.; Hunt, S.C.; Holland, W.L.; Summers, S.A.; Playdon, M.C. Machine learning reveals serum sphingolipids as cholesterol-independent biomarkers of coronary artery disease. J. Clin. Investig. 2020, 130, 1363–1376. [Google Scholar] [CrossRef] [Green Version]
- Wang, D.D.; Toledo, E.; Hruby, A.; Rosner, B.A.; Willett, W.C.; Sun, Q.; Razquin, C.; Zheng, Y.; Ruiz-Canela, M.; Guasch-Ferré, M.; et al. Plasma Ceramides, Mediterranean Diet, and Incident Cardiovascular Disease in the PREDIMED Trial (Prevención con Dieta Mediterránea). Circulation 2017, 135, 2028–2040. [Google Scholar] [CrossRef] [Green Version]
- Lankinen, M.; Schwab, U.; Kolehmainen, M.; Paananen, J.; Nygren, H.; Seppänen-Laakso, T.; Poutanen, K.; Hyötyläinen, T.; Risérus, U.; Savolainen, M.J.; et al. A Healthy Nordic Diet Alters the Plasma Lipidomic Profile in Adults with Features of Metabolic Syndrome in a Multicenter Randomized Dietary Intervention. J. Nutr. 2015, 146, 662–672. [Google Scholar] [CrossRef] [Green Version]
- Duan, J.; Merrill, A.H. 1-Deoxysphingolipids Encountered Exogenously and Made de Novo: Dangerous Mysteries inside an Enigma. J. Biol. Chem. 2015, 290, 15380–15389. [Google Scholar] [CrossRef] [PubMed] [Green Version]
- Gorden, D.; Myers, D.S.; Ivanova, P.T.; Fahy, E.; Maurya, M.R.; Gupta, S.; Min, J.; Spann, N.J.; McDonald, J.G.; Kelly, S.L.; et al. Biomarkers of NAFLD progression: A lipidomics approach to an epidemic. J. Lipid Res. 2015, 56, 722–736. [Google Scholar] [CrossRef] [PubMed] [Green Version]
- Zuellig, R.A.; Hornemann, T.; Othman, A.; Hehl, A.B.; Bode, H.; Güntert, T.; Ogunshola, O.O.; Saponara, E.; Grabliauskaite, K.; Jang, J.-H.; et al. Deoxysphingolipids, Novel Biomarkers for Type 2 Diabetes, Are Cytotoxic for Insulin-Producing Cells. Diabetes 2014, 63, 1326–1339. [Google Scholar] [CrossRef] [PubMed] [Green Version]
- Hannich, J.T.; Loizides-Mangold, U.; Sinturel, F.; Harayama, T.; Vandereycken, B.; Saini, C.; Gosselin, P.; Brulhart-Meynet, M.; Robert, M.; Chanon, S.; et al. Ether lipids, sphingolipids and toxic 1-deoxyceramides as hallmarks for lean and obese type 2 diabetic patients. Acta Physiol. 2020, 232, e13610. [Google Scholar] [CrossRef]
- Summers, S.A. Could Ceramides Become the New Cholesterol? Cell Metab. 2018, 27, 276–280. [Google Scholar] [CrossRef] [Green Version]
- Tippetts, T.S.; Holland, W.L.; Summers, S.A. Cholesterol—the devil you know; ceramide—the devil you don’t. Trends Pharmacol. Sci. 2021, 42, 1082–1095. [Google Scholar] [CrossRef]
- Rossi, A.P.; Fantin, F.; Zamboni, G.A.; Mazzali, G.; Zoico, E.; Bambace, C.; Antonioli, A.; Mucelli, R.P.; Zamboni, M. Effect of moderate weight loss on hepatic, pancreatic and visceral lipids in obese subjects. Nutr. Diabetes 2012, 2, e32. [Google Scholar] [CrossRef]
- Schwimmer, J.; Ugalde-Nicalo, P.; Welsh, J.A.; Angeles, J.E.; Cordero, M.; Harlow, K.E.; Alazraki, A.; Durelle, J.; Knight-Scott, J.; Newton, K.P.; et al. Effect of a Low Free Sugar Diet vs. Usual Diet on Nonalcoholic Fatty Liver Disease in Adolescent Boys. JAMA 2019, 321, 256–265. [Google Scholar] [CrossRef] [Green Version]
- Cohen, C.C.; Li, K.W.; Alazraki, A.L.; Beysen, C.; Carrier, C.A.; Cleeton, R.L.; Dandan, M.; Figueroa, J.; Knight-Scott, J.; Knott, C.J.; et al. Dietary sugar restriction reduces hepatic de novo lipogenesis in adolescent boys with fatty liver disease. J. Clin. Investig. 2021, 131, e150996. [Google Scholar] [CrossRef]


| Ceramide Subtype | Day 0 (Mean ± SD) | Day 10 (Mean ± SD) | Paired t-Test (p-Value) | % Change (Mean ± SD) |
|---|---|---|---|---|
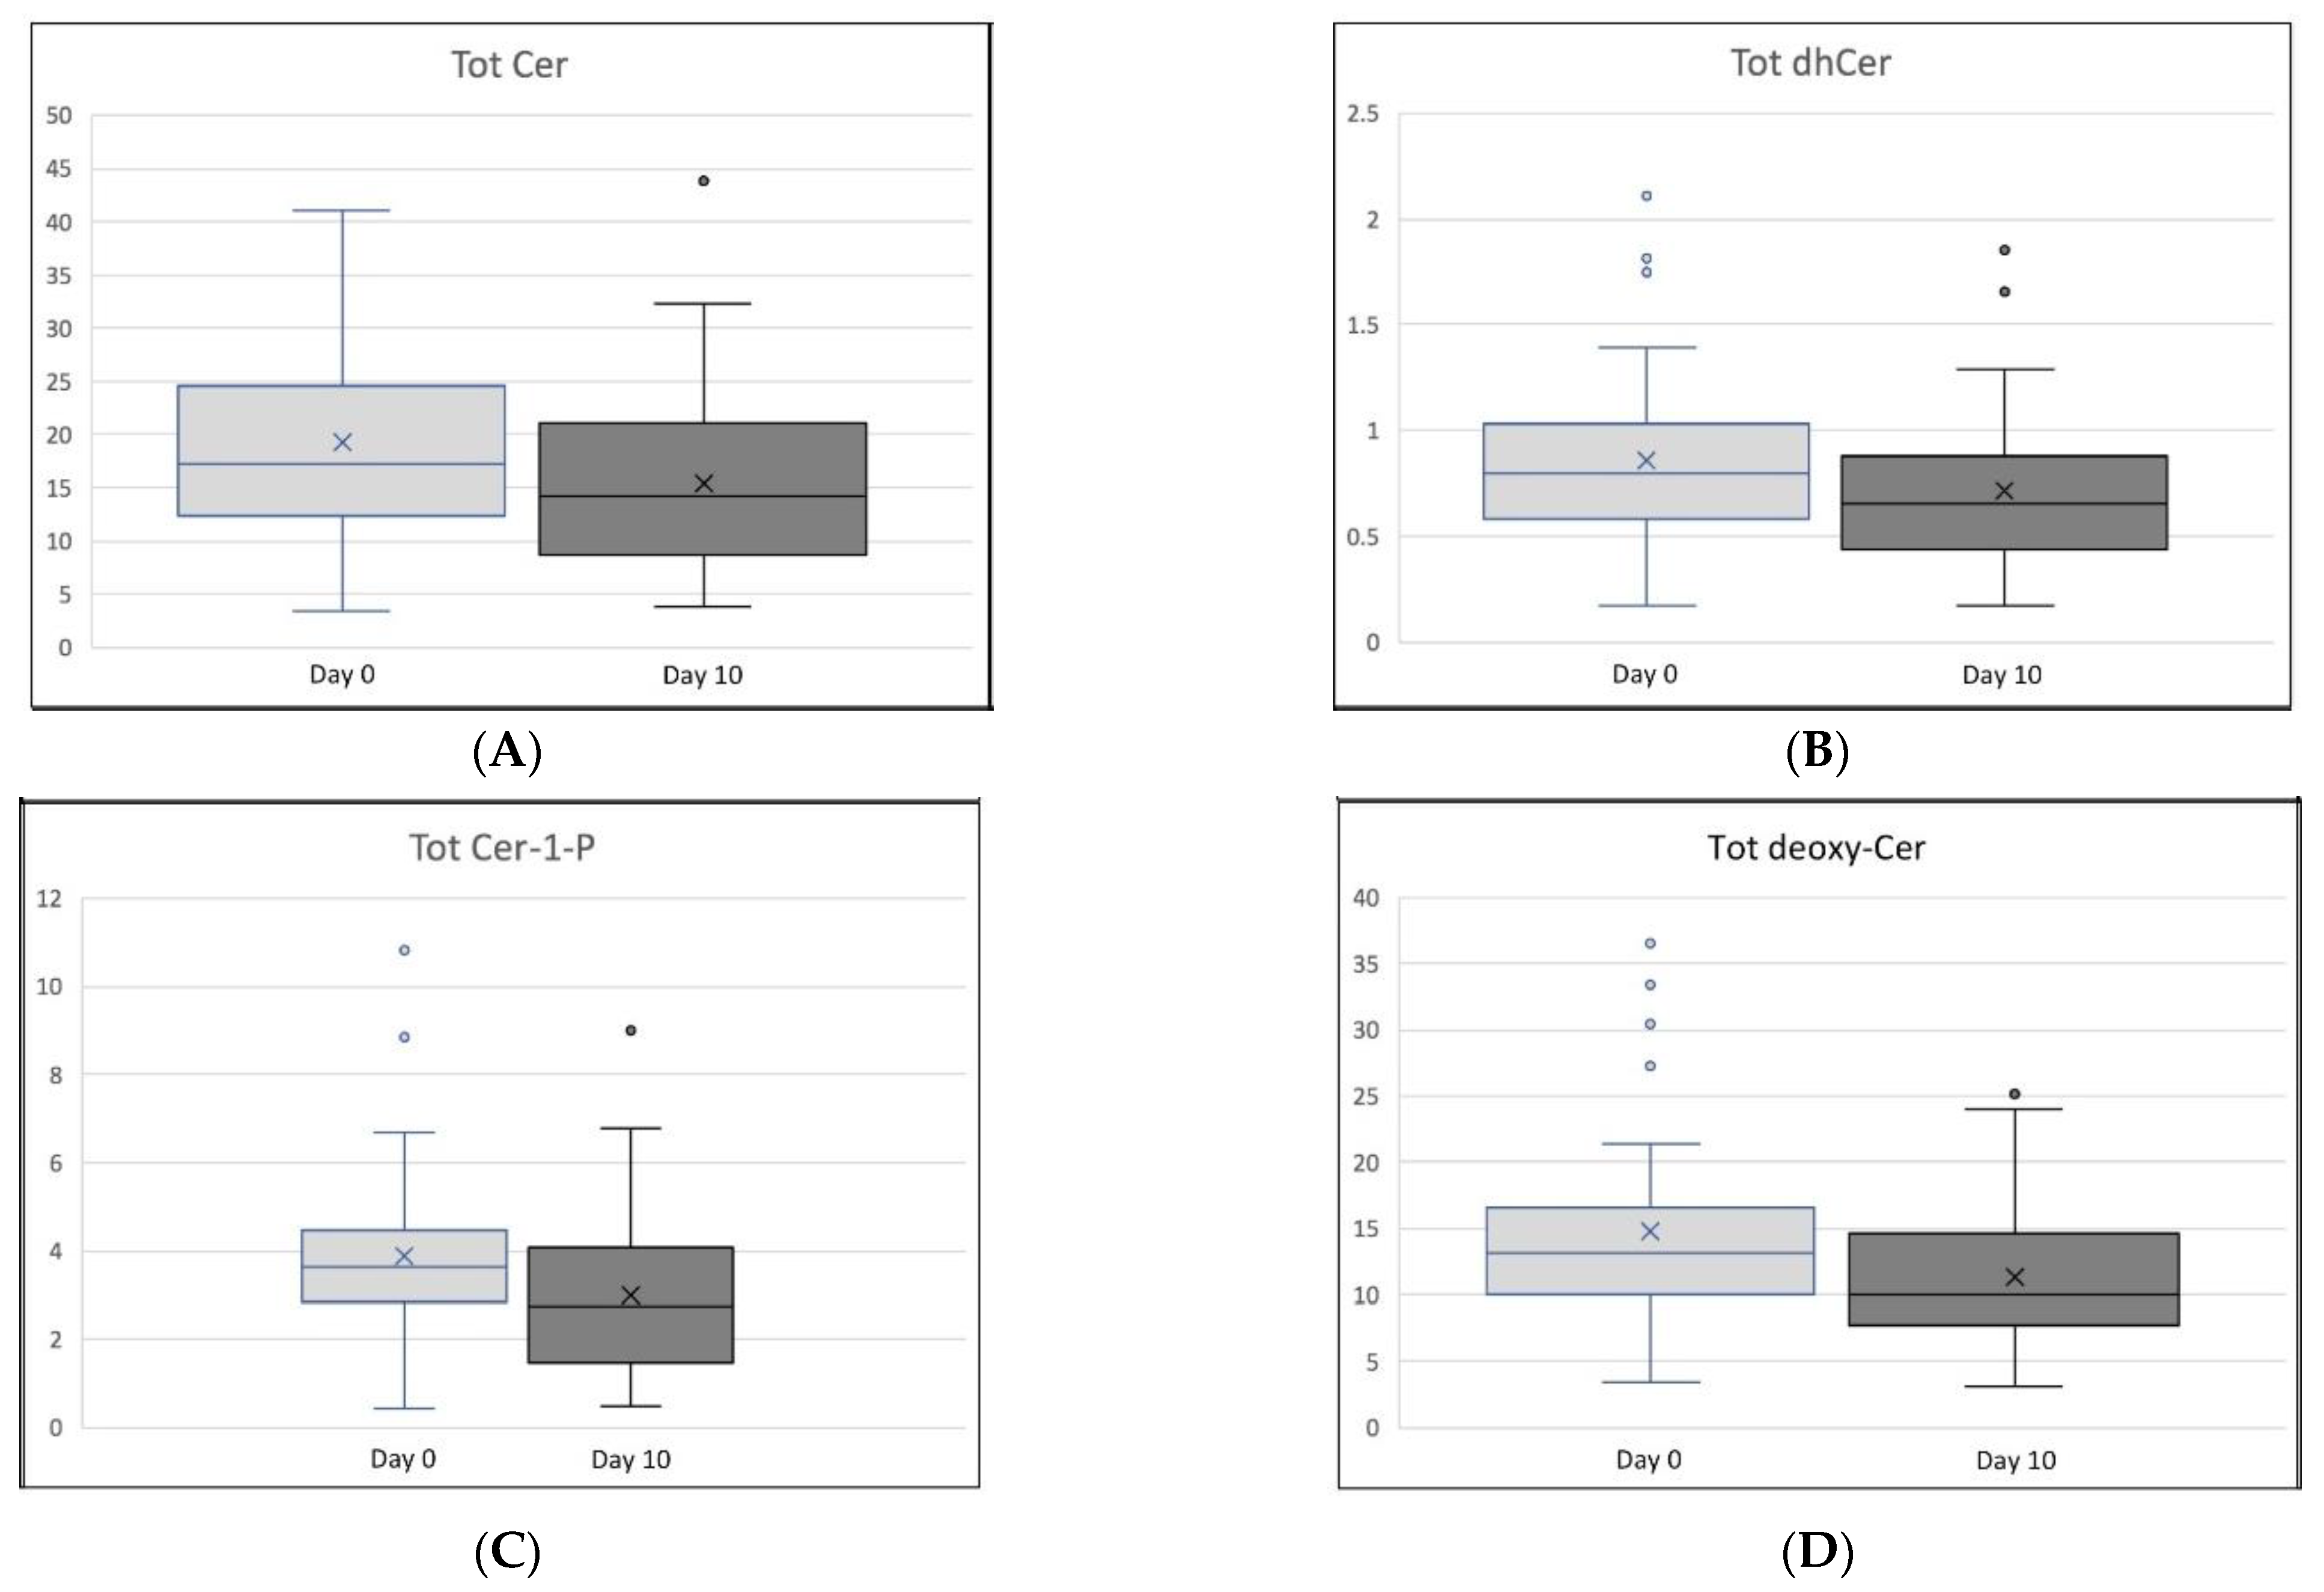
| Tot Cer | 19.38 ± 8.81 | 15.48 ± 8.44 | 0.037 | −5.22 ± 114.23 |
| C26:1 Cer | 0.10 ± 0.06 | 0.09 ± 0.06 | 0.185 | −28.74 ± 187.32 |
| C26:0 Cer | 0.22 ± 0.13 | 0.18 ± 0.11 | 0.162 | −17.80 ± 113.84 |
| C24:1 Cer | 2.91 ± 1.43 | 2.62 ± 1.15 | 0.240 | −34.24 ± 230.44 |
| C24:0 Cer | 12.04 ± 6.13 | 9.12 ± 5.89 | 0.028 | −38.68 ± 311.67 |
| C22:0 Cer | 1.83 ± 0.83 | 1.42 ± 0.82 | 0.015 | −10.46 ± 179.30 |
| C20:0 Cer | 0.84 ± 0.35 | 0.70 ± 0.34 | 0.046 | −4.9 ± 55.08 |
| C18:1 Cer | 0.05 ± 0.03 | 0.05 ± 0.02 | 0.999 | −33.33 ± 106.17 |
| C18:0 Cer | 0.23 ± 0.10 | 0.23 ±0.09 | 0.709 | +13.48 ± 50.35 |
| C16:0 Cer | 0.97 ± 0.32 | 0.92 ± 0.29 | 0.391 | −1.16 ± 36.29 |
| C14:0 Cer | 0.19 ± 0.09 | 0.15 ± 0.07 | 0.005 | −8.06 ± 67.72 |
| Tot dhCer | 0.86 ± 0.43 | 0.72 ± 0.38 | 0.083 | −10.34 ± 115.78 |
| C26:0 dhCer | 0.08 ± 0.10 | 0.04 ± 0.04 | 0.018 | −10.00 ± 75.86 |
| C24:1 dhCer | 0.15 ± 0.08 | 0.14 ± 0.07 | 0.624 | −34.47 ± 169.86 |
| C24:0 dhCer | 0.35 ± 0.22 | 0.31 ± 0.17 | 0.317 | −186.43 ± 991.81 |
| C22:0 dhCer | 0.15 ± 0.09 | 0.11 ± 0.06 | 0.021 | −29.41 ± 292.60 |
| C20:0 dhCer | 0.04 ± 0.02 | 0.03 ± 0.02 | 0.010 | −9.38 ± 52.34 |
| C18:0 dhCer | 0.03 ± 0.02 | 0.02 ± 0.01 | 0.266 | −43.72 ± 164.17 |
| C16:0 dhCer | 0.06 ± 0.08 | 0.06 ± 0.12 | 0.724 | −68.07 ± 260.39 |
| Tot Cer-1-P | 3.90 ± 1.93 | 2.98 ± 1.88 | 0.021 | −16.99 ± 211.94 |
| C24:0 Cer-1-P | 0.05 ± 0.02 | 0.05 ± 0.02 | 0.673 | −13.01 ± 77.38 |
| C18:1 Cer-1-P | 0.14 ± 0.07 | 0.12 ± 0.06 | 0.122 | −45.74 ± 332.11 |
| C16:0 Cer-1-P | 3.71 ± 1.86 | 2.82 ± 1.81 | 0.020 | −19.77 ± 228.53 |
| Tot deoxy-Cer | 14.73 ± 7.50 | 11.35 ± 5.30 | 0.008 | −0.86 ± 112.62 |
| C24:0 deoxy-Cer | 0.31 ± 0.19 | 0.21 ± 0.16 | 0.003 | −24.48 ± 290.53 |
| C22:0 deoxy-Cer | 0.24 ± 0.14 | 0.17 ± 0.12 | 0.001 | −99.83 ± 0.12 |
| C20:0 deoxy-Cer | 0.04 ± 0.03 | 0.03 ± 0.02 | 0.001 | −15.68 ± 70.41 |
| C18:0 deoxy-Cer | 3.69 ± 2.14 | 2.65 ± 1.36 | 0.003 | −2.55 ± 116.93 |
| C16:0 deoxy-Cer | 10.45 ± 5.12 | 8.29 ± 3.74 | 0.015 | −2.77 ± 112.03 |
| Ceramide Subtype | Weight | LDL-C | TG | CISI | FFA | DNL-AUC |
|---|---|---|---|---|---|---|
| ρ (Prob > |r| under H0: ρ = 0) | ||||||
| Tot Cer | +0.20 (0.191) | +0.43 (0.005) | +0.19 (0.220) | −0.35 (0.021) | −0.23 (0.135) | +0.07 (0.663) |
| C26:1 Cer | +0.20 (0.192) | +0.41 (0.007) | +0.14 (0.360) | −0.33 (0.032) | −0.25 (0.101) | +0.02 (0.897) |
| C26:0 Cer | −0.02 (0.914) | +0.41 (0.007) | ≤0.01 (0.979) | −0.24 (0.121) | −0.12 (0.442) | −0.11 (0.500) |
| C24:1 Cer | +0.23 (0.139) | +0.50 (0.001) | +0.21 (0.178) | −0.38 (0.013) | −0.26 (0.091) | +0.10 (0.529) |
| C24:0 Cer | +0.19 (0.227) | +0.39 (0.010) | +0.18 (0.242) | −0.34 (0.025) | −0.22 (0.151) | +0.06 (0.729) |
| C22:0 Cer | +0.26 (0.098) | +0.45 (0.003) | +0.25 (0.099) | −0.40 (0.009) | −0.23 (0.139) | +0.14 (0.398) |
| C20:0 Cer | +0.23 (0.132) | +0.45 (0.003) | +0.15 (0.348) | −0.30 (0.051) | −0.18 (0.241) | +0.05 (0.781) |
| C18:1 Cer | +0.03 (0.844) | +0.45 (0.003) | −0.24 (0.125) | −0.15 (0.325) | −0.36 (0.017) | +0.14 (0.388) |
| C18:0 Cer | −0.04 (0.819) | +0.26 (0.091) | −0.04 (0.796) | +0.04 (0.793) | +0.06 (0.690) | −0.19 (0.237) |
| C16:0 Cer | +0.17 (0.286) | +0.35 (0.022) | +0.07 (0.650) | −0.10 (0.536) | −0.16 (0.306) | +0.13 (0.436) |
| C14:0 Cer | +0.22 (0.159) | +0.48 (0.001) | +0.34 (0.024) | −0.41 (0.006) | −0.27 (0.080) | +0.27 (0.088) |
| Tot dhCer | +0.25 (0.108) | +0.43 (0.004) | +0.25 (0.112) | −0.35 (0.020) | −0.28 (0.071) | +0.22 (0.175) |
| C26:0 dhCer | +0.14 (0.372) | −0.14 (0.360) | +0.78 (<0.001) | −0.18 (0.259) | −0.19 (0.224) | +0.21 (0.201) |
| C24:1 dhCer | +0.22 (0.158) | +0.46 (0.002) | +0.17 (0.271) | −0.35 (0.023) | −0.27 (0.081) | +0.18 (0.258) |
| C24:0 dhCer | +0.22 (0.161) | +0.39 (0.011) | +0.13 (0.398) | −0.37 (0.015) | −0.22 (0.16) | +0.19 (0.243) |
| C22:0 dhCer | +0.16 (0.316) | +0.40 (0.009) | +0.16 (0.305) | −0.40 (0.008) | −0.16 (0.298) | +0.16 (0.320) |
| C20:0 dhCer | +0.06 (0.726) | +0.24 (0.117) | +0.30 (0.050) | +0.06 (0.720) | −0.20 (0.191) | +0.10 (0.543) |
| C18:0 dhCer | +0.22 (0.151) | +0.38 (0.012) | +0.16 (0.296) | −0.13 (0.396) | −0.36 (0.018) | +0.38 (0.016) |
| C16:0 dhCer | +0.14 (0.376) | +0.32 (0.040) | −0.26 (0.095) | +0.07 (0.678) | −0.12 (0.441) | −0.02 (0.917) |
| Tot Cer-1-P | +0.30 (0.052) | +0.44 (0.004) | +0.30 (0.050) | −0.42 (0.005) | −0.19 (0.227) | +0.08 (0.616) |
| C24:0 Cer-1-P | +0.04 (0.776) | +0.46 (0.002) | −0.03 (0.866) | −0.10 (0.540) | −0.11 (0.501) | +0.13 (0.438) |
| C18:1 Cer-1-P | +0.24 (0.120) | +0.51 (0.001) | +0.24 (0.125) | −0.43 (0.004) | −0.21 (0.177) | +0.12 (0.477) |
| C16:0 Cer-1-P | +0.30 (0.050) | +0.43 (0.004) | +0.30 (0.048) | −0.42 (0.006) | −0.19 (0.230) | +0.08 (0.627) |
| Tot deoxy-Cer | +0.30 (0.054) | +0.55 (<0.001) | +0.17 (0.285) | −0.34 (0.026) | −0.43 (0.004) | +0.40 (0.010) |
| C24:0 deoxy-Cer | +0.14 (0.357) | +0.48 (0.002) | +0.27 (0.077) | −0.42 (0.005) | −0.34 (0.026) | +0.28 (0.082) |
| C22:0 deoxy-Cer | +0.26 (0.094) | +0.46 (0.002) | +0.42 (0.005) | −0.38 (0.013) | −0.35 (0.023) | +0.42 (0.007) |
| C20:0 deoxy-Cer | +0.21 (0.174) | +0.40 (0.008) | +0.53 (<0.001) | −0.37 (0.016) | −0.19 (0.213) | +0.20 (0.227) |
| C18:0 deoxy-Cer | +0.31 (0.044) | +0.49 (0.001) | +0.19 (0.216) | −0.34 (0.027) | −0.46 (0.002) | +0.41 (0.008) |
| C16:0 deoxy-Cer | +0.29 (0.058) | +0.56 (<0.001) | +0.14 (0.365) | −0.33 (0.032) | −0.42 (0.005) | +0.39 (0.012) |
Publisher’s Note: MDPI stays neutral with regard to jurisdictional claims in published maps and institutional affiliations. |
© 2022 by the authors. Licensee MDPI, Basel, Switzerland. This article is an open access article distributed under the terms and conditions of the Creative Commons Attribution (CC BY) license (https://creativecommons.org/licenses/by/4.0/).
Share and Cite
Olson, E.; Suh, J.H.; Schwarz, J.-M.; Noworolski, S.M.; Jones, G.M.; Barber, J.R.; Erkin-Cakmak, A.; Mulligan, K.; Lustig, R.H.; Mietus-Snyder, M. Effects of Isocaloric Fructose Restriction on Ceramide Levels in Children with Obesity and Cardiometabolic Risk: Relation to Hepatic De Novo Lipogenesis and Insulin Sensitivity. Nutrients 2022, 14, 1432. https://doi.org/10.3390/nu14071432
Olson E, Suh JH, Schwarz J-M, Noworolski SM, Jones GM, Barber JR, Erkin-Cakmak A, Mulligan K, Lustig RH, Mietus-Snyder M. Effects of Isocaloric Fructose Restriction on Ceramide Levels in Children with Obesity and Cardiometabolic Risk: Relation to Hepatic De Novo Lipogenesis and Insulin Sensitivity. Nutrients. 2022; 14(7):1432. https://doi.org/10.3390/nu14071432
Chicago/Turabian StyleOlson, Emily, Jung H. Suh, Jean-Marc Schwarz, Susan M. Noworolski, Grace M. Jones, John R. Barber, Ayca Erkin-Cakmak, Kathleen Mulligan, Robert H. Lustig, and Michele Mietus-Snyder. 2022. "Effects of Isocaloric Fructose Restriction on Ceramide Levels in Children with Obesity and Cardiometabolic Risk: Relation to Hepatic De Novo Lipogenesis and Insulin Sensitivity" Nutrients 14, no. 7: 1432. https://doi.org/10.3390/nu14071432
APA StyleOlson, E., Suh, J. H., Schwarz, J.-M., Noworolski, S. M., Jones, G. M., Barber, J. R., Erkin-Cakmak, A., Mulligan, K., Lustig, R. H., & Mietus-Snyder, M. (2022). Effects of Isocaloric Fructose Restriction on Ceramide Levels in Children with Obesity and Cardiometabolic Risk: Relation to Hepatic De Novo Lipogenesis and Insulin Sensitivity. Nutrients, 14(7), 1432. https://doi.org/10.3390/nu14071432