Abstract
Objective: Determine if exercise interventions, beyond what is already provided to children and preschool children, improve bone health and reduce fracture incidence. Design: Systematic review and meta-analysis reported using the PRISMA guidelines. Certainty of evidence was assessed using GRADE recommendations. Data sources: Five electronic databases were searched for records: PUBMED; CINAHL; CENTRAL; SPORTDiscus; Web of Science. Eligibility criteria for selecting studies: Randomised, quasi-randomised and non-randomised controlled trials (including cluster-randomised) assessing the impact of additional exercise interventions (e.g., increased physical education classes or specific jumping programs) on bone health in children (6–12 years) and pre-school children (2–5 years) without dietary intervention. Results: Thirty-one records representing 16 distinct clinical trials were included. Dual-energy X-ray Absorptiometry (DXA) and/or peripheral Quantitative Computed Tomography (pQCT) were used to quantify bone health. Increased femoral neck bone mineral content in children with additional exercise interventions (n = 790, SMD = 0.55, 95% CI = 0.01 to 1.09) was reported, however this was not significant following sensitivity analysis. Other DXA and pQCT measures, as well as fracture incidence, did not appear to significantly differ over time between intervention and control groups. No studies reported adverse events. Studies failed to report all domains within the TIDieR checklist. All studies were at high risk of bias using the Cochrane RoB Tool 2.0. The certainty of the evidence was very low. Conclusions: The addition of exercise interventions, beyond what is provided to children, does not appear to improve DXA and pQCT measures of bone health. The effect of additional exercise interventions on bone health in pre-school children is largely unknown. Future trials should ensure adherence is clearly reported and controlled for within analysis as well as including reports of adverse events (e.g., apophysitis) that occur due to increased exercise interventions.
1. Introduction
It is widely agreed that bone mass accrual in childhood and adolescence determines peak bone mass and the risk of osteoporosis later in life [1,2]. Furthermore, the accrual of bone mass can be optimised by mechanical loading through exercise interventions [3,4,5,6] with bone adaptation most readily occurring with mechanotransduction of impact loading (e.g., running or jumping) [7,8]. Engagement in activities involving running and jumping is not only beneficial for bone, but also has wide ranging health benefits, including reducing obesity and improving psychological well-being [5].
The World Health Organisation recommends “children and young people aged 5–17 years old should accumulate at least 60 min of moderate to vigorous-intensity physical activity daily” [9]. However, a recent analysis from the Australian Institute for Health and Welfare showed that less than one-quarter of children aged 5–14 years meet this recommendation [10]. Worryingly, fracture rates within Australia have also been shown to have increased over time [11].
Given the importance of specific exercise to bone development, such as running or jumping, one of the simplest solutions would be, in theory, to increase exercise in children to optimise benefits from exercise starting early in life. If being specific to bone health, the exercise interventions would need to include specific aspects such as timing and duration of exercise, motivation and mode of activity [12]. Whilst the effect of exercise interventions for bone health in children have been quantified previously, new research is available. Furthermore, these previous systematic reviews contain methodological concerns. Behringer et al. 2014 pooled the results of all studies, irrespective of the region Bone Mineral Content (BMC) or areal bone mineral density (aBMD) was assessed, at their final follow-up with these time points ranging from 6–208 weeks, which given the time taken for bone to adapt following mechanical loading is a problem. Ref. [3] Tan et al. 2014 listed studies that had assessed the same data at different timepoints separately, influencing conclusions, as opposed to treating all published papers related to a single cohort as one trial (e.g., Malmo Paediatric Osteoporosis Prevention Study). Ref. [6] Nikander et al. 2010 also failed to delineate multiple studies using the same data and included both in pooled analysis [13,14], and presented pooled results within meta-analysis of outcomes assessing different regions (e.g., tibia and femoral measures were pooled).
Due to the sample sizes of previous meta-analyses being incorrectly inflated due to the inclusion of several published studies from a single trial or by pooling different body regions, the positive relationship between existing exercise regimes and bone health shown in previous reviews remains uncertain.
Objectives
Our primary objective was to determine if additional exercise interventions, beyond what is already provided, in children and preschool children improve bone health. Our secondary objective was to determine if additional exercise interventions, beyond what is already provided, in children and preschool children reduce fracture incidence.
2. Materials and Methods
2.1. Guidelines
The systematic review and meta-analysis was designed and reported in accordance with the Preferred Reporting Items for Systematic Reviews and Meta-Analyses (PRISMA) [15].
2.2. Prospective Registration
This systematic review protocol has been registered with PROSPERO (CRD42022300902) on the 14th May 2022 [https://www.crd.york.ac.uk/prospero/].
2.3. Data Management
All records were stored online using Covidence (Covidence systematic review software, Veritas Health Innovation, Melbourne, Australia). All extracted data were stored in a Microsoft Excel document, within Microsoft Teams.
2.4. Inclusion Criteria
2.4.1. Participants
We included children (6–12 years) and preschool children (2–5 years) within this review who did not have medical comorbidities. We did not restrict inclusion based on body mass index.
2.4.2. Primary Outcomes
The primary outcome of interest for this review was bone health. We included any measure of bone assessed using Dual-energy X-ray Absorptiometry (DXA) or peripheral Quantitative Computed Tomography (pQCT) with baseline and follow-up outcomes.
2.4.3. Secondary Outcome
We included the incidence of fractures (occurrences) as a secondary outcome of this systematic review.
2.4.4. Types of Studies
We included randomised, quasi-randomised and non-randomised clinical trials where at least one study arm used an exercise intervention for bone health and was compared to a control group (standard care/standard physical activity or other exercise intervention). Observational trials, case reports or series, clinical observations and systematic reviews were excluded.
2.5. Search Strategy
A single study author (MM) performed all search strategies from database inception to 3 May 2022 and downloaded all records into Endnote 20.4.1 (Clarivate Analytics, Philadelphia, PA, USA), and subsequently uploaded them into Covidence.
2.5.1. Electronic Searches
Searches using free-text terms (Appendix A) were performed within the following electronic databases; PUBMED, CINAHL (Full-text), CENTRAL, SPORTDiscus, Web of Science. Limitations were used, where able, within individual databases with the complete search documentation provided within Appendix B.
2.5.2. Searching Other Sources
Reference lists of reviews and retrieved articles were checked for additional studies missed in the electronic database search. The ePublication lists of key journals in the field were screened to identify studies that had yet to be indexed.
2.5.3. Study Selection
Titles and abstracts of records identified by the search strategy were screened for their eligibility by two independent reviewers (MM/CM). Full-text screening was performed by the same two independent reviewers (MM/CM). Disagreements were resolved via consensus. The overall reasons for full-text articles being excluded are reported within the PRISMA flow chart [15].
2.6. Dealing with Multiple Records from the Same Cohort
Where multiple records were identified for a single cohort (as identified directly via manuscript text, referencing, clinical trial registration matching or ethical approval number matching) records were pooled to represent a single trial. Nine records were identified from the Swedish Malmo Paediatric Osteoporosis Prevention study [16,17,18,19,20,21,22,23,24]. Two records were identified from the Canadian AS!BC study [13,14]. Three records were identified from the Canadian Impact Loading study [25,26,27]. Three records were identified from the American Jumping Intervention study [28,29,30]. Two records were identified from the Swiss jumping study [31,32].
2.7. Dealing with Missing Data
Where the baseline or follow-up mean was not reported, the corresponding authors were contacted to provide these data directly. Ten studies did not provide a follow-up mean within their manuscript and were contacted for these data [18,19,24,26,32,33,34,35,36,37]. The corresponding author of two studies reported the data no longer exists [33,34]. Eight study authors did not respond to a request for data [18,19,24,26,32,35,36,37], however this was not unexpected with many studies being greater than ten years old. Where a standard deviation was not reported, yet the confidence interval was, a standard deviation was obtained using the methods described within the Cochrane Handbook for Systematic Reviews of Interventions [38]. Where no measure of deviation was provided, the standard deviation was imputed from a trial with an identical outcome measure at the closest timepoint, as recommended within the Cochrane Handbook for Systematic Reviews of Interventions [38].
2.8. Data Extraction
Data were abstracted from studies into Microsoft Excel independently by two review authors (CM/VS). Disagreements were resolved via group consensus with a senior reviewer (MM). The following information was abstracted from included studies: primary author; year of publication; country of origin; funding; competing interests; study design; study population; overall sample size; age range; details related to the intervention to complete the Template for Intervention Description and Replication (TIDieR) [39] checklist; mean (SD) age; mean (SD) weight; mean (SD) height; mean (SD) body mass index; participant sex; sample size at baseline and follow-up, mean (SD) of outcome variable (e.g., BMC) at baseline and follow-up; number of fractures.
2.9. Assessment of Methodological Quality
Two independent review authors (CM/AS) assessed the quality of included studies using the Cochrane Risk of Bias 2.0 Tool [40]. Disagreements were resolved via group consensus with a senior reviewer (MM). An overall judgement of methodological quality was assigned based on a ‘worst-item-counts’ basis with studies being assigned ‘high risk’ if at least one item was reported as “high risk”, unclear if no items are reported as ‘high risk’ and at least one item is reported as ‘unclear risk’, and ‘low risk’ if all items are reported as ‘low risk’ [41,42].
2.10. Assessment of Diversity and Heterogeneity
A Chi square test was used to evaluate statistical heterogeneity [38]. The I2 statistic informed between study heterogeneity based on the p value being <0.10 or the I2 value being >40% [38].
2.11. Assessment of Reporting Biases
The influence of small sample and publication bias were considered. Publication bias was not assessed using Egger’s test [43] due to the small number of studies (<10) included within each meta-analysis [38]. Alternatively, funnel plots were inspected when there were greater than five studies included within meta-analysis. We used the risk of bias criterion ‘sample size’ to account for small study biases, as per previous meta-analysis [44]. Where fewer than 50 participants were included, the study was classified as high-risk. Where between 50 and 200 participants were included, studies were classified as moderate risk and when greater than 200 participants were included studies were classified as low risk of small sample bias [45,46].
2.12. Data Synthesis
Data abstracted from included studies are presented within our Summary of Findings Table. The standardised mean difference (95% confidence intervals) was determined from pooled studies using random-effects, inverse variance models within Review Manager. Statistical significance was identified at p < 0.05.
2.13. Sensitivity and Subgroup Analysis
We had planned to perform sub-group analysis, however based on the limited number of studies we did not proceed with this. We performed sensitivity analysis for meta-analyses consisting of three or more studies and demonstrating statistical heterogeneity with a clear outlier. Sensitivity analysis was conducted by excluding the outlier and exploring whether that altered the significance of the meta-analysis. With the limited number of included studies, and the lack of statistical heterogeneity observed within most meta-analyses, sensitivity analysis was not performed for every meta-analysis.
2.14. Assessment of the Certainty of the Body of Evidence
We assessed the certainty of the body of evidence using the GRADE approach (as recommended in the Cochrane Handbook for Systematic Reviews of Interventions) [47]. This process involved overall judgements on the quality of the body of evidence based on the overall risk of bias, inconsistency, indirectness, imprecision and publication bias.
2.15. Deviations to Protocol
We had planned to extract components of included study interventions using the Consensus on Exercise Reporting Template (CERT) framework [48], however due to the broader nature of the interventions prescribed within included studies this was replaced with the TIDieR checklist.
3. Results
3.1. Selection of Studies
We identified 477 records following the removal of duplicates within Covidence. After title and abstract screening, 51 records proceeding to full-text review with 31 records being included within this review [13,14,16,17,18,19,20,21,22,23,24,25,26,27,28,29,30,31,32,33,34,35,36,37,49,50,51,52,53,54,55]. These 31 records represented 16 distinct clinical trials (e.g., 15 studies were follow-up publications from the original study publication). Study inclusion is demonstrated within our PRISMA flow chart (Figure 1) and a study-by-study list of exclusion is provided within Appendix C.
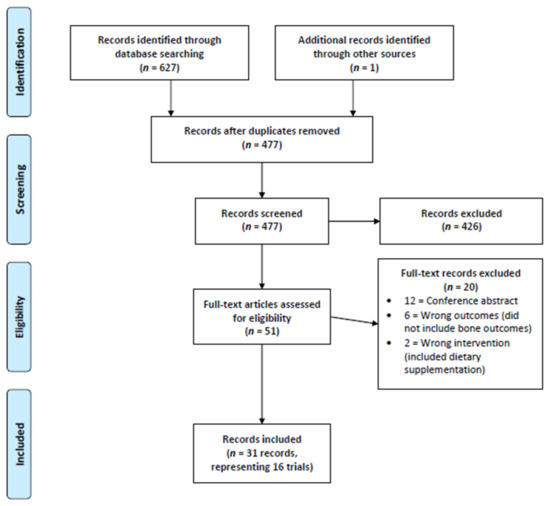
Figure 1.
PRISMA Flow Chart.
3.2. Study Information
Full study data are presented within Table 1, with funding information presented within Appendix D. Of the sixteen distinct trials, 15 were randomised [13,16,25,28,32,34,35,36,37,49,50,51,53,54,55] and one was not [52]. Of the 15 randomised trials, four were individually randomised [28,36,37,50] and eleven were cluster randomised [13,16,25,30,32,35,49,51,53,54,55]. Fifteen trials included children [13,16,25,28,32,34,35,37,49,50,51,52,53,54,55] and one trial included pre-school children [36]. One trial exclusively included overweight or obese children [37]. Trials were performed in a variety of countries: Five in the United States of America [28,34,36,37,50]; three in Canada [13,25,53]; two in Australia [51,55]; two in Denmark [35,52]; two in Switzerland [32,49]; one in South Africa [54]; and one in Sweden [16].

Table 1.
Summary of included studies.
3.3. Intervention Information
The TIDieR checklist was completed to detail all information related to the interventions provided within each included study, and is presented within Appendix E. All trials compared additional exercise interventions to standard exercise in children and pre-school children and most (11/16) trials used additional exercises specifically selected for bone adaptation, predominantly based around additional jumping exercise [13,16,25,28,32,35,36,37,49,53,55]. The duration of additional exercise interventions varied from 20 weeks to four years between studies, with all additional exercise interventions being performed face-to-face. Little equipment was needed for most studies and the interventions typically took place at school.
3.4. Effect of Exercise Interventions on Dual-Energy X-ray Absorptiometry Measures
The complete dataset for DXA outcomes are presented within Appendix F and all studies reported below assessed children, not pre-school aged children.
3.4.1. Bone Mineral Content
Meta-analysis was possible for BMC of the whole body, femoral neck, and lumbar spine (Figure 2). Only short-term femoral neck BMC was significantly improved with additional exercise interventions, when compared to standard exercise (SMD = 0.55, 95% CI 0.01 to 1.09, p < 0.05). Sensitivity analysis performed on short-term femoral neck BMC by excluding Fuchs et al. 2001 as an outlier made this result non-significant. No other measure of BMC was significantly changed with additional exercise interventions.
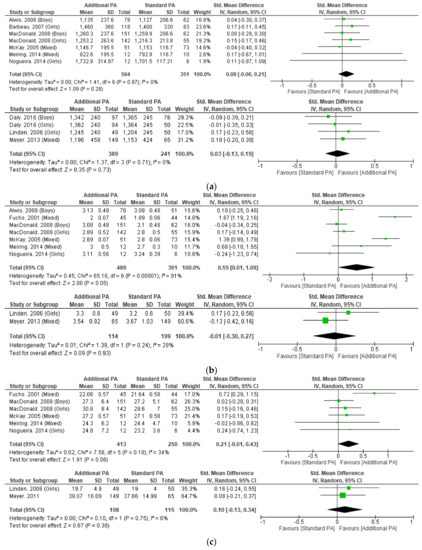
Figure 2.
(a) Effect of additional exercise interventions on whole body bone mineral content. (Top) Less than 15 months follow-up, (Bottom) 24–48 months follow-up. Legend: PA = Physical Activity, Std = standardised, IV = inverse variance, SD- standard deviation, CI = confidence interval. (b) Effect of additional exercise interventions on femoral neck bone mineral content. (Top) Less than 15 months follow-up, (Bottom) 24–48 months follow-up. Legend: PA = Physical Activity, Std = standardised, IV = inverse variance, SD- standard deviation, CI = confidence interval. (c) Effect of additional exercise interventions on lumbar spine bone mineral content. (Top) Less than 15 months follow-up, (Bottom) 24–48 months follow-up. Legend: PA = Physical Activity, Std = standardised, IV = inverse variance, SD- standard deviation, CI = confidence interval.
3.4.2. Areal Bone Mineral Density
Meta-analysis was possible for aBMD of the whole body, femoral neck and lumbar spine (Figure 3). No significant differences were detected with additional exercise interventions, when compared to standard exercise. Sensitivity analysis performed on short-term whole body and femoral neck aBMD by excluding McKay et al. 2005, which resolved heterogeneity and the results remained not significant.
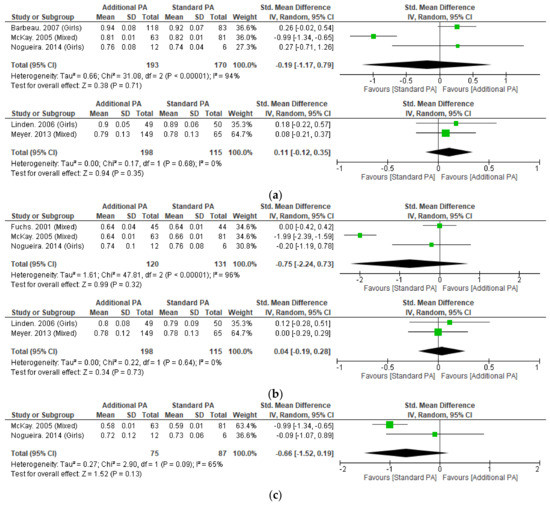
Figure 3.
(a) Effect of additional exercise interventions on whole body areal bone mineral density. (Top) Less than 15 months follow-up, (Bottom) 24–48 months follow-up. Legend: PA = Physical Activity, Std = standardised, IV = inverse variance, SD- standard deviation, CI = confidence interval. (b) Effect of additional exercise interventions on femoral neck areal bone mineral density. (Top) Less than 15 months follow-up, (Bottom) 24–48 months follow-up. Legend: PA = Physical Activity, Std = standardised, IV = inverse variance, SD- standard deviation, CI = confidence interval. (c). Effect of additional exercise interventions on lumbar spine areal bone mineral density at less than 15 months follow-up. Legend: PA = Physical Activity, Std = standardised, IV = inverse variance, SD- standard deviation, CI = confidence interval.
3.4.3. Bone Cross-Sectional Area
Meta-analysis was possible for cross-sectional area (CSA) of the femoral neck for outcomes less than 12 months (Appendix G). No significant differences were seen with additional exercise interventions, when compared to standard exercise at less than 12 months within the femoral neck. In additional to the meta-analysis, individual studies that measured CSA within the femoral neck at eight years and the lumbar spine at 6 months did not demonstrate significant differences between groups [16,17,28].
3.4.4. Bone Area and Width
Meta-analysis was not possible for any measures of bone area or width, with no significant differences being reported within the study that assessed these measures [23,27].
3.5. Effect of Exercise Interventions on Peripheral Quantitative Computed Tomography Measures
The complete dataset for pQCT outcomes is presented within Appendix H and all studies reported below assessed children, not pre-school aged children.
3.5.1. Volumetric Bone Mineral Content
Meta-analysis was possible for 4% tibial volumetric bone mineral content (vBMC) with no significant differences seen with additional exercise interventions, when compared to standard exercise (Appendix I). Meta-analysis was not possible for other measures of volumetric bone mineral content (vBMC), with no significant differences being reported within the one study that observed these measures at different sites of the tibia (14%, 38%, and 66%) [49].
3.5.2. Volumetric Bone Mineral Density
Meta-analysis was possible for tibial vBMD at 4% and 38% sites with no significant differences seen with additional exercise interventions, when compared to standard exercise (Figure 4). Individual studies of the tibia (4%, 8%, 14%, 35%, 50%, 66%) and radius (38%) also did not observe significant between-group differences [13,49,51,54,55].
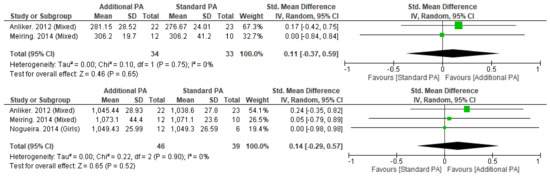
Figure 4.
Effect of additional exercise interventions on volumetric bone mineral density at less than 12 months follow-up measures. (Top) 4% Tibia, (Bottom) 38% Tibia. Legend: PA = Physical Activity, Std = standardised, IV = inverse variance, SD- standard deviation, CI = confidence interval.
3.5.3. Trabecular Bone Mineral Density
Meta-analysis was possible for 4% tibial trabecular vBMD with no significant differences seen with additional exercise interventions, when compared to standard exercise (Appendix J). In additional to the meta-analysis, one study of the radius (4%) did not observe significant between-group differences [54,55].
3.5.4. Bone Cross-Sectional Area
Meta-analysis was possible for tibial CSA at 4% and 38% sites with no significant differences seen with additional exercise interventions, when compared to standard exercise (Appendix K). Individual studies of the tibia (8%, 14%, 50%, 66%) did not observe significant between-group differences [13,49,51,54].
3.5.5. Total Cortical Area
Meta-analysis was not possible for any measures of total cortical area of the tibia (38%, 50%, 66%), with no significant differences being observed within the studies that reported these measures [13,51,54].
3.5.6. Total Cortical Thickness
Meta-analysis was not possible for any measures of total cortical thickness of the tibia (38%, 66%), with no significant differences being observed between studies that reported these measures [51,54].
3.5.7. Stress–Strain Index
Meta-analysis was possible for 38% tibial polar stress–strain index (SSIPOL) with no significant differences seen with additional exercise interventions, when compared to standard exercise (Appendix L). Individual studies of the tibia (14%, 50%, 66%) did not observe significant differences [13,49,51,54].
3.5.8. Bone Strength Index
Meta-analysis was not possible for the tibial bone strength index (4%, 8%), with no significant differences being observed within the studies that reported these measures differences [13,54].
3.5.9. Other
Meta-analysis was not possible for tibial endosteal circumference or periosteal circumference (38%). No significant differences were observed within the studies that reported these measures [54,55].
3.6. Fracture Incidence
Fracture incidence was reported in children, not preschool children, within a single trial, with four publications reporting incidence at different timepoints (Appendix M) and no significant differences at any follow-up time point (Figure 5) [18,19,20,24].
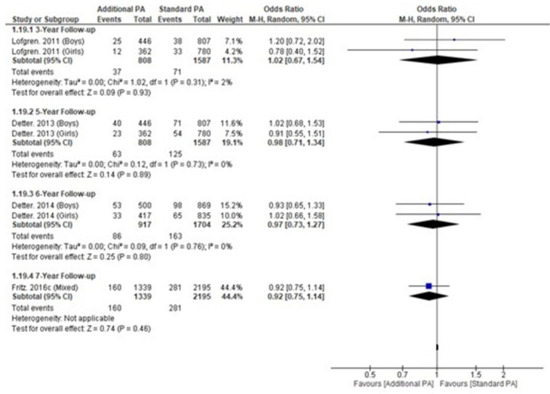
Figure 5.
Fracture incidence within a single longitudinal trial over time.
3.7. Assessment of Quality in Included Studies
All studies were judged to be at high-risk of bias with the overall risk of bias judgements presented within Appendix N. Risk of bias arising from the randomisation process was low in 88% of included studies. Risk of bias arising from the timing of identification or recruitment of participants into the randomised trial was low in all studies (100%). No studies reported a low risk of bias due to deviations from the intended interventions (effect of assignment to intervention). One study was judged as low risk (6%) for risk of bias due to deviations from the intended interventions (effect of adhering to intervention). Risk of bias due to missing outcome data was low for 94% of studies. All studies were low risk (100%) for risk of bias in measurement of the outcome and risk of bias in selection of the reported result. Finally, funnel plots were inspected for all meta-analyses with greater than five included studies and did not indicate any evidence of publication bias.
3.8. Assessment of the Certainty of the Body of Evidence
This systematic review and meta-analysis included randomised and non-randomised controlled clinical trials, with the initial level of evidence (before GRADE judgements) classified as high. Study limitations, from risk of bias, downgraded the certainty of the evidence once. As most meta-analyses reported the majority of individual study confidence intervals crossing zero, minimal heterogeneity was seen between studies, and if present could be resolved by the exclusion of a single study. Thus, the certainty was not downgraded for inconsistency. Trials included similar populations, interventions and outcome measures, so the certainty of the evidence was not downgraded for indirectness. Trials included samples unlikely to be large enough to detect between group effect sizes and the certainty of the evidence was downgraded two levels for imprecision. There was no publication bias detected via funnel plots and the certainty of the evidence was not downgraded for publication bias. The overall certainty of the evidence was judged to be very low, meaning little confidence exists in the reported effect sizes and that the true effects are likely to be substantially different from those reported.
4. Discussion
This systematic review and meta-analysis analysis demonstrated that the addition of existing exercise interventions in children did not result in significant improvements to bone health. This review was only able to identify a single study that assessed the effect on bone health in pre-school children (aged between 2–5 years) and they did not report sufficient data for analysis. Finally, due to risk of bias due to deviations from the intended interventions and measurement of outcomes, all studies were at high risk of bias and the overall quality of the evidence was very low.
Femoral neck BMC significantly improved at <15-month follow-up with additional exercise interventions in children, however this result did not remain significant following sensitivity analysis. Whole-body and lumbar spine BMC did not significantly change at any follow-up timepoint with the additional exercise interventions. Additional exercise interventions also failed to significantly improve aBMD at the femoral neck, lumbar spine or whole-body.
No significant improvements were observed in tibial vBMD at any level with additional exercise interventions. However, vBMD may not be an overly specific measure and has been shown to be unable to differentiate between female and male Australian Football players [56]. Despite significant differences between Australian Football Men’s and Women’s players according to other musculoskeletal morphological characteristics (e.g., bone mass, cross-sectional area and robustness), vBMD (measured via pQCT) was unable to differentiate between cohorts. Furthermore, despite being one of the universal measures of hard-tissue health, BMD may have limited utility in evaluating bone health and strength [57].
A number of additional measures of bone strength were assessed using pQCT. No significant improvements were observed in trabecular vBMD, CSA, cortical area, cortical thickness or SSIPOL with additional exercise interventions. This was a relatively unexpected finding as longitudinal exercise has resulted in favourable hard-tissue improvements in adult athletes previously [56,58]. Specifically, elite male athletes exhibit superior hard-tissue characteristics in their support leg versus their kicking leg, which is likely due to the different loading patterns between limbs [56]. The support limb typically experiences more frequent impacts as it acts as the stabilising leg during kicking actions and is typically the dominant single-leg jumping and landing leg [58]. Furthermore, greater hard-tissue asymmetry between kicking and support limbs was found in experienced athletes over younger inexperienced athletes, further illustrating the positive effect of longitudinal specific exercise loading on bone health. However, the addition of exercise interventions in children within this systematic review did not result in favourable improvements in hard-tissue characteristics.
These findings suggest, at least in children aged 6–12 years, that either normal growth and development, or standard exercise associated with school and childhood may be sufficient to increase the hard-tissue characteristics of bone, as significant within-group improvements over time were observed in both intervention and control groups in all studies. It may be that the magnitude of change in hard-tissue characteristics through standard exercise and normal human physical development was adequate and any additional exercise interventions could not produce any further improvements in hard-tissue as the physiological plateau was already reached. Alternatively, another explanation is that the additional exercise interventions were insufficient in producing positive osteogenic effects beyond what children were already being exposed to in standard exercise programs. However, the lack of data in children aged 2–5 years was unexpected as this is a group that have not yet commenced formal exercise interventions within school.
The results of our review do not align with the conclusions of previous systematic reviews in this field, with sharp contrasts in the findings of our meta-analyses. One reason might be that the meta-analysis performed by Behringer et al. 2014 [3] pooled all studies that measured bone health (e.g., pooled different anatomical locations), with follow-up ranging from 6–208 weeks, creating a much larger sample (2985 participants including 1640 intervention participants) providing more statistical power to analysis, whereas our largest meta-analysis contained 915 total participants. However, we feel that breaking up timepoints and regions as we have in this review, provides a far more accurate representation of the outcomes from exercise interventions.
No difference in fracture incidence was observed with additional exercise interventions in children in the single trial that recorded fracture incidence. This may be due to the lack of observable increases in bone health observed within our meta-analysis. Alternatively, other measures of bone strength not measured by either DXA or pQCT may have a greater link with fracture incidence. The use of nuclear magnetic resonance spectroscopy, which provides a far more detailed overview of bone structure and quality when compared to standard DXA or pQCT, might be informative in future studies. Alternatively, high-resolution pQCT (HR-pQCT) measures of hard-tissue characteristics were found to predict fracture in two separate systematic reviews [59,60]. However, prediction of fracture was observed to be stronger in the radius, rather than the tibia [59]. This may be problematic as radius fracture is likely the result of contact/impact, rather than overuse, which is distinct from the tibia, being a weight-bearing bone. It must also be noted that the lack of fracture incidence in children undertaking standard exercise may be due to the increased exercise levels being inherently associated with increased exposure to potentially risky physical activities (e.g., basketball), placing the children undertaking additional exercise interventions at higher risk of fracture.
With most studies at high risk of bias due to deviations from the intended interventions, future research should attempt to design and report their interventions in accordance with the TIDieR [39] and/or CERT checklists [48]. This will increase transparency [61,62] and ensure any tailoring or modifications to interventions are planned, recorded and accounted for within any analysis. Furthermore, adherence, including adherence to the control group protocol, was not recorded in all studies or factored into analysis, and this may have influenced outcomes [61,62]. In addition to adherence to the planned intervention, general physical activity should be considered to influence the results and future studies using activity trackers might provide greater insight into the role of exercise interventions for bone health.
Adverse events are an essential reporting element of clinical trials [63] but were not reported within included studies. Subsequently, not allowing us to discuss any potential adverse events associated with additional exercise interventions to inform discussion on the benefits of its implementation. One of the main drivers of apophysitis or bone stress injury is an overload of impact exercise [64]. Therefore, studies that increase exercise levels beyond standard physical activity should report adverse events. For example, if a future study was to demonstrate a small effect for additional exercise interventions in bone health, the benefits of implementing this study need to balance how many participants presented with injuries, such as apophysitis, as a direct result of the intervention to determine if it is worthwhile.
Limitations
Several studies did not respond to requests for missing data or advised that data was no longer available, which was expected due to the age of many included studies, with measures of variability being inputted when data was missing as per Cochrane recommendations [38].
Unfortunately, not all studies provided separate outcomes by participant sex, which is important due to bone growth rate differences. However, given all but one study was randomized (and the non-randomized study provided separate data for boys and girls) we would not expect this to have influenced the results.
The DXA and pQCT procedures were not consistently reported between studies, and some differences did exist in assessment methodologies. However, given our meta-analysis included between-group differences (with the procedure for all groups within an individual study being the same), we would not expect this to have influenced the results.
5. Conclusions
The addition of exercise interventions, beyond what is provided to children, does not appear to improve DXA and pQCT measures of bone health. The effect of additional exercise interventions on bone health in pre-school children is largely unknown. Future trials should ensure adherence is clearly reported and controlled for within analysis as well as including reports of adverse events (e.g., apophysitis) that occurs due to increased exercise interventions.
Author Contributions
M.C.M., A.S. and J.C.W. designed the review. M.C.M. and C.M. performed all screening. V.S. and C.M. performed all extraction. C.M. and A.S. performed all RoB assessment. M.C.M. performed analysis. All authors (C.M., A.S., J.C.W., V.S., P.C., N.H.H. and M.C.M.) have read and agreed to the published version of the manuscript.
Funding
This research received no external funding.
Institutional Review Board Statement
Not applicable.
Informed Consent Statement
Not applicable.
Data Availability Statement
The complete dataset for this review is presented across the tables and appendices.
Acknowledgments
C.M. and V.S. are supported by an Australian Government Research Training Program Scholarship at Edith Cowan University.
Conflicts of Interest
The authors declare no conflict of interest.
Appendix A. Systematic Review Search Strategy
| Search Item | Combiners | Terms |
| 1 | Problem of Interest | Fracture OR dual-energy x-ray absorptiometry OR DXA OR bone mineral density OR peripheral Quantitative Computed Tomography OR pQCT OR bone density OR trabecular area OR cortical area OR bone mineral content OR periosteal size OR endosteal size OR cortical thickness OR bone mass OR bone strength OR skeletal age assessment |
| 2 | Participants | Child* OR youth* OR juvenile OR minor OR kid |
| 3 | Participants | Physical OR activity OR exercise OR athletics OR recreation OR play OR games OR training OR gym OR resistance training OR workout OR practice |
| 4 | Exclusion | review OR meta-analysis |
| 5 | Number #1 AND #2 AND #3 NOT #4 | |
| Limitations | Clinical Trial, Humans, English, Child, Preschool Child |
Appendix B. Search Strategy Documentation
| Database | Date of Search | Search Strategy Used (Keywords & Boolean) | Search Limits or Filters (e.g., Dates, Language) | Number of Results Found | Comments |
| PUBMED | 3 May 2022 | (Child * OR youth * OR juvenile OR minor OR kid) AND (Physical OR activity OR exercise OR athletics OR recreation OR play OR games OR training OR gym OR resistance training OR workout OR practice) AND (Fracture OR dual-energy X-ray absorptiometry OR DXA OR bone mineral density OR peripheral Quantitative Computed Tomography OR pQCT OR bone density OR trabecular area OR cortical area OR bone mineral content OR periosteal size OR endosteal size OR cortical thickness OR bone mass OR bone strength OR skeletal age assessment) NOT (review OR meta-analysis) | Clinical Trial, Humans, English, Child (6–12), Preschool Child (2–5), Title/abstract | 236 | Exported to End Note |
| CINAHL (Full Text) | 3 May 2022 | (Child * OR youth * OR juvenile OR minor OR kid) AND (Physical OR activity OR exercise OR athletics OR recreation OR play OR games OR training OR gym OR resistance training OR workout OR practice) AND (Fracture OR dual-energy X-ray absorptiometry OR DXA OR bone mineral density OR peripheral Quantitative Computed Tomography OR pQCT OR bone density OR trabecular area OR cortical area OR bone mineral content OR periosteal size OR endosteal size OR cortical thickness OR bone mass OR bone strength OR skeletal age assessment) NOT (review OR meta-analysis) | Research article, Humans, Peer-reviewed, English, Child (6–12), Preschool Child (2–5), Title | 53 | Exported to End Note |
| CENTRAL | 3 May 2022 | (Child * OR youth * OR juvenile OR minor OR kid) AND (Physical OR activity OR exercise OR athletics OR recreation OR play OR games OR training OR gym OR resistance training OR workout OR practice) AND (Fracture OR dual-energy X-ray absorptiometry OR DXA OR bone mineral density OR peripheral Quantitative Computed Tomography OR pQCT OR bone density OR trabecular area OR cortical area OR bone mineral content OR periosteal size OR endosteal size OR cortical thickness OR bone mass OR bone strength OR skeletal age assessment) NOT (review OR meta-analysis) | Trial, title | 55 | Exported to End Note |
| SportsDISCUS | 3 May 2022 | (Child * OR youth * OR juvenile OR minor OR kid) AND (Physical OR activity OR exercise OR athletics OR recreation OR play OR games OR training OR gym OR resistance training OR workout OR practice) AND (Fracture OR dual-energy X-ray absorptiometry OR DXA OR bone mineral density OR peripheral Quantitative Computed Tomography OR pQCT OR bone density OR trabecular area OR cortical area OR bone mineral content OR periosteal size OR endosteal size OR cortical thickness OR bone mass OR bone strength OR skeletal age assessment) NOT (review OR meta-analysis) | Peer-reviewed, title | 40 | Exported to End Note |
| Web of Science | 3 May 2022 | (((TI = (Fracture OR dual-energy X-ray absorptiometry OR DXA OR bone mineral density OR peripheral Quantitative Computed Tomography OR pQCT OR bone density OR trabecular area OR cortical area OR bone mineral content OR periosteal size OR endosteal size OR cortical thickness OR bone mass OR bone strength OR skeletal age assessment)) AND TI = (Child * OR youth * OR juvenile OR minor OR kid)) AND TI = (Physical OR activity OR exercise OR athletics OR recreation OR play OR games OR training OR gym OR resistance training OR workout OR practice)) NOT TI = (review OR meta-analysis) | Nil | 243 | Exported to End Note |
| Key Journals | 3 May 2022 | N/A | N/A | 1 | |
| TOTAL | 628 | ||||
Appendix C. Study-by-Study Exclusion Judgements
| Study Author | Year | Title | Exclusion Reason |
| Allerton | 2008 | Physical Activity is Positively Related to Bone Mineral Density in Prepubertal Youth. | Conference abstract |
| Clark | 2007 | Vigorous physical activity at age 9 increases the risk of childhood fractures, despite increasing bone mass. | Conference abstract |
| Cole | 2010 | Physical activity is associated with increased volumetric bone density and bone strength in early childhood. | Conference abstract |
| Coster | 2014 | Increased Physical Activity during Growth Improves Muscular Development without Affecting Fracture Risk—a Four-Year Prospective Controlled Exercise Intervention Study in 2525 Children. | Conference abstract |
| Fritz | 2014 | A School-based Seven Year Exercise Intervention Program in 6–9-Year-Old Children Improve Skeletal Traits without Increasing the Fracture Risk—A Population-Based Prospective Controlled Study in 3534 Children. | Conference abstract |
| Fritz | 2015 | Increased physical activity in childhood reduces fracture risk—An 8-year intervention study in 3534 children. | Conference abstract |
| Janz | 2003 | Physical activity intensities and femoral neck strength in young children: The Iowa bone development study. | Conference abstract |
| MacKelvie | 2003 | A school-based exercise intervention elicits substantial bone health benefits: a 2-year randomized controlled trial in girls. | Conference abstract |
| Naka | 2005 | A two-year longitudinal study on the relationship between sports activity and bone mass gain in Japanese boys and girls: Kyoto Kids Increase Density in the Skeleton Study (Kyoto KIDS Study). | Conference abstract |
| Naka | 2007 | A two-year longitudinal study on the relationship between the effective time of sports activity and bone mineral density in Japanese girls: Kyoto kids increase density in the skeleton study (Kyoto KIDS Study). | Conference abstract |
| Tamaki | 2005 | Effect of physical activity in elementary school on bone mineral density in Japanese children and adolescents: A 3-year longitudinal study. | Conference abstract |
| Tamaki | 2006 | Which element of physical activity is more important for determining peak bone mass in Japanese children and adolescents, the period, frequency, or active duration per each activity? | Conference abstract |
| Cohen | 2017 | Bone Health is Maintained, While Fat Mass is Reduced in Pre-pubertal Children with Obesity Participating in a 1-Year Family-Centered Lifestyle Intervention. | Wrong intervention (included dietary supplementation) |
| Yu | 2005 | Effects of strength training on body composition and bone mineral content in children who are obese. | Wrong intervention (included dietary supplementation) |
| Alberga | 2013 | The effects of resistance exercise training on body composition and strength in obese prepubertal children. | Wrong outcomes (did not include bone outcomes) |
| Comeras-Chueca | 2022 | Active Video Games Improve Muscular Fitness and Motor Skills in Children with Overweight or Obesity. | Wrong outcomes (did not include bone outcomes) |
| Davis | 2012 | Exercise dose and diabetes risk in overweight and obese children: a randomized controlled trial. | Wrong outcomes (did not include bone outcomes) |
| Dias | 2018 | Effect of High-Intensity Interval Training on Fitness, Fat Mass and Cardiometabolic Biomarkers in Children with Obesity: A Randomised Controlled Trial. | Wrong outcomes (did not include bone outcomes) |
| Klakk | 2013 | Effect of four additional physical education lessons on body composition in children aged 8–13 year—a prospective study during two school years. | Wrong outcomes (did not include bone outcomes) |
| Yin | 2012 | The impact of a 3-year after-school obesity prevention program in elementary school children. | Wrong outcomes (did not include bone outcomes) |
Appendix D. Study funding and conflicts of interest
| Study | Funding | Conflict of Interest |
| Alwis. 2008 | Swedish Research Council, Centre for Athletic Research, Osterlund Foundation, Kock Foundation, Region Skane Foundation. | None declared. |
| Anliker. 2012 | Swiss Federal Sports Commission Grant. | None declared. |
| Barbeau. 2007 | National Institutes of Health (NIH) Grant. | None declared. |
| Daly. 2016 | Commonwealth Education Trust, Canberra Hospital Salaried Staff Specialists. | None declared. |
| Fuchs. 2001 | National Institute of Health Grant, Division of National Institute of Arthiritis and Musculoskeletal diseases. | None declared. |
| Gutin. 2008 | National Institute of Health (NIH). | None declared. |
| Hasselstrom. 2008 | Danish Heart Foundation, National Board of Health, Danish Ministry of Health, Danish Ministry of Culture, Danish Sport Association. | None declared. |
| Larsen. 2016 | Nordea Fonden, Aase and Ejnar Danielsens Foundation, Augustinus Fonden, FIFA Medical Assessment and Research Centre, Danish Football Association, Danish Ministry of Culture. | None declared. |
| Macdonald. 2007 | British Columbia Ministry of Health, 2010 Legacies Now, BC Ministry of Tourism, Sport and Arts, Canadian Institutes of Health Research. | None declared. |
| MacKelvie. 2001 | British Columbia Health Research Foundation, Michael Smith Foundation for Health Research. | None declared. |
| McKay. 2000 | Canadian Institutes of Health Research and the Michael Smith Foundation for Health Research. | None declared. |
| Meiring. 2014 | Carnegie Corporation, Medical Research Council of South Africa, Sugar Association of South Africa. | None declared. |
| Meyer. 2011 | Swiss Federal Office of Sports, Swiss National Science Foundation. | None declared. |
| Nogueira. 2014 | None declared. | None declared. |
| Specker. 2004 | National Institutes of Health Grant. | None declared. |
| Staiano. 2018 | American Heart Association, NORC Centre, National Institute of Diabetes and Digestive and Kidney Diseases. | None declared. |
Appendix E. Template for Intervention Description and Replication (TIDieR) Checklist Items
| Study | Materials | Procedures | Provider | Delivery | Intervention location | Dosage (Sets, Reps) | Dosage (Frequency/Week) | Dosage (Duration in Weeks) | Tailoring | Modifications | Adherence |
| Alwis. 2008 | None | Extra Activity, running, jumping, climbing to 200min/week | School teachers | Face to face | Unspecified | NR | 5/week | 2 years | No | No | N/A |
| Anliker. 2012 | None | 10 min jumping | School teachers | Face to face—class setting | Unspecified | 60–150 jumps | 2/week | 36 | No | No | N/A |
| Barbeau. 2007 | None | Skills development, MVPA, stretching, toning | Classroom teachers, assistant teachers and a research staff member | Face to face—class setting | Unspecified | NR | 5/week | 40 weeks | No | No | Students could not miss 3 sessions in a row |
| Daly. 2016 | None | General PA | Specialist Teacher from Bluearth Foundation | Face to face—class setting | Not specified | NR | 2/week | 35 weeks/year for 4 years | No | No | High |
| Fuchs. 2001 | 61cm Box | Current practice plus 20 min—3 times/week | Laboratory Researcher + 4 trained instructors | Face to Face | Gym | 100 jumps per session | 3 times/week for 20 min | 7 months | No | 50 jumps per session were started with, and slowly progressed to 100 jumps by the 5th week | N/A |
| Gutin. 2008 | None | 80 min/day, 5 days per week | Qualified Physical Trainers | Face-to-face | Gym | NR | 5/week | 3 years | No | No | 44% |
| Hasselstrom. 2008 | None | Extra PE classes—180 min/week | Qualified Physical Trainers | Face-to-face | School | NR | 2/week | 3 years | No | No | N/A |
| Larsen. 2016 (Small-sided games) | None | 3 v 3 football, basketball, floorball or other | Qualified University Trainers | Face-to-face | School | NR | 3/week | 10 months | No | No | N/A |
| Larsen. 2016 (Circuit training) | None | 50% was 30 s effort, 45 s rest, 6–10 stations. Plyos, strength, etc. 50% was games with strength, etc. | Qualified University Trainers | Face-to-face | School | NR | 3/week | 10 months | No | No | N/A |
| Macdonald. 2007 | Classroom Action Bin | Standard curriculum—2 × 40 min PE classes + 15 min per day of random activities + 9 min per day of jumping activities | Normal teachers | Face-to-face | School | NR | 5/week (school days) | 11 months dosage (14 months until follow-up) | No | No | No |
| MacKelvie. 2001 | None | School curriculum with 10–12 min diverse weight bearing activity during normal class, plus 10–12 min on an extra day. Activities included circuit training with 5 different jumping activities with GRF that ranged from 3.5–5 times body weight. Children progressed from 50 to 100 jumps per session across 10 weeks. A higher proportion of high-impact jumps were utilised in the second year of intervention | Normal teachers | Face to face | School | 50–100 jumps per session | 3/week | 20 months | No | No | No |
| McKay. 2000 | None | School curriculum with 10–30 min within each PE class + one extra day—minimum 10 min loading which focused on jumping. 10 DBL tuck jumps before each class. Bench jumping and circuit training were added as the intervention progressed | Classroom teachers | Face to face | School | 10 tuck jumps to start the class + exercise intervention | 3/week | 8 months | No | No | N/A |
| Meiring. 2014 | None | School curriculum + 2 × 45 min sessions—Exercise circuit with 5 activities | Classroom teachers or after school care teachers | Face-to-face | Sports field | 45 min | 2/week | 20 weeks | No | No | N/A |
| Meyer. 2011 | None | School curriculum + 2 additional PE classes (5 total)—At least 10 min of jumping activities. Additionally, included short activity breaks in the middle of normal class, plus students had physical activity homework to complete | School teachers | Face to face | School + home | NR | 5/week | 9 months | No | No | N/A |
| Nogueira. 2014 | None | School curriculum + 10 min of continuous high-intensity movements of medium to high impact at various speeds—jumps, hops, squats, lunges, handstands, cartwheels | Trained Instructor | Face to face | School | NR | 3/week | 9 months | No | No | N/A |
| Specker. 2004 | None | 30 min of moderate vigorous activity, which focused on jumping, hopping, skipping on every school day | Childcare teachers | Face to face | Childcare/School | NR | 5/week | 12 months | No | No | 72% |
| Staiano. 2018 | Kinect and XBOX 360 gaming console, 24-week XBOX live subscription and 4 exercise games | 3 times weekly playing exergames on XBOX—10 min per session in Week 1, increasing by 10 min each session each week, sustaining at 60 min per session after Week 6 | Parent/Guardian | Face to face | Home | NR | 3/week | 24 weeks | No | No | 94.40% |
Appendix F. Dual X-ray Absorptiometry
| Outcome | Timepoint (Weeks) | Study | Girls (Baseline)- Mean (SD), n | Girls (Follow-up)- Mean (SD), n | Boys (Baseline)- Mean (SD), n | Boys (Follow-up)- Mean (SD), n | All (Baseline)- Mean (SD), n | All (Follow-up)- Mean (SD), n | ||||||
| INT | CON | INT | CON | INT | CON | INT | CON | INT | CON | INT | CON | |||
| BMC (Whole Body) | 20 | Meiring. 2014 | 778.40 (164.00), 12 | 753.70 (103.60), 10 | 822.60 (195.50), 12 | 792.90 (116.70), 10 | ||||||||
| BMC (Whole Body) | 32 | McKay. 2005 | 1054.00 (97.00), 51 | 1047.00 (169.00), 73 | 1146.70 (NR), 51 | 1153.00 (NR), 73 | ||||||||
| BMC (Whole Body) | 36 | Nogueira. 2014 | 1523.67 (225.67), 12 | 1561.67 (87.44), 6 | 1732.80 (314.97), 12 | 1701.50 (117.21), 6 | ||||||||
| BMC (Whole Body) | 40 | Barbeau. 2007 | 1260.00 (310.00), 118 | 1230.00 (280.00), 83 | 1460.00 (360.00), 118 | 1400.00 (330.00), 83 | ||||||||
| BMC (Whole Body) | 52 | Alwis. 2008 | 991.00 (84.00), 80 | 980.00 (74.00), 57 | 1135.00 (NR), 78 | 1127.00 (NR), 54 | ||||||||
| BMC (Whole Body) | 60 | Macdonald. 2008 | 1040.30 (213.20), 142 | 1003.50 (159.10), 55 | 1253.20 (263.60), 142 | 1216.30 (213.80), 55 | 1078.60 (193.10), 151 | 1098.10 (178.10), 62 | 1260.30 (237.60), 151 | 1259.90 (206.60), 62 | ||||
| BMC (Whole Body) | 104 | Linden. 2006 | 939.00 (153.00), 49 | 933.00 (181.00), 50 | 1245.00 (240.00), 49 | 1204.00 (245.00), 50 | ||||||||
| BMC (Whole Body) | 156 | Meyer. 2013 | 732.00 (223.00), 149 | 750 (257.00), 65 | 1196.00 (458.00), 149 | 1153.00 (424.00), 65 | ||||||||
| BMC (Whole Body) | 208 | Daly. 2016 | 886.00 (101.00), 192 | 909.00 (114.00), 170 | 1362.00 (NR), 94 | 1364.00 (NR), 69 | 933.00 (116.00), 206 | 956.00 (117.00), 159 | 1342.00 (NR), 97 | 1365.00 (NR), 76 | ||||
| BMC (Whole Body) | 364 | Fritz. 2016b | 614.00 (132.00), 72 | 607.00 (142.00), 45 | 1828.00 (NR), 72 | 1745.00 (NR), 45 | 646.00 (151.00), 100 | 671.00 (144.00), 47 | 1986.00 (NR), 100 | 2005.00 (NR), 47 | ||||
| BMC (Whole Body) | 416 | Coster. 2016 | 609.00 (132.00) | 612.00 (145.00), 39 | 1986.00 (365.00), 65 | 1840.00 (384.00), 39 | 650.00 (151.00), 93 | 681.00 (140.00), 37 | 2210.00 (513.00), 93 | 2292.00 (473.00), 37 | ||||
| BMC (Total Hip) | 20 | Meiring. 2014 | 17.60 (4.90), 12 | 16.30 (2.90), 10 | 18.70 (5.50), 12 | 16.50 (3.10), 10 | ||||||||
| BMC (Total Hip) | 156 | Meyer. 2013 | 14.37 (5.59), 149 | 14.72 (5.69), 65 | 24.98 (10.80), 149 | 23.53 (8.37), 65 | ||||||||
| BMC (Total Hip) | 364 | Gunter. 2008 | 10.60 (2.96), 14 | 10.10 (1.37), 8 | 31.26 (5.4), 11 | 30.15 (3.38), 7 | 11.64 (2.33), 19 | 10.89 (2.53), 16 | 39.93 (9.56), 18 | 39.31 (9.93), 13 | ||||
| BMC (Radius) | 20 | Meiring. 2014 | 3.60 (0.80), 12 | 3.40 (0.50), 10 | 3.80 (0.80), 12 | 3.60 (0.60), 10 | ||||||||
| BMC (Ulna) | 20 | Meiring. 2014 | 2.50 (0.60), 12 | 2.30 (0.40), 10 | 2.70 (0.60), 12 | 2.50 (0.40), 10 | ||||||||
| BMC (Forearm) | 156 | Hasselstrom. 2008 | 1.75 (0.26), 135 | 1.77 (0.29), 76 | 2.14 (0.34), 135 | 2.12 (0.40), 76 | 1.92 (0.30), 135 | 1.97 (0.31), 62 | 2.33 (0.38), 135 | 2.35 (0.45), 62 | ||||
| BMC (Calcaneus) | 156 | Hasselstrom. 2008 | 0.77 (0.23), 135 | 0.77 (0.21), 76 | 1.26 (0.27), 135 | 1.29 (0.25), 76 | 0.75 (0.24), 135 | 0.8 (0.23), 62 | 1.38 (0.25), 135 | 1.35 (0.26), 62 | ||||
| BMC (Leg) | 104 | Linden. 2006 | 283.90 (60.70), 49 | 282.70 (72.50), 50 | 430.30 (105.10), 49 | 409.80 (106.60), 50 | ||||||||
| BMC (Inter- trochanteric) | 32 | McKay. 2005 | 10.60 (2.20), 51 | 10.20 (2.20), 73 | 12.10 (NR), 51 | 11.40 (NR), 73 | ||||||||
| BMC (Greater trochanter) | 32 | McKay. 2005 | 2.90 (0.90), 51 | 2.70 (0.80), 73 | 3.50 (NR), 51 | 3.25 (NR), 73 | ||||||||
| BMC (Greater trochanter) | 364 | Gunter. 2008 | 2.47 (0.84), 14 | 2.13 (0.54), 8 | 8.31 (1.42), 11 | 7.49 (1.05), 7 | 2.54 (0.68), 19 | 2.24 (0.59), 16 | 11.11 (2.62), 18 | 10.91 (2.54), 13 | ||||
| BMC (Proximal Femur) | 32 | McKay. 2005 | 16.20 (3.40), 51 | 15.60 (3.20), 73 | 18.50 (NR), 51 | 17.50 (NR), 73 | ||||||||
| BMC (Proximal Femur) | 60 | Macdonald. 2008 | 15.20 (3.50), 142 | 14.40 (2.90), 55 | 19.00 (4.50), 142 | 18.40 (4.00), 55 | 16.10 (3.40), 151 | 16.00 (3.00), 62 | 19.60 (4.50), 151 | 19.60 (3.90), 62 | ||||
| BMC (Femoral Neck) | 20 | Meiring. 2014 | 2.90 (0.50), 12 | 2.70 (0.40), 10 | 3.00 (0.50), 12 | 2.70 (0.3), 10 | ||||||||
| BMC (Femoral Neck) | 28 | Fuchs. 2001 | 1.84 (0.07), 45 | 1.82 (0.06), 44 | 2.00 (0.07), 45 | 1.89 (0.06), 44 | ||||||||
| BMC (Femoral Neck) | 32 | McKay. 2005 | 2.70 (0.40), 51 | 2.60 (0.40), 73 | 2.89 (NR), 51 | 2.80 (NR), 73 | ||||||||
| BMC (Femoral Neck) | 36 | Nogueira. 2014 | 2.77 (0.45), 12 | 3.05 (0.28), 6 | 3.11 (0.56), 12 | 3.24 (0.39), 6 | ||||||||
| BMC (Femoral Neck) | 52 | Alwis. 2008 | 2.90 (0.60), 80 | 2.8 (0.50), 57 | 3.13 (NR), 76 | 3.08 (NR), 51 | ||||||||
| BMC (Femoral Neck) | 60 | Macdonald. 2008 | 2.52 (0.42), 142 | 2.47 (0.38), 55 | 2.89 (0.52), 142 | 2.80 (0.50), 55 | 2.79 (0.43), 151 | 2.83 (0.41), 62 | 3.08 (0.48), 151 | 3.10 (0.48), 62 | ||||
| BMC (Femoral Neck) | 104 | Linden. 2006 | 2.60 (0.60), 49 | 2.70 (0.60), 50 | 3.30 (0.60), 49 | 3.20 (0.60), 50 | ||||||||
| BMC (Femoral Neck) | 156 | Meyer. 2013 | 2.33 (0.77), 149 | 2.39 (0.78), 65 | 3.54 (0.92), 65 | 3.67 (1.03), 149 | ||||||||
| BMC (Femoral Neck) | 364 | Gunter. 2008 | 1.59 (0.37), 14 | 1.50 (0.37), 8 | 4.18 (0.53), 11 | 4.21 (0.53), 7 | 1.89 (0.38), 19 | 1.79 (0.40), 16 | 4.92 (0.88), 18 | 4.72 (0.93), 13 | ||||
| BMC (Femoral Neck) | 364 | Fritz. 2016b | 2.50 (0.50), 72 | 2.60 (0.60), 45 | 4.90 (NR), 72 | 4.60 (NR), 45 | 2.80 (0.60), 100 | 2.80 (0.50), 47 | 5.10 (NR), 100 | 5.20 (NR), 47 | ||||
| BMC (Femoral Neck) | 364 | Fritz. 2016c | 2.70 (0.60), 172 | 2.70 (0.60), 92 | 5.10 (NR), 172 | 4.90 (NR), 92 | ||||||||
| BMC (Femoral Neck) | 416 | Coster. 2016 | 2.50 (0.60), 65 | 2.60 (0.60), 39 | 5.20 (0.90), 65 | 4.80 (1.10), 39 | 2.80 (0.60), 93 | 2.90 (0.50), 37 | 5.60 (1.10), 93 | 5.80 (1.00), 37 | ||||
| BMC (L3) | 52 | Alwis. 2008 | 5.30 (1.10), 80 | 5.60 (1.00), 57 | 6.02 (NR), 76 | 6.18 (NR), 51 | ||||||||
| BMC (L3) | 104 | Linden. 2006 | 5.00 (1.00), 49 | 5.30 (1.20), 50 | 6.70 (1.60), 49 | 6.30 (1.40), 50 | ||||||||
| BMC (Lumbar Spine) | 20 | Meiring. 2014 | 23.10 (4.60), 12 | 23.40 (4.60), 10 | 24.30 (6.20), 12 | 24.40 (4.70), 10 | ||||||||
| BMC (Lumbar Spine) | 28 | Fuchs. 2001 | 20.10 (0.51), 45 | 20.39 (0.55), 44 | 22.06 (0.57), 45 | 21.64 (0.58), 44 | ||||||||
| BMC (Lumbar Spine) | 32 | McKay. 2005 | 24.60 (5.10), 51 | 24.30 (4.40), 73 | 27.20 (NR), 51 | 27.10 (NR), 73 | ||||||||
| BMC (Lumbar Spine) | 36 | Nogueira. 2014 | 20.40 (4.20), 12 | 21.10 (3.00), 6 | 24.80 (7.20), 12 | 23.20 (3.60), 6 | ||||||||
| BMC (Lumbar Spine) | 60 | Macdonald. 2008 | 24.00 (6.10), 142 | 23.20 (4.90), 55 | 30.80 (8.40), 142 | 29.6 (7.00), 55 | 23.10 (4.90), 151 | 23.60 (4.30), 62 | 27.30 (6.40), 151 | 27.20 (5.10), 62 | ||||
| BMC (Lumbar Spine) | 104 | Linden. 2006 | 15.20 (3.10), 49 | 15.50 (3.30), 50 | 19.70 (4.90), 49 | 19.00 (4.00), 50 | ||||||||
| BMC (Femoral Neck) | 156 | Meyer. 2013 | 22.26 (6.10), 149 | 22.99 (7.09), 65 | 39.07 (16.09), 149 | 37.86 (14.99), 65 | ||||||||
| BMC (Lumbar Spine) | 364 | Fritz. 2016b | 82.40 (19.10), 72 | 77.00 (17.60), 45 | 242.6 (NR), 72 | 227.80 (NR), 45 | 84.80 (21.40), 100 | 85.20 (17.50), 47 | 232.50 (NR), 100 | 232.80 (NR), 47 | ||||
| BMC (Lumbar Spine) | 364 | Fritz. 2016c | 83.80 (20.50), 172 | 81.30 (17.90), 92 | 236.70 (NR), 172 | 230.40 (NR), 92 | ||||||||
| BMC (Lumbar Spine) | 416 | Coster. 2016 | 82.60 (19.30), 65 | 77.70 (17.40), 39 | 266.30 (50.60), 65 | 245.5 (50.80), 39 | 85.60 (21.60), 93 | 86.70 (17.30), 37 | 261.00, 69.60), 93 | 267.50 (65.10), 37 | ||||
| Bone Area (Whole Body) | 32 | McKay. 2005 | 1232.00 (178.00), 51 | 1228.00 (153.00), 73 | 1308.70 (NR), 51 | 1323.60 (NR), 73 | ||||||||
| Bone Area (Femoral Neck) | 32 | McKay. 2005 | 4.00 (0.40), 51 | 4.00 (0.30), 73 | 4.15 (NR), 51 | 4.16 (NR), 73 | ||||||||
| Bone Area (Greater trochanter) | 32 | McKay. 2005 | 5.30 (1.20), 51 | 5.10 (1.10), 73 | 6.06 (NR), 51 | 5.83 (NR), 73 | ||||||||
| Bone Area (Inter-trochanteric) | 32 | McKay. 2005 | 13.95 (1.90), 51 | 13.60 (1.60), 73 | 15.15 (NR), 51 | 14.50 (NR), 73 | ||||||||
| Bone Area (Femur) | 32 | McKay. 2005 | 23.30 (3.00), 51 | 22.70 (2.60), 73 | 25.40 (NR), 51 | 24.50 (NR), 73 | ||||||||
| Bone Area (Lumbar Spine) | 32 | McKay. 2005 | 39.20 (4.50), 51 | 38.50 (4.40), 73 | 41.50 (NR), 51 | 40.90 (NR), 73 | ||||||||
| Bone Area (Forearm) | 156 | Hasselstrom. 2008 | 6.28 (0.71), 135 | 6.31 (0.72), 76 | 7.42 (0.82), 135 | 7.29 (0.84), 76 | 6.66 (0.68), 135 | 6.78 (0.59), 62 | 7.49 (0.82), 135 | 7.58 (0.84), 62 | ||||
| Bone Area (Calcaneus) | 156 | Hasselstrom. 2008 | 2.44 (0.64), 135 | 2.43 (0.54), 76 | 3.08 (0.44), 135 | 3.11 (0.43), 76 | 2.38 (0.67), 135 | 2.53 (0.61), 62 | 3.38 (0.40), 135 | 3.38 (0.44), 62 | ||||
| CSA (Femoral Neck) | 28 | Fuchs. 2001 | 2.99 (0.08), 45 | 2.89 (0.06), 44 | 3.13 (0.08), 45 | 2.96 (0.07), 44 | ||||||||
| CSA (Femoral Neck) | 52 | Alwis. 2008 | 1.02 (0.2), 80 | 1.0 (0.17), 57 | 1.10 (NR), 73 | 1.09 (NR), 48 | ||||||||
| CSA (Femoral Neck) | 416 | Coster. 2016 | 3.50 (0.40), 65 | 3.60 (0.50), 39 | 5.00 (0.40), 65 | 4.90 (0.60), 39 | 3.60 (0.40), 93 | 3.60 (0.30), 37 | 5.40 (0.50), 93 | 5.40 (0.60), 37 | ||||
| CSA (Lumbar Spine) | 28 | Fuchs. 2001 | 36.43 (0.67), 45 | 37.25 (0.68), 44 | 38.44 (0.68), 45 | 38.91 (0.66), 44 | ||||||||
| CSA (Lumbar Spine) | 416 | Coster. 2016 | 27.50 (3.20), 65 | 27.90 (3.60), 39 | 50.00 (5.20), 65 | 48.30 (5.50), 39 | 29.10 (3.50), 93 | 29.90 (3.40), 37 | 54.50 (7.80), 93 | 55.50 (7.10), 37 | ||||
| Width (L3) | 104 | Linden. 2006 | 2.86 (0.24), 49 | 2.91 (0.27), 50 | 3.14 (0.28), 49 | 3.08 (0.26), 50 | ||||||||
| Width (Femoral Neck) | 104 | Linden. 2006 | 2.43 (0.24), 49 | 2.48 (0.32), 50 | 2.76 (0.32), 49 | 2.67 (0.27), 50 | ||||||||
| aBMD (Whole Body) | 32 | McKay. 2005 | 0.78 (0.01), 63 | 0.81 (0.01), 81 | 0.81 (0.01), 63 | 0.82 (0.01), 81 | ||||||||
| aBMD (Whole Body) | 36 | Nogueira. 2014 | 0.71 (0.06), 12 | 0.73 (0.02), 6 | 0.76 (0.08), 12 | 0.74 (0.04), 6 | ||||||||
| aBMD (Whole Body) | 40 | Barbeau. 2007 | 0.89 (0.07), 118 | 0.88 (0.06), 83 | 0.94 (0.08), 118 | 0.92 (0.07), 83 | ||||||||
| aBMD (Whole Body) | 104 | Linden. 2006 | 0.84 (0.04), 49 | 0.84 (0.05), 50 | 0.90 (0.05), 49 | 0.89 (0.06), 50 | ||||||||
| aBMD (Whole Body) | 156 | Meyer. 2013 | 0.65 (0.10), 149 | 0.65 (0.11), 65 | 0.79 (0.13), 149 | 0.78 (0.13), 65 | ||||||||
| aBMD (Whole Body) | 364 | Fritz. 2016b | 0.68 (0.05), 72 | 0.68 (0.05), 45 | 0.98 (NR), 72 | 0.95 (NR), 45 | 0.69 (0.05), 100 | 0.70 (0.06), 47 | 0.98 (NR), 100 | 0.99 (NR), 47 | ||||
| aBMD (Whole Body) | 416 | Coster. 2016 | 0.68 (0.05), 65 | 0.68 (0.05), 39 | 1.02 (0.08), 65 | 0.98 (0.09), 39 | 0.69 (0.05), 93 | 0.7 (0.05), 37 | 1.03 (0.11), 93 | 1.05 (0.1), 37 | ||||
| aBMD (Forearm) | 156 | Hasselstrom. 2008 | 0.28 (0.03), 135 | 0.28 (0.03), 76 | 0.29 (0.03), 135 | 0.29 (0.04), 76 | 0.29 (0.03), 135 | 0.29 (0.03), 62 | 0.31 (0.04), 135 | 0.31 (0.04), 62 | ||||
| aBMD (Calcaneus) | 156 | Hasselstrom. 2008 | 0.32 (0.05), 135 | 0.32 (0.05), 76 | 0.41 (0.06), 135 | 0.41 (0.06), 76 | 0.32 (0.04), 135 | 0.31 (0.04), 62 | 0.41 (0.05), 135 | 0.4 (0.06), 62 | ||||
| aBMD (Leg) | 104 | Linden. 2006 | 0.76 (0.06), 49 | 0.76 (0.07), 50 | 0.88 (0.08), 49 | 0.85 (0.09), 50 | ||||||||
| aBMD (Femur) | 32 | McKay. 2005 | 0.63 (0.01), 63 | 0.66 (0.01), 81 | 0.66 (0.01), 63 | 0.68 (0.01), 81 | ||||||||
| aBMD (Greater Trochanter) | 32 | McKay. 2005 | 0.52 (0.01), 63 | 0.53 (0.01), 81 | 0.54 (0.01), 63 | 0.55 (0.01), 81 | ||||||||
| aBMD (Hip) | 156 | Meyer | 0.68 (0.09), 149 | 0.69 (0.10), 65 | 0.83 (0.15), 149 | 0.83 (0.14), 65 | ||||||||
| aBMD (Femoral Neck) | 28 | Fuchs. 2001 | 0.61 (0.01), 45 | 0.62 (0.01), 44 | 0.64 (0.01), 45 | 0.64 (0.01), 44 | ||||||||
| aBMD (Femoral Neck) | 32 | McKay. 2005 | 0.62 (0.01), 63 | 0.64 (0.01), 81 | 0.64 (0.01), 63 | 0.66 (0.01), 81 | ||||||||
| aBMD (Femoral Neck) | 36 | Nogueira. 2014 | 0.67 (0.08), 12 | 0.71 (0.06), 6 | 0.74 (0.10), 12 | 0.76 (0.08), 6 | ||||||||
| aBMD (Femoral Neck) | 104 | Linden. 2006 | 0.72 (0.09), 49 | 0.71 (0.10), 50 | 0.80 (0.08), 49 | 0.79 (0.09), 50 | ||||||||
| aBMD (Femoral Neck) | 156 | Meyer. 2013 | 0.65 (0.09), 149 | 0.66 (0.10), 65 | 0.78 (0.12), 149 | 0.78 (0.13), 65 | ||||||||
| aBMD (Femoral Neck) | 364 | Fritz. 2016b | 0.71 (0.09), 72 | 0.70 (0.09), 45 | 1.01 (NR), 72 | 0.96 (NR), 45 | 0.78 (0.11), 100 | 0.78 (0.12), 47 | 1.00 (NR), 100 | 1.01 (NR), 47 | ||||
| aBMD (Femoral Neck) | 364 | Fritz. 2016c | 0.75 (0.10), 172 | 0.74 (0.11), 92 | 1.00 (NR), 172 | 0.99 (NR), 92 | ||||||||
| aBMD (Femoral Neck) | 416 | Coster. 2016 | 0.71 (0.1), 65 | 0.70 (0.09), 39 | 1.04 (0.13), 65 | 0.98 (0.14), 39 | 0.78 (0.11), 93 | 0.79 (0.12), 37 | 1.03 (0.14), 93 | 1.07 (0.15), 37 | ||||
| aBMD (L3) | 104 | Linden. 2006 | 0.70 (0.08), 49 | 0.71 (0.08), 50 | 0.77 (0.09), 49 | 0.76 (0.09), 50 | ||||||||
| aBMD (Lumbar Spine) | 32 | McKay. 2005 | 0.57 (0.01), 63 | 0.58 (0.01) | 0.58 (0.01), 63 | 0.59 (0.01), 81 | ||||||||
| aBMD (Lumbar Spine) | 36 | Nogueira. 2014 | 0.65 (0.09), 12 | 0.69 (0.07), 6 | 0.72 (0.12), 12 | 0.73 (0.06), 6 | ||||||||
| aBMD (Lumbar Spine) | 156 | Meyer | 0.59 (0.10), 149 | 0.60 (0.11), 65 | 0.78 (0.16), 149 | 0.77 (0.17), 65 | ||||||||
| aBMD (Total Spine) | 28 | Fuchs. 2001 | 0.55 (0.01), 45 | 0.54 (0.01), 44 | 0.57 (0.01), 45 | 0.55 (0.01), 44 | ||||||||
| aBMD (Total Spine) | 104 | Linden. 2006 | 0.69 (0.08), 49 | 0.70 (0.08), 50 | 0.76 (0.09), 49 | 0.75 (0.08), 50 | ||||||||
| aBMD (Total Spine) | 364 | Fritz. 2016c | 0.68 (0.06), 72 | 0.69 (0.07), 45 | 0.99 (NR), 72 | 0.96 (NR), 45 | 0.68 (0.07), 100 | 0.69 (0.06), 47 | 0.93 (NR), 100 | 0.92 (NR), 47 | ||||
| aBMD (Total Spine) | 364 | Fritz. 2016c | 0.68 (0.06), 172 | 0.69 (0.06), 92 | 0.96 (NR), 172 | 0.94 (NR),92 | ||||||||
| aBMD (Total Spine) | 416 | Coster. 2016 | 0.68 (0.06), 65 | 0.69 (0.07), 39 | 1.05 (0.12), 65 | 0.99 (0.11), 39 | 0.68 (0.07), 93 | 0.70 (0.06), 37 | 0.98 (0.13), 93 | 1.00 (0.12), 37 | ||||
| Legend: INT = Intervention group, CON = Control group, BMC = Bone mineral Content, L3 = Third Lumbar Vertebrae, CSA = Cross-sectional Area, aBMD = areal bone mineral density. NR = not reported. Notes: Data from Detter. 2013, Detter. 2014, Gutin. 1999, Gutin. 2008, Larsen. 2016, Lofgren. 2011, MacKelvie. 2004, Meyer. 2011, Specker. 2004 and Staiano. 2018 were not included as they did not provide raw follow-up values. Data from Fuchs. 2002 was not presented as it represents a subsample of Fuchs 2001 at the same time-point. | ||||||||||||||
Appendix G

Figure A1.
Effect of Additional Exercise Interventions on Femoral Neck Cross-Sectional Area at Less than 15 Months Follow-up. Legend: PA = Physical Activity, Std = standardised, IV = inverse variance, SD- standard deviation, CI = confidence interval.
Figure A1.
Effect of Additional Exercise Interventions on Femoral Neck Cross-Sectional Area at Less than 15 Months Follow-up. Legend: PA = Physical Activity, Std = standardised, IV = inverse variance, SD- standard deviation, CI = confidence interval.

Appendix H. Peripheral Quantitative Computed Tomography
| Outcome | Timepoint (Weeks) | Study | Girls (Baseline)- Mean (SD), n | Girls (Follow-up)- Mean (SD), n | Boys (Baseline)- Mean (SD), n | Boys (Follow-up)- Mean (SD), n | All (Baseline)- Mean (SD), n | All (Follow-up)- Mean (SD), n | ||||||
| INT | CON | INT | CON | INT | CON | INT | CON | INT | CON | INT | CON | |||
| vBMC (Tibia 4%) | 36 | Anliker. 2012 | 2.05 (0.45), 22 | 2.19 (0.37), 23 | 2.26 (0.52), 22 | 2.35 (0.35), 23 | ||||||||
| vBMC (Tibia 4%) | 36 | Nogueira. 2014 | 176.16 (28.16), 12 | 199.38 (19.19), 6 | 186.28 (21.67), 12 | 197.21 (19.76), 6 | ||||||||
| vBMC (Tibia 14%) | 36 | Anliker. 2012 | 1.53 (0.35), 22 | 1.56 (0.20), 23 | 1.66 (0.36), 22 | 1.68 (0.24), 23 | ||||||||
| vBMC (Tibia 38%) | 36 | Anliker. 2012 | 2.10 (0.43), 22 | 2.19 (0.30), 23 | 2.27 (0.48), 22 | 2.35 (0.35), 23 | ||||||||
| vBMC (Tibia 66%) | 36 | Anliker. 2012 | 2.34 (0.49), 22 | 2.38 (0.49), 23 | 2.55 (0.53), 22 | 2.58 (0.41), 23 | ||||||||
| vBMC (Radius 4%) | 36 | Nogueira. 2014 | 41.20 (6.65), 12 | 48.40 (10.91), 6 | 52.66 (11.17), 12 | 50.41 (5.160), 6 | ||||||||
| vBMD (Tibia 4%) | 20 | Meiring. 2014 | 304.60 (22.10), 12 | 319.60 (46.70), 10 | 306.20 (19.70), 12 | 306.20 (41.20), 10 | ||||||||
| vBMD (Tibia 4%) | 36 | Anliker. 2012 | 277.33 (28.89), 22 | 275.76 (25.78), 23 | 281.15 (28.52), 22 | 276.67 (24.01), 23 | ||||||||
| vBMD (Tibia 8%) | 60 | Macdonald. 2007 | 298.20 (36.40), 126 | 292.80 (32.30), 63 | 310.30 (41.40), 126 | 300.90 (34.60), 136 | 303.50 (30.40), 136 | 311.60 (32.20), 60 | 305.60 (29.90), 136 | 309.80 (34.00), 60 | ||||
| vBMD (Tibia 14%) | 36 | Anliker. 2012 | 978.39 (23.97), 22 | 964.78 (24.70), 23 | 984.40 (23.97), 22 | 972.43 (28.16), 23 | ||||||||
| vBMD (Tibia 38%) | 20 | Meiring. 2014 | 1059.80 (51.40), 12 | 1071.10 (27.00), 10 | 1073.10 (44.40), 12 | 1071,10 (23.60), 10 | ||||||||
| vBMD (Tibia 38%) | 36 | Nogueira. 2014 | 1032.96 (34.67), 12 | 1046.33 (25.57), 6 | 1049.43 (25.99), 12 | 1049.30 (26.59), 6 | ||||||||
| vBMD (Tibia 38%) | 36 | Anliker. 2012 | 1041.94 (29.04), 22 | 1032.58 (26.22), 23 | 1045.44 (28.93), 22 | 1038.60 (27.80), 23 | ||||||||
| vBMD (Tibia 50%) | 60 | Macdonald. 2007 | 1057.20 (33.70), 134 | 1058.60 (29.90), 64 | 1073.40 (35.80), 134 | 1067.00 (32.80), 64 | 1047.50 (35.80), 142 | 1046.00 (30.60), 64 | 1047.30 (35.70), 142 | 1046.00 (35.80), 64 | ||||
| vBMD (Tibia 66%) | 36 | Anliker. 2012 | 1018.85 (22.48), 22 | 1006.00 (20.42), 23 | 1027.21 (24.82), 22 | 1012.78 (23.63), 23 | ||||||||
| vBMD (Tibia 66%) | 208 | Daly. 2016 | 1013.00 (34.00), 192 | 1016.00 (37.00), 170 | 1048.00 (NR), 94 | 1046.00 (NR), 69 | 1004.00 (36.00), 206 | 1015.00 (36.00), 159 | 1027.00 (NR), 97 | 1027.00 (NR), 76 | ||||
| vBMD (Radius 38%) | 36 | Nogueira 2014 | 992.41 (42.25), 12 | 1004.74 (34.50), 6 | 1019.50 (32.61), 12 | 1008.04 (25.94), 6 | ||||||||
| Trabecular BMD (Tibia 4%) | 20 | Meiring. 2014 | 270.20 (29.20), 12 | 291.40 (59.10), 10 | 277.20 (24.60), 12 | 264.10 (54.10), 10 | ||||||||
| Trabecular BMD (Tibia 4%) | 36 | Nogueira 2014 | 232.64 (26.05), 12 | 243.05 (10.15), 6 | 230.38 (26.63), 12 | 233.60 (10.74), 6 | ||||||||
| Trabecular BMD (Radius 4%) | 36 | Nogueira 2014 | 218.32 (29.85), 12 | 219.56 (19.12), 6 | 230.23 (22.75), 12 | 224.08 (23.39), 6 | ||||||||
| Total Bone CSA (Tibia 4%) | 20 | Meiring. 2014 | 802.00 (136.90), 12 | 738.50 (86.80), 10 | 847.80 (146.30), 12 | 741.30 (99.70), 10 | ||||||||
| Total Bone CSA (Tibia 4%) | 36 | Anliker. 2012 | 734.07 (128.55), 22 | 794.13 (126.25), 23 | 798.10 (137.15), 22 | 851.35 (115.98), 23 | ||||||||
| Total Bone CSA (Tibia 8%) | 60 | Macdonald. 2007 | 509.70 (74.70), 126 | 503.40 (80.00), 63 | 561.80 (77.60), 126 | 569.10 (90.90), 63 | 552.40 (88.20), 136 | 548.10 (88.10), 60 | 626.20 (100.60), 136 | 625.30 (94.70), 60 | ||||
| Total Bone CSA (Tibia 14%) | 36 | Anliker. 2012 | 327.57 (64.04), 22 | 353.48 (51.90), 23 | 356.60 (66.71), 22 | 382.02 (52.85), 23 | ||||||||
| Total Bone CSA (Tibia 38%) | 20 | Meiring. 2014 | 294.90 (48.80), 12 | 269.20 (19.00), 10 | 304.10 (48.20), 12 | 279.40 (21.60), 10 | ||||||||
| Total Bone CSA (Tibia 38%) | 36 | Anliker. 2012 | 278.57 (56.89), 22 | 286.37 (38.35), 23 | 297.59 (57.45), 22 | 304.75 (43.72), 23 | ||||||||
| Total Bone CSA (Tibia 50%) | 60 | Macdonald. 2007 | 322.10 (51.60), 134 | 312.40 (53.70), 64 | 352.40 (54.20), 134 | 345.70 (56.90), 64 | 335.50 (54.00), 142 | 340.50 (49.90), 64 | 374.10 (62.10), 142 | 376.80 (58.60), 64 | ||||
| Total Bone CSA (Tibia 66%) | 36 | Anliker. 2012 | 422.56 (98.46), 22 | 426.30 (53.77), 23 | 441.48 (102.22), 22 | 446.86 (61.95), 23 | ||||||||
| Total Bone CSA (Tibia 66%) | 208 | Daly. 2016 | 335.00 (51.00), 192 | 339.00 (58.00), 170 | 432.00 (NR), 94 | 459.00 (NR), 69 | 354.00 (61.00), 206 | 343.00 (58.00), 159 | 440.00 (NR), 97 | 450.00 (NR), 76 | ||||
| Total Cortical Area (Tibia 38%) | 20 | Meiring. 2014 | 165.70 (26.10), 12 | 160.90 (17.50), 10 | 170.20 (25.00), 12 | 170.10 (17.20), 10 | ||||||||
| Total Cortical Area (Tibia 50%) | 60 | Macdonald. 2007 | 211.00 (33.10), 134 | 205.20 (36.50), 64 | 236.50 (37.50), 134 | 232.20 (41.60), 64 | 219.10 (36.00), 142 | 221.40 (30.60), 64 | 249.30 (42.80), 142 | 249.10 (36.60), 64 | ||||
| Total Cortical Area (Tibia 66%) | 208 | Daly. 2016 | 150.00 (20.00), 192 | 154.00 (21.00), 170 | 232.00 (NR), 94 | 228.00 (NR), 69 | 145.00 (22.00), 206 | 154.00 (22.00), 159 | 237.00 (NR), 97 | 232.00 (NR), 76 | ||||
| Total Cortical Thickness (Tibia 38%) | 20 | Meiring. 2014 | 3.40 (0.20), 12 | 3.30 (0.10), 10 | 3.40 (0.30), 12 | 3.40 (0.10), 10 | ||||||||
| Total Cortical Thickness (Tibia 66%) | 208 | Daly. 2016 | 2.69 (0.37), 192 | 2.75 (0.33), 170 | 3.94 (NR), 94 | 3.75 (NR), 69 | 2.71 (0.41), 206 | 2.72 (0.41), 159 | 4.00 (NR), 97 | 3.83 (NR), 76 | ||||
| SSIPol (Tibia 14%) | 36 | Anliker. 2012 | 781.82 (248.63), 22 | 827.60 (161.14), 23 | 892.35 (270.53), 22 | 933.32 (190.72), 23 | ||||||||
| SSIPol (Tibia 38%) | 20 | Meiring. 2014 | 840.90 (180.70), 12 | 761.60 (77.30), 10 | 888.70 (187.10), 12 | 808.50 (99.00), 10 | ||||||||
| SSIPol (Tibia 38%) | 36 | Anliker. 2012 | 819.54 (239.80), 22 | 859.78 (174.23), 23 | 921.72 (269.10), 22 | 950.26 (205.84), 23 | ||||||||
| SSIPol (Tibia 50%) | 60 | Macdonald. 2007 | 954.40 (218.80), 134 | 915.50 (221.30), 64 | 1124.30 (251.50), 134 | 1093.50 (264.50), 64 | 1006.10 (241.40), 142 | 1029.80 (211.60), 64 | 1204.20 (295.50), 142 | 1208.00 (250.40), 64 | ||||
| SSIPol (Tibia 66%) | 36 | Anliker. 2012 | 1290.15 (421.74), 22 | 1282.57 (251.26), 23 | 1419.45 (481.47), 22 | 1417.32 (303.63), 23 | ||||||||
| SSIPol (Tibia 66%) | 208 | Daly. 2016 | 905.00 (170.00), 192 | 943.00 (204.00), 170 | 1454.00 (NR), 94 | 1543.00 (NR), 69 | 974.00 (210.00), 206 | 937.00 (200.00), 159 | 1481.00 (NR), 97 | 1495.00 (NR), 76 | ||||
| Bone Strength Index (Tibia 4%) | 20 | Meiring. 2014 | 7503.60 (1753.10), 12 | 7685.40 (2470.60), 10 | 7978.20 (1688.10), 12 | 7095.60 (2270.70), 10 | ||||||||
| Bone Strength Index (Tibia 8%) | 60 | Macdonald. 2007 | 4562.30 (1178.70), 126 | 4351.20 (1136.00), 63 | 5470.20 (1524.40), 126 | 5193.20 (1383.60), 63 | 5087.50 (1074.20), 136 | 5322.70 (1136.70), 60 | 5855.50 (1254.50), 136 | 6005.40 (1290.10), 60 | ||||
| Periosteal Circumference (Tibia 38%) | 20 | Meiring. 2014 | 59.40 (3.30), 12 | 59.60 (1.80), 10 | 60.70 (3.80), 12 | 60.20 (1.60), 10 | ||||||||
| Endosteal Circumference (Tibia 38%) | 20 | Meiring. 2014 | 38.30 (2.70), 12 | 38.80 (1.10), 10 | 39.10 (3.00), 12 | 39.20 (1.00), 10 | ||||||||
Appendix I

Figure A2.
Effect of Additional Exercise Intervention on Volumetric Bone Mineral Content within the Tibia (4%) at Less than 12 Months Follow-up. Legend: PA = Physical Activity, Std = standardised, IV = inverse variance, SD- standard deviation, CI = confidence interval.
Figure A2.
Effect of Additional Exercise Intervention on Volumetric Bone Mineral Content within the Tibia (4%) at Less than 12 Months Follow-up. Legend: PA = Physical Activity, Std = standardised, IV = inverse variance, SD- standard deviation, CI = confidence interval.

Appendix J

Figure A3.
Effect of additional exercise interventions on trabecular bone mineral density within the Tibia (4%) at less than 12 months follow-up. Legend: PA = Physical Activity, Std = standardised, IV = inverse variance, SD- standard deviation, CI = confidence interval.
Figure A3.
Effect of additional exercise interventions on trabecular bone mineral density within the Tibia (4%) at less than 12 months follow-up. Legend: PA = Physical Activity, Std = standardised, IV = inverse variance, SD- standard deviation, CI = confidence interval.

Appendix K

Figure A4.
Effect of Additional Exercise Interventions on bone cross-sectional area at less than 12 months follow-up measures. (Top) 4% Tibia, (Bottom) 38%Tibia. Legend: PA = Physical Activity, Std = standardised, IV = inverse variance, SD- standard deviation, CI = confidence interval.
Figure A4.
Effect of Additional Exercise Interventions on bone cross-sectional area at less than 12 months follow-up measures. (Top) 4% Tibia, (Bottom) 38%Tibia. Legend: PA = Physical Activity, Std = standardised, IV = inverse variance, SD- standard deviation, CI = confidence interval.

Appendix L

Figure A5.
Effect of additional exercise interventions on the polar stress–strain index within the Tibia (38%) at less than 12 months follow-up. Legend: PA = Physical Activity, Std = standardised, IV = inverse variance, SD- standard deviation, CI = confidence interval.
Figure A5.
Effect of additional exercise interventions on the polar stress–strain index within the Tibia (38%) at less than 12 months follow-up. Legend: PA = Physical Activity, Std = standardised, IV = inverse variance, SD- standard deviation, CI = confidence interval.

Appendix M. Fracture Incidence within the Malmo POP Trial
| Timepoint (Years) | Study | Girls (INT) | Girls (CONT) | Boys (INT) | Boys (CONT) | All (INT) | All (CONT) | ||||||
| Fractures (n) | Sample (n) | Fractures (n) | Sample (n) | Fractures (n) | Sample (n) | Fractures (n) | Sample (n) | Fractures (n) | Sample (n) | Fractures (n) | Sample (n) | ||
| 3 | Lofgren. 2011 | 12 | 362 | 33 | 780 | 25 | 446 | 38 | 807 | ||||
| 5 | Detter. 2013 | 23 | 362 | 54 | 780 | 40 | 446 | 71 | 807 | ||||
| 6 | Detter. 2014 | 33 | 417 | 65 | 835 | 53 | 500 | 98 | 869 | ||||
| 7 | Fritz. 2016c | 160 | 1339 | 281 | 2195 | ||||||||
Appendix N. Risk of Bias Assessment
| Study | Risk of Bias Arising from the Randomisation Process | Risk of Bias Arising from the Timing of Identification or Recruitment of Participants in a Cluster-Randomised Trial | Risk of Bias Due to Deviations from the Intended Interventions (Effect of Assignment to Intervention) | Risk of Bias Due to Deviations from the Intended Interventions (Effect of Adhering to Intervention) | Risk of Bias Due to Missing Outcome Data | Risk of Bias in Measurement of the Outcome | Risk of Bias in Selection of the Reported Result | Overall Risk of Bias |
| Alwis. 2008 | High | Low | High | High | Low | Low | Low | High |
| Anliker. 2012 | Low | Low | High | High | Low | Low | Low | High |
| Barbeau. 2007 | Low | Low | High | High | Low | Low | Low | High |
| Daly. 2016 | Low | Low | High | Low | Low | Low | Low | High |
| Fuchs. 2001 | Low | Low | High | High | Low | Low | Low | High |
| Gutin. 2008 | Low | Low | High | High | Low | Low | Low | High |
| Hasselstrom. 2008 | High | Low | High | High | Low | Low | Low | High |
| Larsen. 2016 | Low | Low | High | High | Low | Low | Low | High |
| Macdonald. 2007 | Low | Low | High | High | Low | Low | Low | High |
| MacKelvie. 2001 | Low | Low | High | High | Low | Low | Low | High |
| McKay. 2000 | Low | Low | High | High | Low | Low | Low | High |
| Meiring. 2014 | Low | Low | High | High | Low | Low | Low | High |
| Meyer. 2011 | Low | Low | High | High | Low | Low | Low | High |
| Nogueira. 2014 | Low | Low | High | High | High | Low | Low | High |
| Specker. 2004 | Low | Low | High | High | Low | Low | Low | High |
| Staiano. 2018 | Low | Low | High | High | Low | Low | Low | High |
| Legend: INT = Intervention group, CON = Control group, vBMC = Volumetric bone mineral Content, CSA = Cross-sectional Area, vBMD = volumetric bone mineral, density, SSIPol = polar stress strain index. | ||||||||
References
- Weaver, C.M.; Gordon, C.M.; Janz, K.F.; Kalkwarf, H.J.; Lappe, J.M.; Lewis, R.; O’Karma, M.; Wallace, T.C.; Zemel, B.S. The National Osteoporosis Foundation’s position statement on peak bone mass development and lifestyle factors: A systematic review and implementation recommendations. Osteoporos. Int. 2016, 27, 1281–1386. [Google Scholar] [CrossRef] [PubMed]
- Gunter, K.B.; Almstedt, H.C.; Janz, K.F. Physical activity in childhood may be the key to optimizing lifespan skeletal health. Exerc. Sport Sci. Rev. 2012, 40, 13–21. [Google Scholar] [CrossRef] [PubMed]
- Behringer, M.; Gruetzner, S.; McCourt, M.; Mester, J. Effects of weight-bearing activities on bone mineral content and density in children and adolescents: A meta-analysis. J. Bone Miner. Res. Off. J. Am. Soc. Bone Miner. Res. 2014, 29, 467–478. [Google Scholar] [CrossRef] [PubMed]
- Nikander, R.; Sievänen, H.; Heinonen, A.; Daly, R.M.; Uusi-Rasi, K.; Kannus, P. Targeted exercise against osteoporosis: A systematic review and meta-analysis for optimising bone strength throughout life. BMC Med. 2010, 8, 47. [Google Scholar] [CrossRef]
- Nogueira, R.C.; Weeks, B.K.; Beck, B.R. Exercise to improve pediatric bone and fat: A systematic review and meta-analysis. Med. Sci. Sports Exerc. 2014, 46, 610–621. [Google Scholar] [CrossRef]
- Tan, V.P.; Macdonald, H.M.; Kim, S.; Nettlefold, L.; Gabel, L.; Ashe, M.C.; McKay, H.A. Influence of physical activity on bone strength in children and adolescents: A systematic review and narrative synthesis. J. Bone Miner. Res. Off. J. Am. Soc. Bone Miner. Res. 2014, 29, 2161–2181. [Google Scholar] [CrossRef]
- Golden, N.H.; Abrams, S.A.; Nutrition, C.O.; Daniels, S.R.; Abrams, S.A.; Corkins, M.R.; de Ferranti, S.D.; Golden, N.H.; Magge, S.N.; Schwarzenberg, S.J. Optimizing Bone Health in Children and Adolescents. Pediatrics 2014, 134, e1229–e1243. [Google Scholar] [CrossRef]
- Hart, N.H.; Newton, R.U.; Tan, J.; Rantalainen, T.; Chivers, P.; Siafarikas, A.; Nimphius, S. Biological basis of bone strength: Anatomy, physiology and measurement. J. Musculoskelet. Neuronal Interact. 2020, 20, 347–371. [Google Scholar]
- World Health Organization. Global Recommendations on Physical Activity for Health; World Health Organization: Geneva, Switzerland, 2010. [Google Scholar]
- Australian Institute of Health and Welfare. Australia’s Children; Australian Institute of Health and Welfare: Canberra, Australia, 2020. [Google Scholar]
- Jenkins, M.; Nimphius, S.; Hart, N.H.; Chivers, P.; Rantalainen, T.; Rueter, K.; Borland, M.L.; McIntyre, F.; Stannage, K.; Siafarikas, A. Appendicular fracture epidemiology of children and adolescents: A 10-year case review in Western Australia (2005 to 2015). Arch Osteoporos 2018, 13, 63. [Google Scholar] [CrossRef]
- Ireland, A.; Rittweger, J. Exercise for osteoporosis: How to navigate between overeagerness and defeatism. J. Musculoskelet. Neuronal Interact. 2017, 17, 155–161. [Google Scholar]
- Macdonald, H.M.; Kontulainen, S.A.; Khan, K.M.; McKay, H.A. Is a school-based physical activity intervention effective for increasing tibial bone strength in boys and girls? J. Bone Miner. Res. Off. J. Am. Soc. Bone Miner. Res. 2007, 22, 434–446. [Google Scholar] [CrossRef] [PubMed]
- Macdonald, H.M.; Kontulainen, S.A.; Petit, M.A.; Beck, T.J.; Khan, K.M.; McKay, H.A. Does a novel school-based physical activity model benefit femoral neck bone strength in pre- and early pubertal children? Osteoporos. Int. 2008, 19, 1445–1456. [Google Scholar] [CrossRef] [PubMed]
- Page, M.J.; McKenzie, J.E.; Bossuyt, P.M.; Boutron, I.; Hoffmann, T.C.; Mulrow, C.D.; Shamseer, L.; Tetzlaff, J.M.; Akl, E.A.; Brennan, S.E.; et al. The PRISMA 2020 statement: An updated guideline for reporting systematic reviews. BMJ 2021, 372, n71. [Google Scholar] [CrossRef] [PubMed]
- Alwis, G.; Linden, C.; Stenevi-Lundgren, S.; Ahlborg, H.G.; Besjakov, J.; Gardsell, P.; Karlsson, M.K. A one-year exercise intervention program in pre-pubertal girls does not influence hip structure. BMC Musculoskelet. Disord. 2008, 9, 9. [Google Scholar] [CrossRef] [PubMed]
- Coster, M.E.; Rosengren, B.E.; Karlsson, C.; Dencker, M.; Karlsson, M.K. Effects of an 8-year childhood physical activity intervention on musculoskeletal gains and fracture risk. Bone 2016, 93, 139–145. [Google Scholar] [CrossRef]
- Detter, F.; Rosengren, B.E.; Dencker, M.; Lorentzon, M.; Nilsson, J.; Karlsson, M.K. A 6-year exercise program improves skeletal traits without affecting fracture risk: A prospective controlled study in 2621 children. J. Bone Miner. Res. Off. J. Am. Soc. Bone Miner. Res. 2014, 29, 1325–1336. [Google Scholar] [CrossRef]
- Detter, F.T.; Rosengren, B.E.; Dencker, M.; Nilsson, J.; Karlsson, M.K. A 5-year exercise program in pre- and peripubertal children improves bone mass and bone size without affecting fracture risk. Calcif. Tissue Int. 2013, 92, 385–393. [Google Scholar] [CrossRef]
- Fritz, J.; Cöster, M.E.; Nilsson, J.; Rosengren, B.E.; Dencker, M.; Karlsson, M.K. The associations of physical activity with fracture risk--a 7-year prospective controlled intervention study in 3534 children. Osteoporos. Int. 2016, 27, 915–922. [Google Scholar] [CrossRef]
- Fritz, J.; Cöster, M.E.; Stenevi-Lundgren, S.; Nilsson, J.; Dencker, M.; Rosengren, B.E.; Karlsson, M.K. A 5-year exercise program in children improves muscle strength without affecting fracture risk. Eur. J. Appl. Physiol. 2016, 116, 707–715. [Google Scholar] [CrossRef]
- Fritz, J.; Rosengren, B.E.; Dencker, M.; Karlsson, C.; Karlsson, M.K. A seven-year physical activity intervention for children increased gains in bone mass and muscle strength. Acta Paediatr. 2016, 105, 1216–1224. [Google Scholar] [CrossRef]
- Linden, C.; Ahlborg, H.G.; Besjakov, J.; Gardsell, P.; Karlsson, M.K. A school curriculum-based exercise program increases bone mineral accrual and bone size in prepubertal girls: Two-year data from the pediatric osteoporosis prevention (POP) study. J. Bone Miner. Res. Off. J. Am. Soc. Bone Miner. Res. 2006, 21, 829–835. [Google Scholar] [CrossRef] [PubMed]
- Löfgren, B.; Detter, F.; Dencker, M.; Stenevi-Lundgren, S.; Nilsson, J.; Karlsson, M.K. Influence of a 3-year exercise intervention program on fracture risk, bone mass, and bone size in prepubertal children. J. Bone Miner. Res. Off. J. Am. Soc. Bone Miner. Res. 2011, 26, 1740–1747. [Google Scholar] [CrossRef] [PubMed]
- Mackelvie, K.J.; McKay, H.A.; Khan, K.M.; Crocker, P.R. A school-based exercise intervention augments bone mineral accrual in early pubertal girls. J. Pediatr. 2001, 139, 501–508. [Google Scholar] [CrossRef] [PubMed]
- MacKelvie, K.J.; Petit, M.A.; Khan, K.M.; Beck, T.J.; McKay, H.A. Bone mass and structure are enhanced following a 2-year randomized controlled trial of exercise in prepubertal boys. Bone 2004, 34, 755–764. [Google Scholar] [CrossRef] [PubMed]
- McKay, H.A.; MacLean, L.; Petit, M.; MacKelvie-O’Brien, K.; Janssen, P.; Beck, T.; Khan, K.M. ‘Bounce at the Bell’: A novel program of short bouts of exercise improves proximal femur bone mass in early pubertal children. Br. J. Sports Med. 2005, 39, 521–526. [Google Scholar] [CrossRef] [PubMed]
- Fuchs, R.K.; Bauer, J.J.; Snow, C.M. Jumping improves hip and lumbar spine bone mass in prepubescent children: A randomized controlled trial. J. Bone Miner. Res. Off. J. Am. Soc. Bone Miner. Res. 2001, 16, 148–156. [Google Scholar] [CrossRef]
- Fuchs, R.K.; Snow, C.M. Gains in hip bone mass from high-impact training are maintained: A randomized controlled trial in children. J. Pediatr. 2002, 141, 357–362. [Google Scholar] [CrossRef]
- Gunter, K.; Baxter-Jones, A.D.; Mirwald, R.L.; Almstedt, H.; Fuchs, R.K.; Durski, S.; Snow, C. Impact exercise increases BMC during growth: An 8-year longitudinal study. J. Bone Miner. Res. Off. J. Am. Soc. Bone Miner. Res. 2008, 23, 986–993. [Google Scholar] [CrossRef]
- Meyer, U.; Ernst, D.; Zahner, L.; Schindler, C.; Puder, J.J.; Kraenzlin, M.; Rizzoli, R.; Kriemler, S. 3-Year follow-up results of bone mineral content and density after a school-based physical activity randomized intervention trial. Bone 2013, 55, 16–22. [Google Scholar] [CrossRef]
- Meyer, U.; Romann, M.; Zahner, L.; Schindler, C.; Puder, J.J.; Kraenzlin, M.; Rizzoli, R.; Kriemler, S. Effect of a general school-based physical activity intervention on bone mineral content and density: A cluster-randomized controlled trial. Bone 2011, 48, 792–797. [Google Scholar] [CrossRef]
- Gutin, B.; Owens, S.; Okuyama, T.; Riggs, S.; Ferguson, M.; Litaker, M. Effect of physical training and its cessation on percent fat and bone density of children with obesity. Obes. Res. 1999, 7, 208–214. [Google Scholar] [CrossRef] [PubMed]
- Gutin, B.; Yin, Z.; Johnson, M.; Barbeau, P. Preliminary findings of the effect of a 3-year after-school physical activity intervention on fitness and body fat: The Medical College of Georgia Fitkid Project. Int. J. Pediatr. Obes. 2008, 3 (Suppl. 1), 3–9. [Google Scholar] [CrossRef]
- Larsen, M.N.; Nielsen, C.M.; Helge, E.W.; Madsen, M.; Manniche, V.; Hansen, L.; Hansen, P.R.; Bangsbo, J.; Krustrup, P. Positive effects on bone mineralisation and muscular fitness after 10 months of intense school-based physical training for children aged 8-10 years: The FIT FIRST randomised controlled trial. Br. J. Sports Med. 2018, 52, 254–260. [Google Scholar] [CrossRef] [PubMed]
- Specker, B.; Binkley, T. Increased periosteal circumference remains present 12 months after an exercise intervention in preschool children. Bone 2004, 35, 1383–1388. [Google Scholar] [CrossRef] [PubMed]
- Staiano, A.E.; Beyl, R.A.; Guan, W.; Hendrick, C.A.; Hsia, D.S.; Newton, R.L., Jr. Home-based exergaming among children with overweight and obesity: A randomized clinical trial. Pediatr. Obes. 2018, 13, 724–733. [Google Scholar] [CrossRef]
- The Cochrane Collaboration. Cochrane Handbook for Systematic Reviews of Interventions; Higgins, J.P.T., Thomas, J., Eds.; Cochrane: Chichester, UK, 2022; Available online: https://training.cochrane.org/handbook/current (accessed on 1 May 2022).
- Hoffmann, T.C.; Glasziou, P.P.; Boutron, I.; Milne, R.; Perera, R.; Moher, D.; Altman, D.G.; Barbour, V.; Macdonald, H.; Johnston, M.; et al. Better reporting of interventions: Template for intervention description and replication (TIDieR) checklist and guide. BMJ 2014, 348, g1687. [Google Scholar] [CrossRef] [PubMed]
- Sterne, J.A.C.; Savović, J.; Page, M.J.; Elbers, R.G.; Blencowe, N.S.; Boutron, I.; Cates, C.J.; Cheng, H.Y.; Corbett, M.S.; Eldridge, S.M.; et al. RoB 2: A revised tool for assessing risk of bias in randomised trials. BMJ 2019, 366, l4898. [Google Scholar] [CrossRef]
- Murphy, M.; Travers, M.J.; Gibson, W.; Chivers, P.; Debenham, J.; Docking, S.; Rio, E. The rate of improvement of pain and function in mid-portion Achilles tendinopathy with loading protocols: A Systematic Review and Longitudinal Meta-Analysis. Sports Med. 2018, 48, 1875–1891. [Google Scholar] [CrossRef]
- Murphy, M.C.; Travers, M.J.; Chivers, P.; Debenham, J.R.; Docking, S.I.; Rio, E.K.; Gibson, W. Efficacy of heavy eccentric calf training for treating mid-portion Achilles tendinopathy: A systematic review and meta-analysis. Br. J. Sports Med. 2019, 53, 1070–1077. [Google Scholar] [CrossRef]
- Egger, M.; Davey Smith, G.; Schneider, M.; Minder, C. Bias in meta-analysis detected by a simple, graphical test. BMJ 1997, 315, 629–634. [Google Scholar] [CrossRef] [PubMed]
- Dechartres, A.; Trinquart, L.; Boutron, I.; Ravaud, P. Influence of trial sample size on treatment effect estimates: Meta-epidemiological study. BMJ 2013, 346, f2304. [Google Scholar] [CrossRef] [PubMed]
- Harris, S.A.; Dempsey, A.R.; Mackie, K.; King, D.; Hecimovich, M.; Murphy, M.C. Do Sideline Tests of Vestibular and Oculomotor Function Accurately Diagnose Sports-Related Concussion in Adults? A Systematic Review and Meta-analysis. Am. J. Sports Med. 2021, 50, 3635465211027946. [Google Scholar] [CrossRef] [PubMed]
- Murphy, M.; George, H.; Naqi, M.; Owen, P.; Chivers, P.; Hart, N.H. Musculoskeletal injury epidemiology in law enforcement and firefighter recruits during physical training: A systematic review. BMJ Open Sport Exerc. Med. 2022. epub ahead of print. [Google Scholar] [CrossRef]
- GRADE Working Group. Handbook for Grading the Quality of Evidence and the Strength of Recommendations Using the GRADE Approach; Schünemann, H., Brożek, J., Guyatt, G., Oxman, A., Eds.; GRADE: Hamilton, ON, USA, 2013; Available online: https://gradepro.org/ (accessed on 1 May 2022).
- Slade, S.C.; Dionne, C.E.; Underwood, M.; Buchbinder, R. Consensus on Exercise Reporting Template (CERT): Explanation and Elaboration Statement. Br. J. Sports Med. 2016, 50, 1428–1437. [Google Scholar] [CrossRef] [PubMed]
- Anliker, E.; Dick, C.; Rawer, R.; Toigo, M. Effects of jumping exercise on maximum ground reaction force and bone in 8- to 12-year-old boys and girls: A 9-month randomized controlled trial. J. Musculoskelet. Neuronal Interact. 2012, 12, 56–67. [Google Scholar]
- Barbeau, P.; Johnson, M.H.; Howe, C.A.; Allison, J.; Davis, C.L.; Gutin, B.; Lemmon, C.R. Ten months of exercise improves general and visceral adiposity, bone, and fitness in black girls. Obesity 2007, 15, 2077–2085. [Google Scholar] [CrossRef]
- Daly, R.M.; Ducher, G.; Hill, B.; Telford, R.M.; Eser, P.; Naughton, G.; Seibel, M.J.; Telford, R.D. Effects of a Specialist-Led, School Physical Education Program on Bone Mass, Structure, and Strength in Primary School Children: A 4-Year Cluster Randomized Controlled Trial. J. Bone Miner. Res. Off. J. Am. Soc. Bone Miner. Res. 2016, 31, 289–298. [Google Scholar] [CrossRef]
- Hasselstrøm, H.A.; Karlsson, M.K.; Hansen, S.E.; Grønfeldt, V.; Froberg, K.; Andersen, L.B. A 3-year physical activity intervention program increases the gain in bone mineral and bone width in prepubertal girls but not boys: The prospective copenhagen school child interventions study (CoSCIS). Calcif. Tissue Int. 2008, 83, 243–250. [Google Scholar] [CrossRef]
- McKay, H.A.; Petit, M.A.; Schutz, R.W.; Prior, J.C.; Barr, S.I.; Khan, K.M. Augmented trochanteric bone mineral density after modified physical education classes: A randomized school-based exercise intervention study in prepubescent and early pubescent children. J. Pediatr. 2000, 136, 156–162. [Google Scholar] [CrossRef]
- Meiring, R.M.; Micklesfield, L.K.; Avidon, I.; McVeigh, J.A. Osteogenic effects of a physical activity intervention in South African black children. J. Musculoskelet. Neuronal Interact. 2014, 14, 276–285. [Google Scholar]
- Nogueira, R.C.; Weeks, B.K.; Beck, B.R. An in-school exercise intervention to enhance bone and reduce fat in girls: The CAPO Kids trial. Bone 2014, 68, 92–99. [Google Scholar] [CrossRef] [PubMed]
- McCaskie, C.J.; Sim, M.; Newton, R.U.; Heasman, J.; Rogalski, B.; Hart, N.H. Characterising lower-body musculoskeletal morphology and whole-body composition of elite female and male Australian Football players. BMC Sports Sci. Med. Rehabil. 2022, 14, 168. [Google Scholar] [CrossRef]
- Hui, S.L.; Gao, S.; Zhou, X.H.; Johnston, C.C., Jr.; Lu, Y.; Glüer, C.C.; Grampp, S.; Genant, H. Universal standardization of bone density measurements: A method with optimal properties for calibration among several instruments. J. Bone Miner. Res. Off. J. Am. Soc. Bone Miner. Res. 1997, 12, 1463–1470. [Google Scholar] [CrossRef]
- Hart, N.H.; Nimphius, S.; Weber, J.; Spiteri, T.; Rantalainen, T.; Dobbin, M.; Newton, R.U. Musculoskeletal Asymmetry in Football Athletes: A Product of Limb Function over Time. Med. Sci. Sports Exerc. 2016, 48, 1379–1387. [Google Scholar] [CrossRef] [PubMed]
- Cheung, W.H.; Hung, V.W.; Cheuk, K.Y.; Chau, W.W.; Tsoi, K.K.; Wong, R.M.; Chow, S.K.; Lam, T.P.; Yung, P.S.; Law, S.W.; et al. Best Performance Parameters of HR-pQCT to Predict Fragility Fracture: Systematic Review and Meta-Analysis. J. Bone Miner. Res. Off. J. Am. Soc. Bone Miner. Res. 2021, 36, 2381–2398. [Google Scholar] [CrossRef] [PubMed]
- Mikolajewicz, N.; Bishop, N.; Burghardt, A.J.; Folkestad, L.; Hall, A.; Kozloff, K.M.; Lukey, P.T.; Molloy-Bland, M.; Morin, S.N.; Offiah, A.C.; et al. HR-pQCT Measures of Bone Microarchitecture Predict Fracture: Systematic Review and Meta-Analysis. J. Bone Miner. Res. Off. J. Am. Soc. Bone Miner. Res. 2020, 35, 446–459. [Google Scholar] [CrossRef]
- Travers, M.J.; Murphy, M.C.; Debenham, J.R.; Chivers, P.; Bulsara, M.K.; Bagg, M.K.; Palsson, T.S.; Gibson, W. Should this systematic review and meta-analysis change my practice? Part 1: Exploring treatment effect and trustworthiness. Br. J. Sports Med. 2019, 53, 1488–1492. [Google Scholar] [CrossRef]
- Travers, M.J.; Murphy, M.C.; Debenham, J.R.; Chivers, P.; Bulsara, M.K.; Bagg, M.K.; Palsson, T.S.; Gibson, W. Should this systematic review and meta-analysis change my practice? Part 2: Exploring the role of the comparator, diversity, risk of bias and confidence. Br. J. Sports Med. 2019, 53, 1493–1497. [Google Scholar] [CrossRef]
- Schulz, K.F.; Altman, D.G.; Moher, D. CONSORT 2010 statement: Updated guidelines for reporting parallel group randomised trials. BMJ 2010, 340, c332. [Google Scholar] [CrossRef]
- Micheli, L.J.; Fehlandt, A.F., Jr. Overuse injuries to tendons and apophyses in children and adolescents. Clin. Sports Med. 1992, 11, 713–726. [Google Scholar] [CrossRef]


Disclaimer/Publisher’s Note: The statements, opinions and data contained in all publications are solely those of the individual author(s) and contributor(s) and not of MDPI and/or the editor(s). MDPI and/or the editor(s) disclaim responsibility for any injury to people or property resulting from any ideas, methods, instructions or products referred to in the content. |
© 2022 by the authors. Licensee MDPI, Basel, Switzerland. This article is an open access article distributed under the terms and conditions of the Creative Commons Attribution (CC BY) license (https://creativecommons.org/licenses/by/4.0/).