
African American Women with Cardiometabolic Complications of Pregnancy Have Decreased Serum Abundance of Specialized Pro-Resolving Lipid Mediators and Endocannabinoids
 , ,
, ,
Abstract
:1. Introduction
2. Materials and Methods
2.1. Study Design and Population
2.2. Data Collection
2.3. Chemicals and Lipid Standards
2.4. Workflow
2.5. Lipid Extraction
2.6. Oxylipin and Endocannabinoid Extraction
2.7. Chromatography
2.8. Mass Spectrometry
2.9. Quantification
2.10. Data Analysis
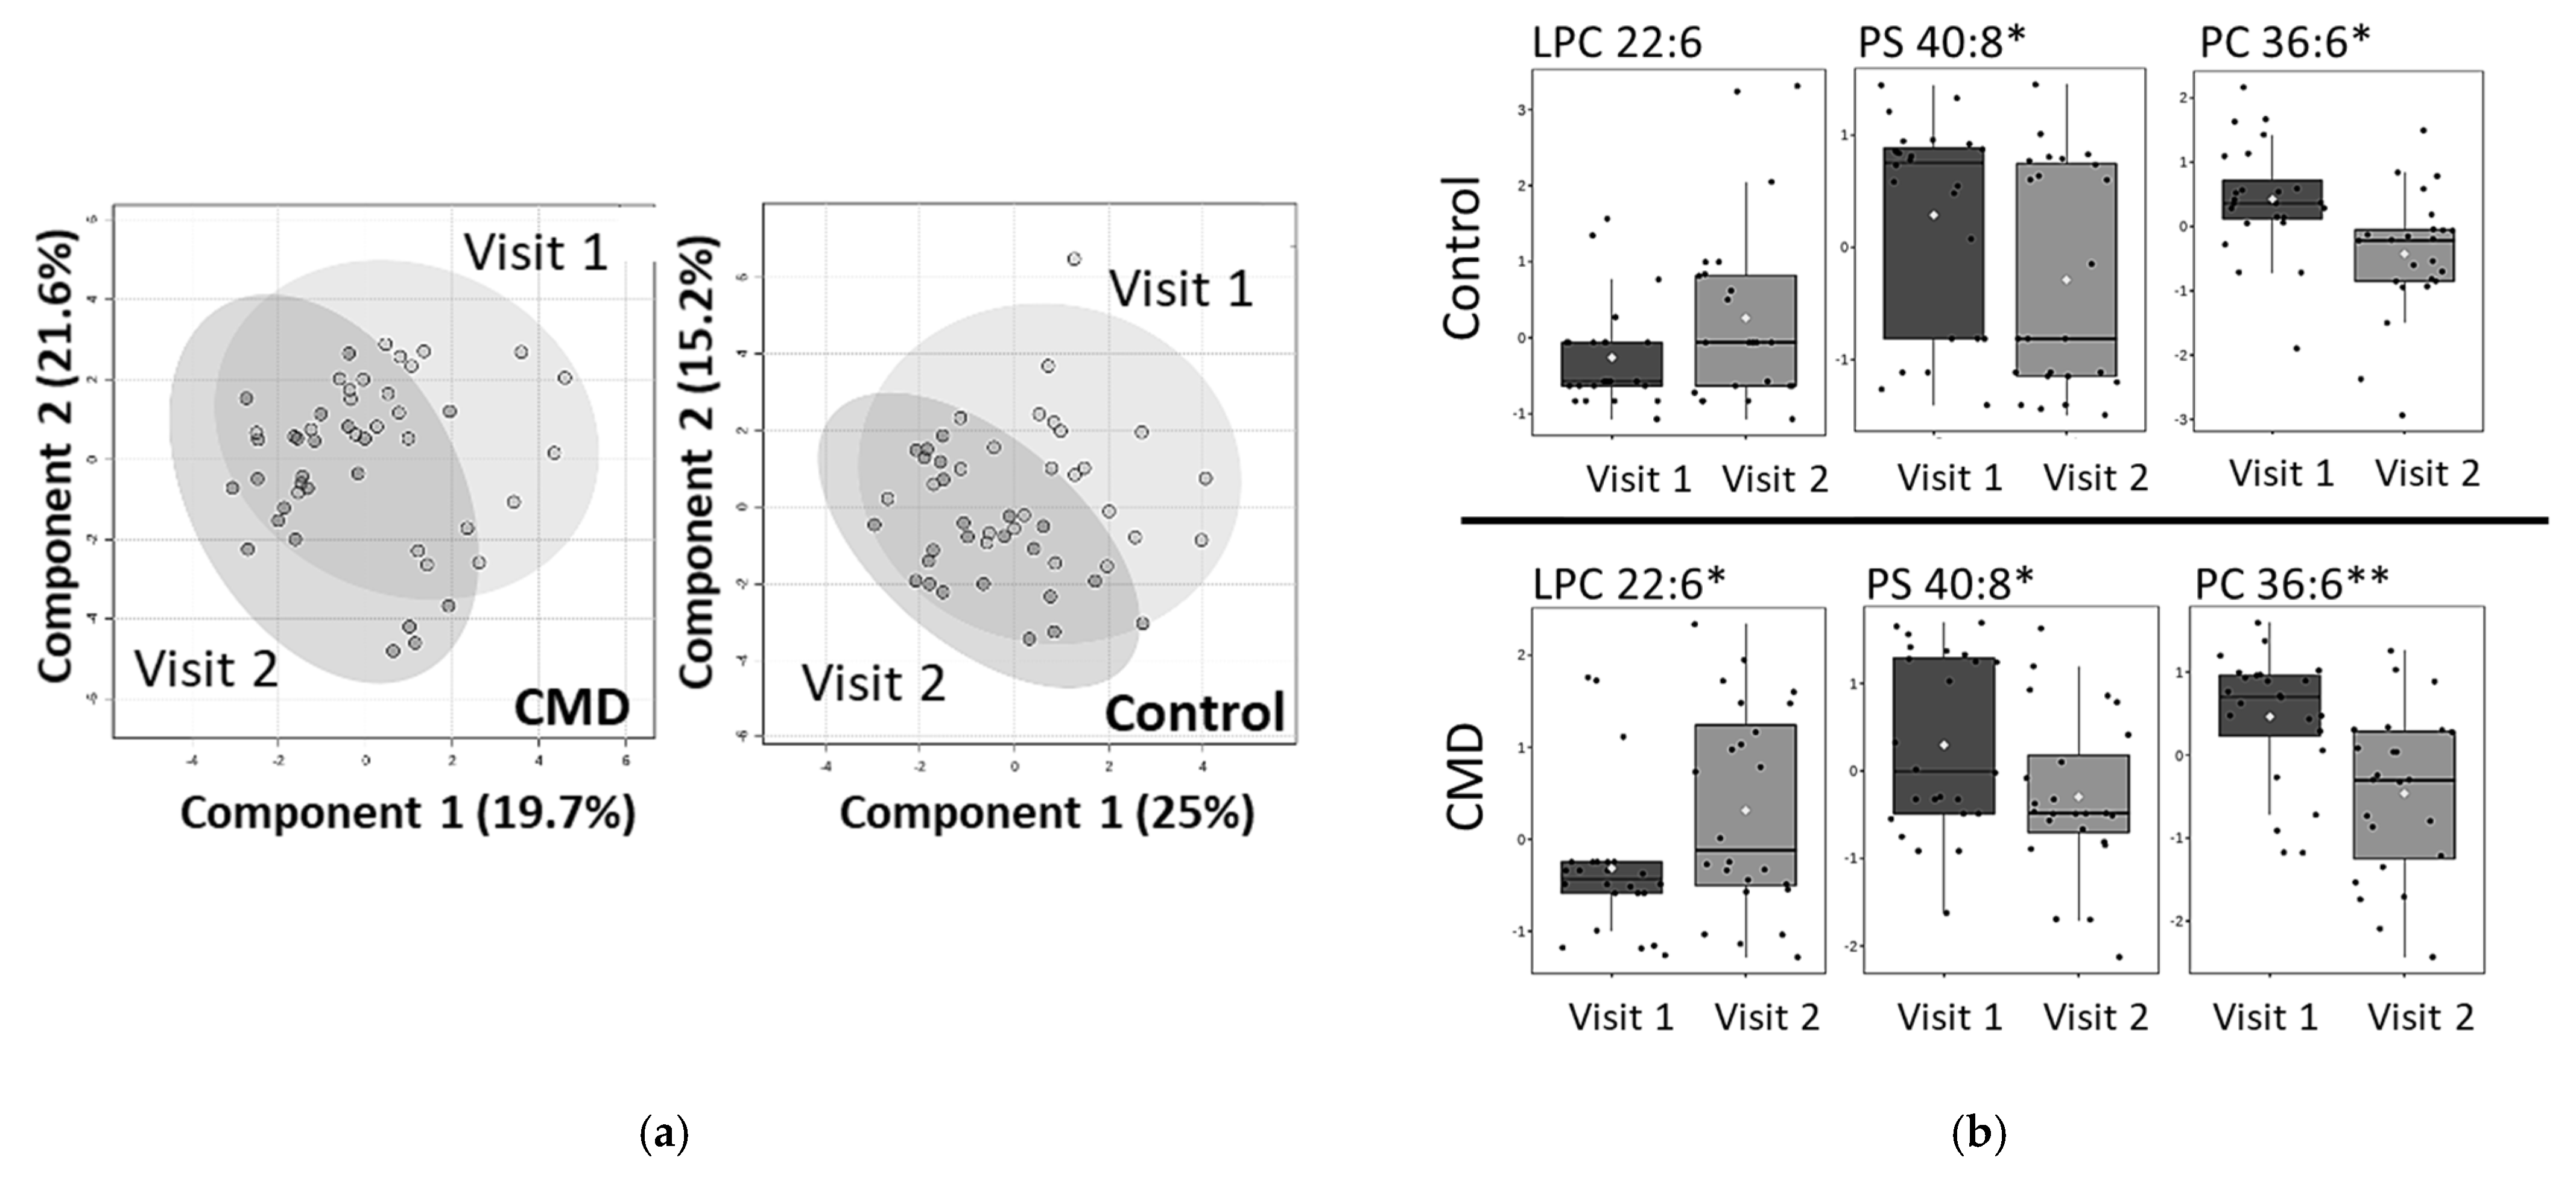
3. Results
Analysis
4. Discussion
Supplementary Materials
Author Contributions
Funding
Institutional Review Board Statement
Informed Consent Statement
Data Availability Statement
Acknowledgments
Conflicts of Interest
References
- Lauritzen, L.; Brambilla, P.; Mazzocchi, A.; Harsløf, L.B.S.; Ciappolino, V.; Agostoni, C. DHA Effects in Brain Development and Function. Nutrients 2016, 8, 6. [Google Scholar] [CrossRef] [PubMed] [Green Version]
- Dyall, S.C. Long-chain omega-3 fatty acids and the brain: A review of the independent and shared effects of EPA, DPA and DHA. Front. Aging Neurosci. 2015, 7, 1–15. [Google Scholar] [CrossRef] [Green Version]
- Lee, J.H.; O’Keefe, J.H.; Lavie, C.J.; Harris, W.S. Omega-3 fatty acids: Cardiovascular benefits, sources and sustainability. Nat. Rev. Cardiol. 2009, 6, 753–758. [Google Scholar] [CrossRef] [PubMed]
- Perez-Heras, A.M. Long-chain n-3 PUFA supplied by the usual diet decrease plasma stearoyl-CoA desaturase index in non-hypertriglyceridemic older adults at high vascular risk. Clin. Nutr. 2018, 37, 157–162. [Google Scholar] [CrossRef] [PubMed]
- Petsini, F. Fish consumption and cardiovascular disease related biomarkers: A review of clinical trials. Crit. Rev. Food Sci. Nutr. 2018, 59, 1–11. [Google Scholar] [CrossRef]
- William, S.; Harris, P. Erythrocyte long-chain omega-3 fatty acid levels are inversely associated with mortality and with incident cardiovascular disease: The Framingham Heart Study. J. Clin. Lipidol. 2018, 12, 718–727.e6. [Google Scholar]
- Nagaraj, C. Docosahexaenoic acid causes rapid pulmonary arterial relaxation via KCa channel-mediated hyperpolarisation in pulmonary hypertension. Eur. Respir. J. 2016, 48, 1127–1136. [Google Scholar] [CrossRef] [Green Version]
- Jaclyn, M.; Coletta, M. Omega-3 Fatty Acids and Pregnancy. Rev. Obstet. Gynecol. 2010, 3, 163–171. [Google Scholar]
- Jamilian, M. A Randomized Double-Blinded, Placebo-Controlled Trial Investigating the Effect of Fish Oil Supplementation on Gene Expression Related to Insulin Action, Blood Lipids, and Inflammation in Gestational Diabetes Mellitus-Fish Oil Supplementation and Gestational Diabetes. Nutrients 2018, 10, 163. [Google Scholar]
- The American College of Obstetricians and Gynecologists. Update on Seafood Consumption During Pregnancy: Practice Advisory. 2017. (Reaffirmed 2020). Available online: https://www.acog.org/clinical/clinical-guidance/practice-advisory/articles/2017/01/update-on-seafood-consumption-during-pregnancy (accessed on 19 December 2022).
- Koletzko, B.; Cetin, I.; Brenna, J.T. Dietary fat intakes for pregnant and lactating women. Br. J. Nutr. 2007, 98, 873–877. [Google Scholar] [CrossRef] [Green Version]
- Wilson, N.A.; Mantzioris, E.; Middleton, P.F.; Muhlhausler, B.S. Influence of sociodemographic, lifestyle and genetic characteristics on maternal DHA and other polyunsaturated fatty acid status in pregnancy: A systematic review. Prostaglandins Leukot. Essent. Fat. Acids 2020, 152, 102037. [Google Scholar] [CrossRef] [PubMed] [Green Version]
- Wilson, N.A.; Mantzioris, E.; Middleton, P.T.; Muhlhausler, B.S. Gestational age and maternal status of DHA and other polyunsaturated fatty acids in pregnancy: A systematic review. Prostaglandins Leukot. Essent. Fat. Acids 2019, 144, 16–31. [Google Scholar] [CrossRef] [PubMed]
- Oppedisano, F.; Macri, R.; Gliozzi, M.; Musolino, V.; Carresi, C.; Maiuolo, J.; Bosco, F.; Nucera, S.; Zito, M.C.; Guarnieri, L.; et al. The Anti-Inflammatory and Antioxidant Properties of n-3 PUFAs: Their Role in Cardiovascular Protection. Biomedicines 2020, 8, 306. [Google Scholar] [CrossRef] [PubMed]
- Stark, K.D.; Beblo, S.; Murthy, M.; Buda-Abela, M.; Janisse, J.; Rockett, H.; Whitty, J.E.; Martier, S.S.; Sokol, R.J.; Hannigan, J.; et al. Comparison of bloodstream fatty acid composition from African-American women at gestation, delivery, and postpartum. J. Lipid Res. 2005, 46, 516–525. [Google Scholar] [CrossRef] [PubMed] [Green Version]
- Sachelly Julián-Serrano, K.D.; Angleró, I.; Emenaker, N. Ethnic Disparities in EPA and DHA Intake in US Adults: Results from the NHANES 2011–2014 (P04-107-19). Curr. Dev. Nutr. 2019, 3 (Suppl. 1), nzz051.P04-107-19. [Google Scholar] [CrossRef] [Green Version]
- Haley, W.; Parker, A.T.; McCurdy, K.; Vadiveloo, M. Socio-economic and racial prenatal diet quality disparities in a national US sample. Public Health Nutr. 2020, 23, 894–903. [Google Scholar]
- Tara, M.; Nordgren, E.L.; Anderson-Berry, A.; Hanson, C. Omega-3 fatty acid intake of pregnant women and women of childbearing age in the United States: Potential for deficiency? Nutrients 2017, 9, 197. [Google Scholar]
- Chen, Y.-P. Fetal and maternal angiotensin (1-7) are associated with preterm birth. J. Hypertens. 2014, 32, 1833–1841. [Google Scholar] [CrossRef]
- Goldenberg, R.L. Epidemiology and causes of preterm birth. Lancet 2008, 371, 75–84. [Google Scholar] [CrossRef]
- Monique, M.; Hedderson, M. Gestational Diabetes Mellitus and Lesser Degrees of Pregnancy Hyperglycemia: Association With Increased Risk of Spontaneous Preterm Birth. Obstet. Gynecol. 2003, 102, 850–856. [Google Scholar]
- Tucker, M.J.; Berg, C.J.; Callaghan, W.M.; Hsia, J. The Black–White Disparity in Pregnancy-Related Mortality From 5 Conditions: Differences in Prevalence and Case-Fatality Rates. Am. J. Public Health 2007, 97, 247–251. [Google Scholar] [CrossRef] [PubMed]
- Meher, A. Maternal Fatty Acids and Their Association with Birth Outcome: A Prospective Study. PLoS ONE 2016, 11, e0147359. [Google Scholar] [CrossRef] [PubMed] [Green Version]
- Manuck, T. Racial and ethnic differences in preterm birth: A complex, multifactorial problem. Semin. Perinatol. 2017, 41, 511–518. [Google Scholar] [CrossRef] [PubMed]
- Wang, Y.; Chen, L.; Horswell, R.; Xiao, K.; Besse, J.; Johnson, J.; Ryan, D.; Hu, G. Racial differences in the association between gestational diabetes mellitus and risk of type 2 diabetes. J. Women Health 2012, 21, 628–633. [Google Scholar] [CrossRef] [PubMed]
- Bell, J.F. Birth outcomes among urban African-American women: A multilevel analysis of the role of racial residential segregation. Soc. Sci. Med. 2006, 63, 3030–3045. [Google Scholar] [CrossRef]
- Braveman, P. Worry about racial discrimination: A missing piece of the puzzle of Black-White disparities in preterm birth? PLoS ONE 2017, 12, e0186151. [Google Scholar] [CrossRef]
- Alhusen, J.L.; Bower, K.; Epstein, E.; Sharps, P. Racial Discrimination and Adverse Birth Outcomes: An Integrative Review. J. Midwifery Women Health 2016, 61, 707–720. [Google Scholar] [CrossRef] [Green Version]
- Colilins, J.W., Jr. African-American women’s Upward Economic Mobility and Small for Gestational Age Births: A Population-Based Study. Matern. Child Health J. 2018, 22, 1183–1189. [Google Scholar] [CrossRef]
- Hamilton, B.E.; Osterman, M.; Driscoll, A.K.; Rossen, L.M. Births: Provisional data for 2017. Natl. Vital Stat. Rep. 2018, 318, 1–50. [Google Scholar]
- Corwin, E.J. Protocol for the Emory University African American Vaginal, Oral, and Gut Microbiome in Pregnancy Cohort Study. BMC Pregnancy Childbirth 2017, 17, 161. [Google Scholar]
- Braveman, P.A.; Heck, K.; Egerter, S.; Marchi, K.S.; Dominguez, T.P.; Cubbin, C.; Fingar, K.; Pearson, J.A.; Curtis, M. The role of socioeconomic factors in black–white disparities in preterm birth. Am. J. Public Health 2015, 105, 694–702. [Google Scholar] [CrossRef]
- Leonard, S.A.; Petito, L.C.; Stephansson, O.; Hutcheon, J.A.; Bodnar, L.M.; Mujahid, M.S. Weight gain during pregnancy and the black-white disparity in preterm birth. Ann. Epidemiol. 2017, 27, 323–328. [Google Scholar] [CrossRef] [PubMed] [Green Version]
- Rosenthal, L. Explaining racial disparities in adverse birth outcomes: Unique sources of stress for Black American women. Soc. Sci. Med. 2011, 63, 977–983. [Google Scholar] [CrossRef]
- Brou, L.; Almli, L.M.; Pearce, B.D.; Bhat, G.; Drobek, C.O.; Fortunato, S.; Menon, R. Dysregulated biomarkers induce distinct pathways in preterm birth. Br. J. Gynecol. 2012, 119, 458–473. [Google Scholar] [CrossRef] [PubMed]
- Serhan, C.N. Novel Pro-Resolving Lipid Mediators in Inflammation Are Leads for Resolution Physiology. Nature 2014, 510, 92–101. [Google Scholar] [CrossRef] [PubMed] [Green Version]
- Gerard Bannenberg, C.N.S. Specialized pro-resolving lipid mediators in the inflammatory response: An update. Biochim. Biophys. Acta 2010, 1801, 1260–1273. [Google Scholar] [CrossRef] [PubMed] [Green Version]
- The American College of Obstetricians and Gynecologists. Method for estimating due date. Committee Opinion No. 611. Obs. Gynecol. 2014, 124, 863–866. [Google Scholar] [CrossRef]
- The American College of Obstetricians and Gynecologists. Hypertension in pregnancy. Report of the American College of Obstetricians and Gynecologists’ task force on hypertension in pregnancy. Obstet. Gynecol. 2013, 122, 1122. [Google Scholar]
- American Diabetes Association. Gestational diabetes mellitus. Diabetes Care 2004, 27 (Suppl. S1), S88. [Google Scholar]
- Bligh, E.; Dyer, W.J. A Rapid Method of Total Lipid Extraction and Purification. Can. J. Biochem. Physiol. 1959, 37, 911–917. [Google Scholar] [CrossRef]
- Chong, J. MetaboAnalyst 4.0: Towards More Transparent and Integrative Metabolomics Analysis. Nucleic Acids Res. 2018, 46, W486–W494. [Google Scholar] [CrossRef] [PubMed] [Green Version]
- Tayyari, F. Metabolic profiles of triple-negative and luminal A breascancer subtypes in African-American identify key metabolic differences. Oncotarget 2018, 9, 11677. [Google Scholar] [CrossRef] [PubMed] [Green Version]
- Kenny, L.C. Advanced Maternal Age and Adverse Pregnancy Outcome: Evidence from a Large Contemporary Cohort. PLoS ONE 2013, 8, e56583. [Google Scholar] [CrossRef] [PubMed] [Green Version]
- Qiu, X. Biosynthesis of docosahexaenoic acid (DHA, 22:6-4, 7,10,13,16,19): Two distinct pathways. Prostaglandins Leukot. Essent. Fat. Acids 2003, 68, 181–186. [Google Scholar] [CrossRef] [PubMed]
- Basil, M.C.; Levy, B.D. Specialized pro-resolving mediators: Endogenous regulators of infection and inflammation. Nat. Rev. Immunol. 2016, 16, 51–67. [Google Scholar] [CrossRef]
- Ashlyn, C.; Harmon, D.C.C.; Amaral, L.M.; Faulkner, J.L.; Mark, W.; Cunningham, K.W., Jr.; LaMarca, B. The role of inflammation in the pathology of preeclampsia. Clin. Sci. 2016, 130, 409–419. [Google Scholar]
- Tatjana Radaelli, A.V.; Catalano, P.; Hauguel-de Mouzon, S. Gestational diabetes induces placental genes for chronic stress and inflammatory pathways. Diabetes 2003, 52, 2951–2958. [Google Scholar] [CrossRef] [Green Version]
- Samuel Furse, D.S.F.-T.; Beeson, J.H.; Chiarugi, D.; Ozanne, S.E.; Koulman, A. A mouse model of gestational diabetes shows dysregulated lipid metabolism post-weaning, after return to euglycaemia. Nutr. Diabetes 2022, 12, 8. [Google Scholar] [CrossRef]
- Suburu, J.; Shi, L.; Wu, J.; Wang, S.; Samuel, M.; Thomas, M.J.; Kock, N.D.; Yang, G.; Kridel, S.; Chen, Y.Q. Fatty acid synthase is required for mammary gland development and milk production during lactation. American journal of physiology. Endocrinol. Metab. 2014, 306, E1132–E1143. [Google Scholar]
- Alice Bosco, A.D.; Zanza, C.; Pintus, R.; Fanos, V. Resolvins’ Obesity-Driven Deficiency: The Implications for. Maternal–Fetal Health. Nutrients 2022, 14, 1662. [Google Scholar] [CrossRef]
- Joan Clària, J.D.; Yacoubian, S.; Gao, F.; Serhan, C.N. Resolvin D1 and Resolvin D2 Govern Local Inflammatory Tone in. Obese Fat1. J. Immunol. 2012, 189, 2597–2605. [Google Scholar] [CrossRef] [Green Version]
- Perucci, L.O.; Santos, T.A.P.; Santos, P.C.; Teixeira, L.C.R.; Alpoim, P.N.; Gomes, K.B.; Sousa, L.P.; Dusse, L.M.S.; Talvani, A. Pre-eclampsia is associated with reduced resolvin D1 and maresin 1 to leukotriene B4 ratios in the plasma. Am. J. Reprod. Immunol. 2019, 83, e13206. [Google Scholar]
- Max, T.; Aung, Y.Y.; Kelly, K.; Ferguson, D.; Cantonwine, E.; Zeng, L.; Mcelrath, T.F.; Mukherjee, B.; Meeke, J.D. Prediction and associations of preterm birth and its subtypes with eicosanoid enzymatic pathways and inflammatory markers. Sci. Rep. 2019, 9, 17049. [Google Scholar]
- Taguchi, A.M.; Yamashita, A.; Kawana, K.; Nagamatsu, T.; Furuya, H.; Inoue, E.; Osuga, Y.; Fujii, T. +5 Recent Progress in Therapeutics for Inflammation-Associated Preterm Birth: A Review. Reprod. Sci. 2016, 24, 7–18. [Google Scholar] [CrossRef] [PubMed]
- Anthony, H.; Taylor, A.A.A.; Bambang, K.; Karasu, T.; Gebeh, A.; Lam, P.M.W.; Timothy, H.; Marzcylo, J.; Konje, C. Endocannabinoids and pregnancy. Clin. Chim. Acta 2010, 411, 921–930. [Google Scholar]
- Melissa, L.; Kozakiewicz, C.A.G.; Howlett, A.C. Endocannabinoid System in Pregnancy Maintenance and Labor: A Mini-Review. Front. Endocrinol. 2021, 12, 699951. [Google Scholar]
- Ramsha Nabihah Khan, K.M.-S.; Owens, J.A.; Barbian, M.E.; Jones, R.M.; Naudin, C.R. At the heart of microbial conversations: Endocannabinoids and the microbiome in cardiometabolic risk. Gut Microbes 2021, 13, 1–21. [Google Scholar]
- Antje Brüser, A.Z.; Crews, B.C.; Sliwoski, G.; Meiler, J.; König, G.M.; Kostenis, E.; Lede, V.; Lawrence, J.; Marnett, L.J.; Schöneberg, T. Prostaglandin E2 glyceryl ester is an endogenous agonist of the nucleotide receptor P2Y6. Sci. Rep. 2017, 7, 2380. [Google Scholar] [CrossRef] [Green Version]
- Vrijkotte, T.G.; Krukziener, N.; Hutten, B.A.; Vollebregt, K.C.; van Eijsden, M.; Twickler, M.B. Maternal Lipid Profile During Early Pregnancy and Pregnancy Complications and Outcomes: The ABCD Study. J. Clin. Endocrinol. Meta 2012, 97, 3917–3925. [Google Scholar] [CrossRef]
- Lu, L.; Koulma, A.; Clive, J.P.; Jenkins, B.; Matthews, L.; Hughes, I.A.; Acerini, C.L.; Ong, K.K.; Dunger, D.B. An Unbiased Lipidomics Approach Identifies Early Second Trimester Lipids Predictive of Maternal Glycemic Traits and Gestational Diabetes Mellitus. Diabetes Care 2016, 39, 2232–2239. [Google Scholar] [CrossRef] [Green Version]
- Besenboeck, C.; Lang, U.; Desoye, G.; Wadsack, C. Going into labor and beyond: Phospholipase A2 in pregnancy. Reproduction 2016, 151, R91–R102. [Google Scholar] [CrossRef] [PubMed] [Green Version]
- Lappas, M.; Rice, G. Phospholipase A 2 isozymes in pregnancy and parturition. Prostaglandins Leukot. Essent. Fat. Acids 2004, 70, 87–100. [Google Scholar] [CrossRef] [PubMed]


| Controls (n = 27) | Cases a (n = 27) | p-Value b | n | |
|---|---|---|---|---|
| Sociodemographic Characteristics | ||||
| Maternal age, years | 24.0 (3.94) | 24.2 (4.66) | 0.875 | 54 |
| Education Level | 0.792 | 52 | ||
| Less than High School Diploma | 20 | 14.8 | ||
| High School Diploma | 32 | 37 | ||
| Some College | 28 | 25.9 | ||
| College Graduate or above | 20 | 22.2 | ||
| Pregnancy Insurance Status | 0.318 | 52 | ||
| Medicaid | 76 | 63 | ||
| Private | 24 | 37 | ||
| Clinical Measures | ||||
| First prenatal BMI c | 30.0 (9.00) | 29.4 (8.57) | 0.801 | 52 |
| First prenatal BMI Category | 0.691 | 52 | ||
| Underweight | 4 | 3.7 | ||
| Normal weight | 36 | 44.4 | ||
| Overweight | 12 | 7.4 | ||
| Obese | 48 | 44.4 | ||
| Nulliparous | 60 | 66.7 | 54 | |
| Gestational Age at Timepoint 1, weeks | 11.3 (2.20) | 11.0 (2.01) | 0.528 | 52 |
| Gestational Age at Timepoint 2, weeks | 26.9 (2.32) | 26.1 (2.45) | 0.267 | 49 |
Disclaimer/Publisher’s Note: The statements, opinions and data contained in all publications are solely those of the individual author(s) and contributor(s) and not of MDPI and/or the editor(s). MDPI and/or the editor(s) disclaim responsibility for any injury to people or property resulting from any ideas, methods, instructions or products referred to in the content. |
© 2022 by the authors. Licensee MDPI, Basel, Switzerland. This article is an open access article distributed under the terms and conditions of the Creative Commons Attribution (CC BY) license (https://creativecommons.org/licenses/by/4.0/).
Share and Cite
Maner-Smith, K.M.; Ferranti, E.; Dunlop, A.; Corwin, E.; Ortlund, E.A. African American Women with Cardiometabolic Complications of Pregnancy Have Decreased Serum Abundance of Specialized Pro-Resolving Lipid Mediators and Endocannabinoids. Nutrients 2023, 15, 140. https://doi.org/10.3390/nu15010140
Maner-Smith KM, Ferranti E, Dunlop A, Corwin E, Ortlund EA. African American Women with Cardiometabolic Complications of Pregnancy Have Decreased Serum Abundance of Specialized Pro-Resolving Lipid Mediators and Endocannabinoids. Nutrients. 2023; 15(1):140. https://doi.org/10.3390/nu15010140
Chicago/Turabian StyleManer-Smith, Kristal M., Erin Ferranti, Anne Dunlop, Elizabeth Corwin, and Eric A. Ortlund. 2023. "African American Women with Cardiometabolic Complications of Pregnancy Have Decreased Serum Abundance of Specialized Pro-Resolving Lipid Mediators and Endocannabinoids" Nutrients 15, no. 1: 140. https://doi.org/10.3390/nu15010140