
Variation in the Early Life and Adult Intestinal Microbiome of Intra-Uterine Growth Restricted Rat Offspring Exposed to a High Fat and Fructose Diet
 , , , and
Abstract
:1. Introduction
2. Materials and Methods
2.1. Methods
Animals
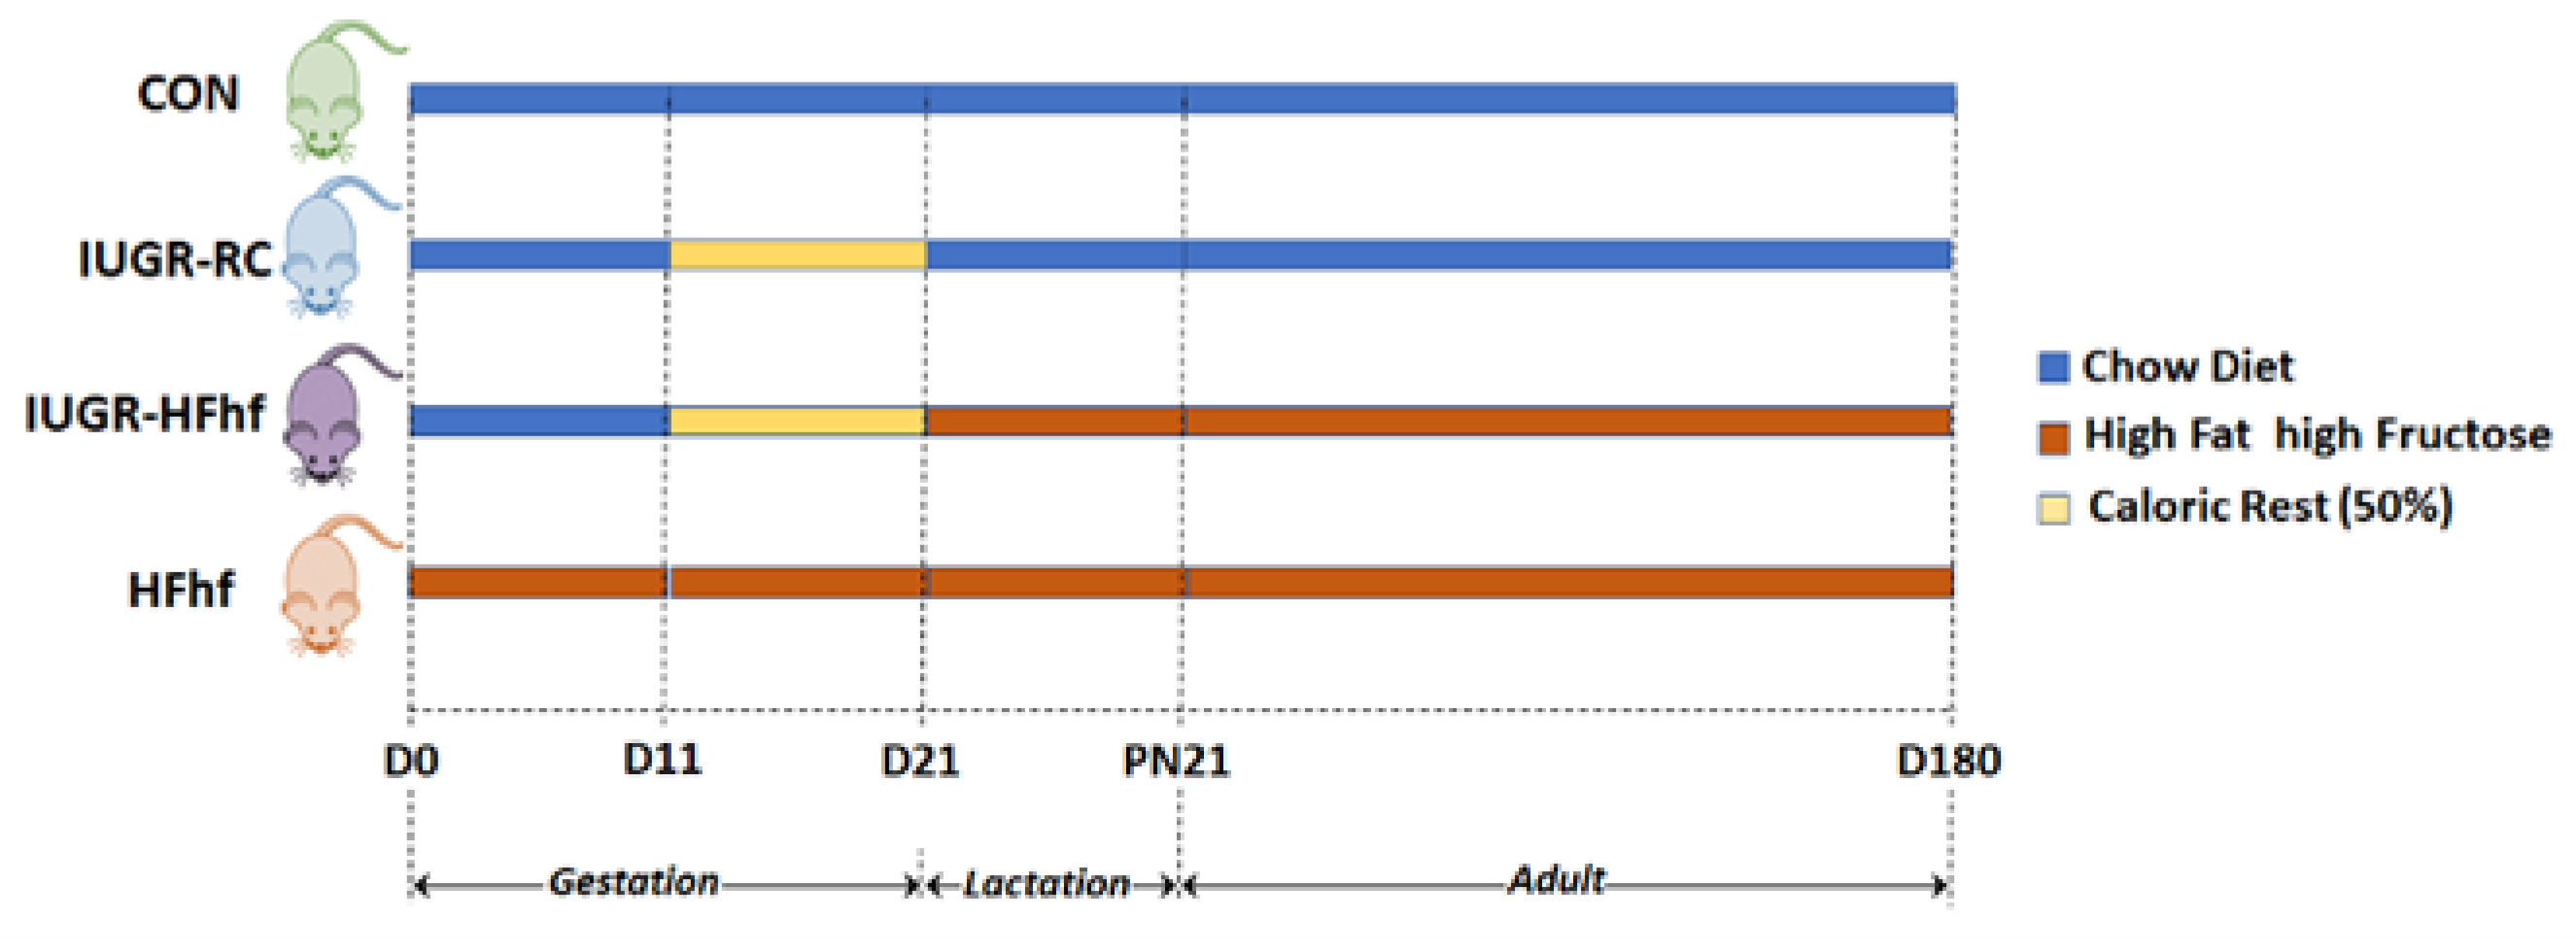
2.2. Study Design
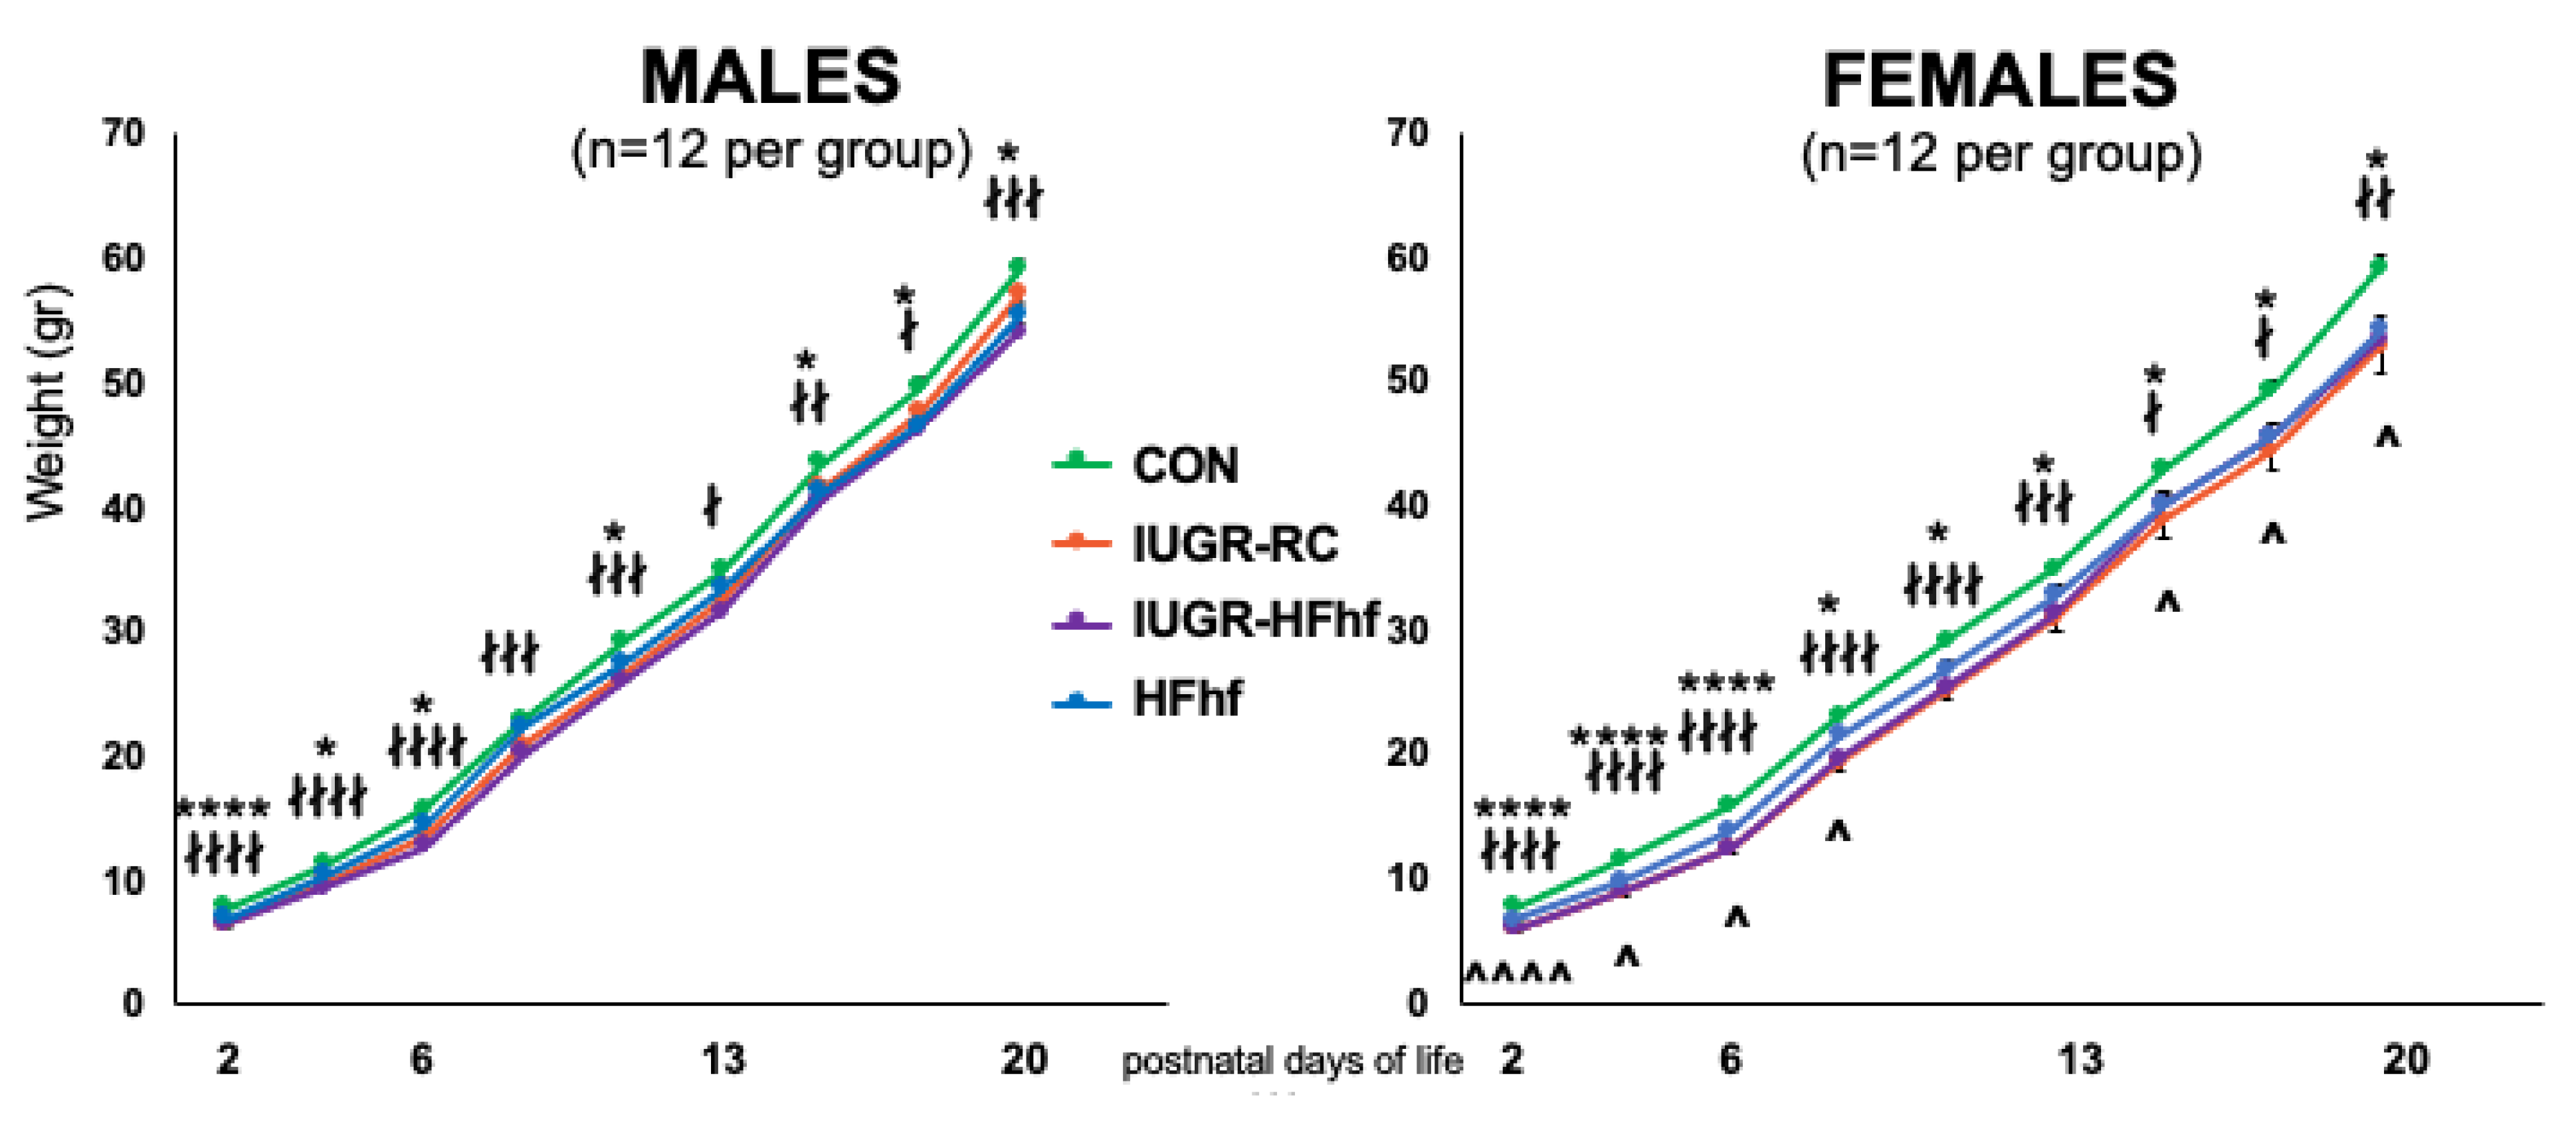
2.3. Anthropometric Measurements and Sample Collection
2.4. 16S rDNA Microbiota Profiling
2.5. Sequencing Data Processing and Analysis
2.6. Data Visualization
- Statistical Analysis:
3. Results
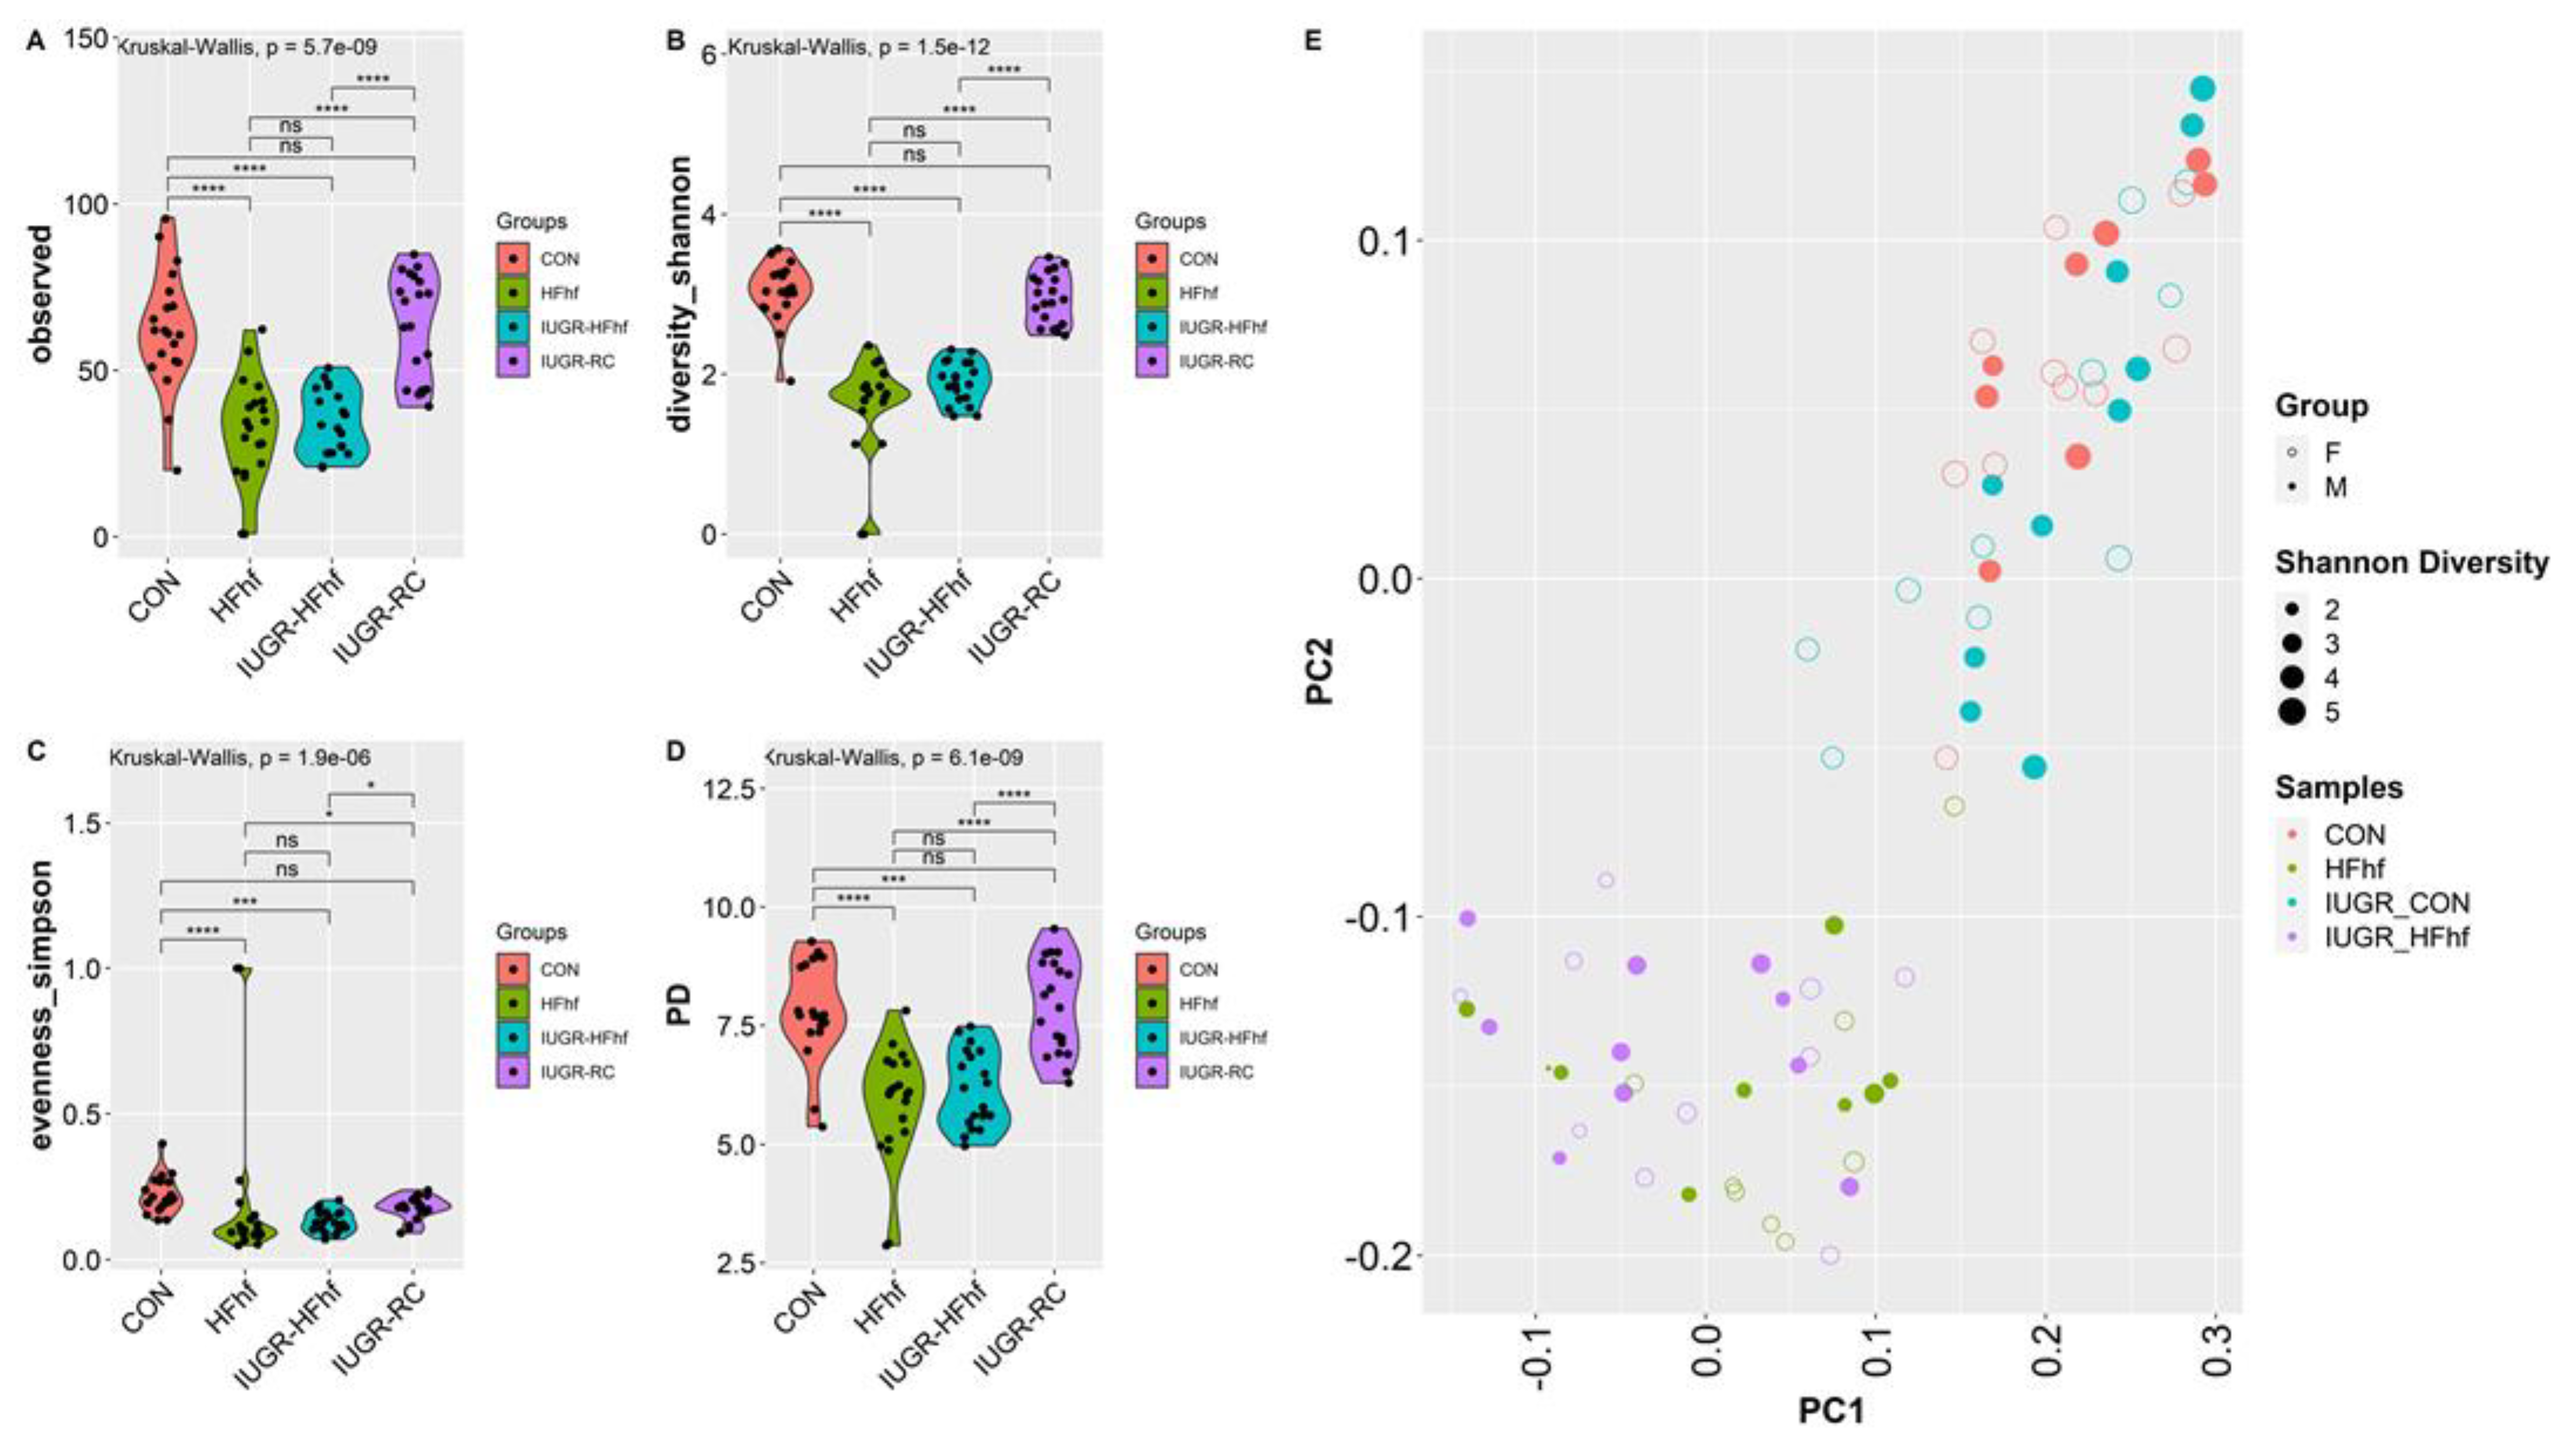
3.1. Gut Bacterial Diversity and Composition across Ages and Dietary Compositions
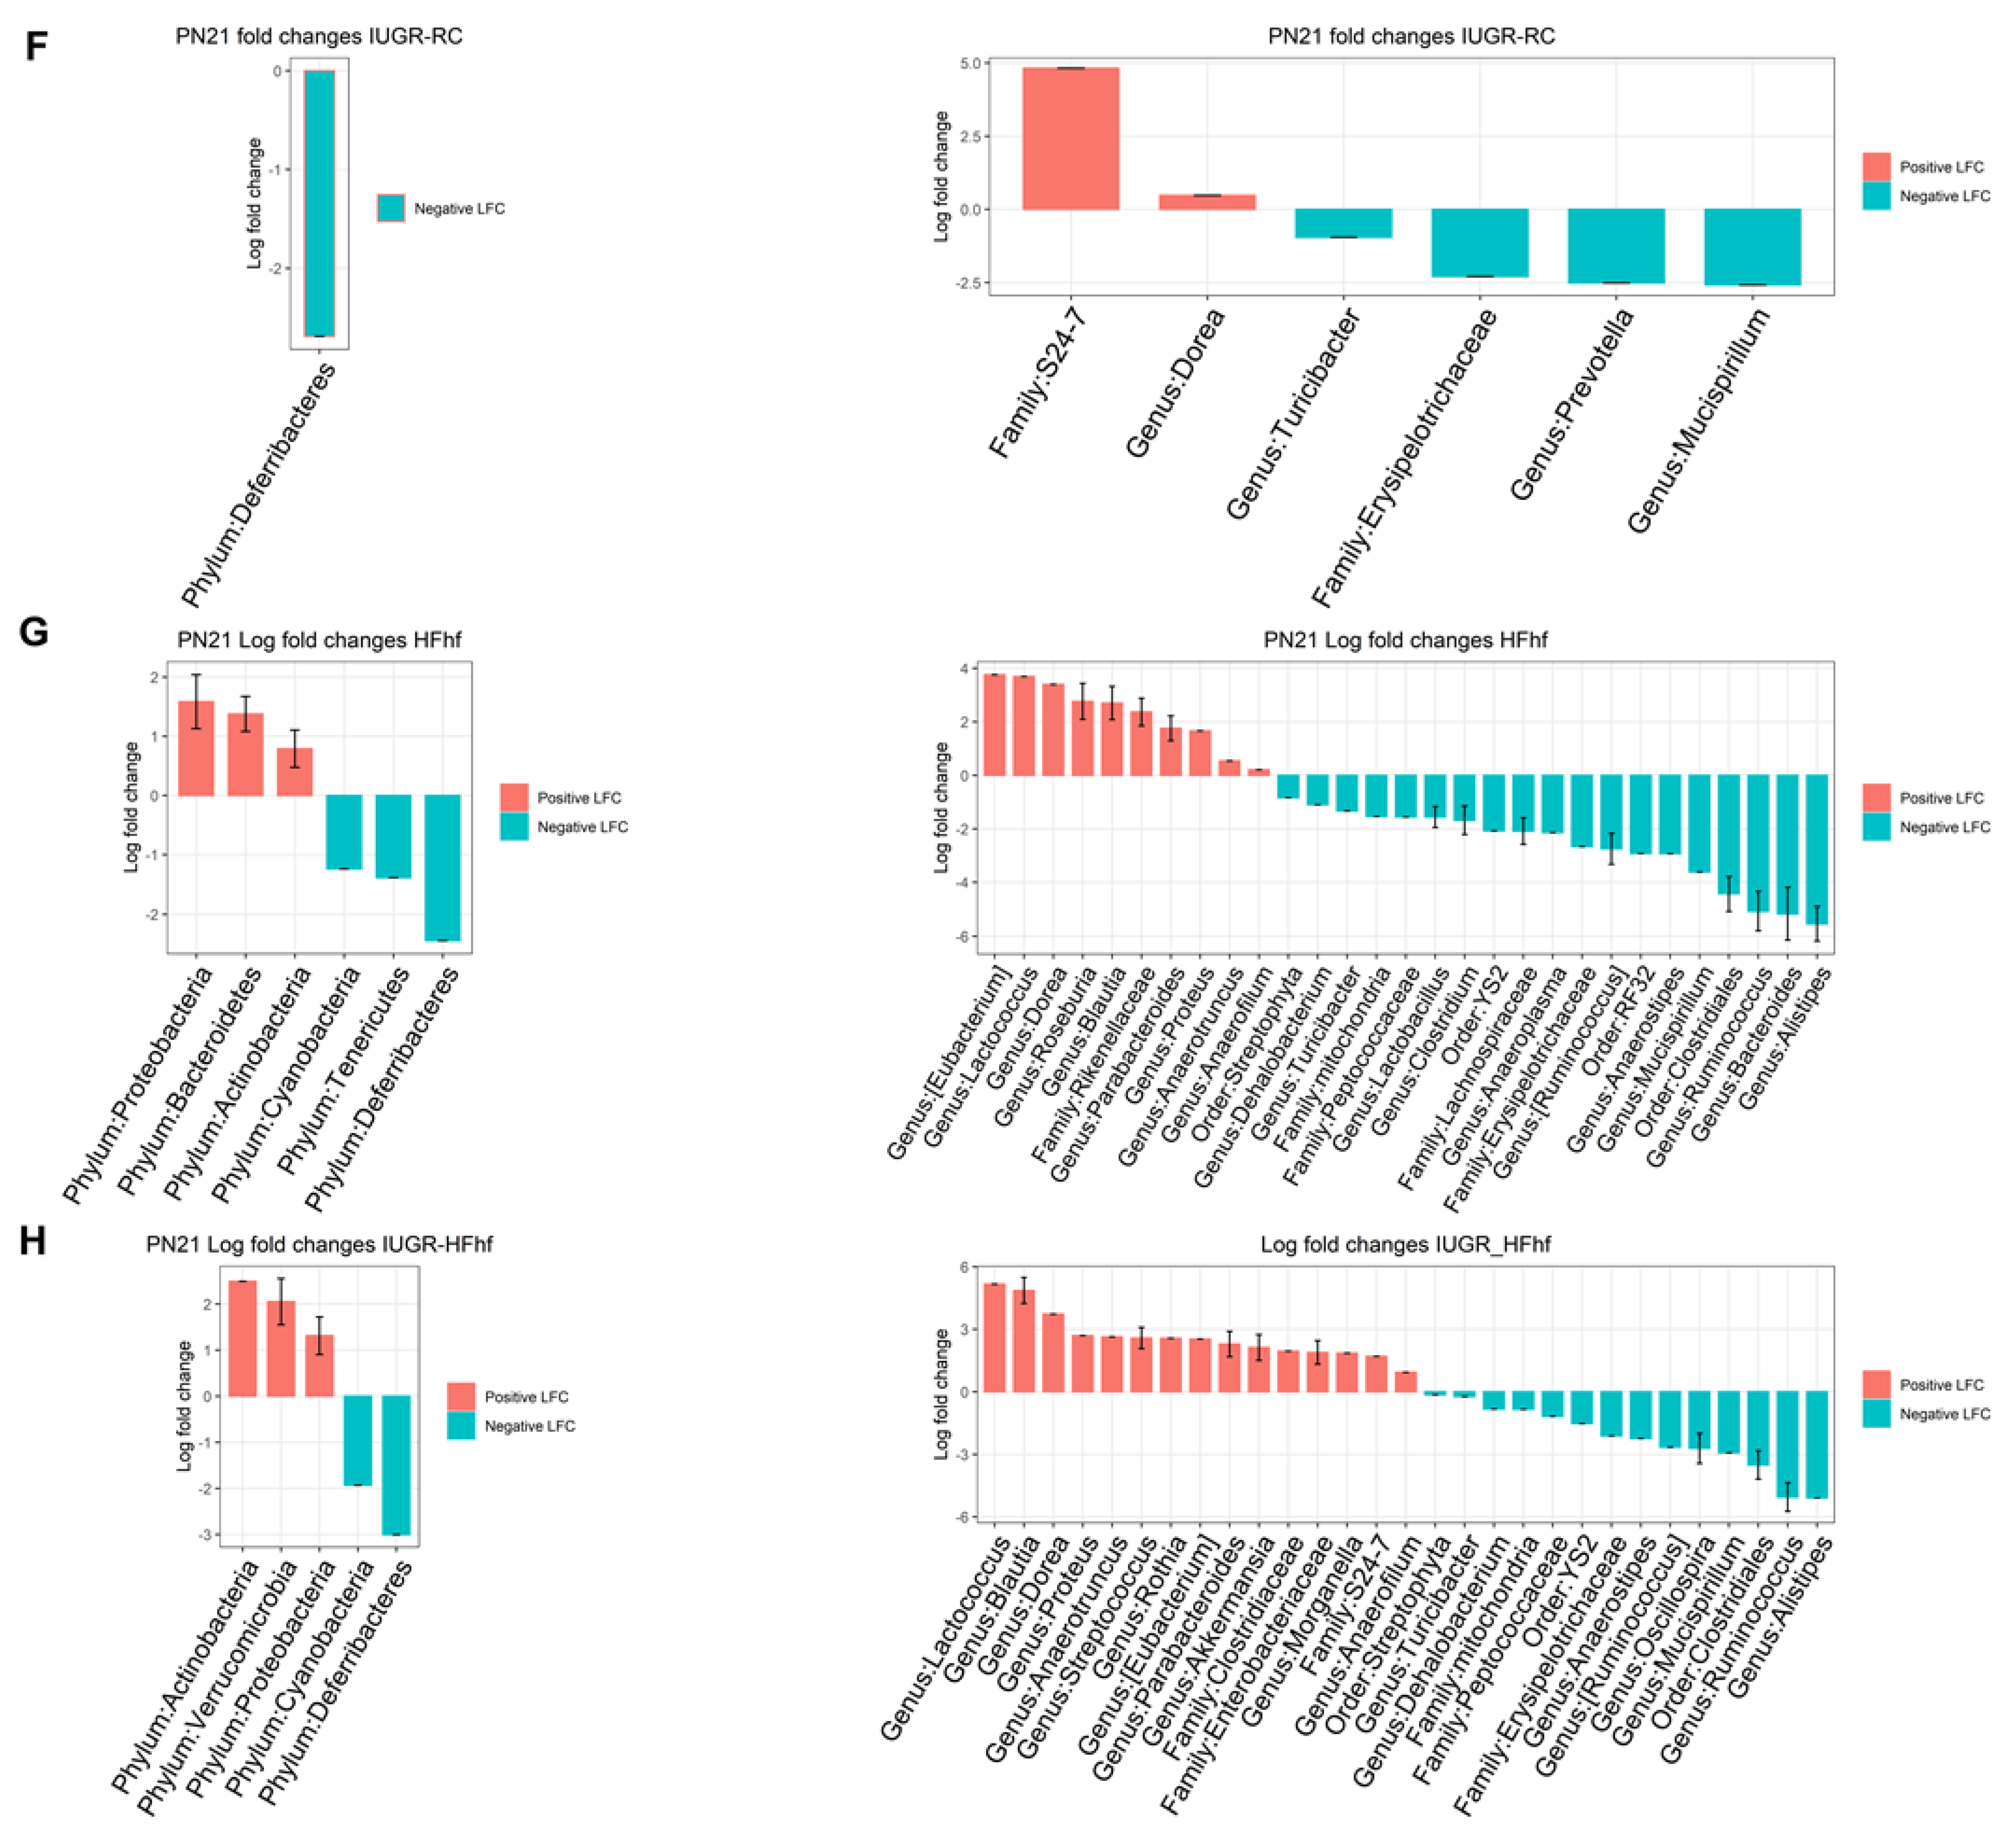
3.2. Effects of Dietary Influence on Gut Bacterial Diversity at Postnatal Stages PN2 and PN21
3.3. Effects of Early Dietary Influence on Adult Gut Bacteria
4. Discussion
5. Conclusions
Supplementary Materials
Author Contributions
Funding
Institutional Review Board Statement
Informed Consent Statement
Data Availability Statement
Conflicts of Interest
References
- Arumugam, M.; Raes, J.; Pelletier, E.; Le Paslier, D.; Yamada, T.; Mende, D.R.; Fernandes, G.R.; Tap, J.; Bruls, T.; Batto, J.M.; et al. Enterotypes of the human gut microbiome. Nature 2011, 473, 174–180. [Google Scholar] [CrossRef] [PubMed] [Green Version]
- Devaskar, S.U.; Chu, A. Intrauterine Growth Restriction: Hungry for an Answer. Physiology 2016, 31, 131–146. [Google Scholar] [CrossRef] [PubMed] [Green Version]
- Fall, C.H. Fetal programming and the risk of noncommunicable disease. Indian J. Pediatr. 2013, 80 (Suppl. 1), S13–S20. [Google Scholar] [CrossRef] [Green Version]
- Pullar, J.; Wickramasinghe, K.; Demaio, A.R.; Roberts, N.; Perez-Blanco, K.M.; Noonan, K.; Townsend, N. The impact of maternal nutrition on offspring’s risk of non-communicable diseases in adulthood: A systematic review. J. Glob. Health 2019, 9, 020405. [Google Scholar] [CrossRef] [PubMed]
- Cox, A.J.; West, N.P.; Cripps, A.W. Obesity, inflammation, and the gut microbiota. Lancet Diabetes Endocrinol. 2015, 3, 207–215. [Google Scholar] [CrossRef] [PubMed]
- Lecomte, V.; Kaakoush, N.O.; Maloney, C.A.; Raipuria, M.; Huinao, K.D.; Mitchell, H.M.; Morris, M.J. Changes in gut microbiota in rats fed a high fat diet correlate with obesity-associated metabolic parameters. PLoS ONE 2015, 10, e0126931. [Google Scholar] [CrossRef] [PubMed] [Green Version]
- Ma, J.; Prince, A.L.; Bader, D.; Hu, M.; Ganu, R.; Baquero, K.; Blundell, P.; Harris, R.A.; Frias, A.E.; Grove, K.L.; et al. High-fat maternal diet during pregnancy persistently alters the offspring microbiome in a primate model. Nat. Commun. 2014, 5, 3889. [Google Scholar] [CrossRef] [Green Version]
- Madan, J.C.; Hoen, A.G.; Lundgren, S.N.; Farzan, S.F.; Cottingham, K.L.; Morrison, H.G.; Sogin, M.L.; Li, H.; Moore, J.H.; Karagas, M.R. Association of Cesarean Delivery and Formula Supplementation with the Intestinal Microbiome of 6-Week-Old Infants. JAMA Pediatr. 2016, 170, 212–219. [Google Scholar] [CrossRef]
- Turnbaugh, P.J.; Gordon, J.I. The core gut microbiome, energy balance and obesity. J. Physiol. 2009, 587 Pt 17, 4153–4158. [Google Scholar] [CrossRef]
- Vaughn, A.C.; Cooper, E.M.; DiLorenzo, P.M.; O’Loughlin, L.J.; Konkel, M.E.; Peters, J.H.; Hajnal, A.; Sen, T.; Lee, S.H.; de La Serre, C.B.; et al. Energy-dense diet triggers changes in gut microbiota, reorganization of gut-brain vagal communication and increases body fat accumulation. Acta Neurobiol. Exp. 2017, 77, 18–30. [Google Scholar] [CrossRef]
- Backhed, F.; Ding, H.; Wang, T.; Hooper, L.V.; Koh, G.Y.; Nagy, A.; Semenkovich, C.F.; Gordon, J.I. The gut microbiota as an environmental factor that regulates fat storage. Proc. Natl. Acad. Sci. USA 2004, 101, 15718–15723. [Google Scholar] [CrossRef] [PubMed] [Green Version]
- Turnbaugh, P.J.; Ley, R.E.; Mahowald, M.A.; Magrini, V.; Mardis, E.R.; Gordon, J.I. An obesity-associated gut microbiome with increased capacity for energy harvest. Nature 2006, 444, 1027–1031. [Google Scholar] [CrossRef]
- Amdi, C.; Krogh, U.; Flummer, C.; Oksbjerg, N.; Hansen, C.F.; Theil, P.K. Intrauterine growth restricted piglets defined by their head shape ingest insufficient amounts of colostrum. J. Anim. Sci. 2013, 91, 5605–5613. [Google Scholar] [CrossRef] [PubMed] [Green Version]
- Jiang, L.; Feng, C.; Tao, S.; Li, N.; Zuo, B.; Han, D.; Wang, J. Maternal imprinting of the neonatal microbiota colonization in intrauterine growth restricted piglets: A review. J. Anim. Sci. Biotechnol. 2019, 10, 88. [Google Scholar] [CrossRef] [PubMed]
- Li, H.; He, Z.; Gao, D.; Lv, Y.; Zhou, Q.; Xiao, B.; Huang, W. Characteristics of the Intestinal Microbiota in Very Low Birth Weight Infants With Extrauterine Growth Restriction. Front. Pediatr. 2019, 7, 99. [Google Scholar] [CrossRef]
- Dai, Y.; Thamotharan, S.; Garg, M.; Shin, B.C.; Devaskar, S.U. Superimposition of postnatal calorie restriction protects the aging male intrauterine growth- restricted offspring from metabolic maladaptations. Endocrinology 2012, 153, 4216–4226. [Google Scholar] [CrossRef] [Green Version]
- Garg, M.; Thamotharan, M.; Dai, Y.; Thamotharan, S.; Shin, B.C.; Stout, D.; Devaskar, S.U. Early postnatal caloric restriction protects adult male intrauterine growth-restricted offspring from obesity. Diabetes 2012, 61, 1391–1398. [Google Scholar] [CrossRef] [Green Version]
- Shin, B.C.; Dai, Y.; Thamotharan, M.; Gibson, L.C.; Devaskar, S.U. Pre- and postnatal calorie restriction perturbs early hypothalamic neuropeptide and energy balance. J. Neurosci. Res. 2012, 90, 1169–1182. [Google Scholar] [CrossRef] [Green Version]
- Caporaso, J.G.; Lauber, C.L.; Walters, W.A.; Berg-Lyons, D.; Lozupone, C.A.; Turnbaugh, P.J.; Fierer, N.; Knight, R. Global patterns of 16S rRNA diversity at a depth of millions of sequences per sample. Proc. Natl. Acad. Sci. USA 2011, 108 (Suppl. 1), 4516–4522. [Google Scholar] [CrossRef] [Green Version]
- Tong, M.; Jacobs, J.P.; McHardy, I.H.; Braun, J. Sampling of intestinal microbiota and targeted amplification of bacterial 16S rRNA genes for microbial ecologic analysis. Curr. Protoc. Immunol. 2014, 107, 7–41. [Google Scholar] [CrossRef]
- Bolyen, E.; Rideout, J.R.; Dillon, M.R.; Bokulich, N.A.; Abnet, C.C.; Al-Ghalith, G.A.; Alexander, H.; Alm, E.J.; Arumugam, M.; Asnicar, F.; et al. Reproducible, interactive, scalable and extensible microbiome data science using QIIME 2. Nat. Biotechnol. 2019, 37, 852–857. [Google Scholar] [CrossRef] [PubMed]
- Callahan, B.J.; McMurdie, P.J.; Rosen, M.J.; Han, A.W.; Johnson, A.J.; Holmes, S.P. DADA2: High-resolution sample inference from Illumina amplicon data. Nat. Methods 2016, 13, 581–583. [Google Scholar] [CrossRef] [PubMed] [Green Version]
- McMurdie, P.J.; Holmes, S. phyloseq: An R package for reproducible interactive analysis and graphics of microbiome census data. PLoS ONE 2013, 8, e61217. [Google Scholar] [CrossRef] [PubMed] [Green Version]
- Ernst, F.S.S.; Borman, T.; Lahti, L. mia: Microbiome Analysis; R Package Version 1.6.0; 2022. [Google Scholar]
- Lin, H.; Peddada, S.D. Analysis of compositions of microbiomes with bias correction. Nat. Commun. 2020, 11, 3514. [Google Scholar] [CrossRef]
- Rabot, S.; Membrez, M.; Blancher, F.; Berger, B.; Moine, D.; Krause, L.; Bibiloni, R.; Bruneau, A.; Gerard, P.; Siddharth, J.; et al. High fat diet drives obesity regardless the composition of gut microbiota in mice. Sci. Rep. 2016, 6, 32484. [Google Scholar] [CrossRef] [Green Version]
- Zietak, M.; Kovatcheva-Datchary, P.; Markiewicz, L.H.; Stahlman, M.; Kozak, L.P.; Backhed, F. Altered Microbiota Contributes to Reduced Diet-Induced Obesity upon Cold Exposure. Cell Metab. 2016, 23, 1216–1223. [Google Scholar] [CrossRef] [Green Version]
- Togo, A.H.; Diop, A.; Dubourg, G.; Khelaifia, S.; Richez, M.; Armstrong, N.; Maraninchi, M.; Fournier, P.E.; Raoult, D.; Million, M. Anaerotruncus massiliensis sp. nov., a succinate-producing bacterium isolated from human stool from an obese patient after bariatric surgery. New Microbes New Infect. 2019, 29, 100508. [Google Scholar] [CrossRef]
- Chu, A.; Thamotharan, S.; Ganguly, A.; Wadehra, M.; Pellegrini, M.; Devaskar, S.U. Gestational food restriction decreases placental interleukin-10 expression and markers of autophagy and endoplasmic reticulum stress in murine intrauterine growth restriction. Nutr. Res. 2016, 36, 1055–1067. [Google Scholar] [CrossRef] [Green Version]
- Ganguly, A.; Touma, M.; Thamotharan, S.; De Vivo, D.C.; Devaskar, S.U. Maternal Calorie Restriction Causing Uteroplacental Insufficiency Differentially Affects Mammalian Placental Glucose and Leucine Transport Molecular Mechanisms. Endocrinology 2016, 157, 4041–4054. [Google Scholar] [CrossRef] [Green Version]
- Jones, H.N.; Woollett, L.A.; Barbour, N.; Prasad, P.D.; Powell, T.L.; Jansson, T. High-fat diet before and during pregnancy causes marked up-regulation of placental nutrient transport and fetal overgrowth in C57/BL6 mice. FASEB J. 2009, 23, 271–278. [Google Scholar] [CrossRef]
- Wang, Y.W.; Yu, H.R.; Tiao, M.M.; Tain, Y.L.; Lin, I.C.; Sheen, J.M.; Lin, Y.J.; Chang, K.A.; Chen, C.C.; Tsai, C.C.; et al. Maternal Obesity Related to High Fat Diet Induces Placenta Remodeling and Gut Microbiome Shaping That Are Responsible for Fetal Liver Lipid Dysmetabolism. Front. Nutr. 2021, 8, 736944. [Google Scholar] [CrossRef] [PubMed]
- Fujio-Vejar, S.; Vasquez, Y.; Morales, P.; Magne, F.; Vera-Wolf, P.; Ugalde, J.A.; Navarrete, P.; Gotteland, M. The Gut Microbiota of Healthy Chilean Subjects Reveals a High Abundance of the Phylum Verrucomicrobia. Front. Microbiol. 2017, 8, 1221. [Google Scholar] [CrossRef] [PubMed] [Green Version]
- Lindenberg, F.; Krych, L.; Fielden, J.; Kot, W.; Frokiaer, H.; van Galen, G.; Nielsen, D.S.; Hansen, A.K. Expression of immune regulatory genes correlate with the abundance of specific Clostridiales and Verrucomicrobia species in the equine ileum and cecum. Sci. Rep. 2019, 9, 12674. [Google Scholar] [CrossRef] [PubMed] [Green Version]
- Shin, B.C.; Ghosh, S.; Dai, Y.; Byun, S.Y.; Calkins, K.L.; Devaskar, S.U. Early life high-fat diet exposure maintains glucose tolerance and insulin sensitivity with a fatty liver and small brain size in the adult offspring. Nutr. Res. 2019, 69, 67–81. [Google Scholar] [CrossRef] [PubMed]
- Magne, F.; Gotteland, M.; Gauthier, L.; Zazueta, A.; Pesoa, S.; Navarrete, P.; Balamurugan, R. The Firmicutes/Bacteroidetes Ratio: A Relevant Marker of Gut Dysbiosis in Obese Patients? Nutrients 2020, 12, 1474. [Google Scholar] [CrossRef] [PubMed]
- Zhang, Y.K.; Zhang, Q.; Wang, Y.L.; Zhang, W.Y.; Hu, H.Q.; Wu, H.Y.; Sheng, X.Z.; Luo, K.J.; Zhang, H.; Wang, M.; et al. A Comparison Study of Age and Colorectal Cancer-Related Gut Bacteria. Front. Cell Infect. Microbiol. 2021, 11, 606490. [Google Scholar] [CrossRef]
- Mariat, D.; Firmesse, O.; Levenez, F.; Guimaraes, V.; Sokol, H.; Dore, J.; Corthier, G.; Furet, J.P. The Firmicutes/Bacteroidetes ratio of the human microbiota changes with age. BMC Microbiol. 2009, 9, 123. [Google Scholar] [CrossRef]
- Bisanz, J.E.; Upadhyay, V.; Turnbaugh, J.A.; Ly, K.; Turnbaugh, P.J. Meta-Analysis Reveals Reproducible Gut Microbiome Alterations in Response to a High-Fat Diet. Cell Host Microbe 2019, 26, 265–272.e264. [Google Scholar] [CrossRef]
- Ley, R.E.; Turnbaugh, P.J.; Klein, S.; Gordon, J.I. Microbial ecology: Human gut microbes associated with obesity. Nature 2006, 444, 1022–1023. [Google Scholar] [CrossRef]
- Schwiertz, A.; Taras, D.; Schafer, K.; Beijer, S.; Bos, N.A.; Donus, C.; Hardt, P.D. Microbiota and SCFA in lean and overweight healthy subjects. Obesity 2010, 18, 190–195. [Google Scholar] [CrossRef]
- Gomes, A.C.; Hoffmann, C.; Mota, J.F. The human gut microbiota: Metabolism and perspective in obesity. Gut Microbes 2018, 9, 308–325. [Google Scholar] [CrossRef] [PubMed] [Green Version]
- Edgar, R.; Domrachev, M.; Lash, A.E. Gene expression omnibus: NCBI gene expression and hybridization array data repository. Nucleic Acids Res. 2002, 30, 207–219. [Google Scholar] [CrossRef] [PubMed]


Disclaimer/Publisher’s Note: The statements, opinions and data contained in all publications are solely those of the individual author(s) and contributor(s) and not of MDPI and/or the editor(s). MDPI and/or the editor(s) disclaim responsibility for any injury to people or property resulting from any ideas, methods, instructions or products referred to in the content. |
© 2023 by the authors. Licensee MDPI, Basel, Switzerland. This article is an open access article distributed under the terms and conditions of the Creative Commons Attribution (CC BY) license (https://creativecommons.org/licenses/by/4.0/).
Share and Cite
Maggiotto, L.V.; Ghosh, S.; Shin, B.-C.; Ganguly, A.; Lagishetty, V.; Jacobs, J.P.; Devaskar, S.U. Variation in the Early Life and Adult Intestinal Microbiome of Intra-Uterine Growth Restricted Rat Offspring Exposed to a High Fat and Fructose Diet. Nutrients 2023, 15, 217. https://doi.org/10.3390/nu15010217
Maggiotto LV, Ghosh S, Shin B-C, Ganguly A, Lagishetty V, Jacobs JP, Devaskar SU. Variation in the Early Life and Adult Intestinal Microbiome of Intra-Uterine Growth Restricted Rat Offspring Exposed to a High Fat and Fructose Diet. Nutrients. 2023; 15(1):217. https://doi.org/10.3390/nu15010217
Chicago/Turabian StyleMaggiotto, Liesbeth V., Shubhamoy Ghosh, Bo-Chul Shin, Amit Ganguly, Venu Lagishetty, Jonathan P. Jacobs, and Sherin U. Devaskar. 2023. "Variation in the Early Life and Adult Intestinal Microbiome of Intra-Uterine Growth Restricted Rat Offspring Exposed to a High Fat and Fructose Diet" Nutrients 15, no. 1: 217. https://doi.org/10.3390/nu15010217