Article

An Isocaloric High-Fat Diet Regulates Partially Genetically Determined Fatty Acid and Carbohydrate Uptake and Metabolism in Subcutaneous Adipose Tissue of Lean Adult Twins

by
Michael Kruse
1,2,*,
Silke Hornemann
1,2,
Anne-Cathrin Ost
2,
Turid Frahnow
2,
Daniela Hoffmann
2,
Andreas Busjahn
3,
Martin A. Osterhoff
1,2,
Bettina Schuppelius
1 and
Andreas F. H. Pfeiffer
1,2,4
1
Department of Endocrinology, Diabetes and Nutrition, Charité—Universitätsmedizin Berlin, Corporate Member of Freie Universität Berlin, Humboldt-Universität zu Berlin, and Berlin Institute of Health, Charitéplatz 1, 10117 Berlin, Germany
2
German Institute of Human Nutrition Potsdam-Rehbruecke, Arthur-Scheunert-Allee 114-116, 14558 Nuthetal, Germany
3
Health TwiSt GmbH, Robert-Rössle-Strasse 10, 13125 Berlin, Germany
4
German Center for Diabetes Research (DZD), Ingolstädter Landstrasse 1, 85764 Neuherberg, Germany
*
Author to whom correspondence should be addressed.
Nutrients 2023, 15(10), 2338; https://doi.org/10.3390/nu15102338
Submission received: 9 April 2023 / Revised: 9 May 2023 / Accepted: 11 May 2023 / Published: 16 May 2023
(This article belongs to the Section Nutrition and Metabolism)

Abstract

:
Background: The dysfunction of energy metabolism in white adipose tissue (WAT) induces adiposity. Obesogenic diets that are high in saturated fat disturb nutrient metabolism in adipocytes. This study investigated the effect of an isocaloric high-fat diet without the confounding effects of weight gain on the gene expression of fatty acid and carbohydrate transport and metabolism and its genetic inheritance in subcutaneous (s.c.) WAT of healthy human twins. Methods: Forty-six healthy pairs of twins (34 monozygotic, 12 dizygotic) received an isocaloric carbohydrate-rich diet (55% carbohydrates, 30% fat, 15% protein; LF) for 6 weeks followed by an isocaloric diet rich in saturated fat (40% carbohydrates, 45% fat, 15% protein; HF) for another 6 weeks. Results: Gene expression analysis of s.c. WAT revealed that fatty acid transport was reduced after one week of the HF diet, which persisted throughout the study and was not inherited, whereas intracellular metabolism was decreased after six weeks and inherited. An increased inherited gene expression of fructose transport was observed after one and six weeks, potentially leading to increased de novo lipogenesis. Conclusion: An isocaloric dietary increase of fat induced a tightly orchestrated, partially inherited network of genes responsible for fatty acid and carbohydrate transport and metabolism in human s.c. WAT.

1. Introduction

The dysfunction of energy metabolism in white adipose tissue (WAT) is responsible for the development of obesity and subsequently chronic diseases, such as metabolic syndrome, diabetes mellitus type 2 and cardiovascular diseases [1]. Alarming epidemiological data indicate that by the year 2025, obesity will affect 21% of women and 18% of men worldwide [2]. Major risk factors promoting obesity are overeating of unhealthy hypercaloric diets, a sedentary lifestyle and genetic predisposition [3]. Adipose tissue generates and stores energy mainly from dietary fats and carbohydrates depending upon availability [4]. Under healthy, non-pathological conditions, the uptake and metabolism of fats and carbohydrates in adipocytes are tightly regulated and assure balanced lipid storage [3]. During obesity, these mechanisms are disturbed, which can result in systemic insulin resistance and inflammation [3]. The majority of studies that investigated nutrient uptake and energy metabolism in adipocytes are performed once overt obesity has already occurred and/or after consuming different types of hypercaloric diets. However, periods of consuming unhealthy diets without weight change might precede the development of obesity. In light of today’s eating habits, studies that investigate nutrient uptake mechanisms and their potential genetic determination in adipose tissue prior to the manifestation of obesity are needed and relevant for understanding the development of pathological energy metabolism and for developing concepts of personalized nutrition.
In adipocytes, free fatty acids (FFAs) are hydrolyzed from triglycerides of plasma lipoproteins by lipoprotein lipase (LPL) [5,6] and transported into the cell via the transmembrane receptor fatty acid translocase (FAT)/cluster of differentiation 36 (CD36) [7]. Once FFAs are high in the bloodstream, CD36 expression increases in adipocytes [8]. CD36 is believed to be involved in the development of adipose tissue insulin resistance in humans and is increased in adipocytes during obesity [9]. In the adipocyte, FFAs are re-esterified and stored as triglycerides in lipid droplets.
Carbohydrates mainly enter the adipocyte by specific transmembrane glucose transporter (GLUT) proteins that allow for the transport of monosaccharides across the plasma membrane via facilitated diffusion [10]. GLUT4 is the major glucose transporter in adipose tissue and is stored in intracellular vesicles that translocate to the plasma membrane upon insulin stimulation, allowing for a very rapid uptake of glucose into the cell [11]. GLUT1 is a ubiquitous glucose transporter that maintains basal glucose uptake [12]. In the cell, glucose undergoes glycolysis and its metabolite pyruvate enters the mitochondria and is further oxidized to acetyl coenzyme A, which, in turn, is utilized by fatty acid synthase (FASN) for de novo fatty acid synthesis [13]. FASN in adipose tissue is increased during obesity [14] and by consuming diets containing high amounts of carbohydrates [15]. It was shown that adipocytes also utilize fructose that enters the cell through GLUT5, which exclusively transports fructose [16]. In vitro studies showed that the lipogenesis of adipocytes was enhanced in the presence of increased fructose concentration [17]. Fructose is metabolized either to pyruvate and subsequently used for de novo fatty acid synthesis or to glycerol-3-phosphate, which is required for fatty acid re-esterification. However, whether GLUT5-mediated fructose metabolism in human adipose tissue is affected by other diets, e.g., a diet high in saturated fats without an excess of fructose, is currently unknown.
Heritability studies in twins suggested that both genetic and environmental factors contribute to the development of metabolic syndrome [18]. In this study, we investigated the early effects of a switch from an isocaloric healthy high-carbohydrate, low-saturated-fat diet to an isocaloric low-carbohydrate, high-saturated-fat diet on the gene expression of fatty acid and carbohydrate uptake and metabolism in subcutaneous adipose tissue in a cohort of 34 monozygotic and 12 dizygotic pairs of healthy twins. We aimed to evaluate the heritability of the gene expression in adipocytes without the confounding effects of weight gain and to explore early genetic markers that might precede the development of obesity in this human cohort.

2. Experimental Section

2.1. Study Participants
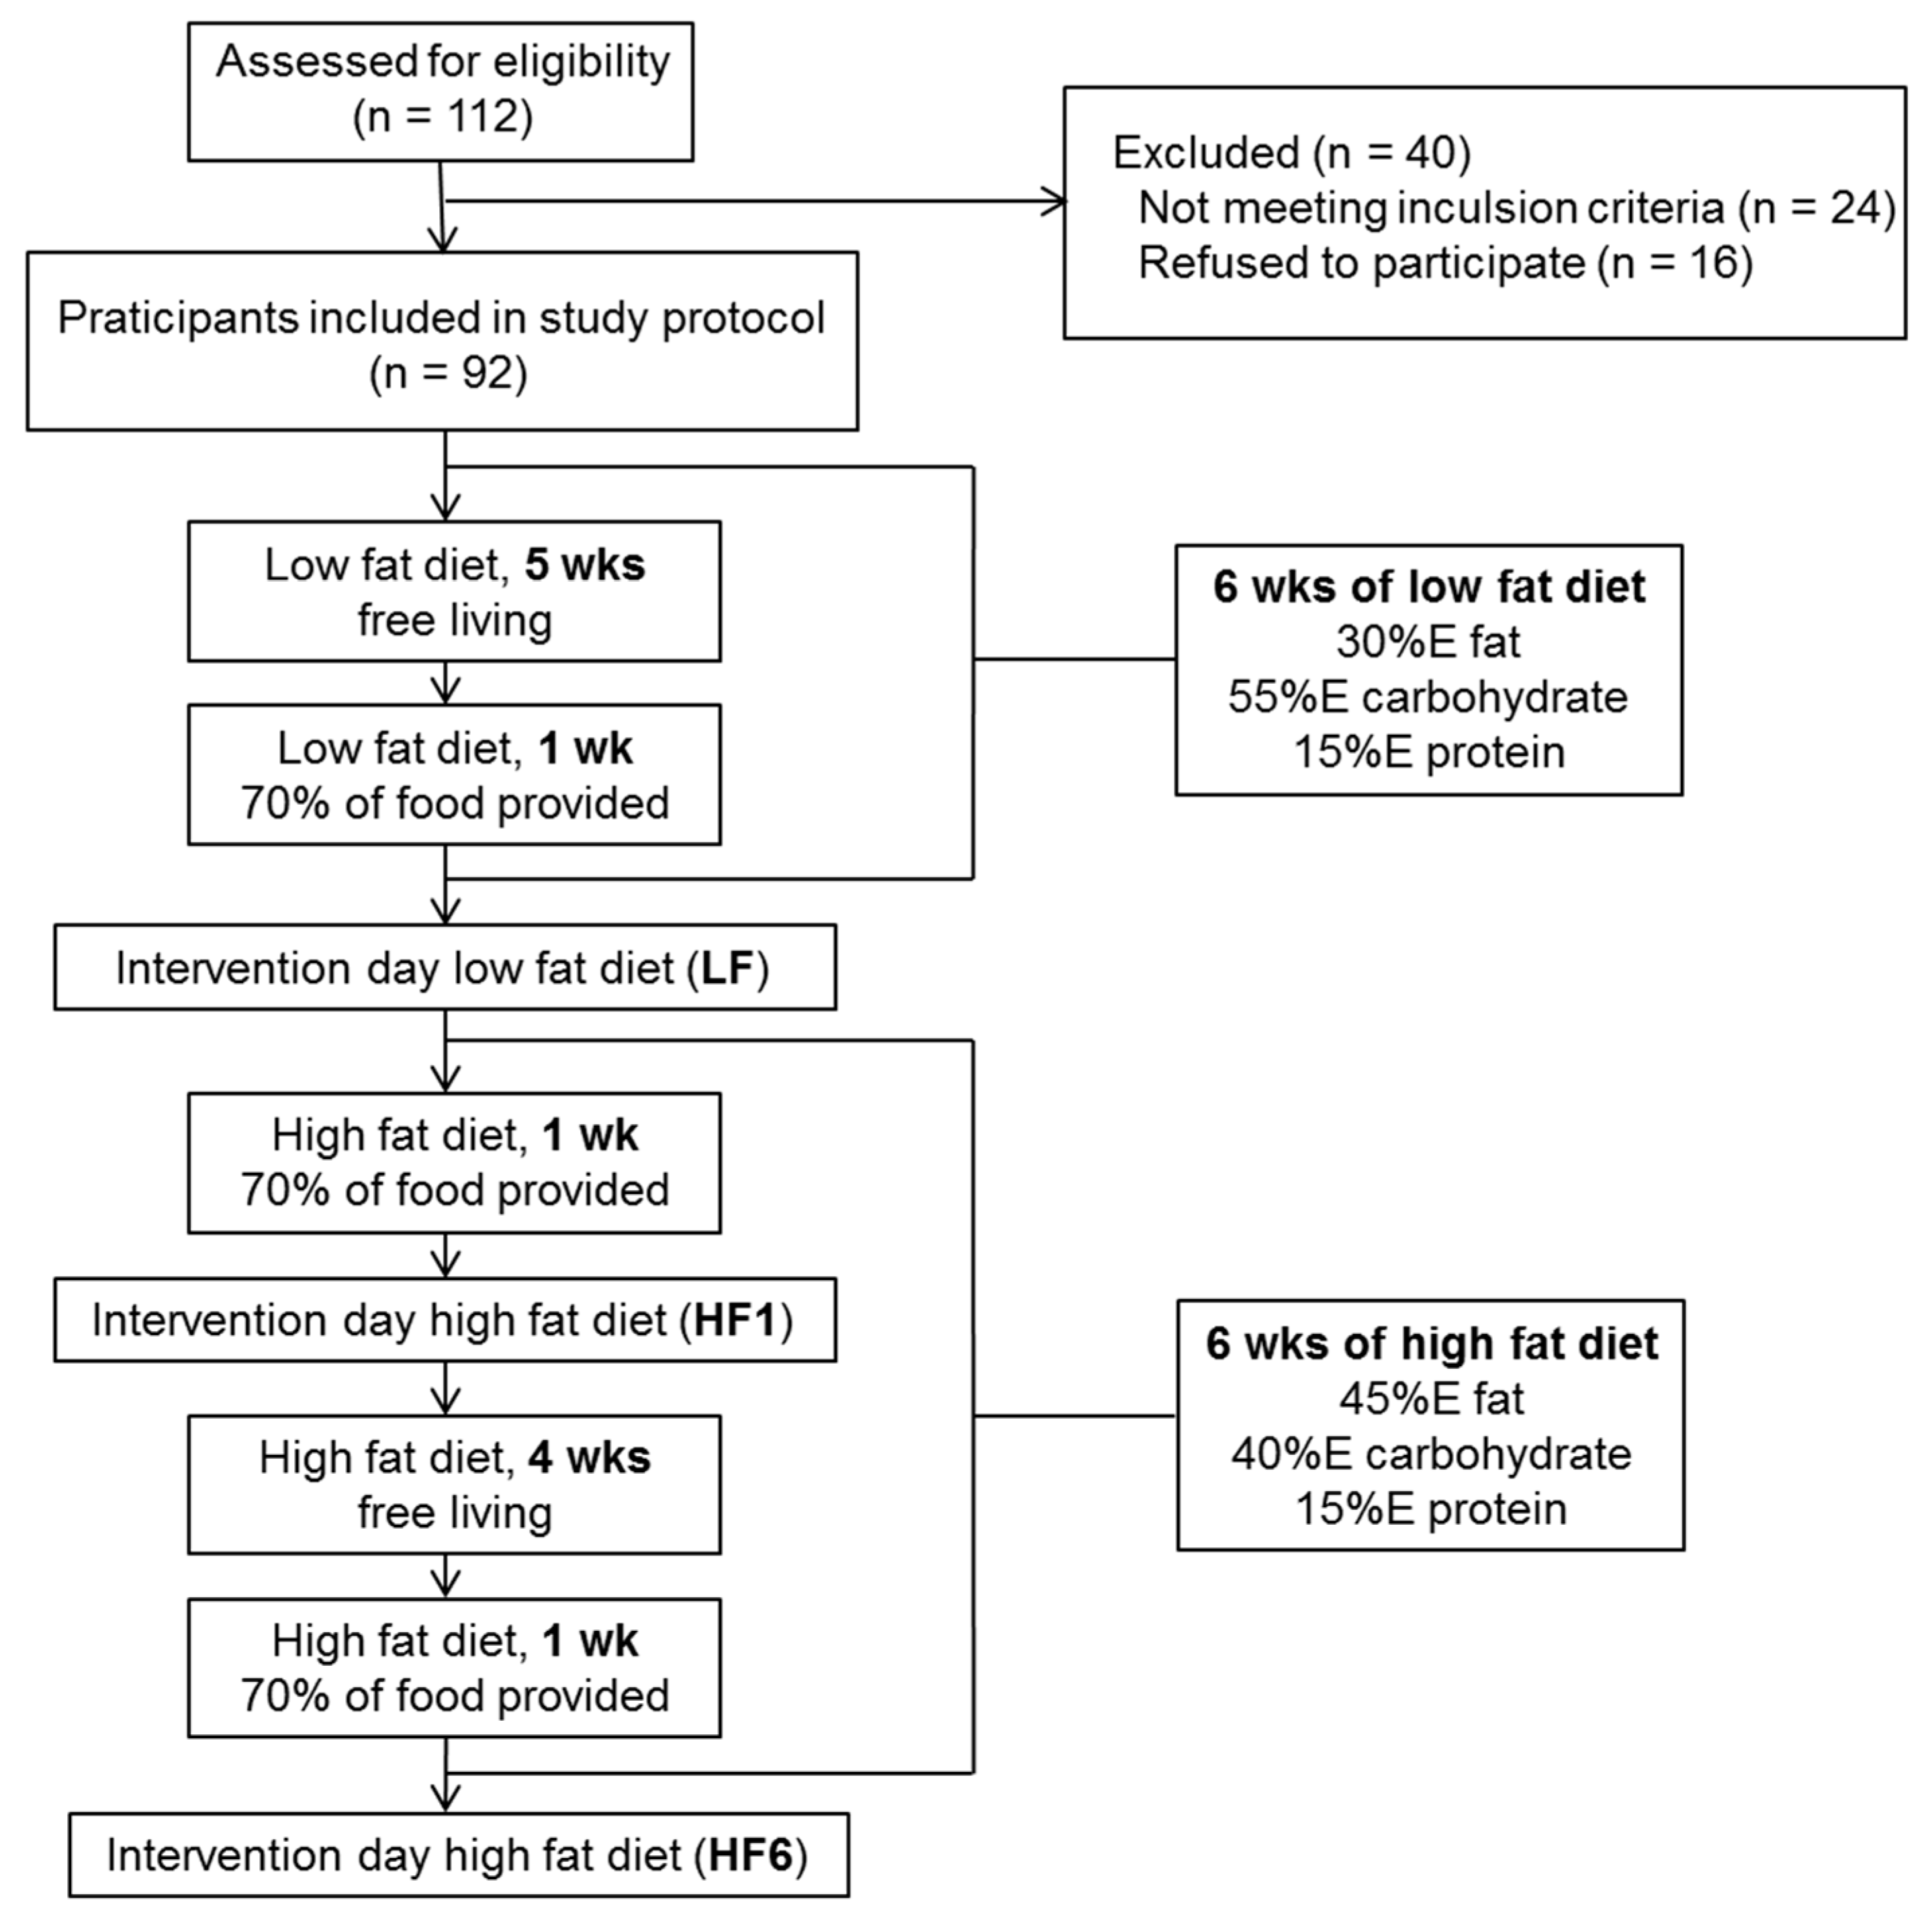
Pairs of twins were recruited either from a twin register (HealthTwiSt, Berlin, Germany) or by advertisements in the local newspapers. A total of 34 monozygotic and 12 dizygotic pairs of twins (a total of 92 individuals), aged 18–70 years, a body mass index (BMI) of 18.5–29 kg/m2, with a difference in BMI not higher than 3 kg/m2 were included in the study. The study design was explained in detail and all participants gave their written informed consent before they participated in the study. The study protocol was approved by the local ethical committee of the Charité University of Medicine, Berlin, Germany (protocol code EA4/021/09, date of approval 26 September 2009) and was in accordance with the Declaration of Helsinki of 1975, as revised in 2013. This study was registered at ClinicalTrials.gov (NCT01631123).
At the initial visit, a physical examination was performed and fasted blood (12 h fast overnight) was collected for analysis of a red blood count, serum lipids, glucose and insulin. A 75 g oral glucose tolerance test was performed to exclude impaired glucose homeostasis or diabetes mellitus. Indirect calorimetry was used to measure the resting energy expenditure (REE) and the physical activity level (PAL) was assessed using a questionnaire. Body weight (kg), height (m), and waist and hip circumferences (cm) were taken and the body mass index (BMI) and waist-to-hip-ratio were calculated. Participants were asked to fill out a dietary food record for five days (four weekdays, one weekend day) prior to the study to evaluate their dietary habits. Exclusion criteria of this study were as followed: a medical history of consuming chronic illnesses, diabetes mellitus, change in body weight >3 kg within three months prior to the study, drugs influencing metabolic homeostasis, lipid metabolism, liver metabolism or inflammation (e.g., systemic corticosteroids), a difference in BMI higher than 3 kg/m2 between twins, or an unwillingness to follow the protocol or to give informed consent. The baseline characteristics of monozygotic and dizygotic pairs of twins are shown in Table 1.

2.2. Study Design

The timeline of the study is shown in Figure 1. Prior to the dietary intervention, individual energy requirements were calculated based on the participants’ REE and PAL, and individual goals for consuming carbohydrates, fat and protein were determined to achieve the consumption of an isocaloric diet. All participants started with six weeks of a high-carbohydrate, low-fat diet containing 55%E carbohydrates, 30%E fat and 15%E protein. During the first five weeks, participants were instructed to consume the diet in a free-living mode. They received a list with detailed information on 94 food items, how to exchange and combine them and which foods to prefer or avoid. To ensure compliance, participants were given intensive counseling and support by the nutritionist and were asked to complete a five-day food record after three weeks on the diet. For the last week on the high-carbohydrate, low-fat diet, all participants were provided with approximately 70 percent of the food and detailed meal plans to ensure a standardized dietary pattern. Again, participants received intensive counseling from the nutritionist and were asked to complete a six-day food record. Immediately after the six weeks of the high-carbohydrate, low-fat diet, participants underwent the first day of investigation (LF). Fasted blood was drawn for routine laboratory markers. Anthropometric measurements (body weight, BMI, waist-to-hip ratio) were performed and the total body fat content was determined. A biopsy of abdominal subcutaneous adipose tissue was performed for the gene expression analysis. From then on, the diet was changed to a low-carbohydrate, high-fat diet containing 40%E carbohydrates, 45%E fat and 15%E protein for an additional six weeks. Again, 70 percent of food was provided for the first week of this period and participants were asked to complete a six-day food record. After this week, the participants underwent the second intervention day to assess the short-term effects of the low-carbohydrate, high-fat diet (HF1). On the HF1 intervention day, the participants received intensive nutritional counseling. For the next four weeks, the participants were instructed to consume the diet in a free-living mode. After a total of three weeks on the low-carbohydrate, high-fat diet, they were asked to complete a five-day food record and had a detailed telephone counseling session with the nutritionist. For the last week of the low-carbohydrate, high-fat diet, the participants were again handed out approximately 70 percent of the appropriate food, received intensive nutritional counseling in person in our unit and detailed meal plans, and were asked to complete a six-day food record. At the end of the entire low-carbohydrate, high-fat period, a third intervention day was performed (HF6). On each intervention day, all tests were performed at the same time of the day to ensure comparability.

2.3. Blood Analyses

Routine serum parameters (red blood count, total cholesterol, HDL, triglycerides, free fatty acids) were measured using standard techniques in a certified laboratory for clinical chemistry at the German Institute of Human Nutrition after an overnight fast at 8:00 am. LDL cholesterol was calculated from the above data. Serum insulin was measured using commercially available ELISA (Mercodia, Uppsala, Sweden). Glucose concentrations were measured in venous serum samples (ABX Pentra 400; ABX Diagnostics, Montpellier, France).

2.4. Adipose Tissue Biopsy

On each investigation day, a biopsy of the subcutaneous adipose tissue fat pad was performed laterally to the umbilicus via needle aspiration. After local anesthesia (1% lidocaine), a needle connected to a syringe was inserted into the adipose tissue. A vacuum was applied and approximately 1 g of tissue was taken. The tissue was rinsed briefly with 0.9% NaCl saline, immediately snap-frozen in liquid nitrogen and stored at −80° C for further analyses.

2.5. Gene Expression Analyses

mRNA expression analysis was performed in adipose tissue using quantitative real-time PCR as described previously [19]. Approximately 500 mg of tissue was homogenized using a speed mill (Speed Mill 12, Analytik Jena, Jena, Germany) in QIAzol® lysis buffer provided with the RNeasy® Lipid Tissue Midi Kit (Qiagen, Hilden, Germany). mRNA was extracted by following the manufacturer’s instructions for the kit. The purity of the mRNA was tested using a spectrophotometer (NanoDrop Technologies, Wilmington, NC, USA). mRNA was used only if the E280/E260 quotient was between 1.8 and 2.0 and the E260/E230 quotient was between 1.8 and 2.2. To assess the quality of the mRNA, the RNA integrity number (RIN) was determined using a 2100 Bioanalyzer (Agilent Technologies, Santa Clara, CA, USA). If an RIN > 8.0 was obtained, the mRNA was accepted for further processing. cDNA was synthesized using a High-Capacity cDNA Reverse Transcription Kit (Applied Biosystems Inc., Forster City, CA, USA). Gene expression analysis was performed via quantitative real-time PCR using Power-SYBR®Green-PCR_Master Mix (Applied Biosystems, Thermo Fisher Scientific Inc., Waltham, MA, USA) and the Applied Biosystems® ViiA7TM real-time PCR System (Waltham, MA, USA). Analyses were performed in triplicates. To verify the purity of the PCR products and exclude non-specific PCR products, e.g., primer dimers, a melting curve analysis was performed and PCR products were separated on a 2% agarose gel. Gene expression analysis was performed for adiponectin (adipoq), carnitine palmitoyltransferase 1A (cpt1a), fatty acid translocase (FAT)/cluster of differentiation 36 (cd36), fatty acid synthase (fasn), GLUT1 (slc2a1), GLUT4 (slc2a4), GLUT5 (slc2a5), GLUT8 (slc2a8), peroxisome proliferator-activated receptor gamma (pparg), peroxisome proliferator-activated receptor gamma, coactivator 1 alpha (ppargc1a), pyruvate dehydrogenase kinase, isozyme 4 (pdk4), interleukin-6 (il6), lipoprotein lipase (lpl) and tumor necrosis factor alpha (tnfa). The constitutively expressed gene ribosomal protein L32 (rpl32) was used as a loading control. A list of primer sequences is shown in Table S1. Gene sequences for primer design were determined using the National Institute of Health (NIH), USA, website www.ncbi.nlm.nih.gov/sites/entrez, and primers were designed using Primer Express 2.0 (Applied Biosystems, Carlsberg, USA). Primer pairs were selected if they had similar melting points, were covering intron-spanning regions and had no ability to form dimers. The specificity of primers was tested using the Basic Local Alignment Search Tool (BLAST) (http://blast.ncbi.nlm.nih.gov/Blast.cgi). Gene expression was determined using a standard curve. Target genes were normalized to the constitutively expressed gene rpl32.

2.6. Statistical Analysis and Quantitative Genetics

Before the analysis, data were tested for plausibility. Values outside of the threefold interquartile range were declared as extreme outliers and not considered for further analysis.
The Kolmogorov–Smirnov test was used to assess variables for normal distribution. Continuous variables with skewed distribution were natural logarithm (ln)-transformed. One-way or repeated-measures ANOVA followed by a Bonferroni post hoc test was used to compare mean values for continuous data. To verify significant results for non-normally distributed data, the Kruskal–Wallis test was used. All data are given as the mean ± standard deviation (SD). Statistical analysis was performed using SPSS 20.0 (SPSS, Chicago, IL, USA) and the integrated development environment RStudio (version 0.97.336), which is based on R (version 3.0.0). A two-sided p-value < 0.05 was considered significant. The correlation analysis was performed with Spearman’s rank correlation coefficient (Spearman’s rho).
For the estimation of heritability, the “ACE” structural equation model was applied. This covariance analysis relied on comparing the degree of concordance within and between monozygotic versus dizygotic twin pairs and decomposed the proportion of variance into (A) additive genetic influences and (C) common environmental and (E) individual environmental influences. The “ACE” model was calculated using R 2.15.0 plus the OpenMX package. Genotype frequencies were analyzed for deviation from the Hardy–Weinberg equilibrium with a chi-squared test using R 3.1.2 plus the Hardy–Weinberg package 1.5.5.

3. Results

3.1. Body Weight, BMI, Serum Lipids, Glucose and Insulin

Over the twelve weeks of the dietary intervention, body weight and BMI did not change for monozygotic twins (MZ) or dizygotic twins (DZ) (Table 2). Serum total cholesterol increased after six weeks on the low-carbohydrate, high-fat diet (HF6) compared with six weeks on the high-carbohydrate, low-fat diet (LF); however, this reached significance in MZ (1.09-fold, p = 0.021) only (Table 2). Serum-free fatty acids decreased significantly at HF6 compared with LF 18.5% in MZ (p = 0.004) and 15.5% in DZ (p = 0.008) (Table 2). Blood glucose and insulin levels did not change significantly over the time of the intervention. When calculating the HOMA-IR, we saw a significant increase at HF1 and HF6 for MZ and at HF1 for DZ compared with LF. However, despite the significance, the numerical increase in HOMA-IR was low. We did not observe any changes in serum LDL cholesterol, HDL cholesterol or triglycerides (Table 2).

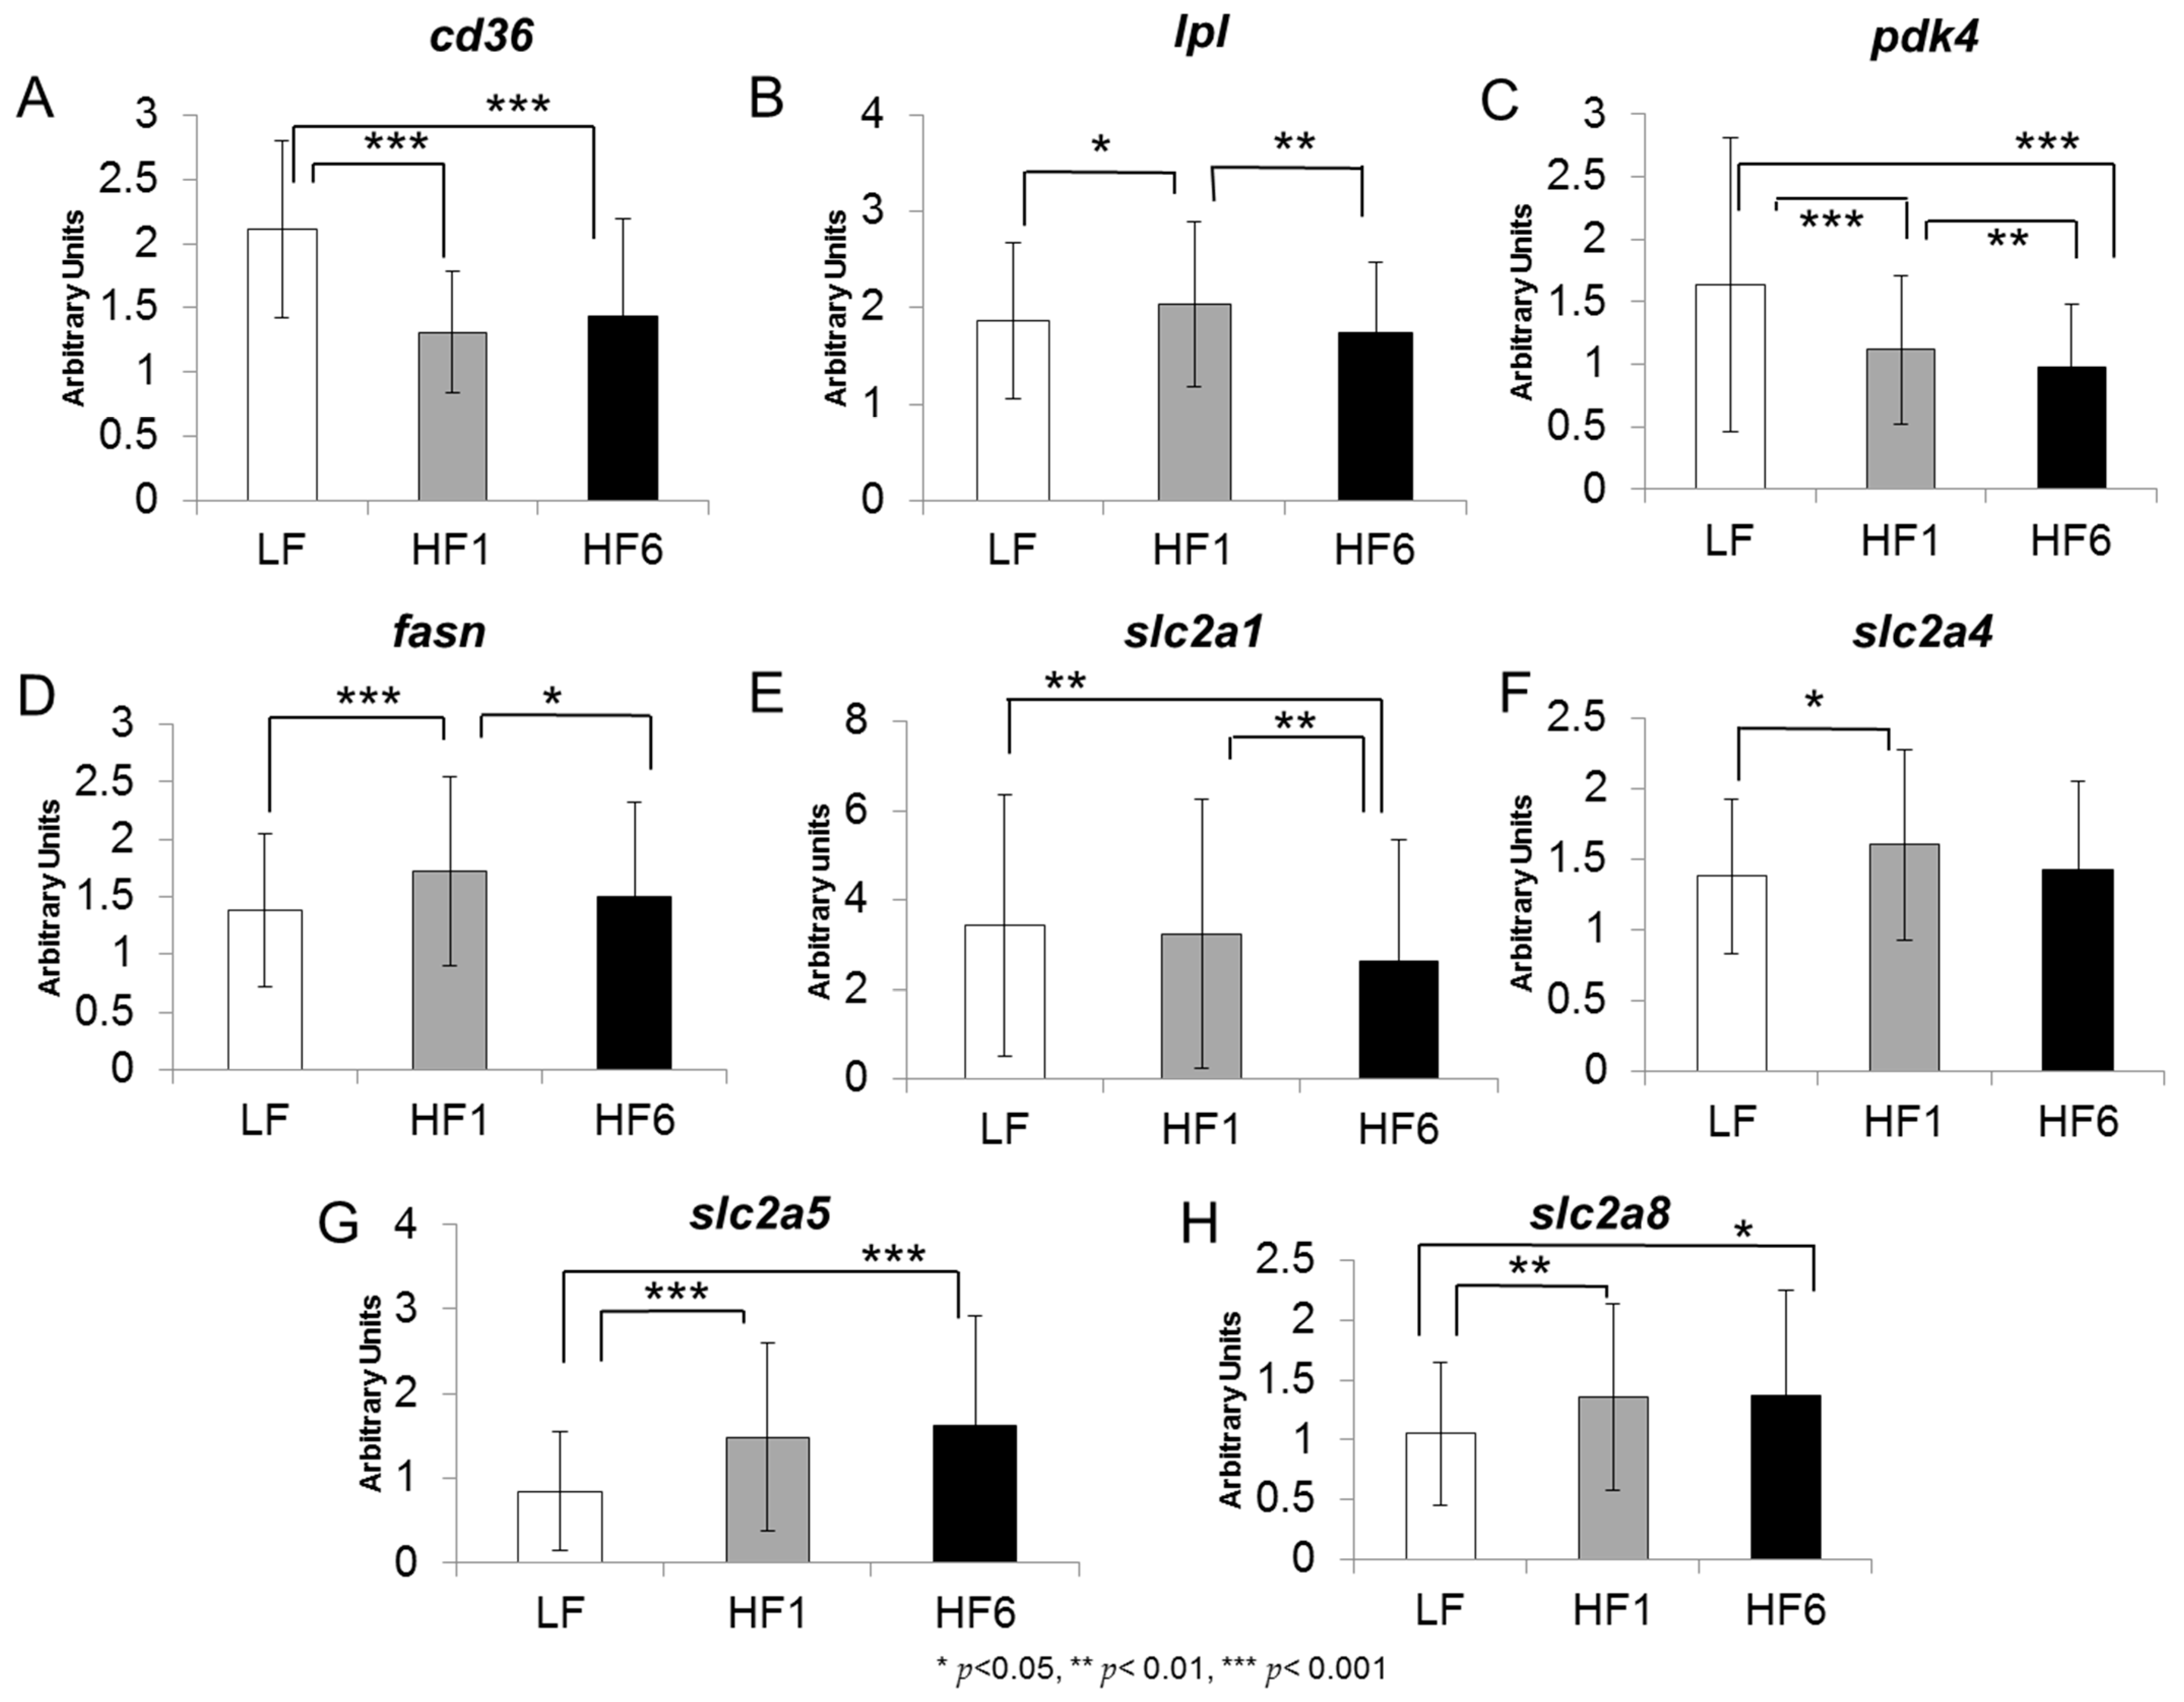
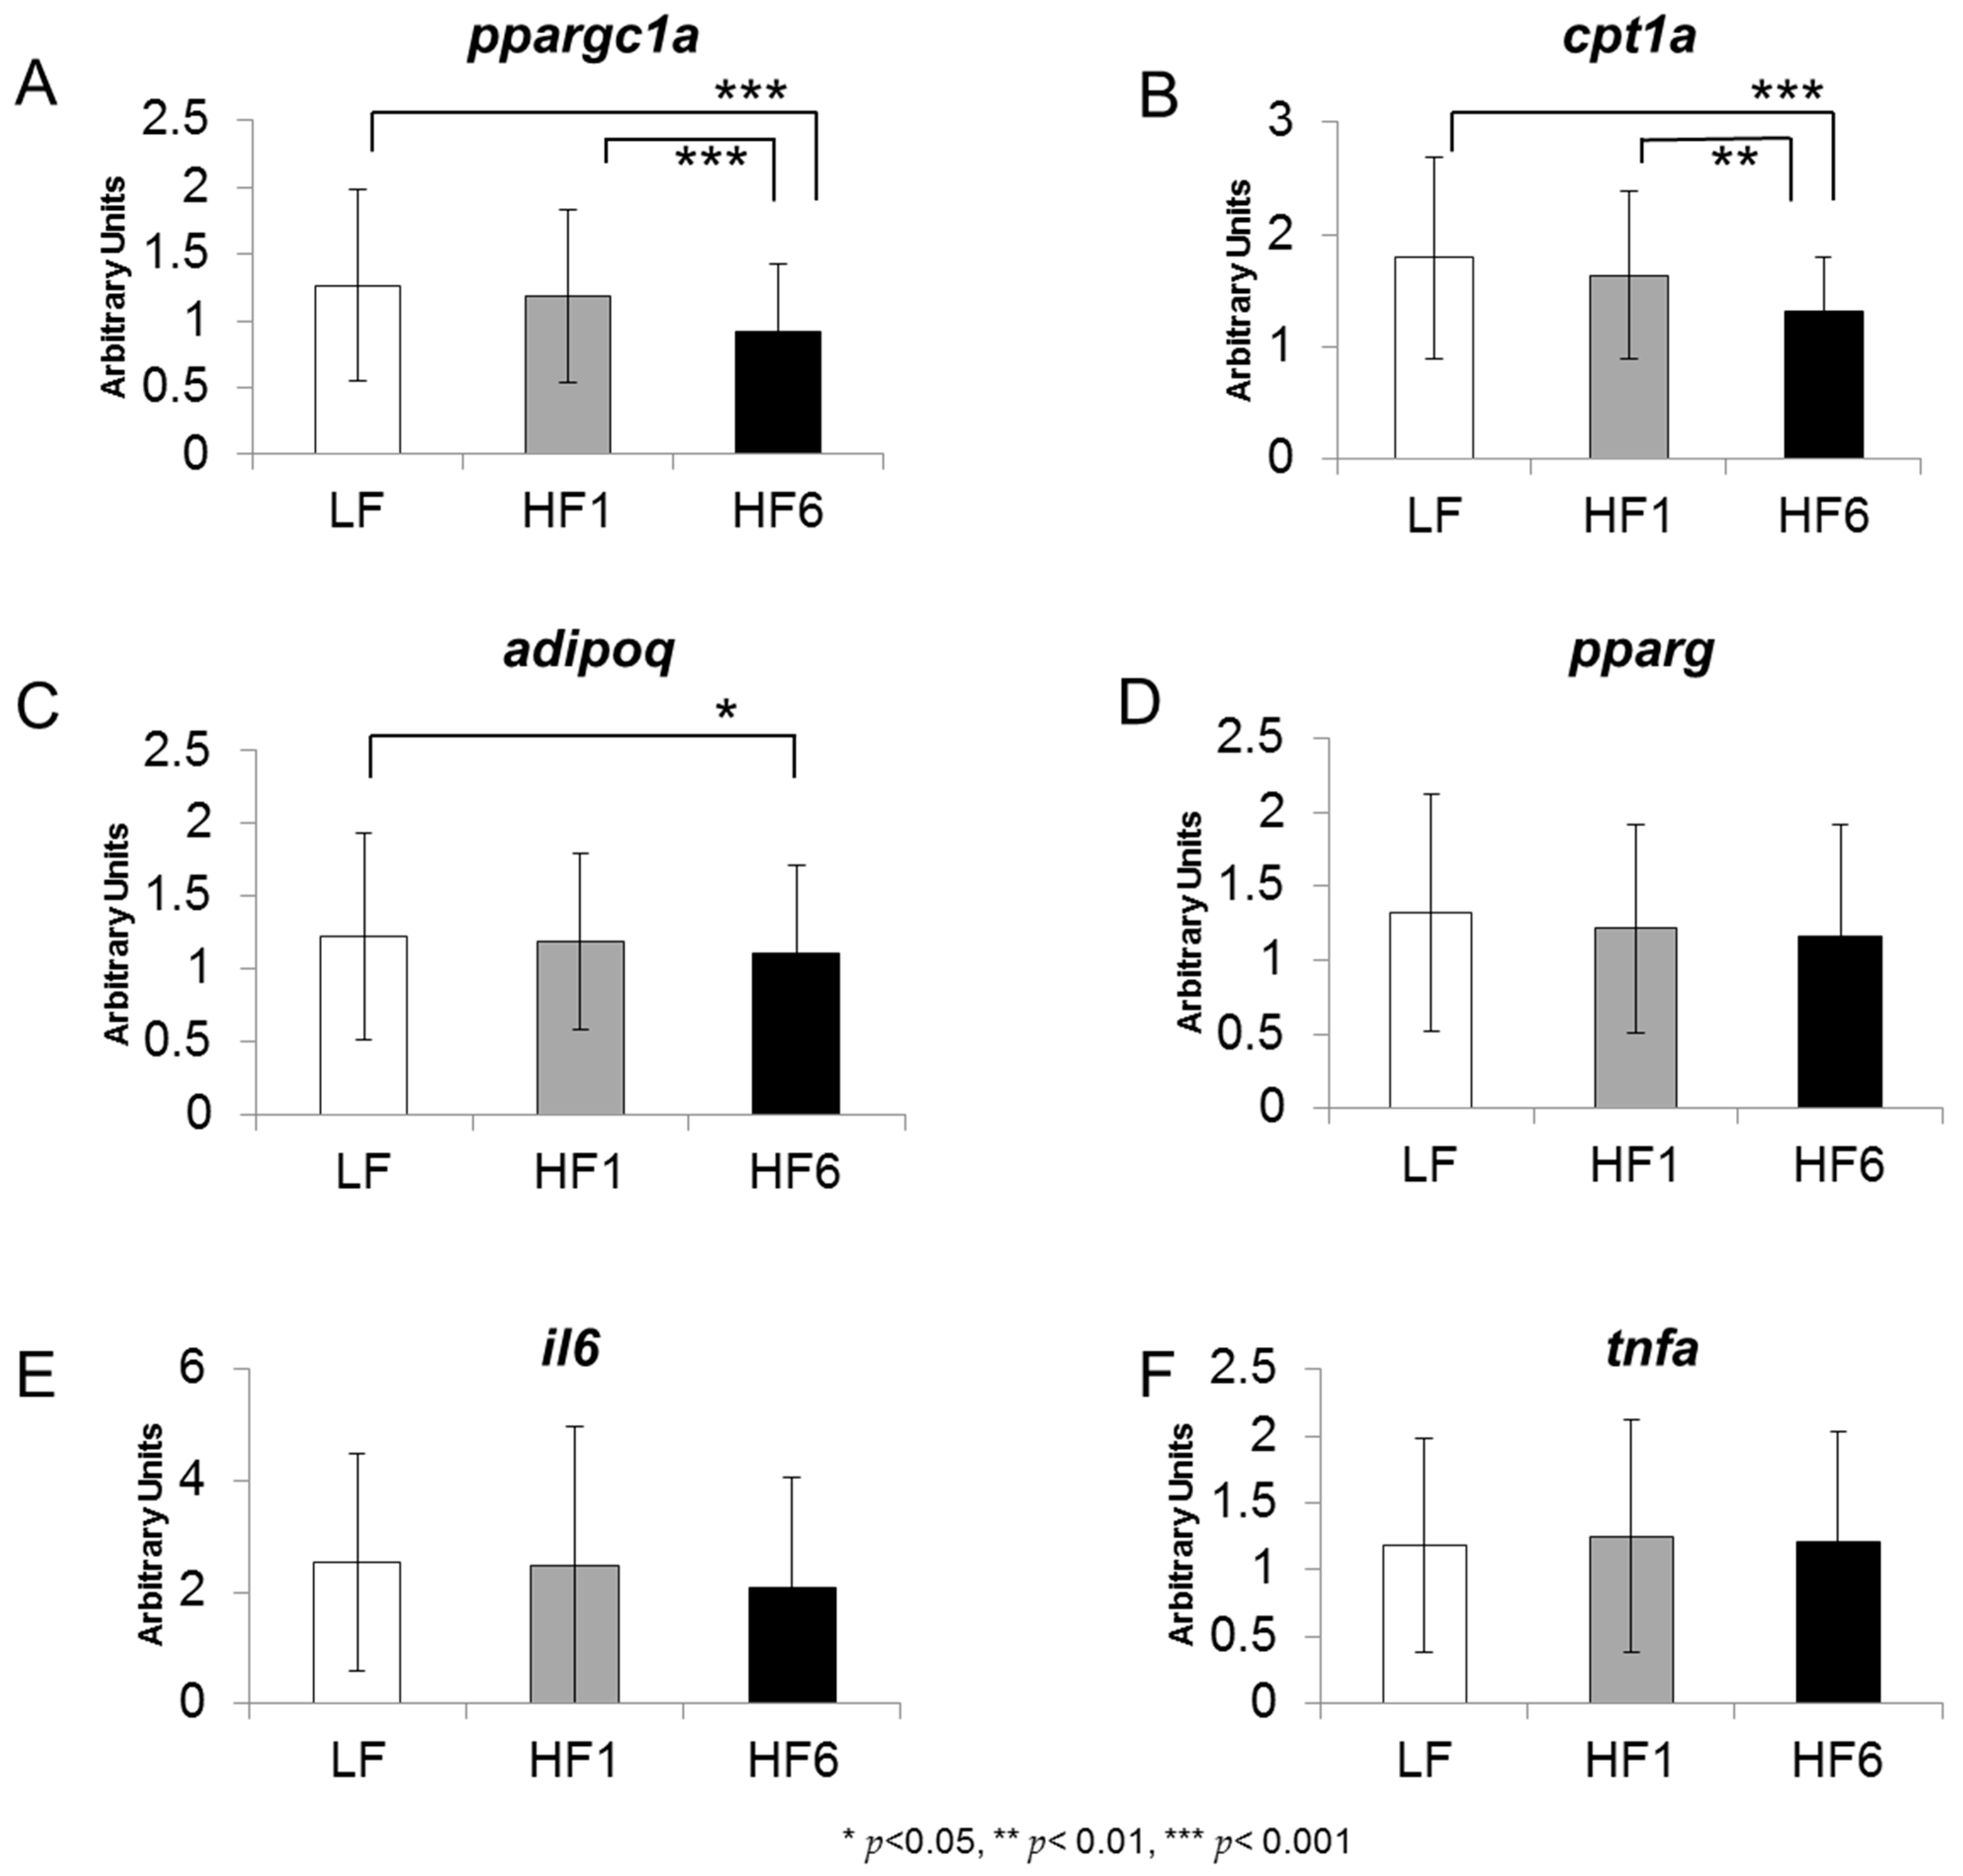
3.2. Gene Expression in Human s.c. Adipose tissue

The overall gene expressions for all individuals in the study are shown in Figure 2 and Figure 3. The gene expression of cd36 was strongly decreased by 37.8% after one week (HF1) and by 31.8% after six weeks (HF6) of the isocaloric high-fat diet compared with LF (for both p < 0.001) (Figure 2A). For the lpl gene expression, a 1.10-fold increase was seen at HF1 compared with LF (p = 0.025) and was significantly decreased at HF6 (p = 0.002 compared with HF1) (Figure 2B).
A significant decrease in the gene expression of pdk4 of 31.7% was observed at HF1 (p < 0.001 compared with LF) and was even more downregulated by 40.1% at HF6 (p < 0.001 compared with LF and p = 0.002 compared with HF1) (Figure 2C). An increase in the gene expression was observed at HF1 for fasn (1.24-fold, p < 0.001), and significantly decreased by 12.5% at HF6 (p = 0.019 compared with HF1) (Figure 2D).
The gene expression of slc2a1 was not affected by the acute switch from the isocaloric high-carbohydrate, low-fat diet to the isocaloric low-carbohydrate, high-fat diet, but decreased by 23.5% after six weeks (p = 0.001 compared with LF and HF1) (Figure 2E). The slc2a4 gene expression showed a 1.16-fold increase at HF1 compared with LF (p = 0.042, Figure 2F). However, this increase disappeared at HF6. For slc2a5, we observed a strong upregulation of the gene expression at HF1 compared with LF (1.77-fold, p = 0.001) that further increased at HF6 (1.92-fold compared with LF, p = 0.001) (Figure 2G). The slc2a8 gene expression showed a marked increase at HF1 compared with LF (1.29-fold, p = 0.001) that persisted at HF6 (1.31-fold increase compared with LF, p = 0.038) (Figure 2H).
For ppargc1a and cpt1a, we did not observe any changes in the gene expression after one week of the diet rich in saturated fat, but a significant decrease after six weeks of 12.0% for ppargc1a (p < 0.001 compared with LF and HF1) and of 26.8% for cpt1a (p < 0.001 compared with LF and p = 0.002 compared with HF1) (Figure 3A,B).
For the gene expression of adipoq, a slight decrease of 8.9% was observed after six weeks of the diet rich in saturated fat (p = 0.018 compared with LF, Figure 3C).
We did not observe any significant differences in the gene expressions for pparg, il6 and tnfa (Figure 3D–F).
Table 3 shows a synopsis of the genes investigated in this study, their functions and their regulations after exposure to the low-carbohydrate, high-fat diet.

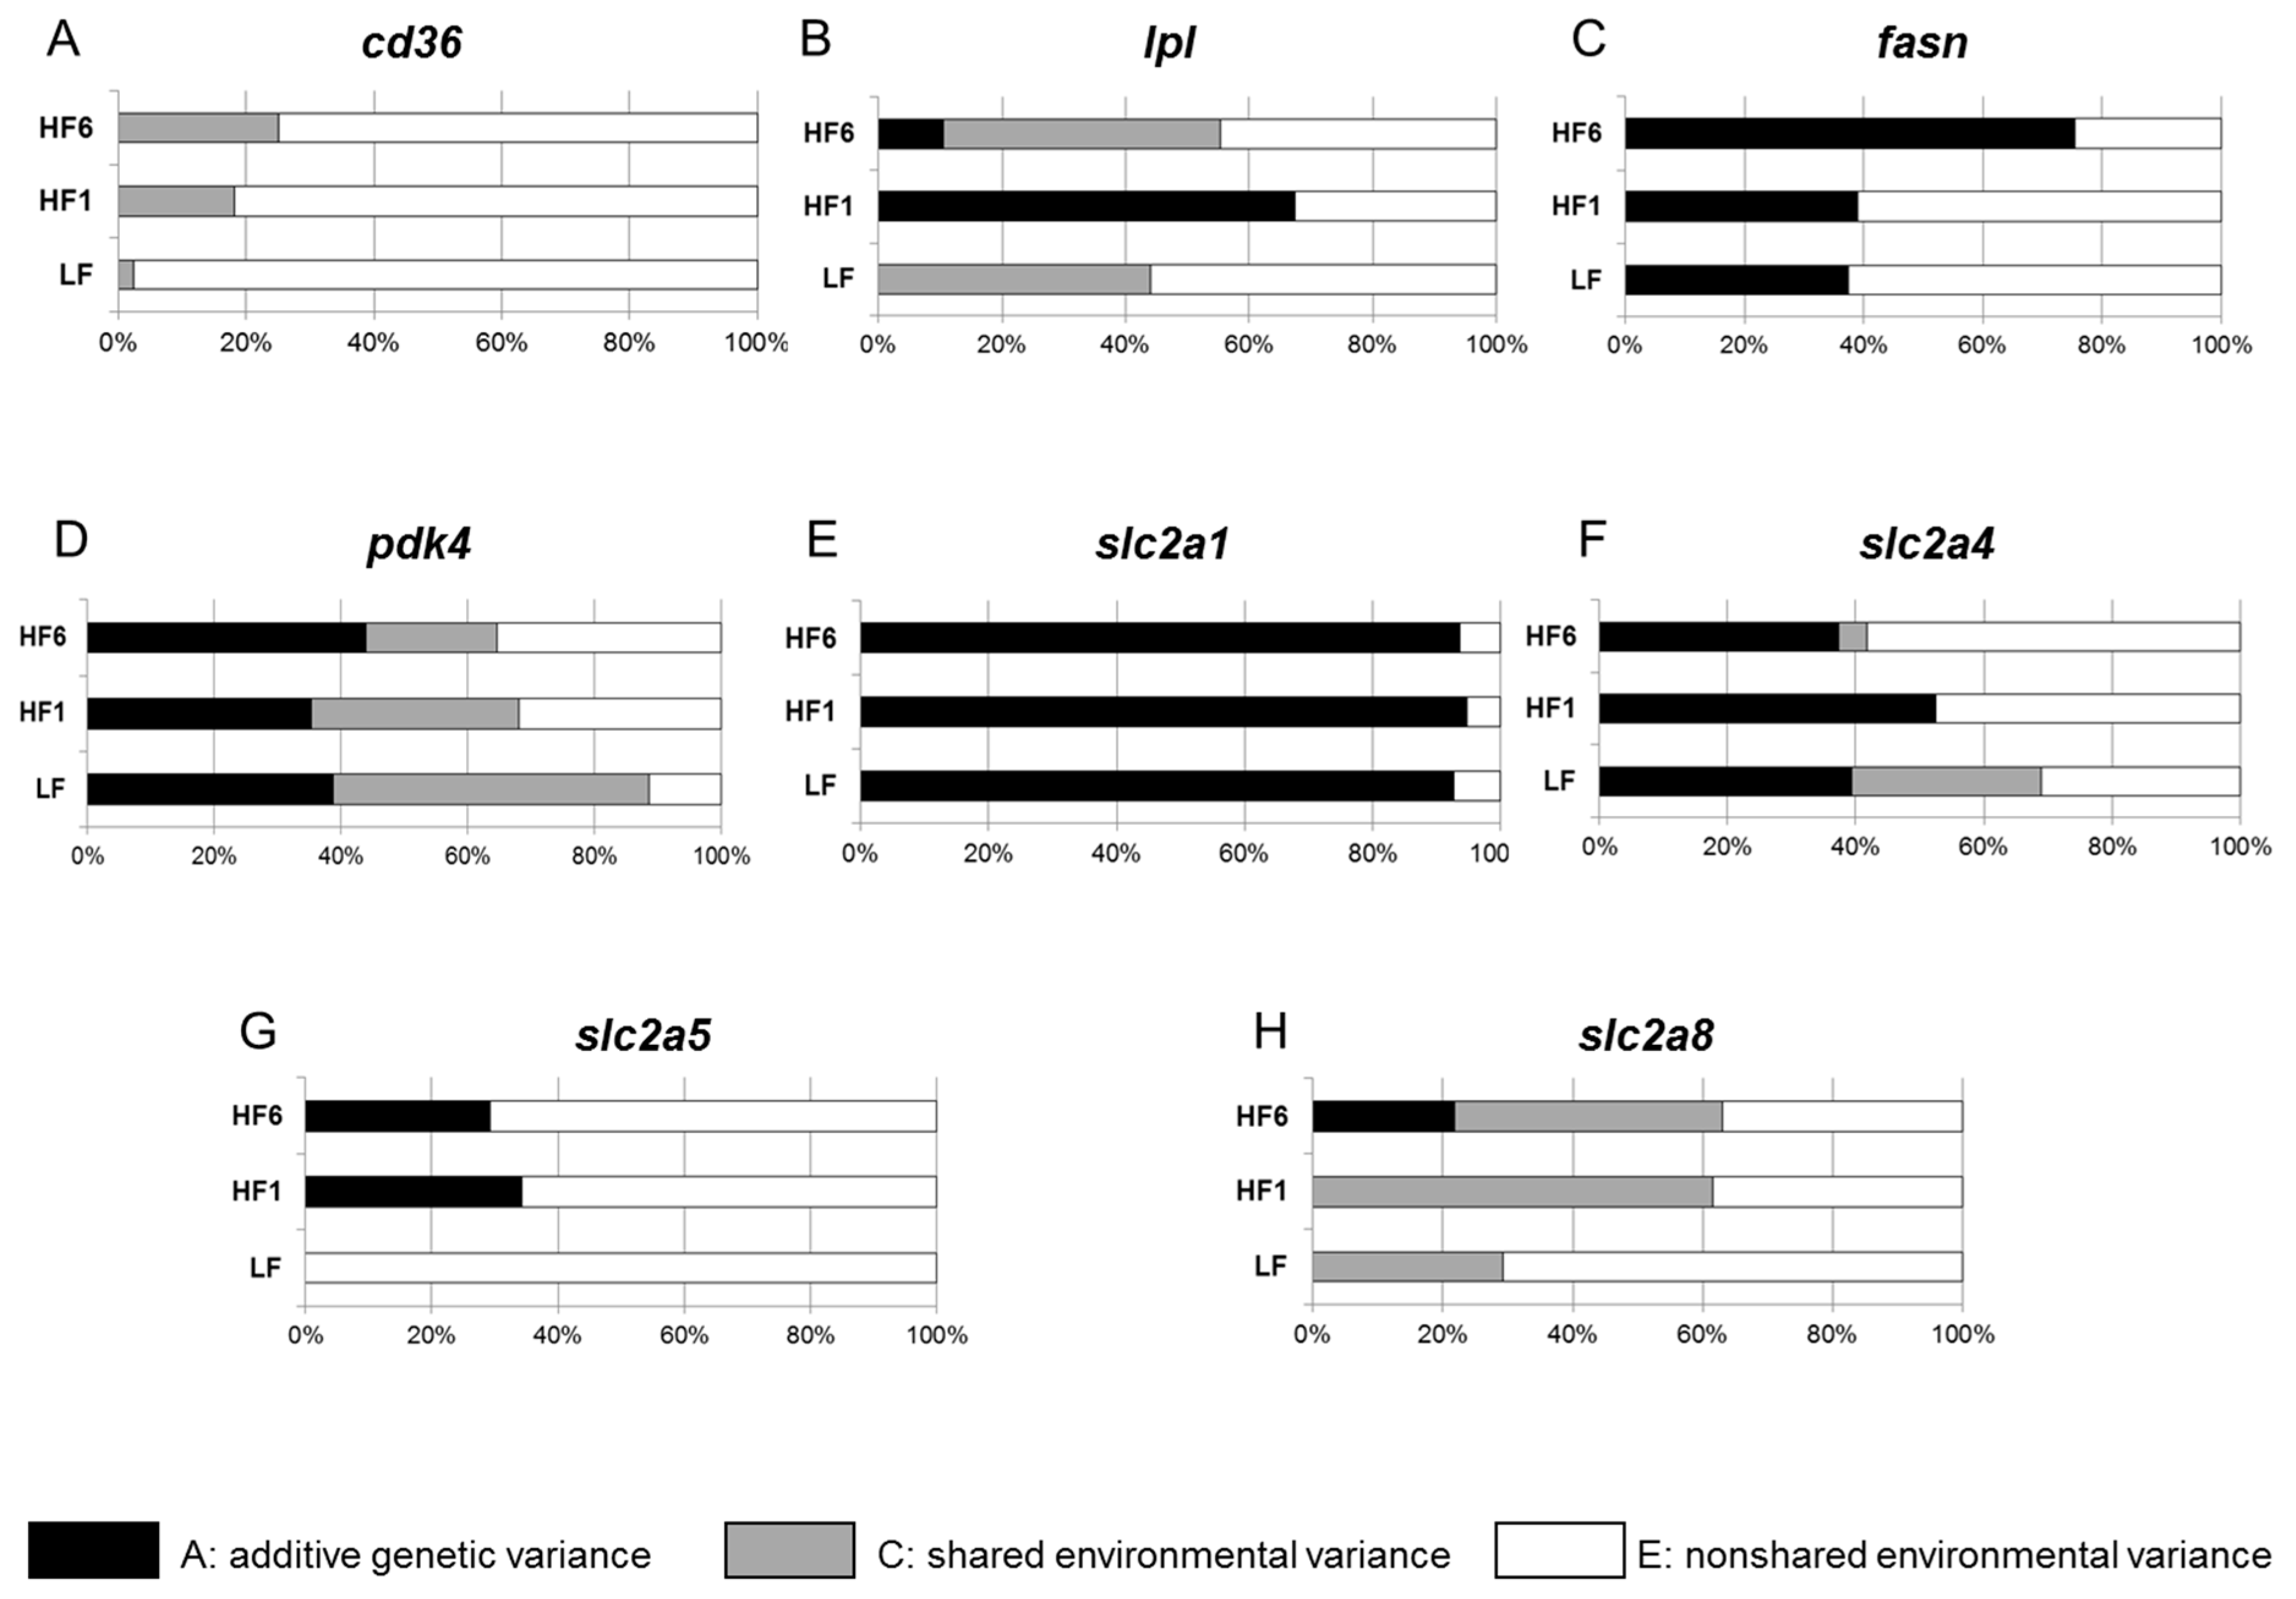
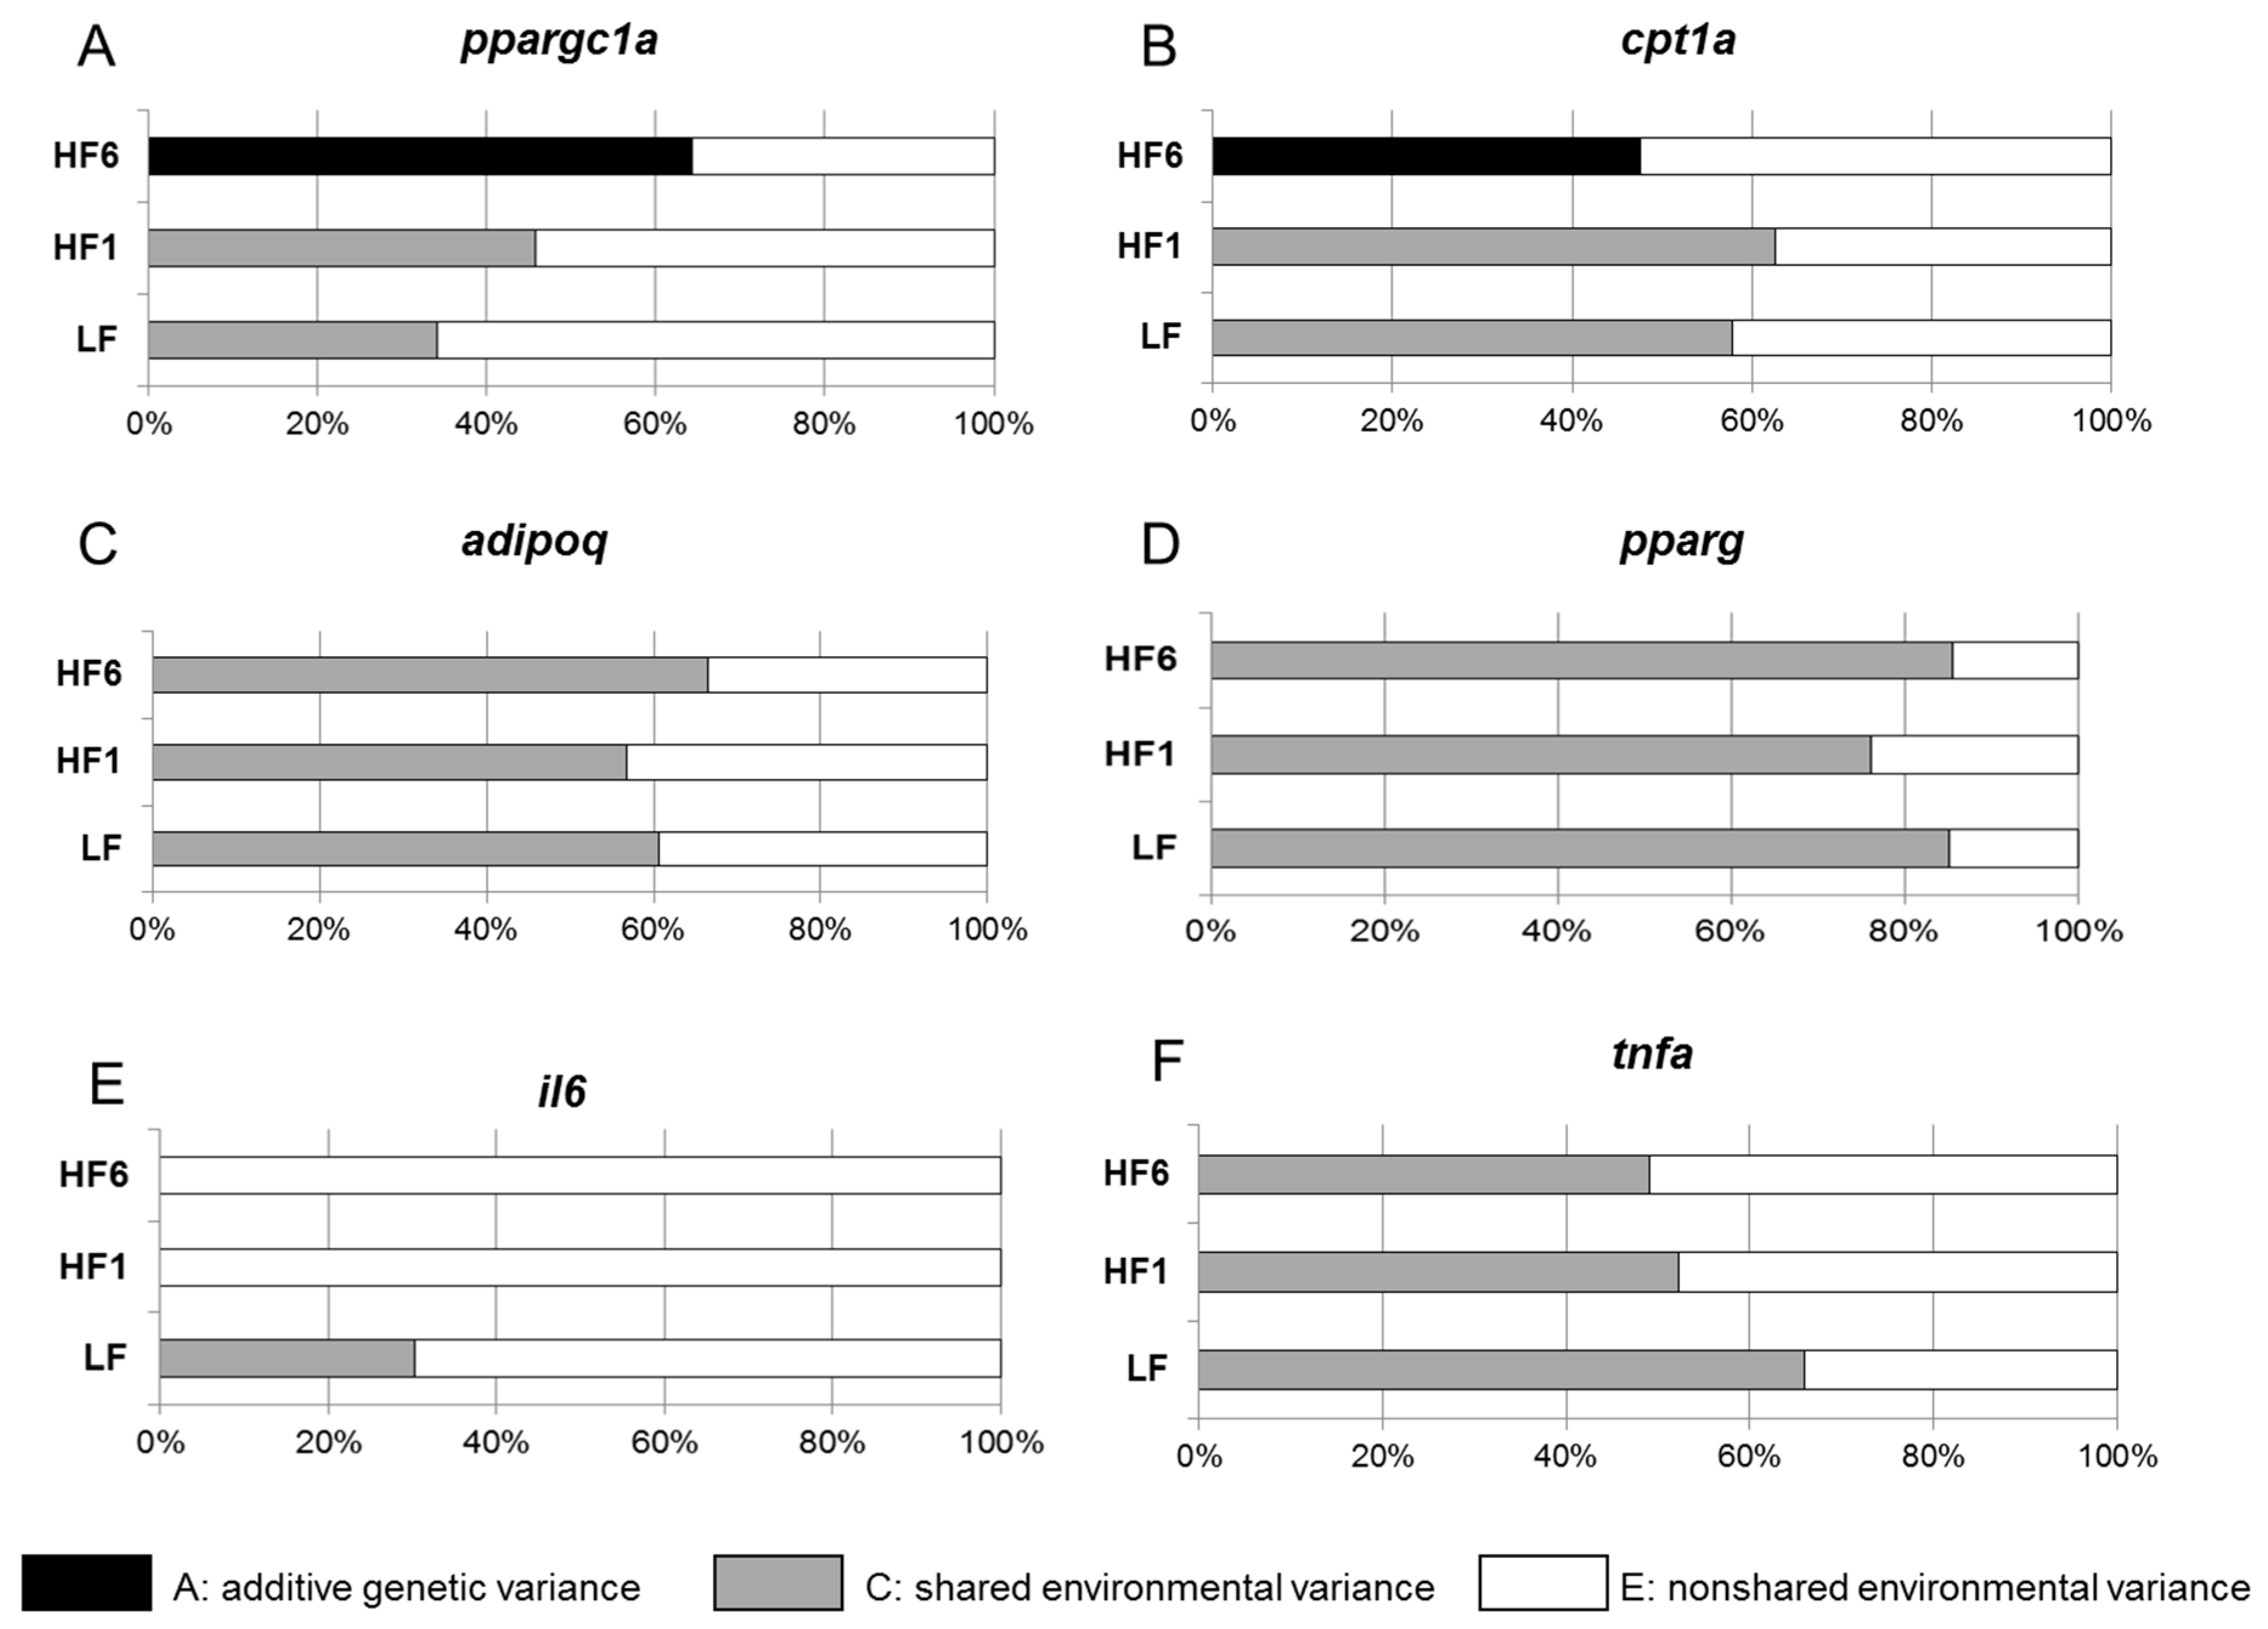
3.3. Determination of the Heritability of Gene Expression in s.c. Adipose Tissue

For the gene expression of cd36, no heritability was observed for all time points (Figure 4A). For lpl gene expression, no heritability was seen at LF; however, a strong heritability was seen after one week on the high-fat diet (A = 0.673 at HF1), while heritability was weak at HF6 (A = 0.105) (Figure 4B).
For fasn gene expression, a moderate heritability was observed prior to the HF diet at LF (A = 0.375) and did not change at HF1 (A = 0.390); however, this strongly increased to A = 0.754 at HF6 (Figure 4C). The pdk4 gene expression showed a moderate heritability at LF (A = 0.388) that did not significantly change over the time of intervention (A = 0.354 at HF1 and A = 0.440 at HF6) (Figure 4D).
For the slc2a1 gene expression, a strong heritability with only small changes was observed throughout the study: A = 0.927 at LF, A = 0.947 at HF1 and A = 0.936 at HF6 (Figure 4E). The heritability of the slc2a4 gene expression was moderate at LF (A = 0.394) and transiently increased to A = 0.525 at HF1, followed by a decrease at HF6 (A = 0.373) (Figure 4F). We did not see any heritability of the slc2a5 gene expression at LF (Figure 4G). However, the switch from the high-carbohydrate, low-fat diet to the low-carbohydrate, high-fat diet induced an increase in heritability of slc2a5 at HF1 (A = 0.340) and persisted to HF6 (A = 0.290). For slc2a8, no heritability of the gene expression was observed at LF or HF1; however, moderate heritability was seen at HF6 (A = 0.220) (Figure 4H).
Remarkably, expression of the mitochondrial genes ppargc1a and cpt1a did not show any heritability at LF or HF1, but a robust heritability was found at HF6 (A = 0.643 for ppargc1a and A = 0.475 for cpt1a) (Figure 5A,B).
For adipoq, pparg, il6 and tnfa, no heritability of the gene expression was observed during the study (Figure 5C–F).

3.4. Correlation Analysis of the Gene Expression in s.c. Adipose Tissue

Figure 6 shows Spearman’s correlation coefficients for the gene expression over the time of dietary intervention at LF, HF1 and HF6.
At LF, we observed no correlations for the cd36 gene expression with any other gene expression. However, exposure to the isocaloric low-carbohydrate, high-fat diet resulted in moderate positive correlations of the gene expression of cd36 with pdk4, ppargc1a, adipoq, pparg and tnfa and mild positive correlations of the gene expressions for lpl, slc2a8 and cpt1a. Strikingly, all these positive correlations disappeared at HF6 and turned into negative correlations of the gene expression for cd36 with pdk4, adipoq, pparg and tnfa. Only a mild positive correlation was observed for cd36 with slc2a1 gene expression.
The lpl gene expression exhibited strong positive correlations with the gene expressions of pdk4, fasn, slc2a4, ppargc1a, cpt1a, adipoq and pparg at LF, which did not change much during the time of intervention, whereas a mild and moderate positive correlation was seen for the gene expression of lpl with slc2a5 and slc2a8 at LF that strongly increased at HF1 and HF6.
For slc2a1, no significant positive correlation of the gene expression was observed with any other genes investigated, except moderately with slc2a8 at HF1 and mildly with cd36 at HF6.
The slc2a5 gene expression was mildly positively correlated with the gene expression of lpl and fasn at LF, which strongly increased once the isocaloric low-carbohydrate, high-fat diet was applied for one (HF1) and six (HF6) weeks. Interestingly, the slc2a5 and slc2a8 gene expressions showed a strong positive correlation at LF, which did not change throughout the time of intervention.
The slc2a8 gene expression was moderately positively correlated with the cpt1a gene expression at LF, which increased to a strong correlation at HF1 and decreased back to a moderate correlation at HF6. For the slca8 gene expression, a mild positive correlation with tnfa was seen at LF, whereas moderate positive correlations were seen for il6 and tnfa at HF1, which persisted until HF6 for the tnfa gene expression only.
For the mitochondrial genes cpt1a and ppargc1a, a strong positive correlation of the gene expression was observed at LF and HF1, which decreased to a moderate positive correlation at HF6. As expected, we always saw a very strong positive correlation of the gene expressions for adipoq and pparg throughout the study.
A moderate positive correlation was observed for the il6 and tnfa gene expressions at LF and HF6 that interestingly transiently disappeared at HF1.

4. Discussion

White adipose tissue (WAT) adapts its molecular processes for storing or releasing energy depending on the available nutrients. The novelty of this study was that a sudden switch from an isocaloric high-carbohydrate, low-fat diet (LF) to an isocaloric low-carbohydrate, high-fat diet (HF) orchestrated the expression of the key genes involved in the transport and metabolism of fatty acids and carbohydrates in human s.c. WAT. Moreover, our study revealed that the expressions of certain genes in response to this nutritional challenge were genetically determined.
We observed a robust decrease in the cd36 gene expression after one week of the switch from an isocaloric high-carbohydrate, low-fat diet to an isocaloric low-carbohydrate, high-fat diet that persisted until week six on that diet. CD36 is important for fatty acid uptake and release in adipocytes [8] and its expression is increased in adipose tissue in human obesity [9]. Studies in rodents showed that 50% of fatty acid uptake in adipose and muscle tissue is mediated by CD36 [20]. However, a clinical study demonstrated that fatty acid uptake is diminished in adipose tissue in humans with CD36 deficiency [21]. The decrease in the cd36 gene expression in our study was unexpected because of the sudden increase in dietary saturated fat. However, it seems that not only the increase in fatty acids but also the demand for energy was important for the adipose cd36 gene expression. Since individuals in our study received an isocaloric diet, it is very likely that no extra energy was stored in adipose tissue since we did not observe any increase in body weight (Table 2). A study where 50 obese individuals received either a hypocaloric low-fat or a hypocaloric high-fat diet for 10 weeks showed that the cd36 gene expression was significantly decreased in both groups at the end of the study [22].
For the gene expression of lipoprotein lipase (lpl), which hydrolyses triglycerides from chylomicrons, VLDL and triglyceride-rich lipoproteins [5], we saw a slightly significant increase in the lpl gene expression in s.c. WAT after one week of the high-fat diet, but this significantly decreased in the long term after six weeks on the high-fat diet. Lpl is regulated in s.c. WAT by dietary macronutrients [5]. In humans, it was shown that a diet rich in carbohydrates increases the lpl gene expression of sc. WAT much more strongly than a diet high in fat [23].
No heritability of the gene expression was seen at LF for cd36 and lpl. For cd36, this persisted throughout our study. Remarkably, the transient increase in the lpl gene expression was highly heritable since we observed a strong inheritance of 67% at HF1. A previous study that investigated lipoprotein lipase activity after exercise in twins suggested the genetic determination of lipoprotein lipase activity in adipose tissue [24]. Thus, despite the importance of both lpl and cd36 for fatty acid uptake in WAT, the regulation of the expression of these genes and their heritability were regulated differently.
The release of fatty acids into the blood during lipolysis is also mediated by CD36 [8]. However, fatty acids are not completely released into circulation and are partially re-esterified into triglycerides [25]. Re-esterification requires the synthesis of glycerol-3-phosphate. Glycerol-3-phosphate is generated in a pathway that initially metabolizes pyruvate to oxaloacetate. Oxaloacetate is converted to phosphoenolpyruvate, which is a precursor of glycerol-3-phosphate, by phosphoenolpyruvate carboxykinase (PEPCK) [26]. Pyruvate dehydrogenase kinase 4 (PDK4) inhibits pyruvate dehydrogenase complexes, leading to increased synthesis of oxaloacetate from pyruvate [27]. Similar to cd36, we observed a robust decrease in the pdk4 gene expression in s.c. WAT at HF1 and HF6, indicating decreased re-esterification in s.c. WAT. However in contrast to cd36, we observed heritability for the pdk4 gene expression which did not change at all three time points. Interestingly, the cd36 and pdk4 gene expressions were not correlated at LF but were significantly positively correlated at HF1, which turned into a significant negative correlation at HF6. This indicates that the stressor of the isocaloric low-carbohydrate, high-fat diet acutely coordinated the gene expressions of cd36 and pdk4, but in the long-term adaptation phase, other factors (e.g., heritability) might be responsible for gene expression.
Coordination of the gene expression, which occurred only transiently, was strikingly observed between cd36 and the mitochondrial gene expressions of ppargc1a and cpt1a, which are involved in fatty acid oxidation [28,29]. Notably, epigenetic regulation of CPT1a by fructose was reported [30]. At LF, the gene expression of ppargc1a or cpt1a did not show any heritability and was not correlated with the cd36 gene expression. After the isocaloric low-carbohydrate, high-fat diet was given for one week, despite no changes in the gene expressions of ppargc1a or cpt1a, a significant positive correlation with the cd36 gene expression was seen for both genes. Remarkably, at HF6, when the gene expressions of ppargc1a and cpt1a were significantly decreased, we observed a strong heritability for both genes (0.643 and 0.475, respectively) but the correlation with the cd36 gene expression disappeared. Of note, the expression of both genes, namely, ppargc1a and cpt1a, were always significantly positively correlated with the most significant correlation at HF1. Taken together, this demonstrates that an isocaloric low-carbohydrate, high-fat diet acutely coordinated gene expression of fatty acid transport and metabolism of WAT; however, in the long term, adaptation was genetically determined.
A striking observation was the strong increase in the slc2a5 gene expression at HF1 that persisted through to the end of the study at HF6. This increase appeared to be genetically determined since no heritability was observed at LF but was observed at HF1 (0.340) and HF6 (0.290). GLUT5 exclusively transports fructose across the cell membrane [31]. In humans, GLUT5 is most abundantly expressed in the jejunum and kidney but is also present in WAT, brain and skeletal muscle [31]. The gene expression of slc2a5 is upregulated by an increase in its substrate fructose in jejunum [31] and WAT [32] and by increased insulin levels in skeletal muscle cells [33]. In our study, we could rule out the idea that increased fructose concentration in the systemic circulation was responsible for the increased slc2a5 gene expression at HF1 and HF6 since the dietary intake of total carbohydrates, and specifically of fructose, was diminished at HF1 and HF6 compared with LF (Table S2). Furthermore, insulin levels that might affect the slc2a5 gene expression did not change during the study (Table 2). Although the dietary intake of fructose was reduced once the low-carbohydrate, high-fat diet was started, it is likely that fructose entered the adipocyte since its carrier was upregulated. Targeted tracer studies using 13C-fructose in human Simpson–Golabi–Behmel syndrome adipocytes showed that fructose is metabolized to acetyl-CoA, which subsequently increases de novo fatty acid synthesis via FASN [34]. De novo lipogenesis mainly occurs in the liver but is also present in adipocytes [35] and is increased by diets high in carbohydrates and suppressed by high-fat diets [36]. The unexpected increase in the fasn gene expression seen at HF1 in our study seemed to be at least partially secondary due to increased acetyl-CoA resulting from increased carbohydrate flux into the adipocyte. Moreover, the slc2a5 and fasn gene expressions were mildly positively correlated at LF and strongly positively correlated at HF1 and HF6.
The gene expression of slc2a4 was also increased at HF1 and contributed to de novo lipogenesis (DNL) from glucose uptake. However, since glucose transport mediated by GLUT4 is mainly due to its increased translocation from intracellular vesicles to the plasma membrane after insulin stimulation [11], it is speculative whether changes in gene expression will reflect changes in transport activity. Of note, the slc2a4 and fasn gene expressions were always very strongly correlated, with only little changes throughout the study.
GLUT1, which is a ubiquitously distributed glucose transporter [10,12], was significantly decreased at HF6 and showed a very strong heritability throughout the study, as we showed previously [37]. We were able to correlate the slc2a1 gene expression with altered cognitive functions (for details, see [37]). Since the slc2a1 gene expression was downregulated, never positively correlated with other genes and its heritability remained unchanged throughout the study, it seems unlikely that GLUT1 was a key molecule for alterations in fatty acid metabolism in adipose tissue after the consumption of an isocaloric low-carbohydrate, high-fat diet.
We observed an increase in the gene expression of slc2a8, which has a transport capacity for glucose and fructose [38], at HF1 and HF6. The function of GLUT8 is still not fully understood and it is not clear whether it is a plasma membrane transporter or is localized in intracellular compartments [39,40]. It was shown recently in a female mouse model that GLUT8 knockdown in liver reduces fructose-induced steatohepatosis and liver inflammation [41]. Another study in female mice demonstrated that GLUT8 mediates fructose-induced DNL in liver [42]. In our study, we observed no difference in the gene expressions of il6 and tnfa in s.c. WAT at HF1 and HF6compared to LF which might be attributed to the absence of weight gain. While only a mild positive correlation of the slc2a8 gene expression with the gene expression of tnfa and not of il6 was observed at LF, a robust increase in correlation with both genes was seen at HF1, which persisted for the tnfa gene expression at HF6 only. The slc2a8 gene expression was not correlated with the fasn gene expression at LF but was significantly positively correlated at LF1 and HF6. It was always strongly positively correlated with the slc2a5 gene expression. Taken together, this indicates a regulatory effect of the isocaloric high-fat diet on fructose-dependent DNL in WAT. Further studies are needed to underpin these mechanisms.
For the gene expression of adipoq, we observed only a slight significant decrease at HF6, and for the gene expression of pparg, no differences were seen. This might reflect the stable body weight and adiposity due to the isocaloric study protocol. As expected, expressions of these genes were always strongly correlated throughout the study.
The metabolism of fatty acids and carbohydrates interacts with multiple organs, such as liver, skeletal muscle and adipose tissue. A limitation of this study was the missing data for hepatic and muscle metabolism after the switch to the isocaloric low-carbohydrate, high-fat diet. Another limitation was the termination of the study after a total of twelve weeks (six weeks for each diet). However, since the study was designed with a clear focus on adipocyte metabolism, the complexity of the design and the tight schedule of the participants was a limitation for additional experiments and a longer duration of the study.
The numbers of female and male participants were exactly balanced for dizygotic pairs of twins, whereas for monozygotic pairs of twins, more female than male participants were enrolled in this study. In order to evaluate gender- and age-related effects of the isocaloric low-carbohydrate, high-fat diet, studies with larger cohorts of exactly balanced gender and age of participants are needed.
In summary, we showed that an isocaloric low-carbohydrate, high-fat diet had acute and long-term regulatory and coordinating effects on gene expressions involved in the transport of fatty acids and carbohydrates and their downstream metabolism in human s.c. WAT. The gene expression involved in transmembrane fatty acid (cd36 and lpl) and fructose transport (slc2a5) did not exhibit heritability when an isocaloric low-fat, high-carbohydrate diet was given. However, the temporary increase in lpl and the persistent increase in the slc2a5 gene expression observed after the challenge of the isocaloric low-carbohydrate, high-fat diet were inherited, whereas the persistent decrease in the cd36 gene expression was not. In contrast, the gene expression of intracellular metabolism was either always (fasn and ppargc1a) or never (adipoq and pparg) inherited.

Supplementary Materials

The following supporting information can be downloaded from https://www.mdpi.com/article/10.3390/nu15102338/s1. Table S1: Human primer sequences used for quantitative real-time PCR analysis. Table S2: Intake of total carbohydrates, fructose, glucose and saccharose in grams (g) of three exemplary pairs of twins after six weeks on the isocaloric high-carbohydrate, low-fat diet (LF) and one week (HF1) and six (HF6) weeks on the isocaloric low-carbohydrate, high-carbohydrate diet.

Author Contributions

Conceptualization, A.F.H.P.; methodology, A.F.H.P., S.H., A.-C.O. and M.K.; validation, A.F.H.P., S.H., A.-C.O. and M.K.; software, T.F., A.B. and M.A.O., formal analysis, A.-C.O., S.H., T.F., A.B., M.A.O., M.K. and B.S.; investigation, S.H., A.-C.O., D.H. and M.K.; resources, A.F.H.P.; data curation, A.F.H.P. and M.K.; writing—original draft preparation, M.K. and A.F.H.P.; writing—review and editing, A.F.H.P. and M.K. All authors have read and agreed to the published version of the manuscript.

Funding

This work was supported by a grant from the German Federal Ministry of Education and Research (#0315424 to A.F.H.P.).

Institutional Review Board Statement

The study protocol was approved by the local ethical committee of the Charité University of Medicine, Berlin, Germany (protocol code EA4/021/09, date of approval 26 September 2009) and was in accordance with the Declaration of Helsinki of 1975, as revised in 2013.

Informed Consent Statement

All participants involved in the study gave their informed consent before they participated in the study.

Data Availability Statement

Data available on request due to privacy restrictions.

Acknowledgments

We wish to thank Andrea Borchert, Melanie Hannemann, Anja Henkel, Alexandra Jochen, Katrin Sprengel, Katja Treu, Andreas Wagner and Dominique Zschau for their excellent technical assistance. We thank Stefanie Sucher for the excellent dietary counseling.

Conflicts of Interest

The authors declare no conflict of interest.

Abbreviations

adipoq: adiponectin, CD36: fatty acid translocase (FAT)/cluster of differentiation 36, cpt1a: carnitine palmitoyltransferase 1A, DNL: de novo lipogenesis, FFA: free fatty acid, FASN: fatty acid synthase, GLUT: glucose transporter, HOMA-IR: homeostasis model assessment of insulin resistance, il6: interleukin-6, LPL: lipoprotein lipase, PAL: physical activity level, pdk4: pyruvate dehydrogenase kinase, isozyme 4, pparg: peroxisome proliferator-activated receptor gamma, ppargc1a: peroxisome proliferator-activated receptor gamma, coactivator 1 alpha, REE: resting energy expenditure, rpl32: ribosomal protein L32, s.c.: subcutaneous, slc2a1: GLUT1, slc2a4: GLUT4, slc2a5: GLUT5, slc2a8: GLUT8, tnfa: tumor necrosis factor alpha, WAT: white adipose tissue.

References

  1. Bremer, A.A.; Jialal, I. Adipose tissue dysfunction in nascent metabolic syndrome. J. Obes. 2013, 2013, 393192. [Google Scholar] [CrossRef]
  2. Collaboration NCDRF. Trends in adult body-mass index in 200 countries from 1975 to 2014: A pooled analysis of 1698 population-based measurement studies with 19.2 million participants. Lancet 2016, 387, 1377–1396. [Google Scholar] [CrossRef] [PubMed]
  3. Longo, M.; Zatterale, F.; Naderi, J.; Parrillo, L.; Formisano, P.; Raciti, G.A.; Beguinot, F.; Miele, C. Adipose Tissue Dysfunction as Determinant of Obesity-Associated Metabolic Complications. Int. J. Mol. Sci. 2019, 20, 2358. [Google Scholar] [CrossRef] [PubMed]
  4. Morigny, P.; Boucher, J.; Arner, P.; Langin, D. Lipid and glucose metabolism in white adipocytes: Pathways, dysfunction and therapeutics. Nat. Rev. Endocrinol. 2021, 17, 276–295. [Google Scholar] [CrossRef] [PubMed]
  5. Wang, H.; Eckel, R.H. Lipoprotein lipase: From gene to obesity. Am. J. Physiol. Endocrinol. Metab. 2009, 297, E271–E288. [Google Scholar] [CrossRef]
  6. Basu, D.; Goldberg, I.J. Regulation of lipoprotein lipase-mediated lipolysis of triglycerides. Curr. Opin. Lipidol. 2020, 31, 154–160. [Google Scholar] [CrossRef]
  7. Puchalowicz, K.; Rac, M.E. The Multifunctionality of CD36 in Diabetes Mellitus and Its Complications-Update in Pathogenesis, Treatment and Monitoring. Cells 2020, 9, 1877. [Google Scholar] [CrossRef]
  8. Goldberg, I.J.; Eckel, R.H.; Abumrad, N.A. Regulation of fatty acid uptake into tissues: Lipoprotein lipase- and CD36-mediated pathways. J. Lipid Res. 2009, 50, S86–S90. [Google Scholar] [CrossRef]
  9. Bonen, A.; Tandon, N.N.; Glatz, J.F.; Luiken, J.J.; Heigenhauser, G.J. The fatty acid transporter FAT/CD36 is upregulated in subcutaneous and visceral adipose tissues in human obesity and type 2 diabetes. Int. J. Obes. 2006, 30, 877–883. [Google Scholar] [CrossRef]
  10. Mueckler, M.; Thorens, B. The SLC2 (GLUT) family of membrane transporters. Mol. Aspects Med. 2013, 34, 121–138. [Google Scholar] [CrossRef]
  11. Charron, M.J.; Brosius, F.C., 3rd; Alper, S.L.; Lodish, H.F. A glucose transport protein expressed predominately in insulin-responsive tissues. Proc. Natl. Acad. Sci. USA 1989, 86, 2535–2539. [Google Scholar] [CrossRef] [PubMed]
  12. Holman, G.D. Structure, function and regulation of mammalian glucose transporters of the SLC2 family. Pflug. Arch. 2020, 472, 1155–1175. [Google Scholar] [CrossRef] [PubMed]
  13. Mobbs, C.V.; Makimura, H. Block the FAS, lose the fat. Nat. Med. 2002, 8, 335–336. [Google Scholar] [CrossRef] [PubMed]
  14. Berndt, J.; Kovacs, P.; Ruschke, K.; Kloting, N.; Fasshauer, M.; Schon, M.R.; Korner, A.; Stumvoll, M.; Bluher, M. Fatty acid synthase gene expression in human adipose tissue: Association with obesity and type 2 diabetes. Diabetologia 2007, 50, 1472–1480. [Google Scholar] [CrossRef] [PubMed]
  15. Strable, M.S.; Ntambi, J.M. Genetic control of de novo lipogenesis: Role in diet-induced obesity. Crit. Rev. Biochem. Mol. Biol. 2010, 45, 199–214. [Google Scholar] [CrossRef]
  16. Du, L.; Heaney, A.P. Regulation of adipose differentiation by fructose and GluT5. Mol. Endocrinol. 2012, 26, 1773–1782. [Google Scholar] [CrossRef]
  17. Silva, J.C.P.; Marques, C.; Martins, F.O.; Viegas, I.; Tavares, L.; Macedo, M.P.; Jones, J.G. Determining contributions of exogenous glucose and fructose to de novo fatty acid and glycerol synthesis in liver and adipose tissue. Metab. Eng. 2019, 56, 69–76. [Google Scholar] [CrossRef]
  18. Elder, S.J.; Lichtenstein, A.H.; Pittas, A.G.; Roberts, S.B.; Fuss, P.J.; Greenberg, A.S.; McCrory, M.A.; Bouchard, T.J., Jr.; Saltzman, E.; Neale, M.C. Genetic and environmental influences on factors associated with cardiovascular disease and the metabolic syndrome. J. Lipid Res. 2009, 50, 1917–1926. [Google Scholar] [CrossRef]
  19. Bluher, M.; Bashan, N.; Shai, I.; Harman-Boehm, I.; Tarnovscki, T.; Avinaoch, E.; Stumvoll, M.; Dietrich, A.; Kloting, N.; Rudich, A. Activated Ask1-MKK4-p38MAPK/JNK stress signaling pathway in human omental fat tissue may link macrophage infiltration to whole-body Insulin sensitivity. J. Clin. Endocrinol. Metab. 2009, 94, 2507–2515. [Google Scholar] [CrossRef]
  20. Coburn, C.T.; Knapp, F.F., Jr.; Febbraio, M.; Beets, A.L.; Silverstein, R.L.; Abumrad, N.A. Defective uptake and utilization of long chain fatty acids in muscle and adipose tissues of CD36 knockout mice. J. Biol. Chem. 2000, 275, 32523–32529. [Google Scholar] [CrossRef]
  21. Hames, K.C.; Vella, A.; Kemp, B.J.; Jensen, M.D. Free fatty acid uptake in humans with CD36 deficiency. Diabetes 2014, 63, 3606–3614. [Google Scholar] [CrossRef] [PubMed]
  22. Viguerie, N.; Vidal, H.; Arner, P.; Holst, C.; Verdich, C.; Avizou, S.; Astrup, A.; Saris, W.H.; Macdonald, I.A.; Klimcakova, E.; et al. Adipose tissue gene expression in obese subjects during low-fat and high-fat hypocaloric diets. Diabetologia 2005, 48, 123–131. [Google Scholar] [CrossRef] [PubMed]
  23. Yost, T.J.; Jensen, D.R.; Haugen, B.R.; Eckel, R.H. Effect of dietary macronutrient composition on tissue-specific lipoprotein lipase activity and insulin action in normal-weight subjects. Am. J. Clin. Nutr. 1998, 68, 296–302. [Google Scholar] [CrossRef] [PubMed]
  24. Savard, R.; Bouchard, C. Genetic effects in the response of adipose tissue lipoprotein lipase activity to prolonged exercise. A twin study. Int. J. Obes. 1990, 14, 771–777. [Google Scholar] [PubMed]
  25. Wang, T.; Zang, Y.; Ling, W.; Corkey, B.E.; Guo, W. Metabolic partitioning of endogenous fatty acid in adipocytes. Obes. Res. 2003, 11, 880–887. [Google Scholar] [CrossRef] [PubMed]
  26. Ferreira, G.N.; Rossi-Valentim, R.; Buzelle, S.L.; Paula-Gomes, S.; Zanon, N.M.; Garofalo, M.A.R.; Frasson, D.; Navegantes, L.C.C.; Chaves, V.E.; Kettelhut, I.D.C. Differential regulation of glyceroneogenesis by glucocorticoids in epididymal and retroperitoneal white adipose tissue from rats. Endocrine 2017, 57, 287–297. [Google Scholar] [CrossRef] [PubMed]
  27. Cadoudal, T.; Distel, E.; Durant, S.; Fouque, F.; Blouin, J.M.; Collinet, M.; Bortoli, S.; Forest, C.; Benelli, C. Pyruvate dehydrogenase kinase 4: Regulation by thiazolidinediones and implication in glyceroneogenesis in adipose tissue. Diabetes 2008, 57, 2272–2279. [Google Scholar] [CrossRef]
  28. Ruschke, K.; Fishbein, L.; Dietrich, A.; Kloting, N.; Tonjes, A.; Oberbach, A.; Fasshauer, M.; Jenkner, J.; Schon, M.R.; Stumvoll, M.; et al. Gene expression of PPARgamma and PGC-1alpha in human omental and subcutaneous adipose tissues is related to insulin resistance markers and mediates beneficial effects of physical training. Eur. J. Endocrinol. 2010, 162, 515–523. [Google Scholar] [CrossRef]
  29. Briant, L.J.B.; Dodd, M.S.; Chibalina, M.V.; Rorsman, N.J.G.; Johnson, P.R.V.; Carmeliet, P.; Rorsman, P.; Knudsen, J.G. CPT1a-Dependent Long-Chain Fatty Acid Oxidation Contributes to Maintaining Glucagon Secretion from Pancreatic Islets. Cell Rep. 2018, 23, 3300–3311. [Google Scholar] [CrossRef]
  30. Ohashi, K.; Munetsuna, E.; Yamada, H.; Ando, Y.; Yamazaki, M.; Taromaru, N.; Nagura, A.; Ishikawa, H.; Suzuki, K.; Teradaira, R.; et al. High fructose consumption induces DNA methylation at PPARalpha and CPT1A promoter regions in the rat liver. Biochem. Biophys. Res. Commun. 2015, 468, 185–189. [Google Scholar] [CrossRef]
  31. Douard, V.; Ferraris, R.P. Regulation of the fructose transporter GLUT5 in health and disease. Am. J. Physiol. Endocrinol. Metab. 2008, 295, E227–E237. [Google Scholar] [CrossRef] [PubMed]
  32. Legeza, B.; Balázs, Z.; Odermatt, A. Fructose promotes the differentiation of 3T3-L1 adipocytes and accelerates lipid metabolism. FEBS Lett. 2014, 588, 490–496. [Google Scholar] [CrossRef] [PubMed]
  33. Hajduch, E.; Litherland, G.J.; Turban, S.; Brot-Laroche, E.; Hundal, H.S. Insulin regulates the expression of the GLUT5 transporter in L6 skeletal muscle cells. FEBS Lett. 2003, 549, 77–82. [Google Scholar] [CrossRef]
  34. Varma, V.; Boros, L.G.; Nolen, G.T.; Chang, C.W.; Wabitsch, M.; Beger, R.D.; Kaput, J. Metabolic fate of fructose in human adipocytes: A targeted (13)C tracer fate association study. Metabolomics 2015, 11, 529–544. [Google Scholar] [CrossRef] [PubMed]
  35. Collins, J.M.; Neville, M.J.; Pinnick, K.E.; Hodson, L.; Ruyter, B.; van Dijk, T.H.; Reijngoud, D.-J.; Fielding, M.D.; Frayn, K.N. De novo lipogenesis in the differentiating human adipocyte can provide all fatty acids necessary for maturation. J. Lipid Res. 2011, 52, 1683–1692. [Google Scholar] [CrossRef] [PubMed]
  36. Wakil, S.J. Fatty acid synthase, a proficient multifunctional enzyme. Biochemistry 1989, 28, 4523–4530. [Google Scholar] [CrossRef]
  37. Schüler, R.; Seebeck, N.; Osterhoff, M.A.; Witte, V.; Flöel, A.; Busjahn, A.; Jais, A.; Brüning, J.C.; Frahnow, T.; Kabisch, S.; et al. VEGF and GLUT1 are highly heritable, inversely correlated and affected by dietary fat intake: Consequences for cognitive function in humans. Mol. Metab. 2018, 11, 129–136. [Google Scholar] [CrossRef]
  38. Schmidt, S.; Joost, H.G.; Schurmann, A. GLUT8, the enigmatic intracellular hexose transporter. Am. J. Physiol. Endocrinol. Metab. 2009, 296, E614–E618. [Google Scholar] [CrossRef]
  39. Herman, M.A.; Birnbaum, M.J. Molecular aspects of fructose metabolism and metabolic disease. Cell Metab. 2021, 33, 2329–2354. [Google Scholar] [CrossRef]
  40. Alexander, C.M.; Martin, J.A.; Oxman, E.; Kasza, I.; Senn, K.A.; Dvinge, H. Alternative Splicing and Cleavage of GLUT8. Mol. Cell. Biol. 2020, 41, e00480-20. [Google Scholar] [CrossRef]
  41. Novelle, M.G.; Bravo, S.B.; Deshons, M.; Iglesias, C.; Garcia-Vence, M.; Annells, R.; da Silva Lima, N.; Nogueiras, R.; Fernandez-Rojo, M.A.; Dieguez, C.; et al. Impact of liver-specific GLUT8 silencing on fructose-induced inflammation and omega oxidation. iScience 2021, 24, 102071. [Google Scholar] [CrossRef] [PubMed]
  42. Debosch, B.J.; Chen, Z.; Saben, J.L.; Finck, B.N.; Moley, K.H. Glucose transporter 8 (GLUT8) mediates fructose-induced de novo lipogenesis and macrosteatosis. J. Biol. Chem. 2014, 289, 10989–10998. [Google Scholar] [CrossRef] [PubMed]
Figure 1. Timeline of the study. After the assessment for eligibility, the participants received an isocaloric high-carbohydrate, low-fat diet for six weeks, followed immediately by an isocaloric low-carbohydrate, high-fat diet for another six weeks. Anthropometric measurements, blood tests and a biopsy of abdominal subcutaneous adipose tissue for the gene expression analysis were performed after six weeks on the isocaloric high-carbohydrate, low-fat diet (LF) and after one week (HF1) and six weeks (HF6) on the isocaloric low-carbohydrate, high-fat diet.
Nutrients 15 02338 g001
Figure 2. Gene expression levels of cd36 (A), lpl (B), pdk4 (C), fasn (D), slc2a1 (E), slc2a4 (F), slc2a5 (G) and slc2a8 (H) in s.c. adipose tissue. The gene expression was analyzed in a biopsy of adipose tissue after six weeks on the isocaloric high-carbohydrate, low-fat diet (LF) and after one week (HF1) and six weeks (HF6) on the isocaloric low-carbohydrate, high-fat diet. Values are given as mean ± SD; * p < 0.05, ** p < 0.01, *** p < 0.001; n = 80–84.
Nutrients 15 02338 g002
Figure 3. Gene expression levels of ppargc1a (A), cpt1a (B), adipoq (C), pparg (D), il6 (E) and tnfa (F) in s.c. adipose tissue. The gene expression was analyzed in a biopsy of adipose tissue after six weeks on the isocaloric high-carbohydrate, low-fat diet (LF) and after one week (HF1) and six weeks (HF6) on the isocaloric low-carbohydrate, high-fat diet. Values are given as mean ± SD; * p < 0.05, ** p < 0.01, *** p < 0.001; n = 80–84.
Nutrients 15 02338 g003
Figure 4. Heritability of the gene expressions of cd36 (A), lpl (B), pdk4 (C), fasn (D) slc2a1 (E), slc2a4 (F), slc2a5 (G) and slc2a8 (H) in s.c. adipose tissue. The additive genetic influences and the common environmental and individual environmental influences of expression for the indicated genes were estimated.
Nutrients 15 02338 g004
Figure 5. Heritability of the gene expression of ppargc1a (A), cpt1a (B), adipoq (C), pparg (D), il6 (E) and tnfa (F) in s.c. adipose tissue. The additive genetic influences and the common environmental and individual environmental influences of expression for the indicated genes were estimated.
Nutrients 15 02338 g005
Figure 6. Correlation of gene expression in s.c. adipose tissue. Spearman’s rank correlation coefficients for gene expressions in adipose tissue after six weeks on the isocaloric high-carbohydrate, low-fat diet (LF, (A)) and after one week (HF1, (B)) and six weeks (HF6, (C)) on the isocaloric low-carbohydrate, high-fat diet.
Nutrients 15 02338 g006
Table 1. Baseline characteristics of the participants.
Monozygotic Twins Dizygotic Twins
(n = 68)(n = 24)
Gender (F/M)44/2412/12
Age (years)33.9 ± 14.924.5 ± 7.6
Body height (m)1.71 ± 8.71.74 ± 11.6
Body weight (kg)67.4 ± 11.968.0 ± 11.7
BMI (kg/m2)23.0 ± 2.822.3 ± 2.2
Waist/hip ratio0.82 ± 0.10.80 ± 0.1
Serum total cholesterol (mmol/L)4.74 ± 0.94.15 ± 0.9
Serum LDL cholesterol (mmol/L)2.84 ± 0.82.44 ± 0.6
Serum HDL cholesterol (mmol/L)1.43 ± 0.31.24 ± 0.4
Serum triacylglycerol (mmol/L)0.98 ± 0.41.01 ± 0.6
Serum-free fatty acids (mmol/L)0.52 ± 0.20.52 ± 0.4
Fasted serum glucose (mg/dL)86.2 ± 9.586.2 ± 6.4
Fasted serum insulin (mU/L)5.30 ± 4.14.96 ± 2.2
HOMA IR index1.16 ± 01.01.05 ± 0.5
HbA1c (%)5.02 ± 0.40.52 ± 0.4
Values are given as mean ± SD.
Table 2. Body weight, BMI, serum lipids, blood glucose, insulin and HOMA-IR index after six weeks of the high-carbohydrate, low-fat diet (LF) and after one week (HF1) and six weeks (HF6) of the low-carbohydrate, high-fat diet.
Monozygotic TwinsDizygotic Twins
LFHF1HF6LFHF1HF6
Body weight (kg)66.4 ± 11.966.3 ± 11.966.8 ± 12.167.2 ± 11.367.1 ± 11.067.6 ± 11.5
BMI (kg/m2)22.7 ± 2.922.6 ± 2.922.8 ± 2.922.1 ± 2.022.0 ± 1.922.2 ± 2.0
Total cholesterol (mmol/L)4.42 ± 0.84.57 ± 0.84.83 ± 0.9 *3.94 ± 0.84.18 ± 0.94.33 ± 0.8
LDL (mmol/L)2.67 ± 0.72.76 ± 0.72.93 ± 0.82.38 ± 0.72.58 ± 0.72.65 ± 0.7
HDL (mmol/L)1.30 ± 0.31.36 ± 0.41.46 ± 0.41.14 ± 0.31.21 ± 0.31.27 ± 0.3
Triglycerides (mmol/L)0.97 ± 0.40.91 ± 0.30.90 ± 0.40.91 ± 0.50.86 ± 0.40.92 ± 0.4
Free fatty acids (mmol/L)0.62 ± 0.20.55 ± 0.20.51 ± 0.2 §0.56 ± 0.20.63 ± 0.20.47 ± 0.2 #
Glucose (mg/dL)94.0 ± 13.293.6 ± 10.895.1 ± 10.793.9 ± 18.190.9 ± 12.490.9 ± 11.2
Insulin (mU/L)4.78 ± 3.35.65 ± 4.05.30 ± 3.94.52 ± 2.75.29 ± 2.74.55 ± 2.8
HOMA-IR1.06 ± 0.81.30 ± 1.0 $1.26 ± 0.3 §1.02 ± 0.51.17 ± 0.5 ¶1.15 ± 0.3
Values are given as mean ± SD. Between-group differences were determined using one-way or repeated-measures ANOVA or the Kruskal–Wallis test. ¶ p < 0.05 and $ p < 0.01 for differences between LF and HF1; * p < 0.05 and § p < 0.01 for differences between LF and HF6; # p <0.01 for differences between HF1 and HF6 (n = 68 for monozygotic twins, n = 24 for dizygotic twins).
Table 3. Gene names, gene functions and their dietary regulations.
Gene Name and FunctionDietary Regulation
LF vs. HF1LF vs. HF6HF1 vs. HF6
cd36↓↓↓↓↓↓
(hydrolysis of free fatty acids)
lpl
(lipid transport)
pdk4↓↓↓↓↓↓↓↓
(glycerol-3-phosphate generation)
fasn
(de novo fatty acid synthesis)
slc2a1
(glucose transport)
slc2a4
(glucose transport)
slc2a5↑↑↑↑↑↑
(fructose transport)
slc2a8↑↑
(glucose and fructose transport)
ppargc1a
(fatty acid oxidation)
cpt1a↓↓↓↓
(fatty acid oxidation)
adipoq
(adipogenesis)
pparg
(adipogenesis)
il6
(inflammation)
tnfa
(inflammation)
Change in gene expression: ↑↑↑: strong increase, ↑↑: moderate increase, ↑: small increase, ↓↓↓: strong decrease, ↓↓: moderate decrease, ↓: small decrease, ↔: no change.
Disclaimer/Publisher’s Note: The statements, opinions and data contained in all publications are solely those of the individual author(s) and contributor(s) and not of MDPI and/or the editor(s). MDPI and/or the editor(s) disclaim responsibility for any injury to people or property resulting from any ideas, methods, instructions or products referred to in the content.

