

Omega-3 Fatty Acids Interact with DPP10 Region Genotype in Association with Childhood Atopy
 , , ,
, , ,  ,
,  ,
,  and
and
Abstract
:1. Introduction
2. Materials and Methods
3. Results
3.1. Plasma and Dietary n-3 PUFA
3.2. Subject Characteristics
3.3. Associations of n-3 PUFA with Asthma and Atopy
3.4. Targeted Analysis
3.5. Genome-Wide Analysis
4. Discussion
Supplementary Materials
Author Contributions
Funding
Institutional Review Board Statement
Informed Consent Statement
Data Availability Statement
Acknowledgments
Conflicts of Interest
References
- Calder, P.C.; Krauss-Etschmann, S.; de Jong, E.C.; Dupont, C.; Frick, J.-S.; Frokiaer, H.; Heinrich, J.; Garn, H.; Koletzko, S.; Lack, G.; et al. Early Nutrition and Immunity—Progress and Perspectives. Br. J. Nutr. 2006, 96, 774–790. [Google Scholar] [PubMed]
- Miles, E.A.; Childs, C.E.; Calder, P.C. Long-Chain Polyunsaturated Fatty Acids (LCPUFAs) and the Developing Immune System: A Narrative Review. Nutrients 2021, 13, 247. [Google Scholar] [CrossRef] [PubMed]
- Schindler, T.; Sinn, J.K.; Osborn, D.A. Polyunsaturated Fatty Acid Supplementation in Infancy for the Prevention of Allergy. Cochrane Database Syst. Rev. 2016, 2016, CD010112. [Google Scholar] [CrossRef] [PubMed]
- Muley, P.; Shah, M.; Muley, A. Omega-3 Fatty Acids Supplementation in Children to Prevent Asthma: Is It Worthy?—A Systematic Review and Meta-Analysis. J. Allergy 2015, 2015, 312052. [Google Scholar] [CrossRef]
- Corella, D.; Ordovás, J.M. Interactions between Dietary N-3 Fatty Acids and Genetic Variants and Risk of Disease. Br. J. Nutr. 2012, 107, S271–S283. [Google Scholar] [CrossRef]
- Bisgaard, H.; Stokholm, J.; Chawes, B.L.; Vissing, N.H.; Bjarnadóttir, E.; Schoos, A.-M.M.; Wolsk, H.M.; Pedersen, T.M.; Vinding, R.K.; Thorsteinsdóttir, S.; et al. Fish Oil–Derived Fatty Acids in Pregnancy and Wheeze and Asthma in Offspring. N. Engl. J. Med. 2016, 375, 2530–2539. [Google Scholar] [CrossRef]
- Standl, M.; Sausenthaler, S.; Lattka, E.; Koletzko, S.; Bauer, C.; Wichmann, H.; Von Berg, A.; Berdel, D.; Kraemer, U.; Schaaf, B.; et al. FADS Gene Variants Modulate the Effect of Dietary Fatty Acid Intake on Allergic Diseases in Children. Allergy Eur. J. Allergy Clin. Immunol. 2011, 66, 185–186. [Google Scholar] [CrossRef]
- Talaei, M.; Sdona, E.; Calder, P.C.; Jones, L.R.; Emmett, P.M.; Granell, R.; Bergström, A.; Melén, E.; Shaheen, S.O. Intake of N-3 Polyunsaturated Fatty Acids in Childhood, FADS Genotype and Incident Asthma. Eur. Respir. J. 2021, 58, 2003633. [Google Scholar] [CrossRef]
- Schaeffer, L.; Gohlke, H.; Müller, M.; Heid, I.M.; Palmer, L.J.; Kompauer, I.; Demmelmair, H.; Illig, T.; Koletzko, B.; Heinrich, J. Common Genetic Variants of the FADS1 FADS2 Gene Cluster and Their Reconstructed Haplotypes Are Associated with the Fatty Acid Composition in Phospholipids. Hum. Mol. Genet. 2006, 15, 1745–1756. [Google Scholar] [CrossRef]
- Barman, M.; Nilsson, S.; Naluai, Å.T.; Sandin, A.; Wold, A.E.; Sandberg, A.S. Single Nucleotide Polymorphisms in the FADS Gene Cluster but Not the ELOVL2 Gene Are Associated with Serum Polyunsaturated Fatty Acid Composition and Development of Allergy (in a Swedish Birth Cohort). Nutrients 2015, 7, 10100–10115. [Google Scholar] [CrossRef]
- Rzehak, P.; Thijs, C.; Standl, M.; Mommers, M.; Glaser, C.; Jansen, E.; Klopp, N.; Koppelman, G.H.; Singmann, P.; Postma, D.S.; et al. Variants of the FADS1 FADS2 Gene Cluster, Blood Levels of Polyunsaturated Fatty Acids and Eczema in Children within the First 2 Years of Life. PLoS ONE 2010, 5, e13261. [Google Scholar] [CrossRef]
- Tanjung, C.; Harris, C.P.; Demmelmair, H.; Dwitya, S.; Munasir, Z.; Sudoyo, H.; Standl, M.; Sjarif, D.R.; Koletzko, B. Novel Interactions of Myristic Acid and FADS3 Variants Predict Atopic Dermatitis among Indonesian Infants. Nutrients 2022, 14, 4676. [Google Scholar] [CrossRef]
- Yoshida, K.; Morishima, Y.; Ano, S.; Sakurai, H.; Kuramoto, K.; Tsunoda, Y.; Yazaki, K.; Nakajima, M.; Sherpa, M.T.; Matsuyama, M.; et al. ELOVL6 Deficiency Aggravates Allergic Airway Inflammation through the Ceramide-S1P Pathway in Mice. J. Allergy Clin. Immunol. 2022, 151, 1067–1080.e9. [Google Scholar] [CrossRef]
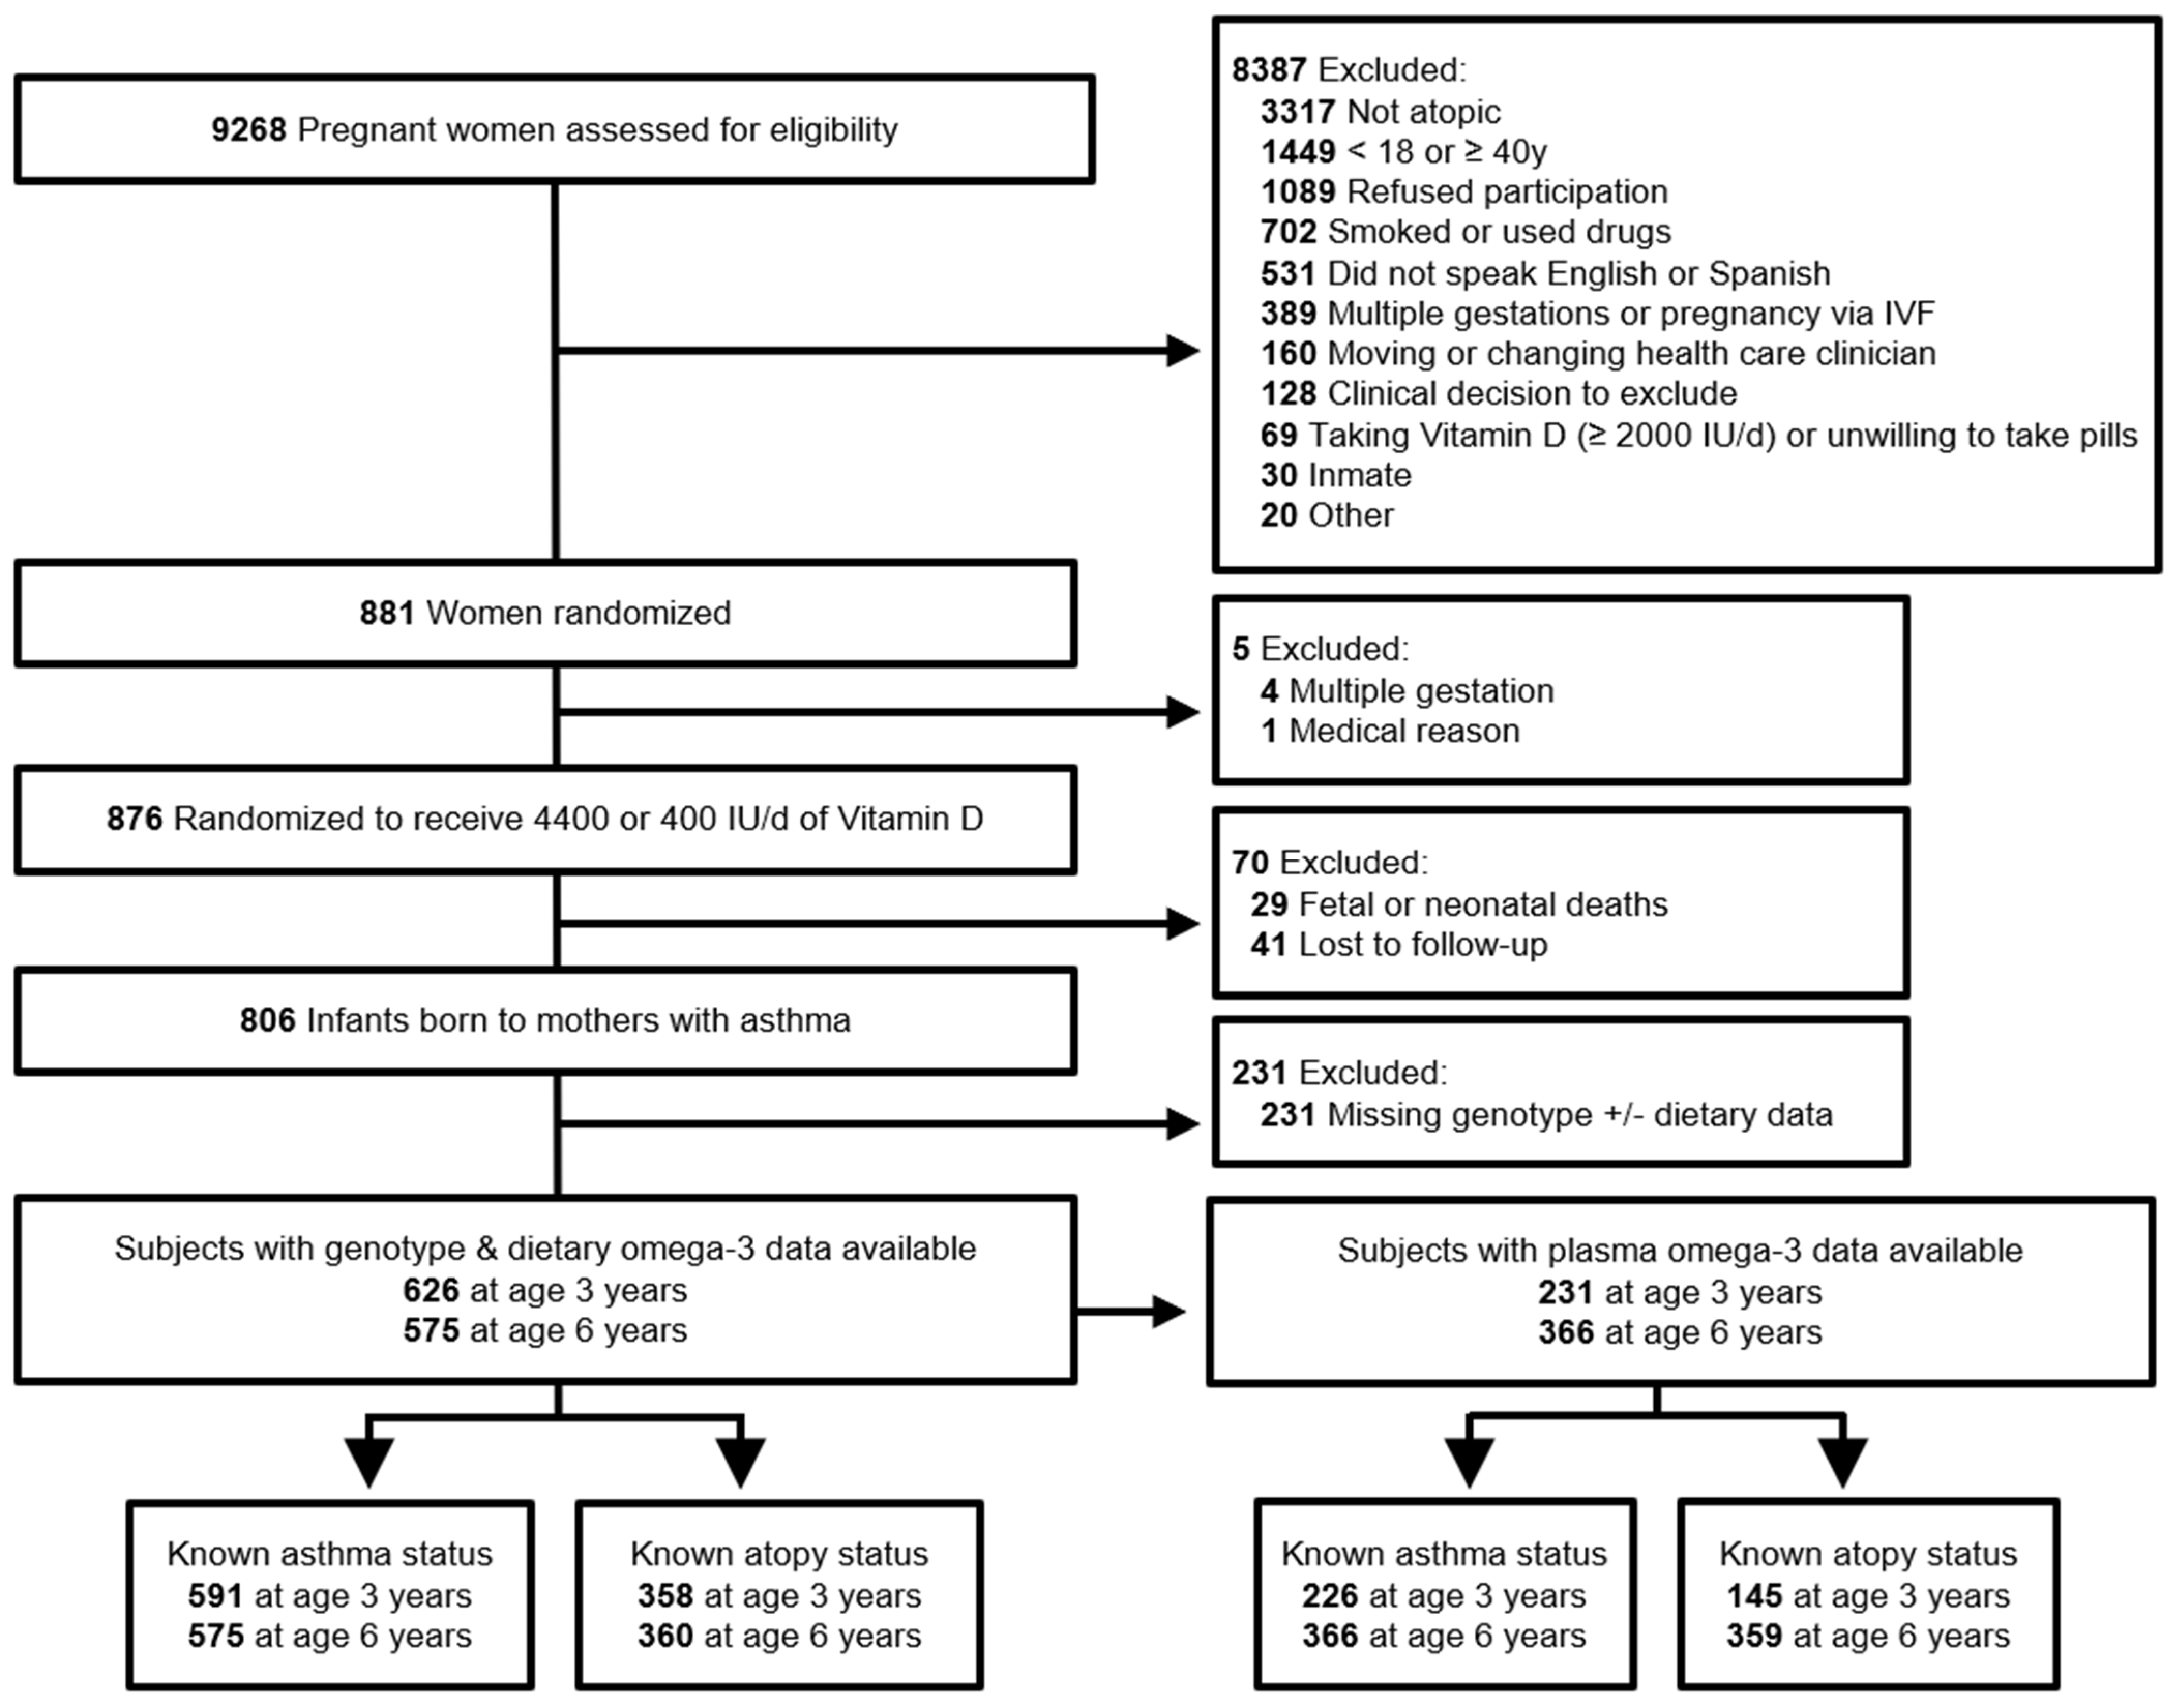
- Litonjua, A. The Vitamin D Antenatal Asthma Reduction Trial (VDAART): Rationale, Design, and Methods of a Randomized, Controlled Trial of Vitamin D Supplementation in Pregnancy for the Primary Prevention of Asthma and Allergies in Children. Contemp. Clin. Trials 2014, 38, 37–50. [Google Scholar] [CrossRef]
- Blum, R.E.; Wei, E.K.; Rockett, H.R.; Langeliers, J.D.; Leppert, J.; Gardner, J.D.; Colditz, G. A Validation of a Food Frequency Questionnaire in Native American and Caucasian Children 1 to 5 Years of Age. Matern. Child Health J. 1999, 3, 167–172. [Google Scholar] [CrossRef]
- Lee-Sarwar, K.; RS, K.; Lasky-Su, J.; Kachroo, P.; Zeiger, R.; O’Connor, G.; Sandel, M.; Bacharier, L.; Beigelman, A.; Laranjo, N.; et al. Dietary and Plasma Polyunsaturated Fatty Acids Are Inversely Associated with Asthma and Atopy in Early Childhood. J. Allergy Clin. Immunol. Pract. 2018, 7, 529–538.e8. [Google Scholar] [CrossRef]
- Willett, W. Nutritional Epidemiology; Oxford University Press: Oxford, UK, 2013; ISBN 9780199979448. [Google Scholar]
- de Oliveira Otto, M.C.; Wu, J.H.Y.; Baylin, A.; Vaidya, D.; Rich, S.S.; Tsai, M.Y.; Jacobs, D.R.J.; Mozaffarian, D. Circulating and Dietary Omega-3 and Omega-6 Polyunsaturated Fatty Acids and Incidence of CVD in the Multi-Ethnic Study of Atherosclerosis. J. Am. Heart Assoc. 2013, 2, e000506. [Google Scholar] [CrossRef]
- Xu, J.; Gaddis, N.; Bartz, T.; Hou, R.; Manichaikul, A.; Pankratz, N.; Smith, A.; Sun, F.; Terzikhan, N.; Markunas, C.; et al. Omega-3 Fatty Acids and Genome-Wide Interaction Analyses Reveal DPP10-Pulmonary Function Association. Am. J. Respir. Crit. Care Med. 2019, 199, 631–642. [Google Scholar] [CrossRef]
- Machiela, M.J.; Chanock, S.J. LDlink: A Web-Based Application for Exploring Population-Specific Haplotype Structure and Linking Correlated Alleles of Possible Functional Variants. Bioinformatics 2015, 31, 3555–3557. [Google Scholar] [CrossRef]
- Wu, H.; Romieu, I.; Shi, M.; Hancock, D.B.; Li, H.; Sienra-Monge, J.-J.; Chiu, G.Y.; Xu, H.; del Rio-Navarro, B.E.; London, S.J. Evaluation of Candidate Genes in a Genome-Wide Association Study of Childhood Asthma in Mexicans. J. Allergy Clin. Immunol. 2010, 125, 321–327.e13. [Google Scholar] [CrossRef]
- Mathias, R.A.; Grant, A.V.; Rafaels, N.; Hand, T.; Gao, L.; Vergara, C.; Tsai, Y.J.; Yang, M.; Campbell, M.; Foster, C.; et al. A Genome-Wide Association Study on African-Ancestry Populations for Asthma. J. Allergy Clin. Immunol. 2010, 125, 336–346.e4. [Google Scholar] [CrossRef] [PubMed]
- Qi, S.Y.; Riviere, P.J.; Trojnar, J.; Junien, J.-L.; Akinsanya, K.O. Cloning and Characterization of Dipeptidyl Peptidase 10, a New Member of an Emerging Subgroup of Serine Proteases. Biochem. J. 2003, 373, 179–189. [Google Scholar] [CrossRef] [PubMed]
- Zhou, H.; Hong, X.; Jiang, S.; Dong, H.; Xu, X.; Xu, X. Analyses of Associations between Three Positionally Cloned Asthma Candidate Genes and Asthma or Asthma-Related Phenotypes in a Chinese Population. BMC Med. Genet. 2009, 10, 123. [Google Scholar] [CrossRef] [PubMed]
- Willett, W.C.; Sampson, L.; Stampfer, M.J.; Rosner, B.; Bain, C.; Witschi, J.; Hennekens, C.H.; Speizer, F.E. Reproducibility and Validity of a Semiquantitative Food Frequency Questionnaire. Am. J. Epidemiol. 1985, 122, 51–65. [Google Scholar] [CrossRef] [PubMed]
- Oken, E.; Kleinman, K.P.; Olsen, S.F.; Rich-Edwards, J.W.; Gillman, M.W. Associations of Seafood and Elongated N-3 Fatty Acid Intake with Fetal Growth and Length of Gestation: Results from a US Pregnancy Cohort. Am. J. Epidemiol. 2004, 160, 774–783. [Google Scholar] [CrossRef]
- USDA. National Nutrient Database for Standard Reference Release 28. USDA Natl. Nutr. Database Stand. Ref. 2016, 13328, 13972, 17002, 17199, 19296. [Google Scholar]
- Howie, B.; Fuchsberger, C.; Stephens, M.; Marchini, J.; Abecasis, G.R. Fast and Accurate Genotype Imputation in Genome-Wide Association Studies through Pre-Phasing. Nat. Genet. 2012, 44, 955–959. [Google Scholar] [CrossRef]
- Auton, A.; Brooks, L.D.; Durbin, R.M.; Garrison, E.P.; Kang, H.M.; Korbel, J.O.; Marchini, J.L.; McCarthy, S.; McVean, G.A.; Abecasis, G.R. A Global Reference for Human Genetic Variation. Nature 2015, 526, 68–74. [Google Scholar] [CrossRef]
- Wang, C.; Zhan, X.; Bragg-Gresham, J.; Kang, H.M.; Stambolian, D.; Chew, E.Y.; Branham, K.E.; Heckenlively, J.; Fulton, R.; Wilson, R.K.; et al. Ancestry Estimation and Control of Population Stratification for Sequence-Based Association Studies. Nat. Genet. 2014, 46, 409–415. [Google Scholar] [CrossRef]
- Zhang, J.Y.; Kothapalli, K.S.D.; Brenna, J.T. Desaturase and Elongase-Limiting Endogenous Long-Chain Polyunsaturated Fatty Acid Biosynthesis. Curr. Opin. Clin. Nutr. Metab. Care 2016, 19, 103–110. [Google Scholar] [CrossRef]
- Lundequist, A.; Nallamshetty, S.N.; Xing, W.; Feng, C.; Laidlaw, T.M.; Uematsu, S.; Akira, S.; Boyce, J.A. Prostaglandin E(2) Exerts Homeostatic Regulation of Pulmonary Vascular Remodeling in Allergic Airway Inflammation. J. Immunol. 2010, 184, 433–441. [Google Scholar] [CrossRef]
- Liu, T.; Laidlaw, T.M.; Feng, C.; Xing, W.; Shen, S.; Milne, G.L.; Boyce, J.A. Prostaglandin E2 Deficiency Uncovers a Dominant Role for Thromboxane A2 in House Dust Mite-Induced Allergic Pulmonary Inflammation. Proc. Natl. Acad. Sci. USA 2012, 109, 12692–12697. [Google Scholar] [CrossRef]
- Almoguera, B.; Vazquez, L.; Mentch, F.; Connolly, J.; Pacheco, J.A.; Sundaresan, A.S.; Peissig, P.L.; Linneman, J.G.; McCarty, C.A.; Crosslin, D.; et al. Identification of Four Novel Loci in Asthma in European American and African American Populations. Am. J. Respir. Crit. Care Med. 2017, 195, 456–463. [Google Scholar] [CrossRef]
- Poole, E.M.; Hsu, L.; Xiao, L.; Kulmacz, R.J.; Carlson, C.S.; Rabinovitch, P.S.; Makar, K.W.; Potter, J.D.; Ulrich, C.M. Genetic Variation in Prostaglandin E2 Synthesis and Signaling, Prostaglandin Dehydrogenase, and the Risk of Colorectal Adenoma. Cancer Epidemiol. Biomarkers Prev. 2010, 19, 547–557. [Google Scholar] [CrossRef]
- Peebles, R.S.J. Prostaglandins in Asthma and Allergic Diseases. Pharmacol. Ther. 2019, 193, 1–19. [Google Scholar] [CrossRef]
- Habermann, N.; Ulrich, C.M.; Lundgreen, A.; Makar, K.W.; Poole, E.M.; Caan, B.; Kulmacz, R.; Whitton, J.; Galbraith, R.; Potter, J.D.; et al. PTGS1, PTGS2, ALOX5, ALOX12, ALOX15, and FLAP SNPs: Interaction with Fatty Acids in Colon Cancer and Rectal Cancer. Genes Nutr. 2013, 8, 115–126. [Google Scholar] [CrossRef]
- Fradet, V.; Cheng, L.; Casey, G.; Witte, J.S. Dietary Omega-3 Fatty Acids, Cyclooxygenase-2 Genetic Variation, and Aggressive Prostate Cancer Risk. Clin. Cancer Res. 2009, 15, 2559–2566. [Google Scholar] [CrossRef]
- Hedelin, M.; Chang, E.T.; Wiklund, F.; Bellocco, R.; Klint, Å.; Adolfsson, J.; Shahedi, K.; Xu, J.; Adami, H.O.; Grönberg, H.; et al. Association of Frequent Consumption of Fatty Fish with Prostate Cancer Risk Is Modified by COX-2 Polymorphism. Int. J. Cancer 2007, 120, 398–405. [Google Scholar] [CrossRef]

| Dietary Omega-3 | Plasma Omega-3 | |||||||
|---|---|---|---|---|---|---|---|---|
| Analyzed Subjects (n = 575) | ≤Median (n = 288) | >Median (n = 287) | p Value | ≤Median (n = 183) | >Median (n = 183) | p Value | VDAART Cohort (n = 806) | |
| Sex—number (%) | 0.80 | 0.40 | ||||||
| Male | 300 (52) | 148 (51) | 152 (53) | 102 (56) | 93 (51) | 421 (52) | ||
| Female | 275 (48) | 140 (49) | 135 (47) | 81 (44) | 90 (49) | 385 (48) | ||
| Race—number (%) | 1.00 | 0.50 | ||||||
| Black | 272 (48) | 137 (48) | 135 (47) | 80 (44) | 90 (49) | 390 (48) | ||
| White | 191 (34) | 95 (33) | 96 (33) | 65 (36) | 57 (31) | 265 (33) | ||
| Other | 112 (19) | 56 (19) | 56 (20) | 38 (21) | 36 (20) | 151 (19) | ||
| Hispanic—number (%) | 183 (32) | 91 (32) | 92 (32) | 1.00 | 69 (38) | 64 (35) | 0.70 | 273 (34) |
| VDAART treatment group—number (%) | 0.30 | 0.50 | ||||||
| 4400 IU/day vitamin D | 294 (51) | 154 (53) | 140 (49) | 87 (48) | 95 (52) | 405 (50) | ||
| 400 IU/day vitamin D | 281 (49) | 134 (47) | 147 (51) | 96 (52) | 88 (48) | 401 (50) | ||
| Study Center—number (%) | 0.40 | 0.90 | ||||||
| Boston | 137 (24) | 65 (23) | 72 (25) | 48 (26) | 49 (27) | 240 (30) | ||
| St. Louis | 243 (42) | 130 (45) | 113 (39) | 72 (39) | 67 (37) | 292 (36) | ||
| San Diego | 195 (34) | 93 (32) | 102 (36) | 63 (34) | 67 (37) | 274 (34) | ||
| Maternal education—number (%) | 0.50 | 0.70 | ||||||
| <High school | 75 (13) | 37 (13) | 38 (13) | 29 (16) | 24 (13) | 100 (12) | ||
| High school or technical school | 161 (28) | 84 (29) | 77 (27) | 55 (30) | 54 (30) | 241 (30) | ||
| Some level of college education | 133 (23) | 72 (25) | 61 (21) | 42 (23) | 38 (21) | 192 (24) | ||
| College graduate or higher | 206 (36) | 95 (33) | 111 (39) | 57 (31) | 67 (37) | 273 (34) | ||
| Birth by cesarean section—number (%) | 166 (29) | 89 (31) | 77 (27) | 0.30 | 52 (28) | 48 (26) | 0.70 | 239 (30) |
| Preterm birth < 37 weeks’ gestation—number (%) | 50 (9) | 28 (10) | 22 (8) | 0.50 | 19 (10) | 11 (6) | 0.20 | 71 (9) |
| Exclusive breastfeeding for first 4 months of life—number (%) | 185 (34) | 87 (32) | 98 (37) | 0.30 | 61 (36) | 67 (39) | 0.60 | 247 (33) |
| BMI (kg/m2) at age 6 years—mean (SD) | 17 (2.8) | 17 (2.6) | 17 (2.9) | 0.40 | 17 (2.6) | 17 (2.8) | 0.30 | 17 (2.9) |
| BMI z score at age 6 years—mean (SD) | 0.54 (1.16) | 0.62 (1.05) | 0.45 (1.26) | 0.11 | 0.55 (1.22) | 0.45 (1.17) | 0.42 | 0.57 (1.19) |
| Dietary Omega-3 | Plasma Omega-3 | |||||||
|---|---|---|---|---|---|---|---|---|
| Analyzed Subjects (n = 626) | ≤Median (n = 313) | >Median (n = 313) | p Value | ≤Median (n = 116) | >Median (n = 115) | p Value | VDAART Cohort (n = 806) | |
| Sex—number (%) | 0.63 | 0.74 | ||||||
| Male | 325 (52) | 166 (53) | 159 (51) | 60 (52) | 63 (55) | 421 (52) | ||
| Female | 301 (48) | 147 (47) | 154 (49) | 56 (48) | 52 (45) | 385 (48) | ||
| Race—number (%) | 0.03 | 0.26 | ||||||
| Black | 299 (48) | 135 (43) | 164 (52) | 54 (47) | 54 (47) | 390 (48) | ||
| White | 201 (32) | 115 (37) | 86 (27) | 41 (35) | 33 (29) | 265 (33) | ||
| Other | 126 (20) | 63 (20) | 63 (20) | 21 (18) | 28 (24) | 151 (19) | ||
| Hispanic—number (%) | 206 (33) | 113 (36) | 93 (30) | 0.11 | 38 (33) | 47 (41) | 0.25 | 273 (34) |
| VDAART treatment group—number (%) | 0.07 | 0.84 | ||||||
| 4400 IU/day vitamin D | 312 (50) | 168 (54) | 144 (46) | 58 (50) | 55 (48) | 405 (50) | ||
| 400 IU/day vitamin D | 214 (50) | 145 (46) | 169 (54) | 58 (50) | 60 (52) | 401 (50) | ||
| Study Center—number (%) | 0.51 | 0.18 | ||||||
| Boston | 157 (25) | 79 (25) | 78 (25) | 22 (19) | 24 (21) | 240 (30) | ||
| St. Louis | 256 (41) | 134 (43) | 122 (39) | 56 (48) | 42 (37) | 292 (36) | ||
| San Diego | 213 (34) | 100 (32) | 113 (36) | 38 (33) | 49 (43) | 274 (34) | ||
| Maternal education—number (%) | 0.61 | 0.18 | ||||||
| <High school | 84 (13) | 44 (14) | 40 (13) | 11 (10) | 18 (16) | 100 (12) | ||
| High school or technical school | 184 (29) | 94 (30) | 90 (29) | 32 (38) | 27 (24) | 241 (30) | ||
| Some level of college education | 142 (23) | 64 (20) | 78 (25) | 35 (30) | 24 (21) | 192 (24) | ||
| College graduate or higher | 216 (35) | 111 (36) | 105 (34) | 38 (33) | 46 (40) | 273 (34) | ||
| Birth by cesarean section—number (%) | 180 (29) | 90 (29) | 90 (29) | 1.00 | 41 (35) | 35 (30) | 0.51 | 239 (30) |
| Preterm birth < 37 weeks’ gestation—number (%) | 49 (8) | 31 (10) | 18 (6) | 0.07 | 11 (9) | 6 (5) | 0.32 | 71 (9) |
| Exclusive breastfeeding for first 4 months of life—number (%) | 196 (33) | 94 (32) | 102 (35) | 0.50 | 36 (34) | 34 (31) | 0.77 | 247 (33) |
| BMI (kg/m2) at age 3 years—mean (SD) | 16.6 (1.7) | 16.6 (1.8) | 16.5 (1.7) | 0.52 | 16.9 (2.1) | 16.5 (1.8) | 0.12 | 16.6 (1.8) |
| BMI z score at age 3 years—mean (SD) | 0.37 (1.14) | 0.39 (1.17) | 0.35 (1.12) | 0.64 | 0.58 (1.24) | 0.32 (1.17) | 0.10 | 0.40 (1.16) |
| VDAART [14] (n = 575) | COPSAC [6] (n = 583) | |
|---|---|---|
| Male sex | 327 (52) | 300 (51) |
| White race | 204 (33) | 583 (100) |
| Black race | 303 (48) | 0 (0) |
| Other race | 121 (19) | 0 (0) |
| Asthma | 107 (18) | 37 (6) |
| Atopy | 199 (55) | 34 (6) by skin testing 89 (15) by serum specific IgE |
| Offspring atopy risk in recruitment population | Elevated genetic risk | General population |
| rs958457 MAF | 0.23 | 0.24 |
| rs958457 HWE p value | 0.91 | 1.00 |
| rs1516311 MAF | 0.08 | 0.21 |
| rs1516311 HWE p value | 0.13 | 0.55 |
| rs1367180 MAF | 0.26 | 0.19 |
| rs1367180 HWE p value | 0.11 | 0.60 |
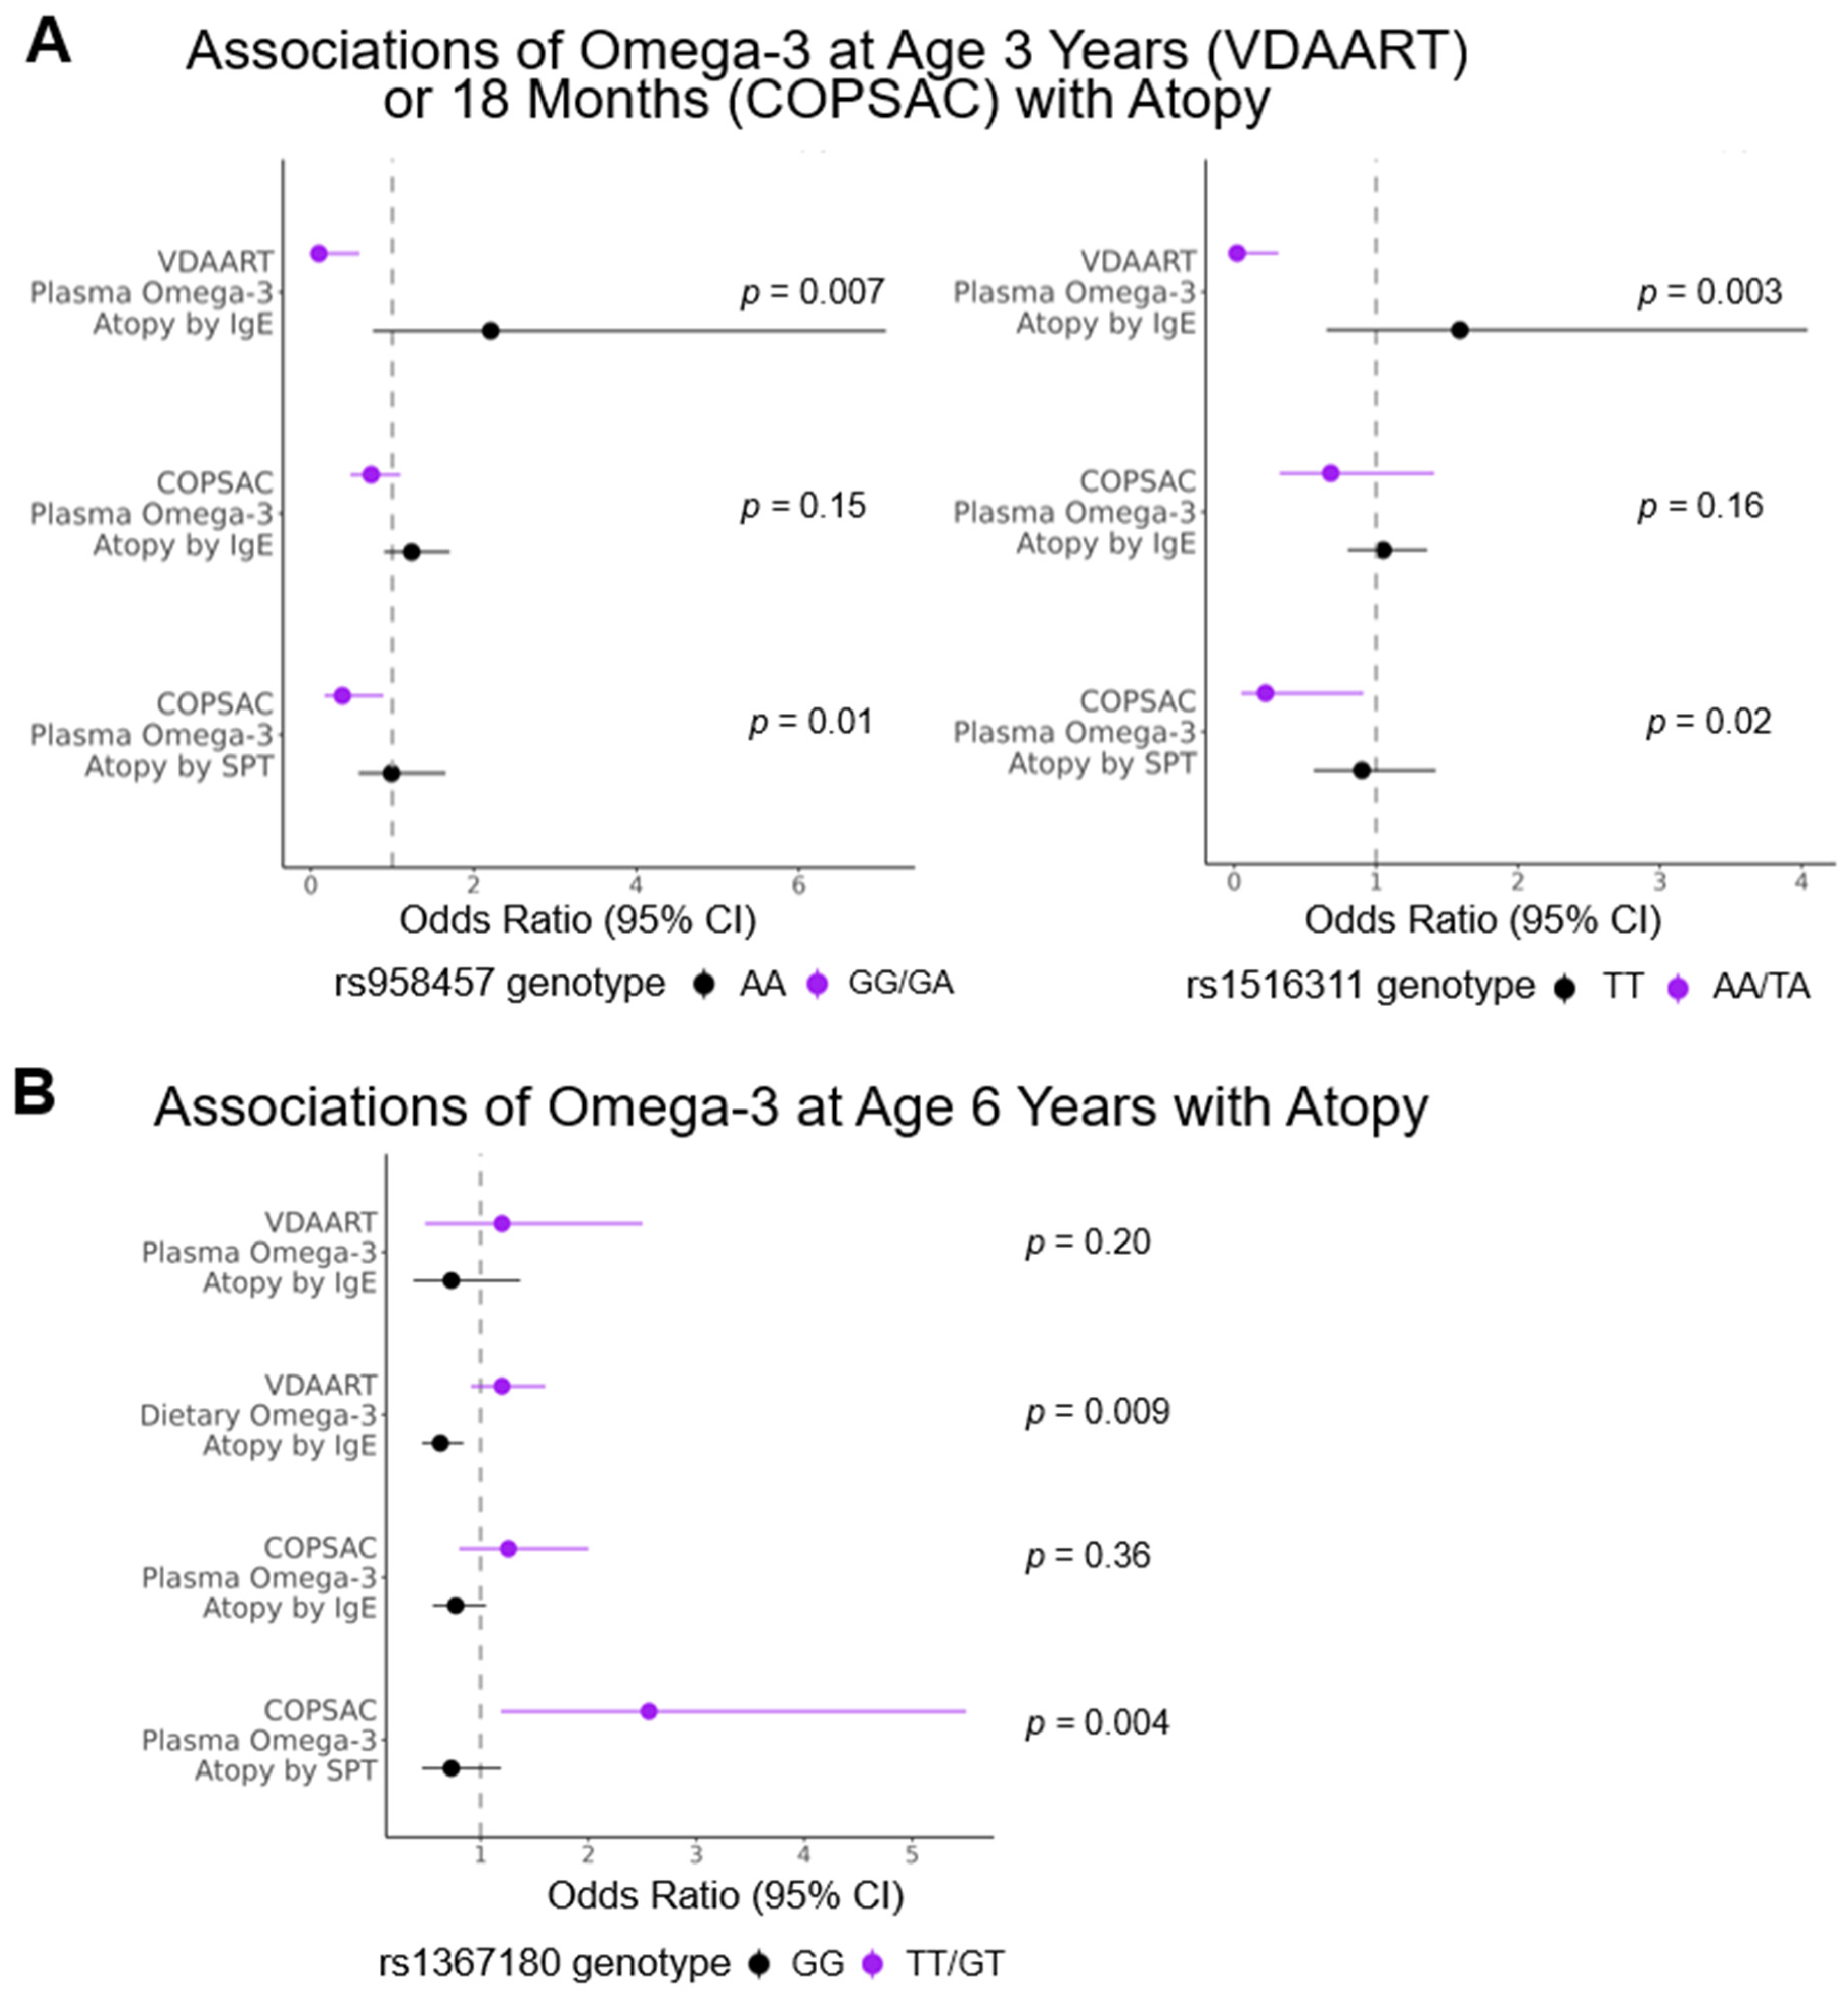
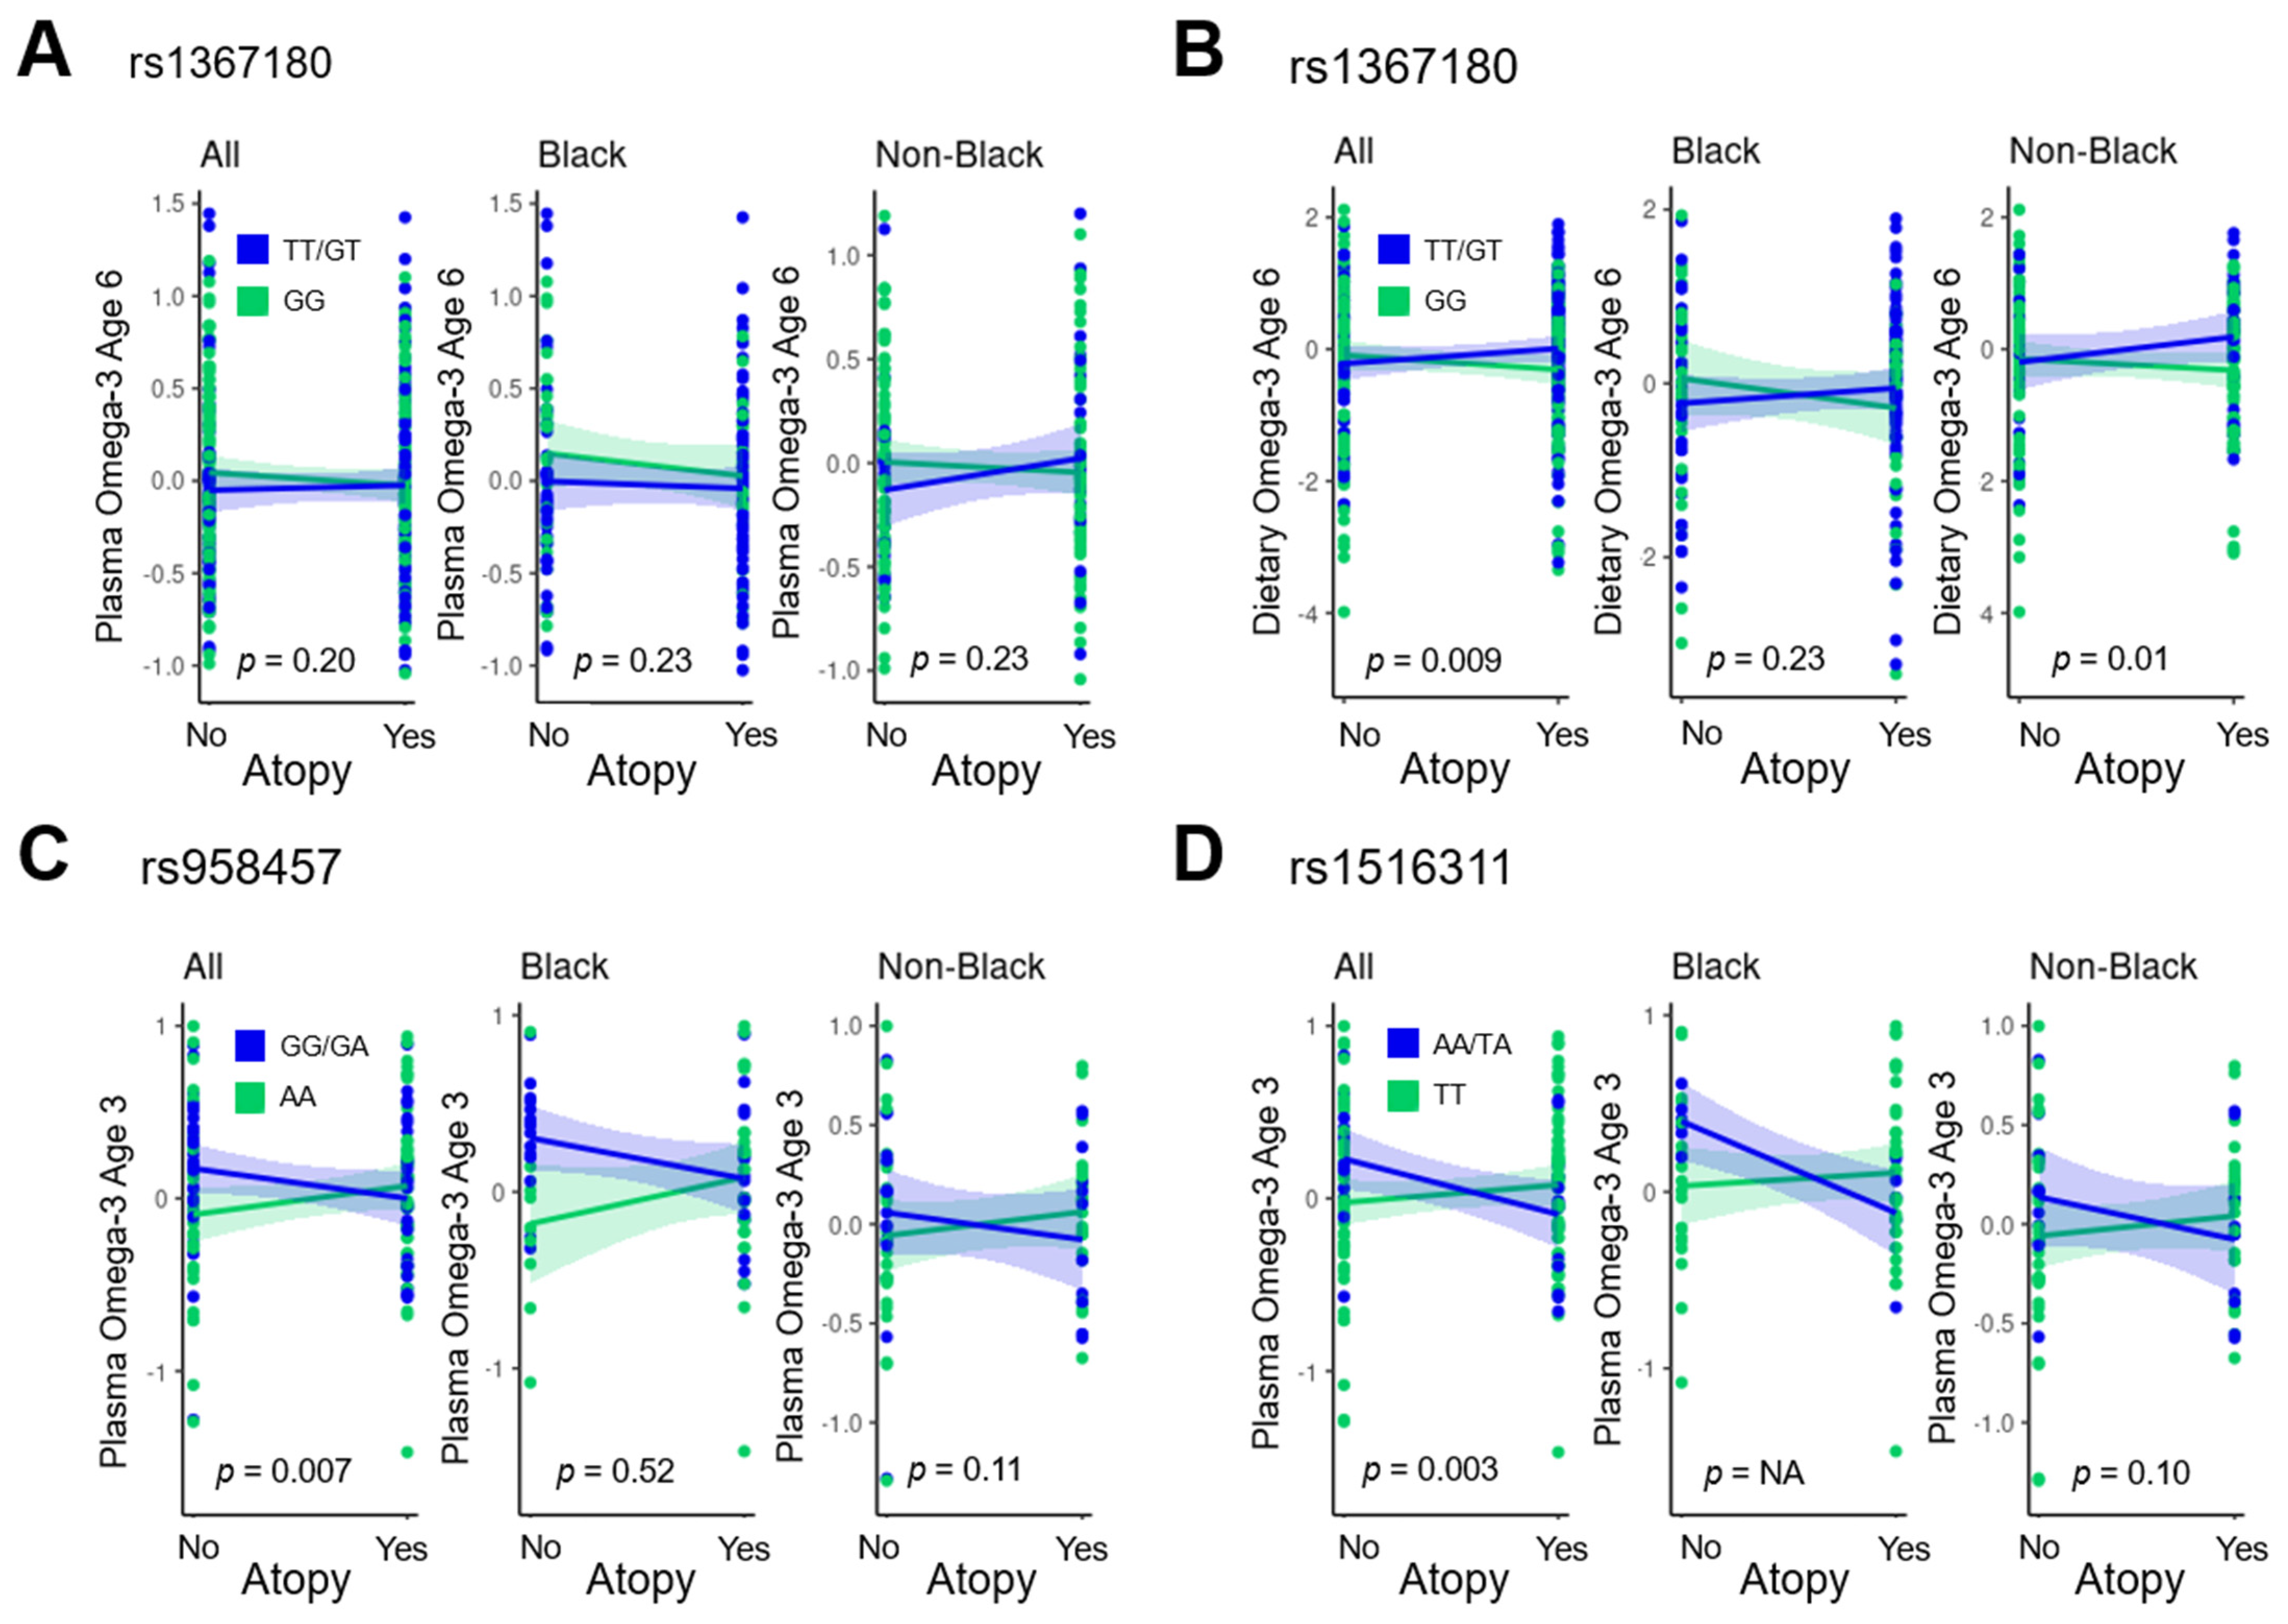
| Interaction p Value | 0 Minor Alleles | 1 or 2 Minor Alleles | ||||||||||
|---|---|---|---|---|---|---|---|---|---|---|---|---|
| CHR | ID | VDAART n-3 | n-3 Time Point | Outcome | Minor Allele | VDAART Results | COPSAC Results (Atopy by IgE) | COPSAC Results (Atopy by SPT) | VDAART Results | COPSAC Results (Atopy by IgE) | COPSAC Results (Atopy by SPT) | |
| 2 | rs1367180 | Dietary | 6 years | Atopy | T | VDAART: 0.009 COPSAC: 0.004 | 0.63 (0.46, 0.84) p = 0.002 | 0.77 (0.56, 1.05) p = 0.10 | 0.73 (0.46, 1.19) p = 0.22 | 1.20 (0.91, 1.60) p = 0.21 | 1.26 (0.80, 2.00) p = 0.32 | 2.56 (1.19, 5.50) p = 0.02 |
| 2 | rs958457 | Plasma | 18 months in COPSAC/3 years in VDAART | Atopy | G | VDAART: 0.007 COPSAC: 0.01 | 2.21 (0.76, 7.07) p = 0.16 | 1.24 (0.90, 1.71) p = 0.19 | 0.99 (0.59, 1.66) p = 0.96 | 0.10 (0.01, 0.60) p = 0.02 | 0.74 (0.49, 1.10) p = 0.14 | 0.39 (0.17, 0.89) p = 0.03 |
| 2 | rs1516311 | Plasma | Atopy | A | VDAART: 0.003 COPSAC: 0.02 | 1.59 (0.65, 4.04) p = 0.32 | 1.05 (0.80, 1.36) p = 0.74 | 0.90 (0.56, 1.42) p = 0.64 | 0.02 (0.001, 0.31) p = 0.01 | 0.68 (0.32, 1.41) p = 0.30 | 0.22 (0.05, 0.91) p = 0.04 | |
Disclaimer/Publisher’s Note: The statements, opinions and data contained in all publications are solely those of the individual author(s) and contributor(s) and not of MDPI and/or the editor(s). MDPI and/or the editor(s) disclaim responsibility for any injury to people or property resulting from any ideas, methods, instructions or products referred to in the content. |
© 2023 by the authors. Licensee MDPI, Basel, Switzerland. This article is an open access article distributed under the terms and conditions of the Creative Commons Attribution (CC BY) license (https://creativecommons.org/licenses/by/4.0/).
Share and Cite
Lee-Sarwar, K.A.; Fischer-Rasmussen, K.; Bønnelykke, K.; Bisgaard, H.; Chawes, B.; Kelly, R.S.; Lasky-Su, J.; Zeiger, R.S.; O’Connor, G.T.; Bacharier, L.B.; et al. Omega-3 Fatty Acids Interact with DPP10 Region Genotype in Association with Childhood Atopy. Nutrients 2023, 15, 2416. https://doi.org/10.3390/nu15102416
Lee-Sarwar KA, Fischer-Rasmussen K, Bønnelykke K, Bisgaard H, Chawes B, Kelly RS, Lasky-Su J, Zeiger RS, O’Connor GT, Bacharier LB, et al. Omega-3 Fatty Acids Interact with DPP10 Region Genotype in Association with Childhood Atopy. Nutrients. 2023; 15(10):2416. https://doi.org/10.3390/nu15102416
Chicago/Turabian StyleLee-Sarwar, Kathleen A., Kasper Fischer-Rasmussen, Klaus Bønnelykke, Hans Bisgaard, Bo Chawes, Rachel S. Kelly, Jessica Lasky-Su, Robert S. Zeiger, George T. O’Connor, Leonard B. Bacharier, and et al. 2023. "Omega-3 Fatty Acids Interact with DPP10 Region Genotype in Association with Childhood Atopy" Nutrients 15, no. 10: 2416. https://doi.org/10.3390/nu15102416