Evaluation of Non-Alcoholic Beverages and the Risk Related to Consumer Health among the Romanian Population
Abstract
:1. Introduction
2. Materials and Methods
2.1. Study Design
2.2. Questionnaire Validation
2.3. Statistical Analysis
3. Results
3.1. Socio-Demographic and Anthropometric Data
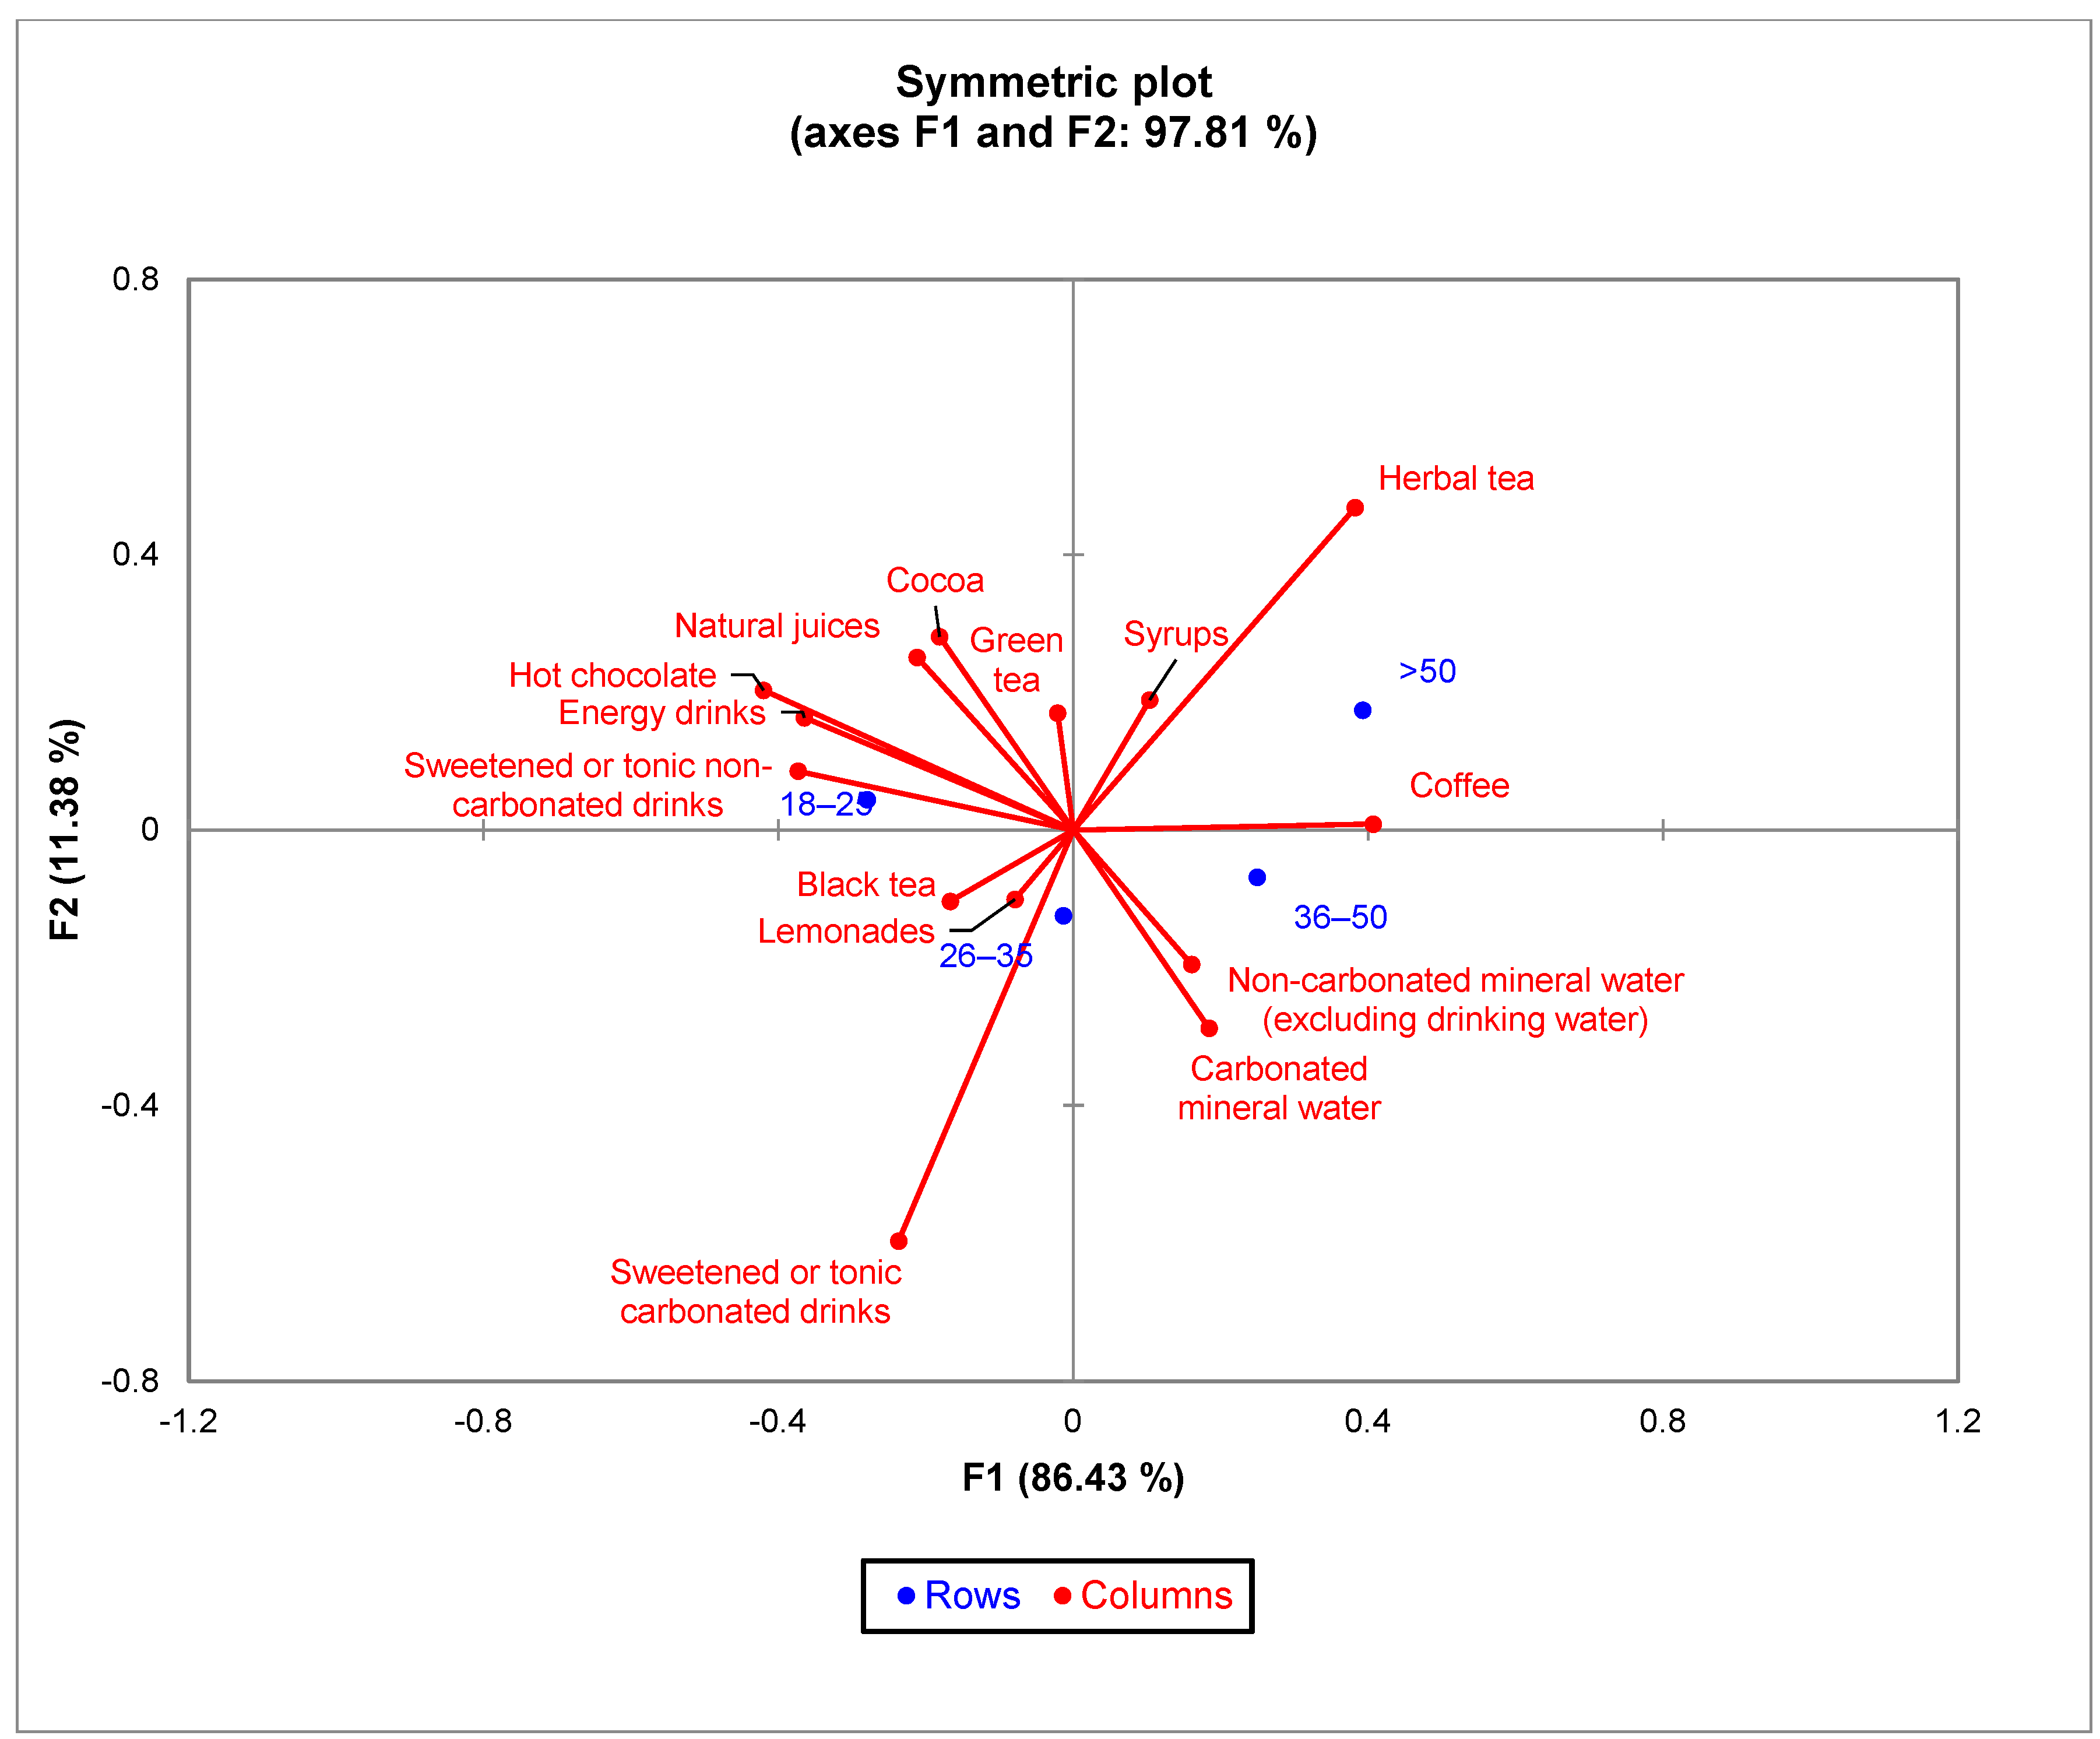
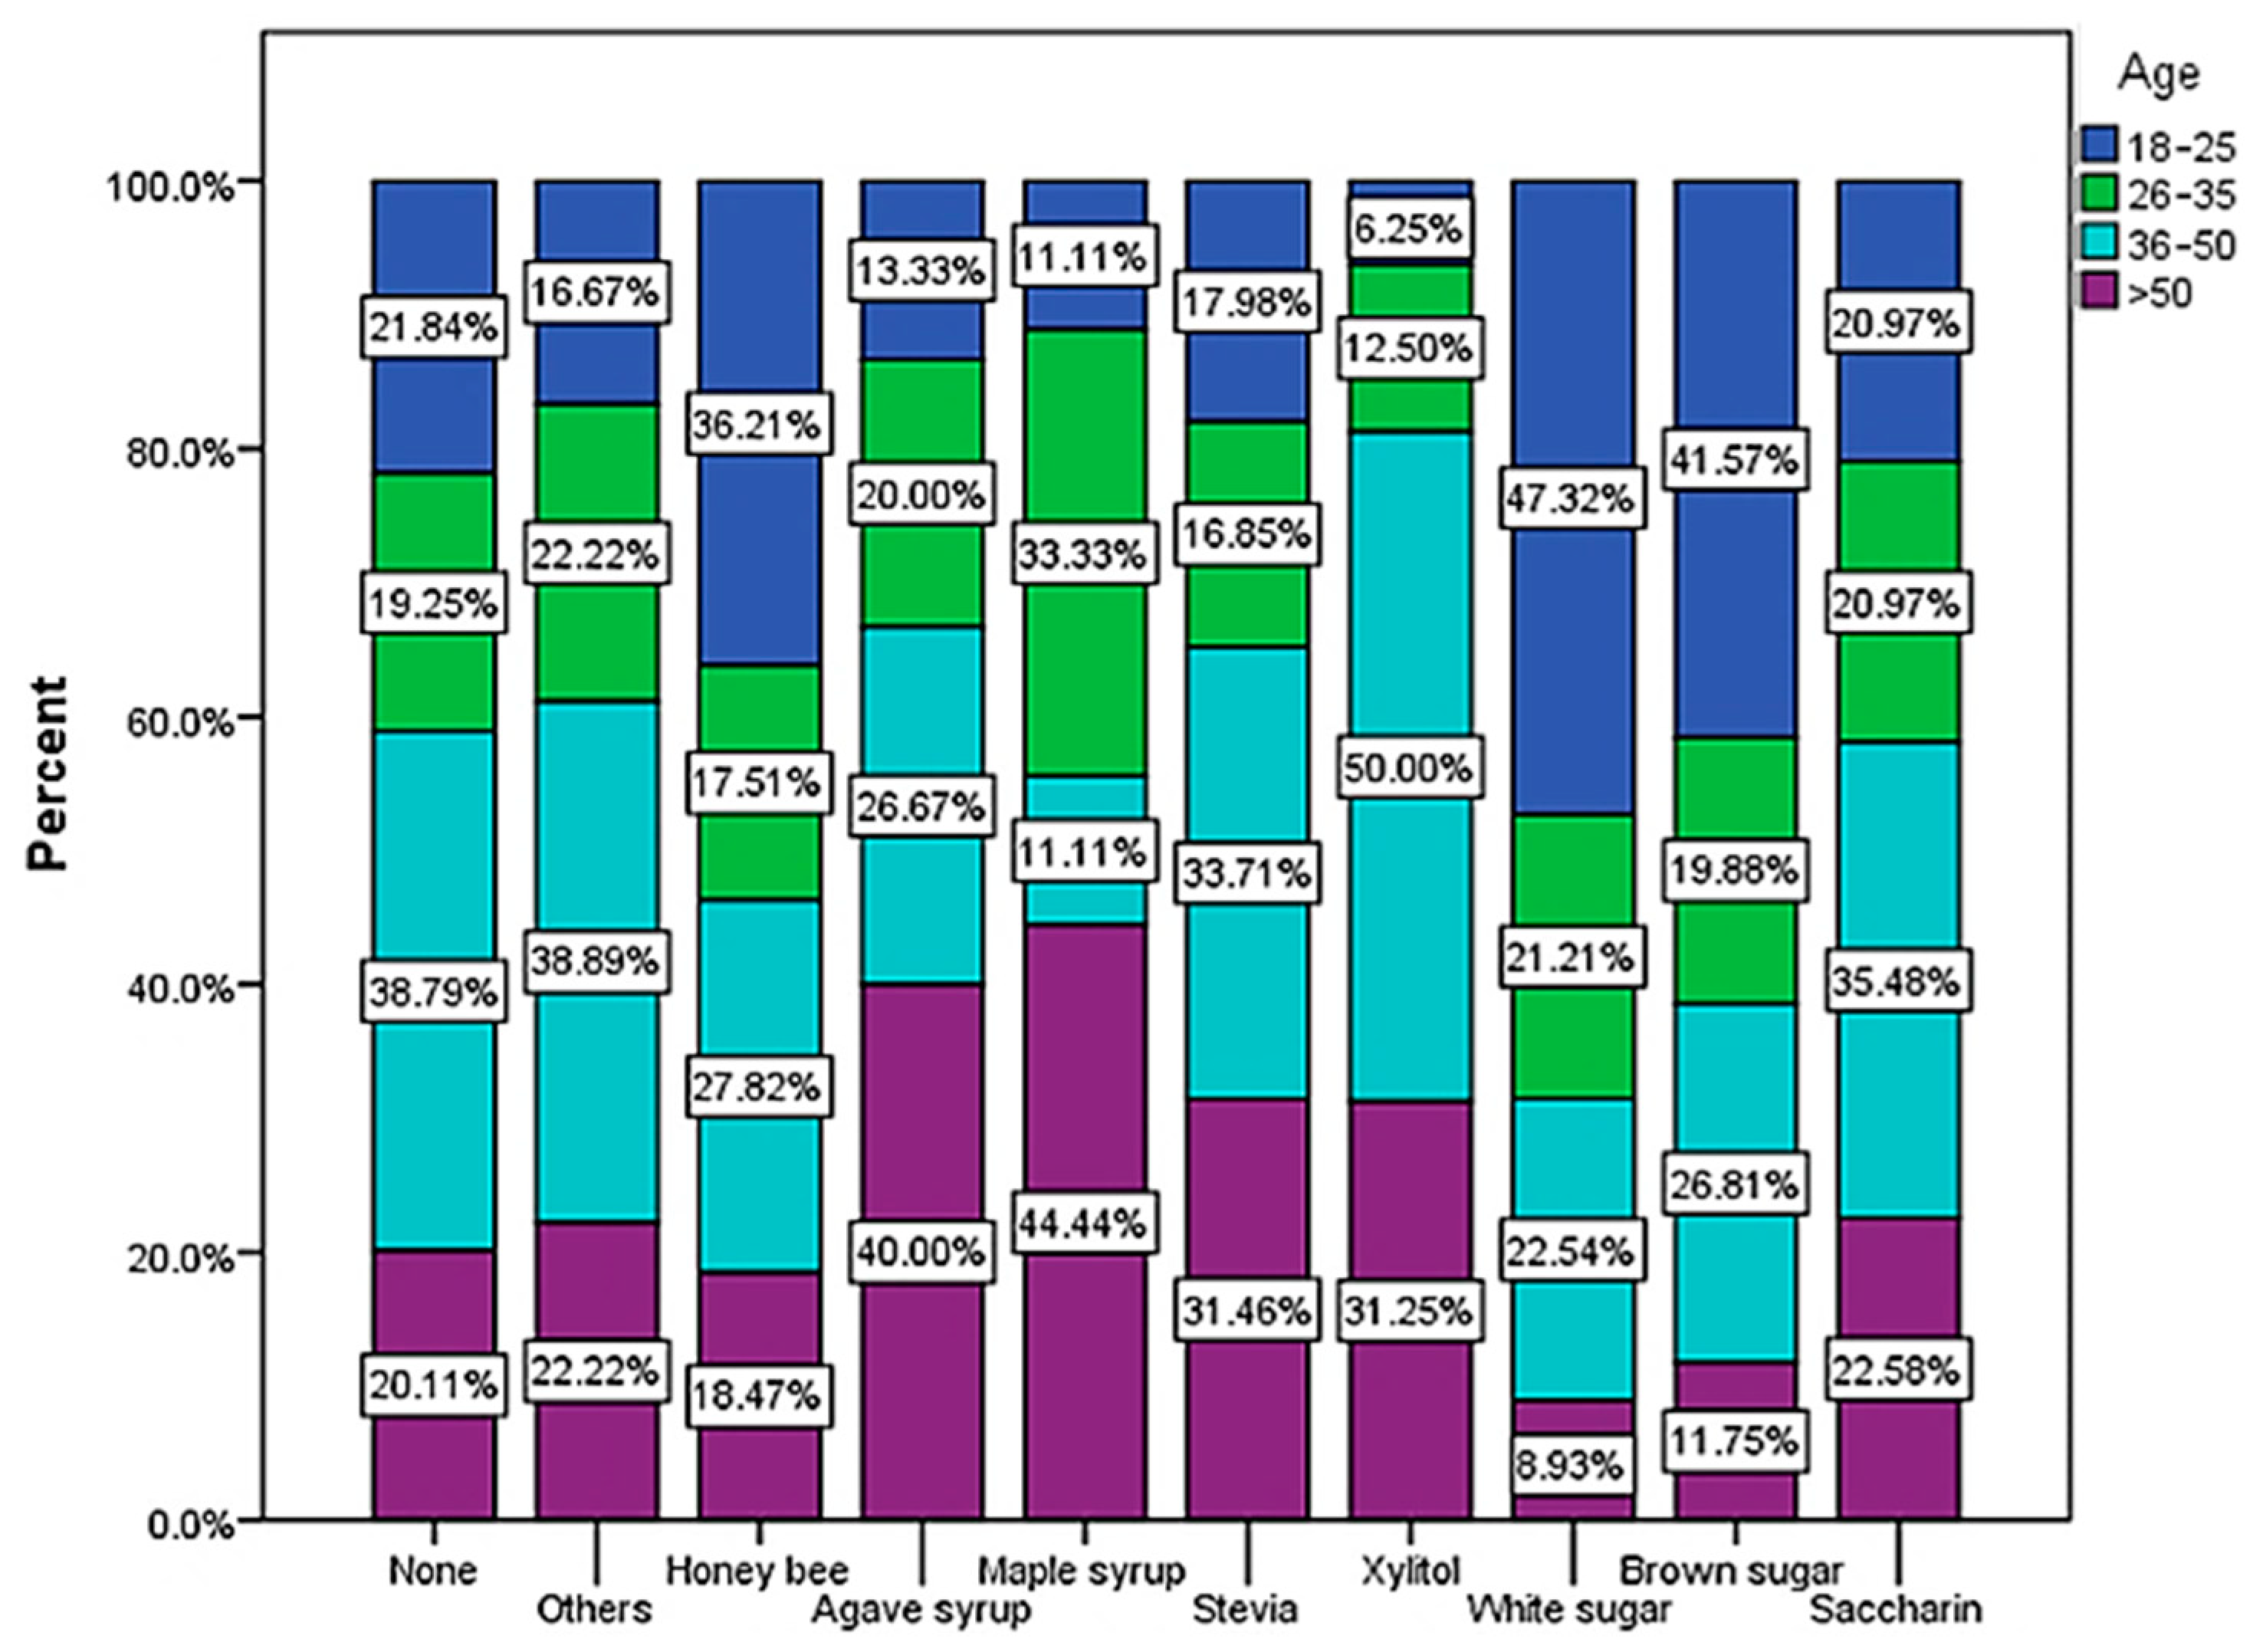
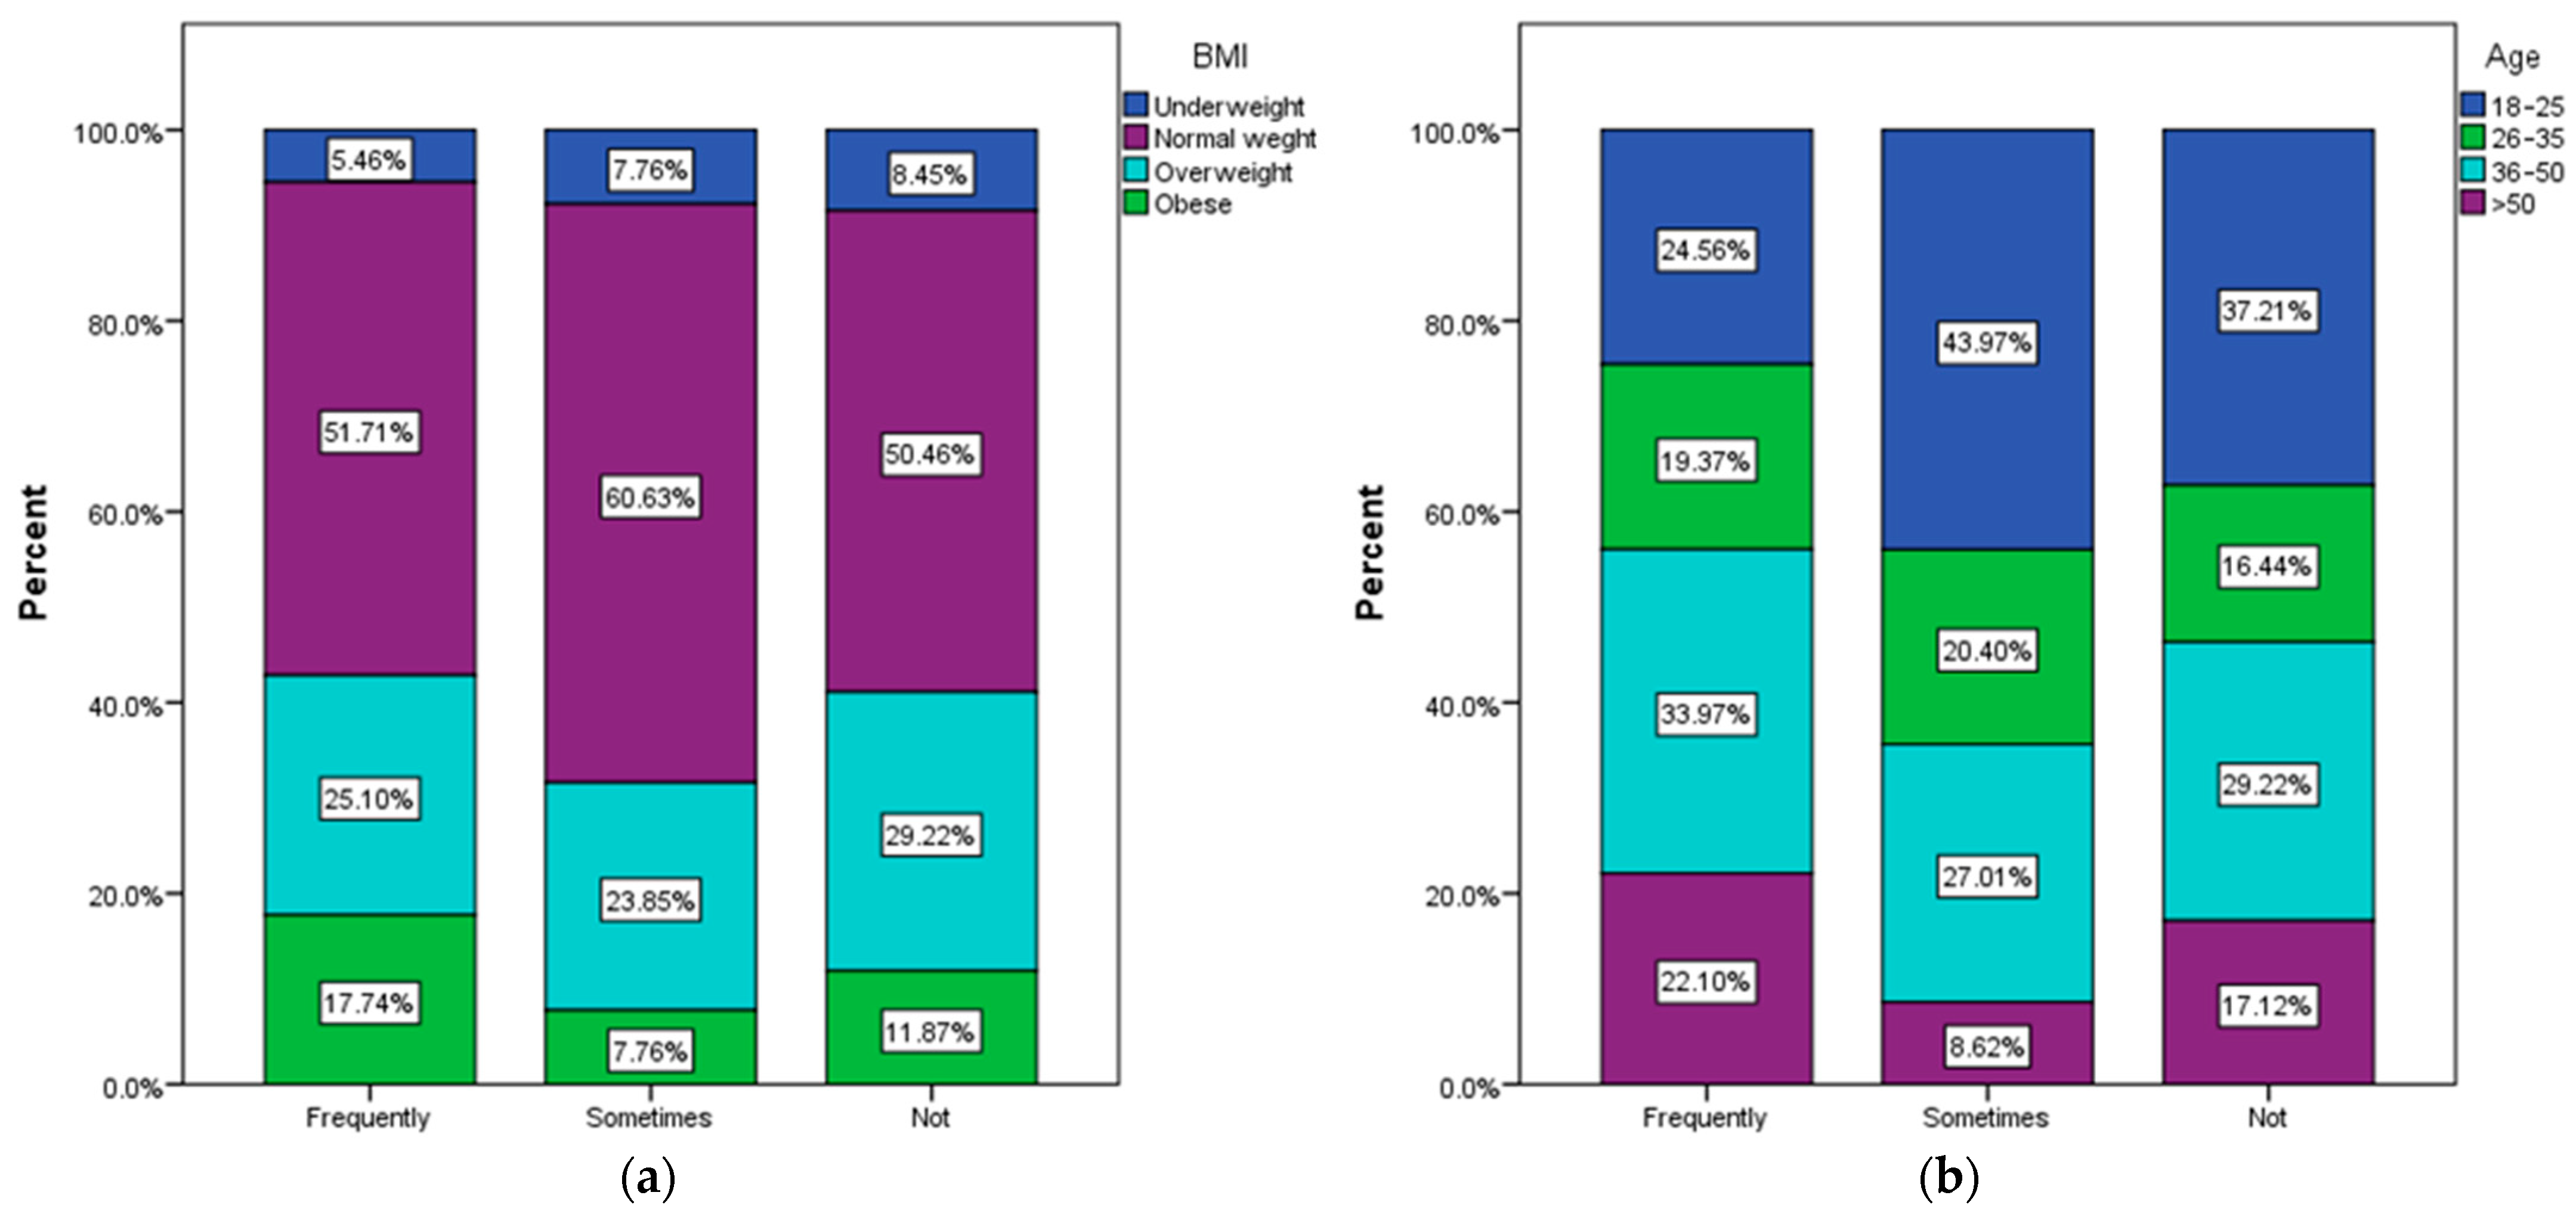
3.2. The Types of Drinks Frequently Consumed Correlated with the Demographic and Anthropometric Variables
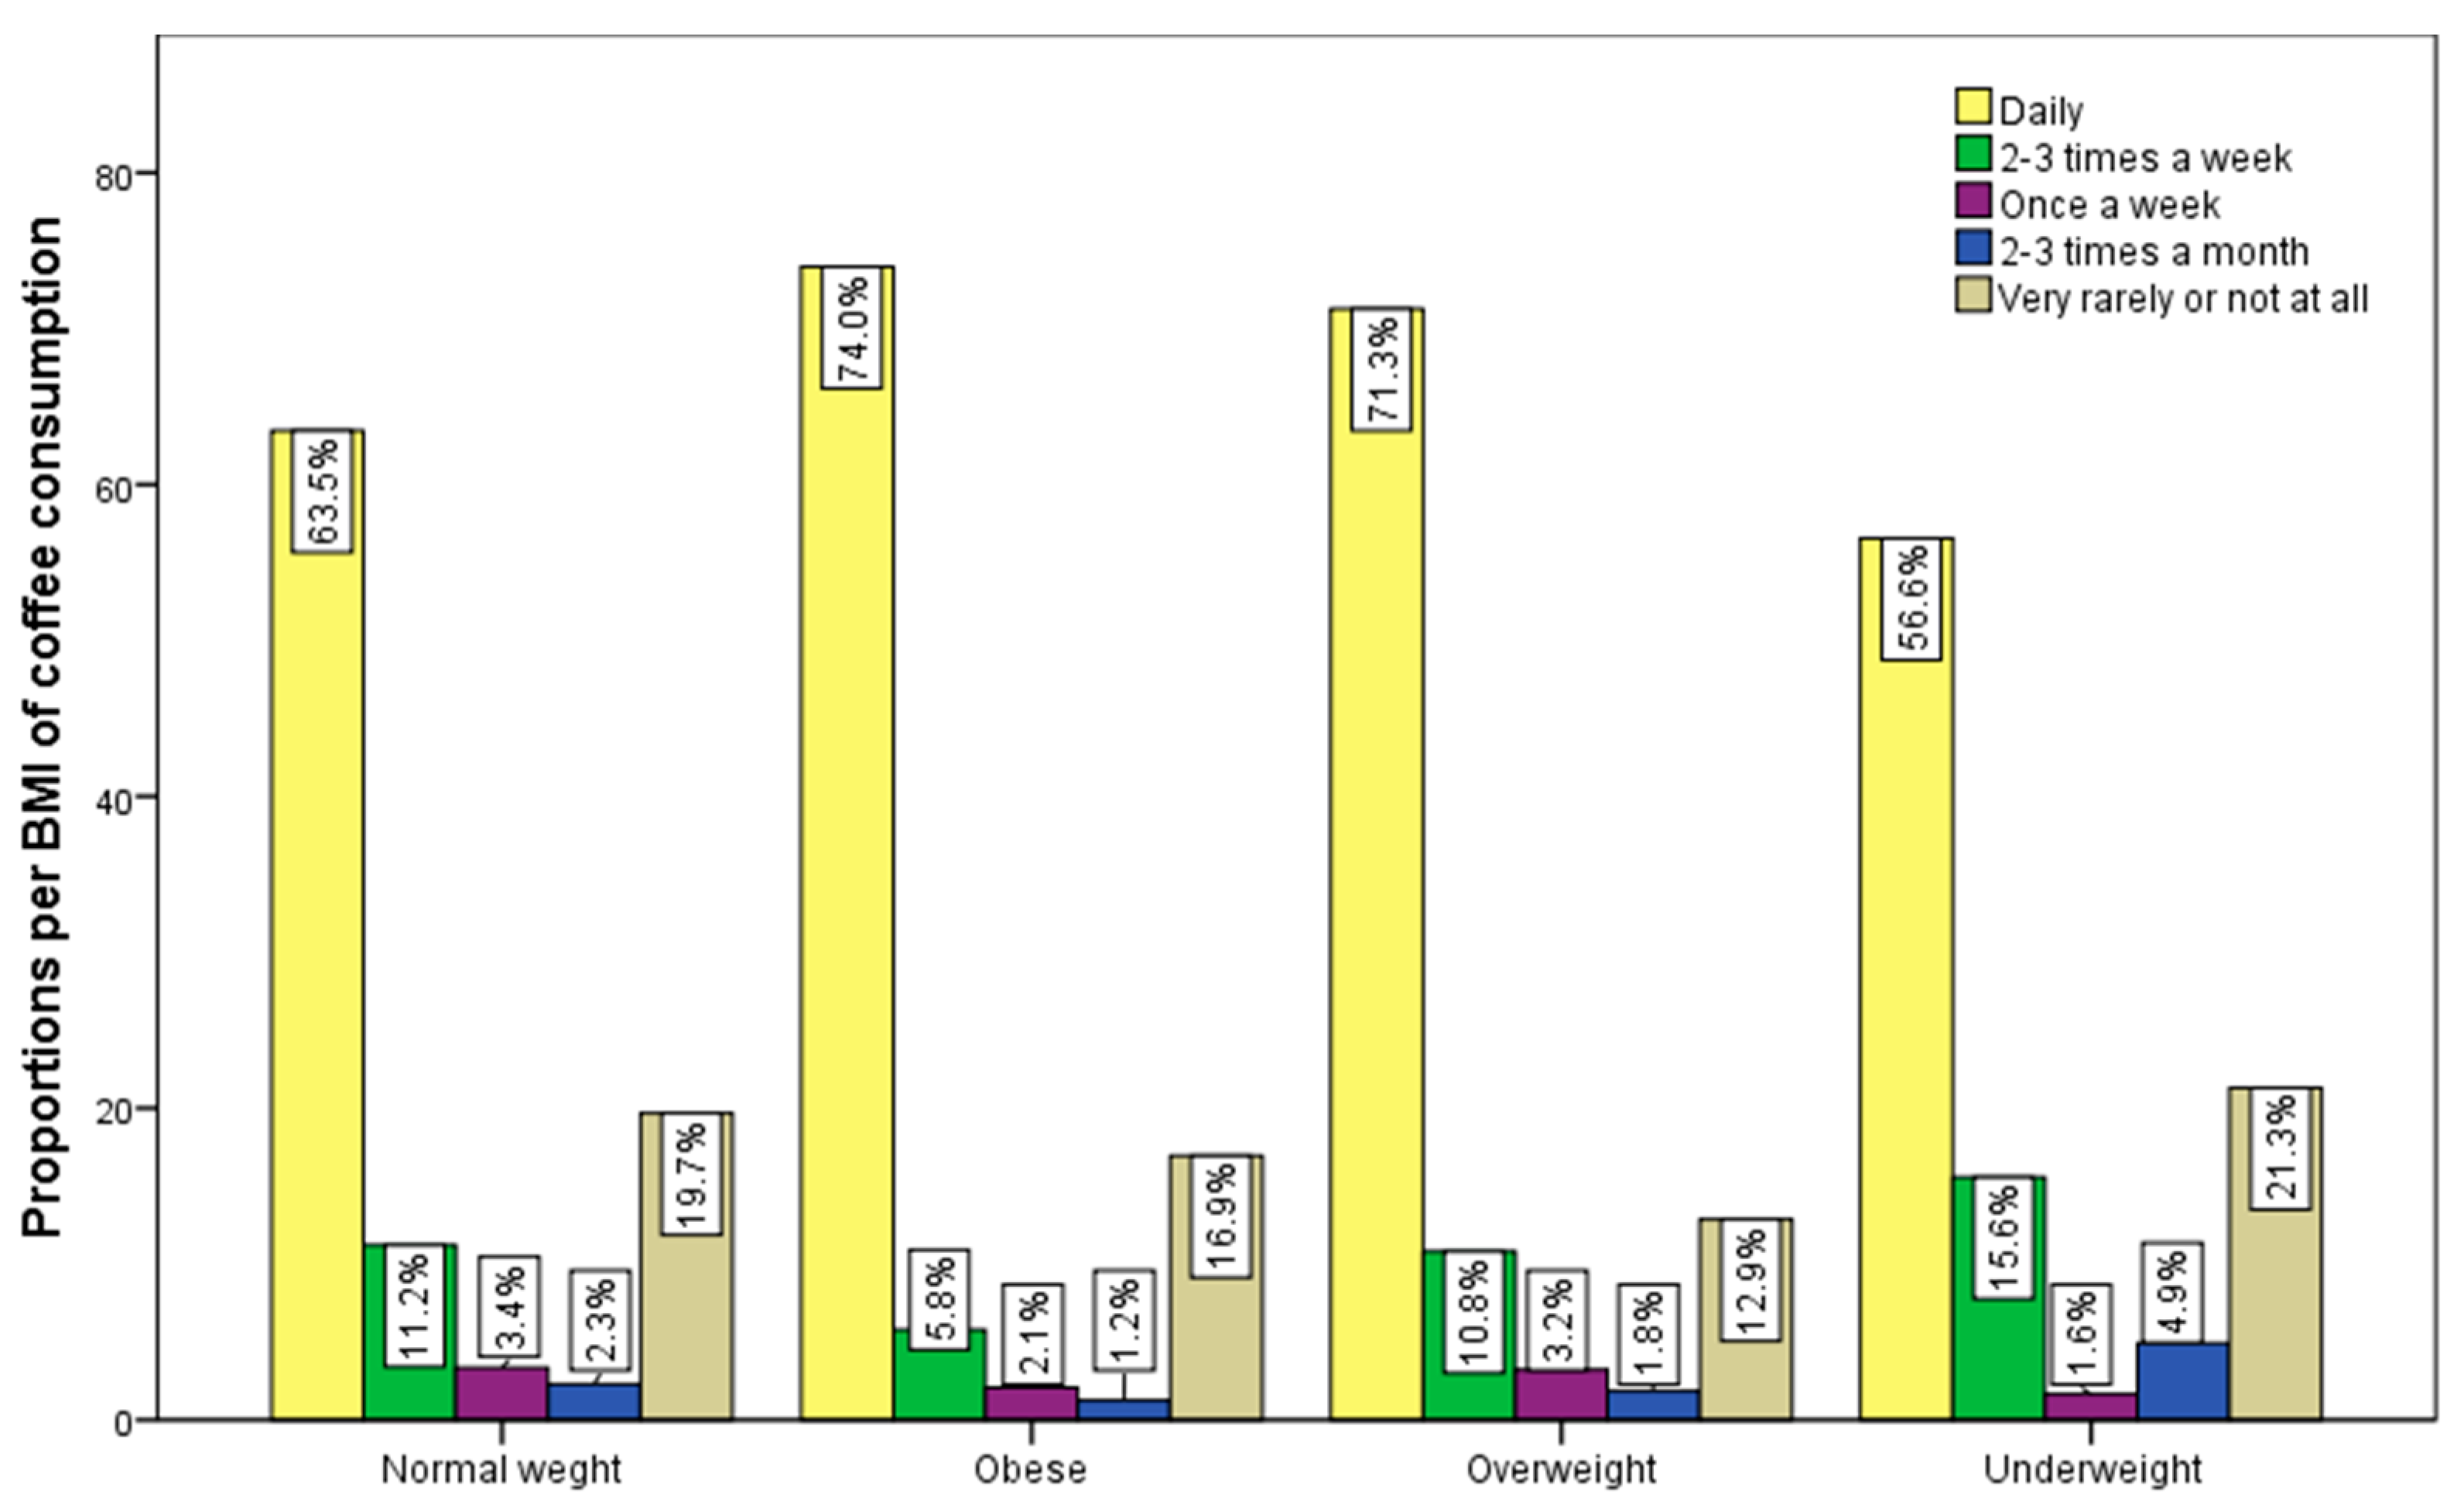
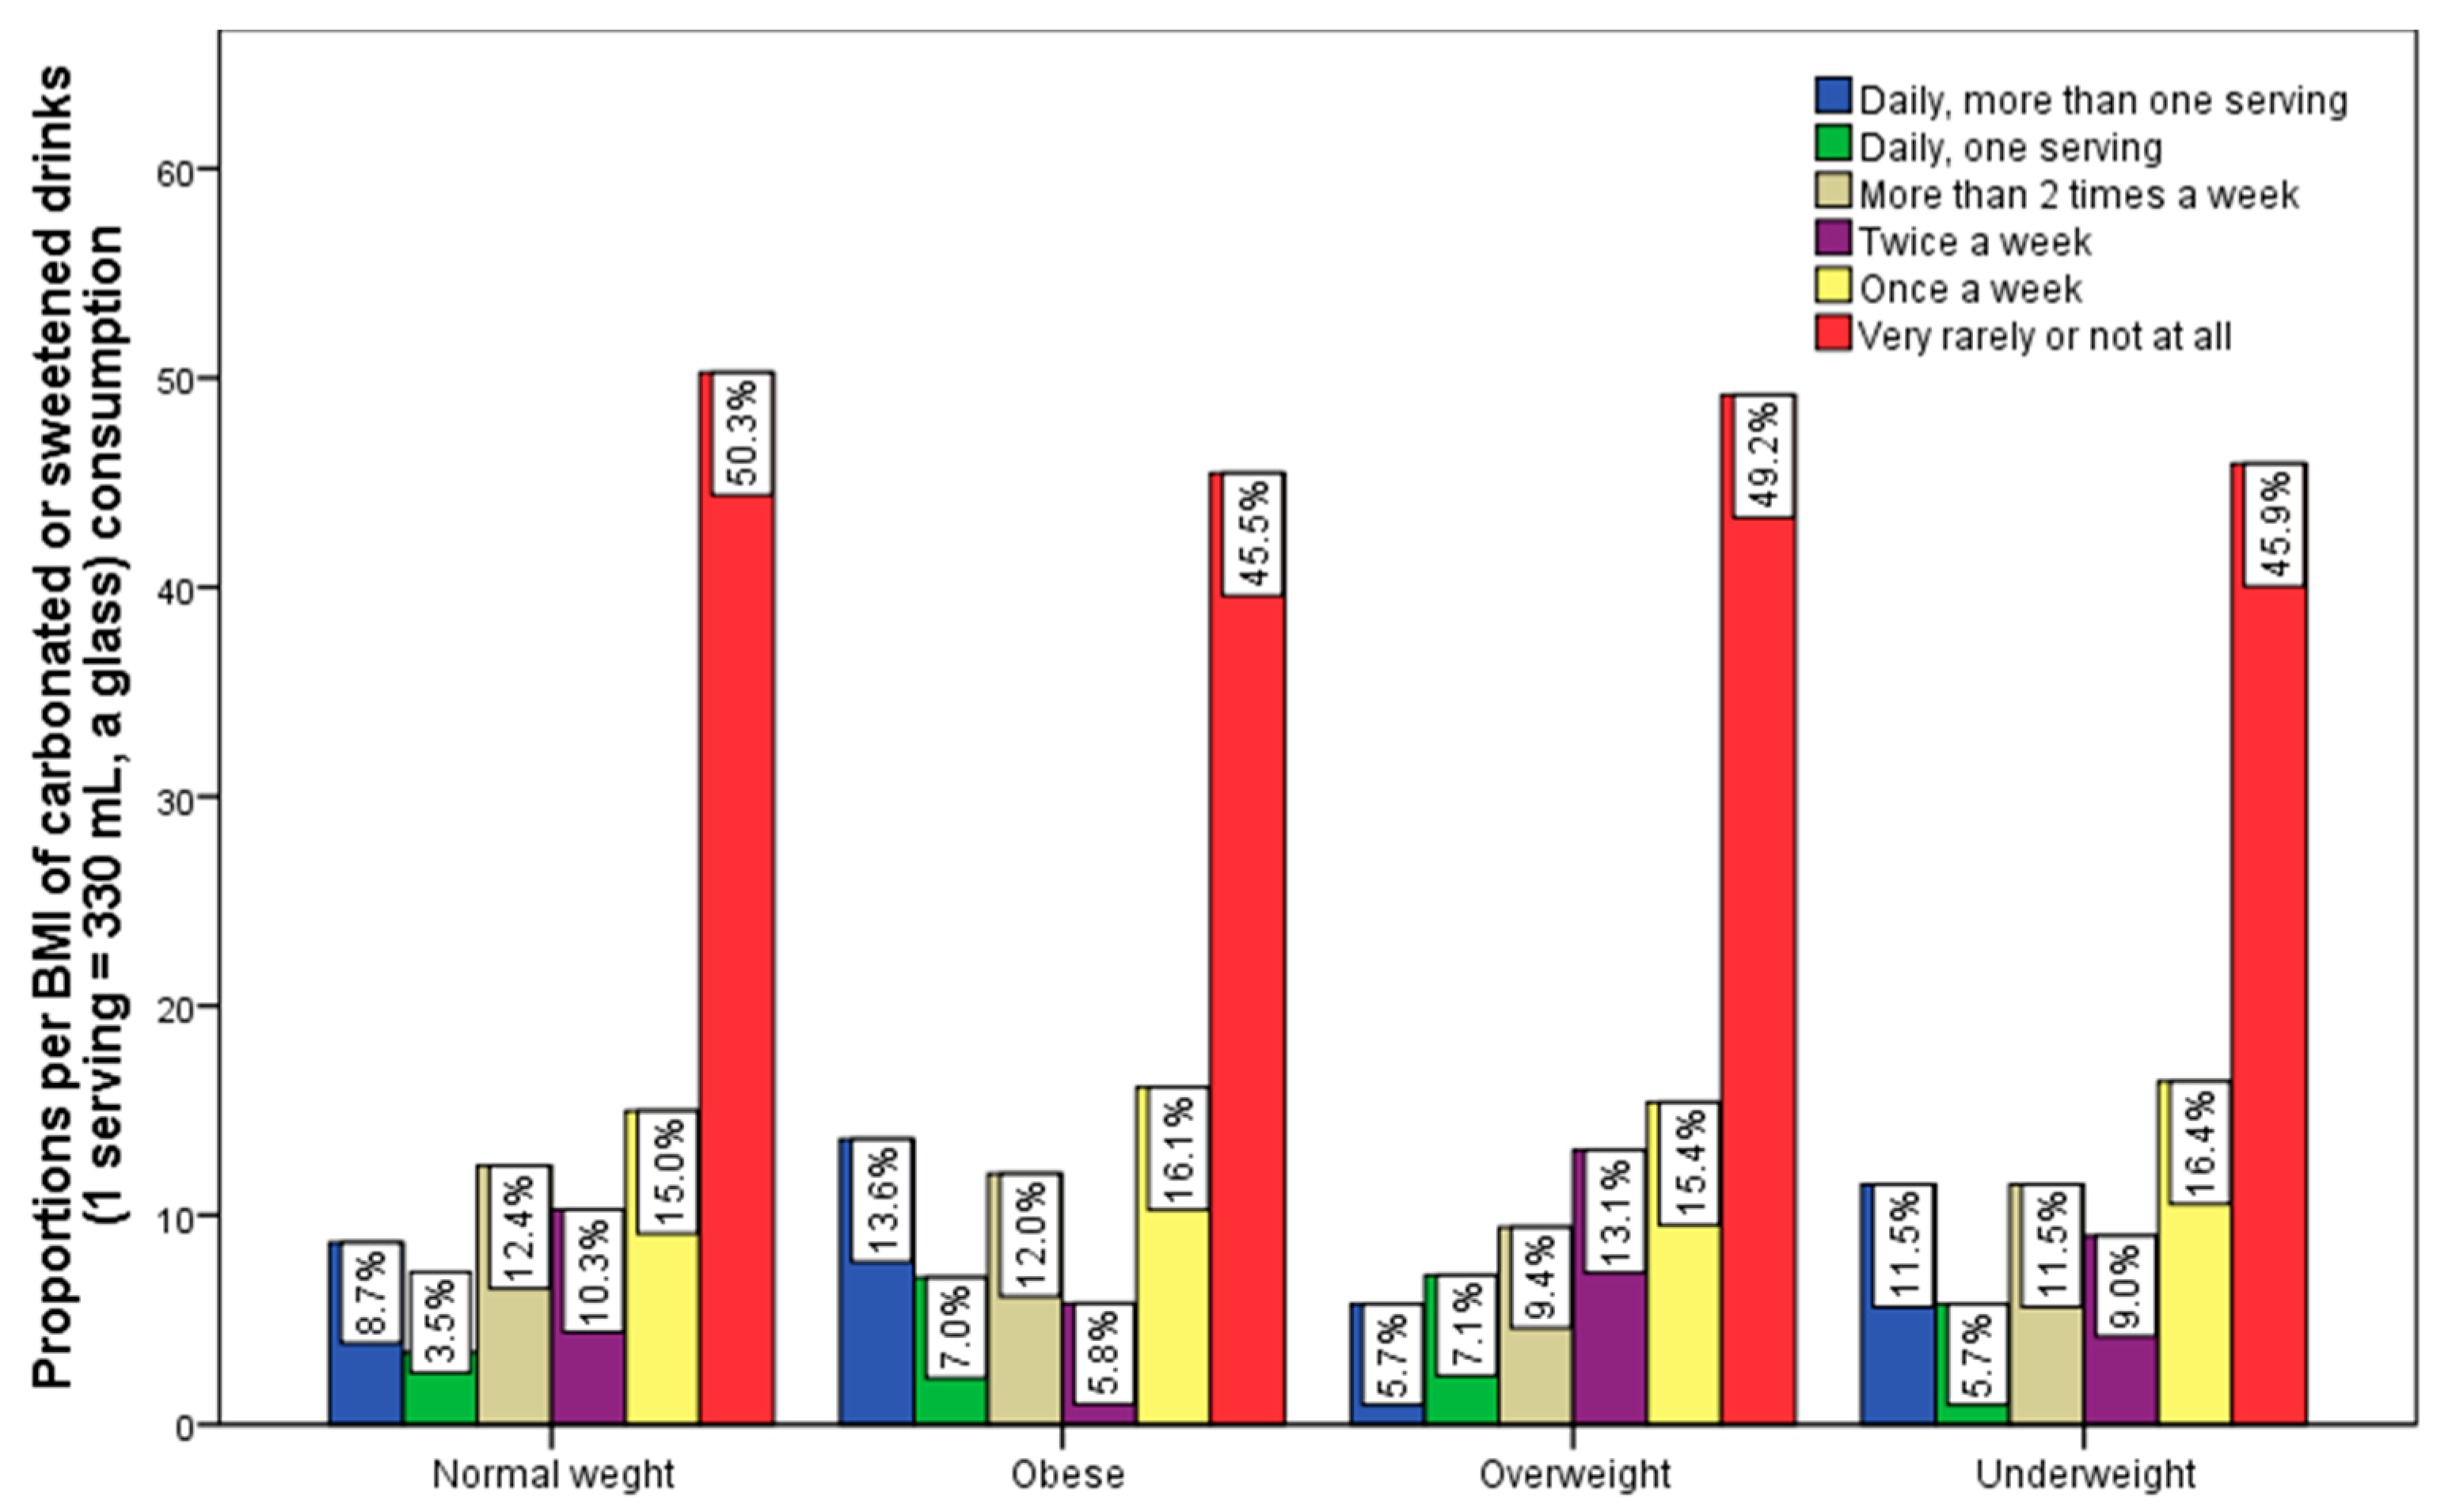
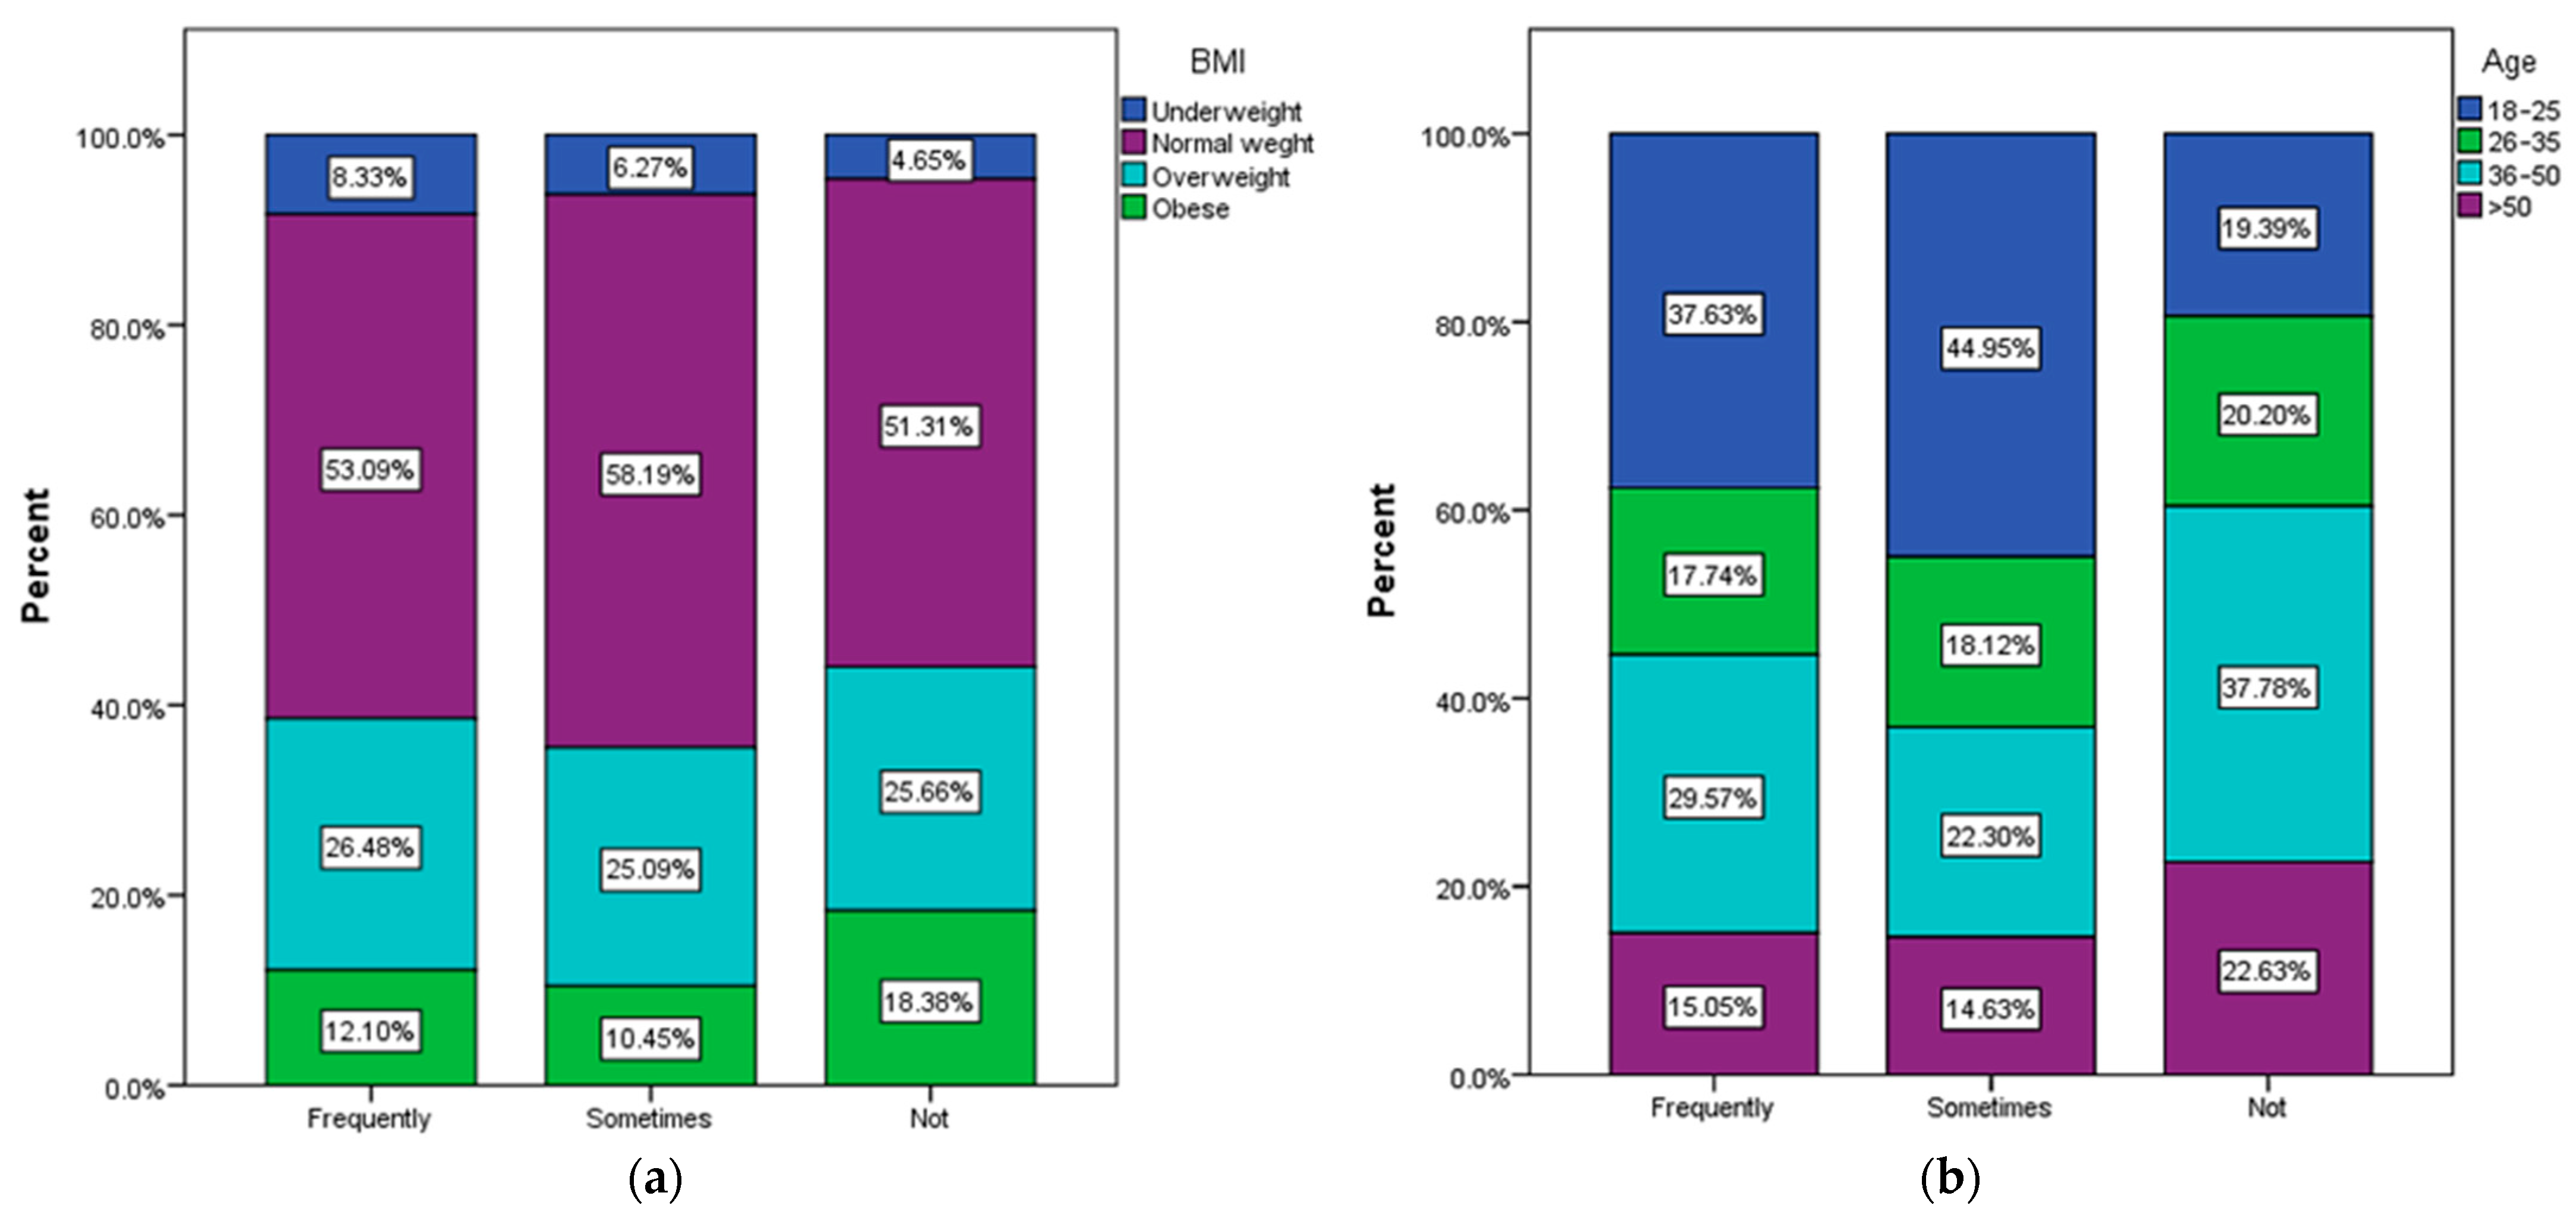
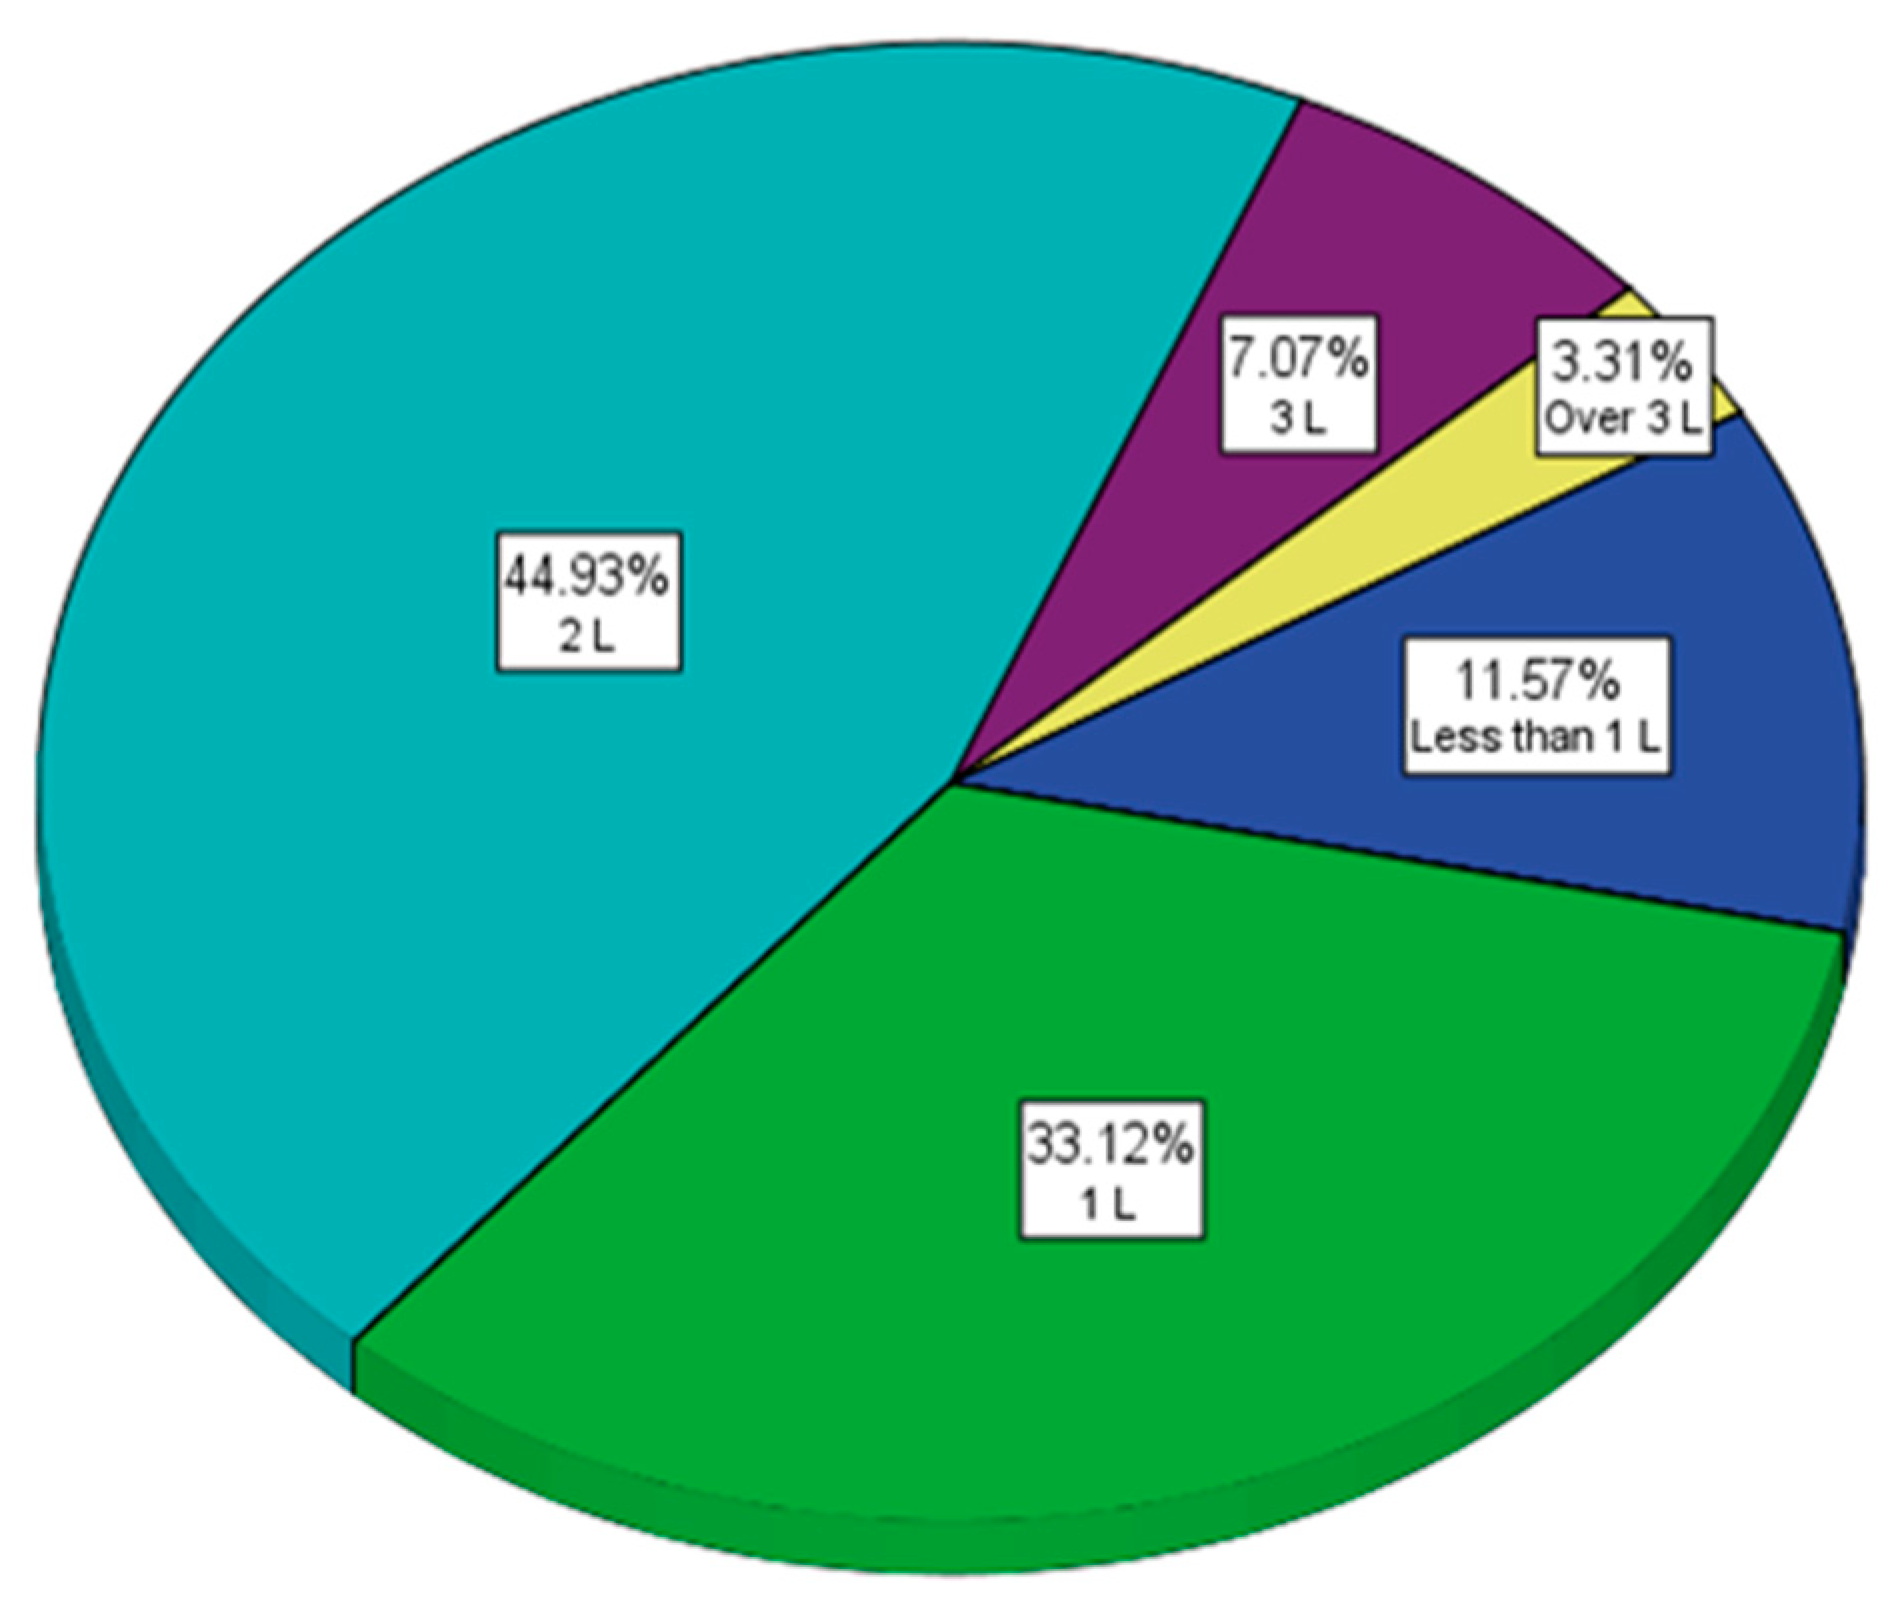
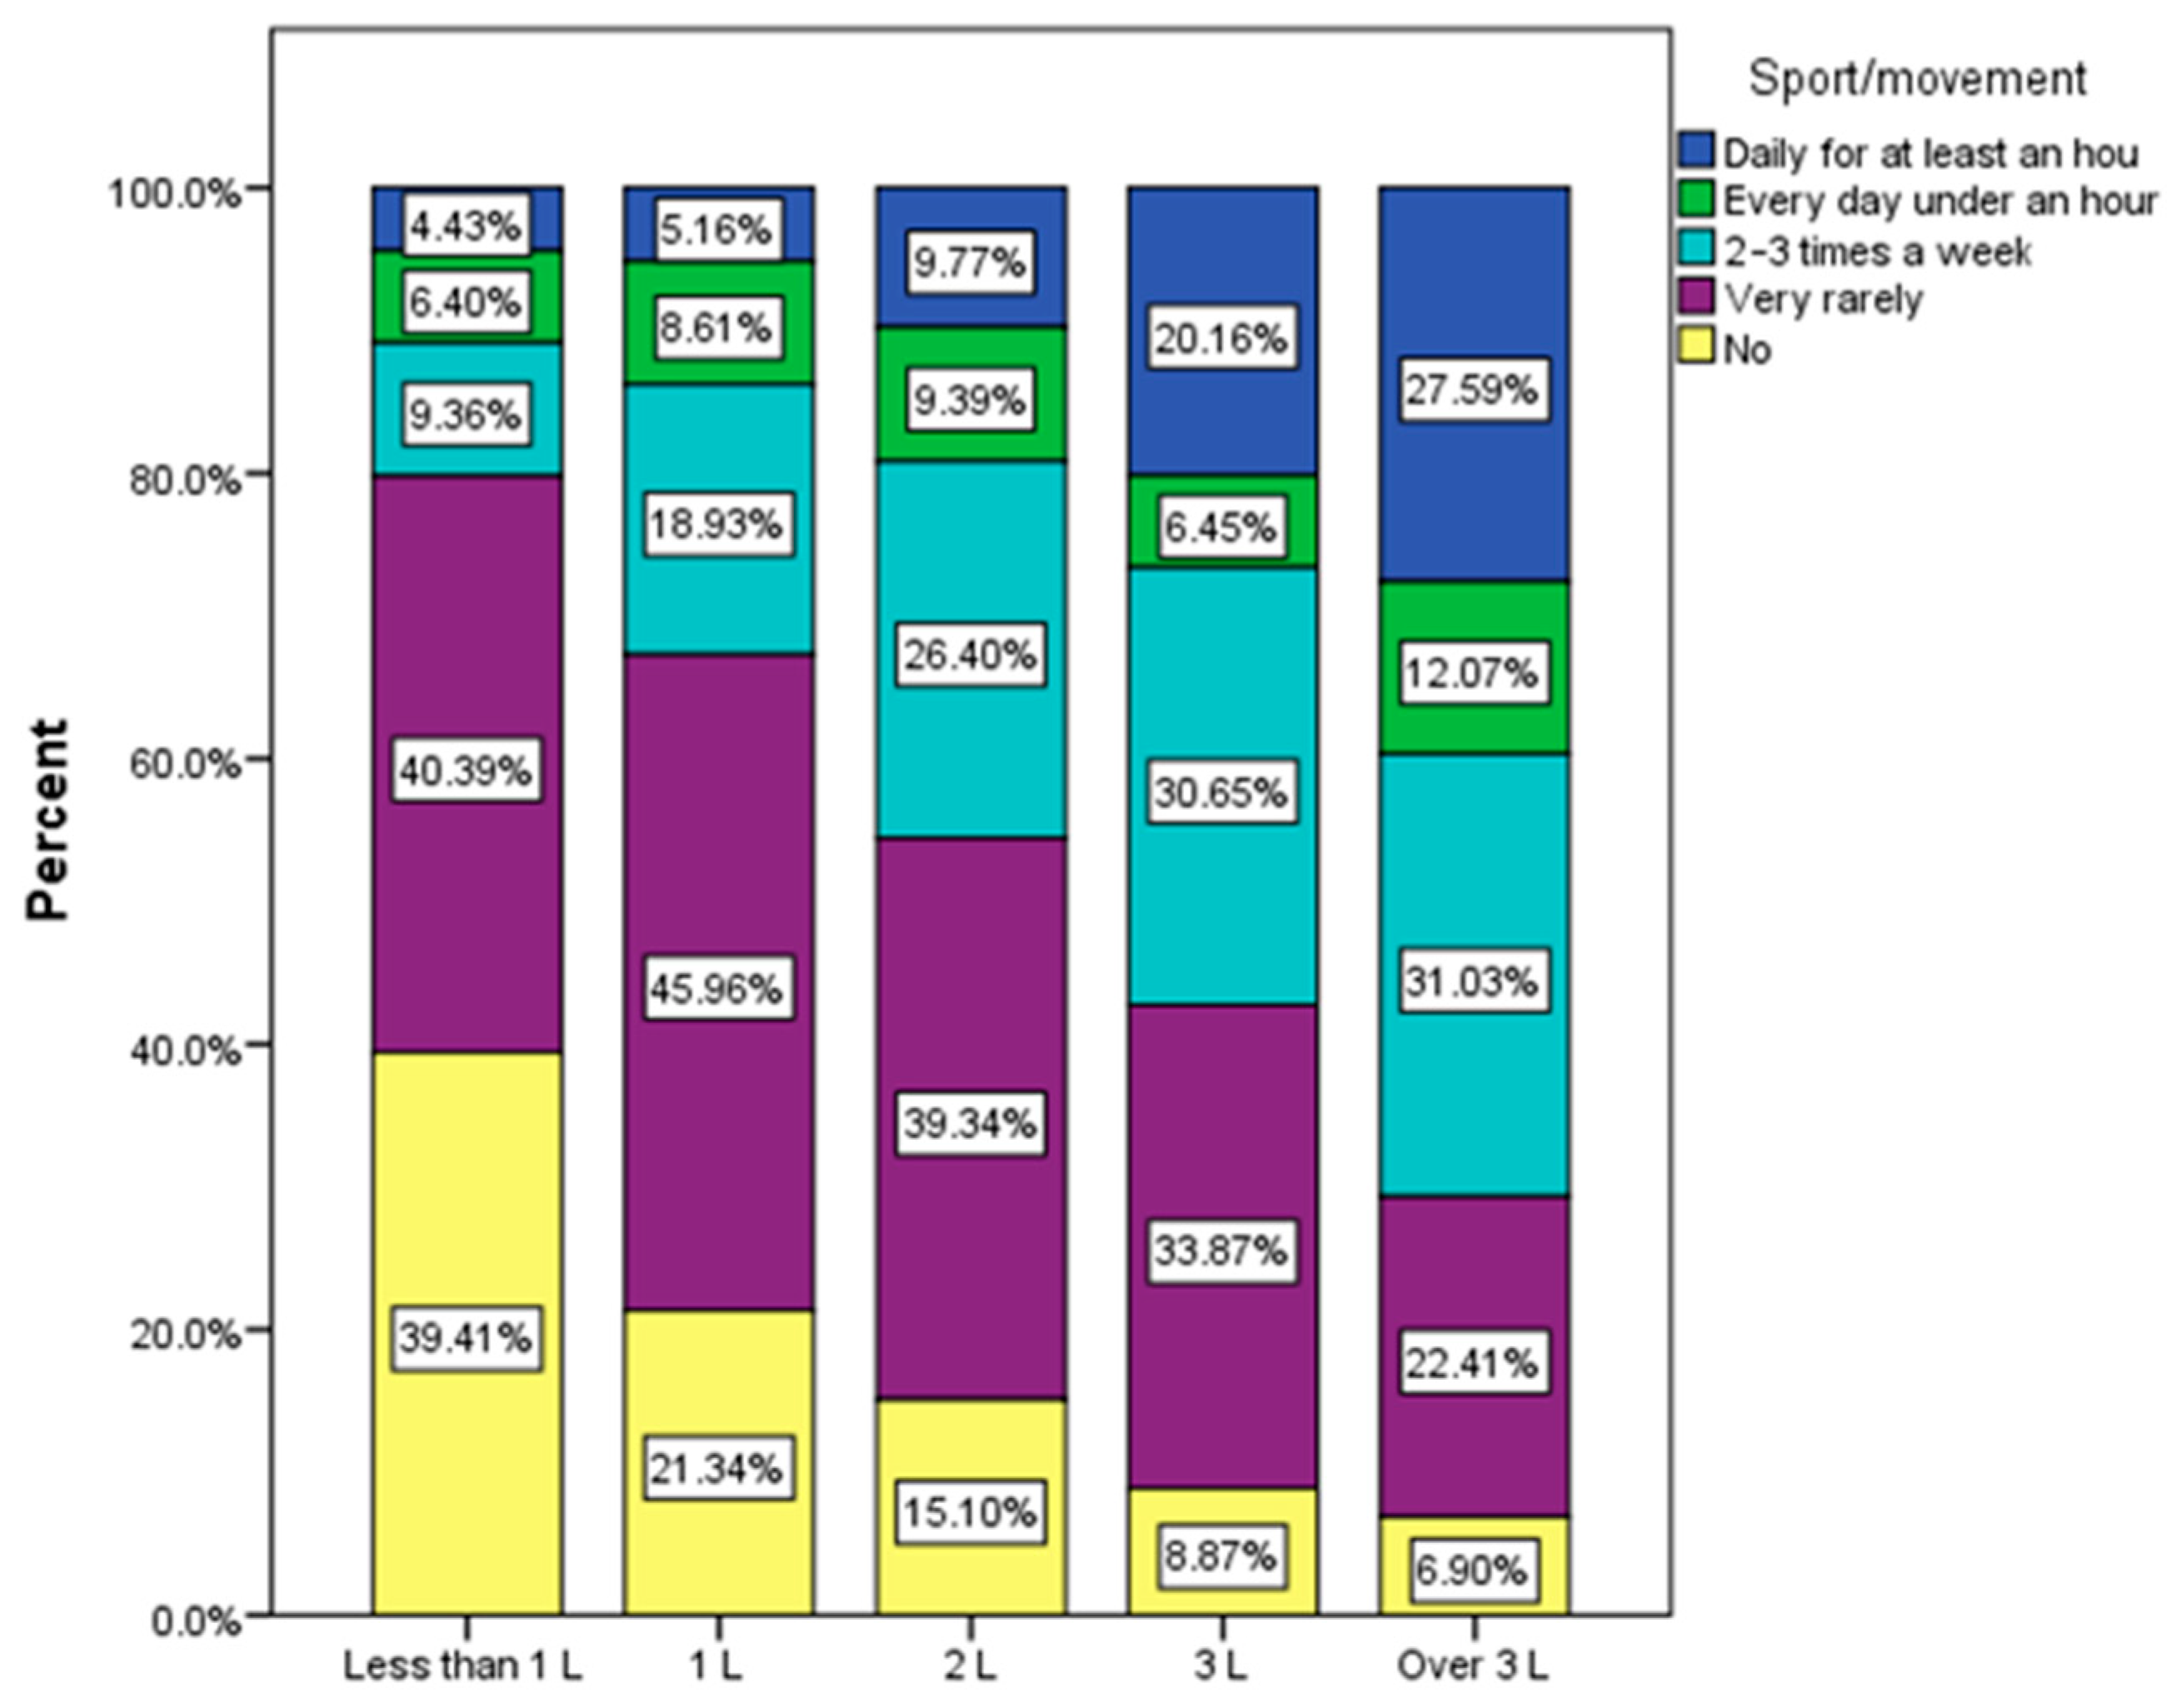
3.3. Frequency and Quantity of Soft Drinks Consumption
- -
- For coffee, black tea and green tea consumption “Rarely or not at all”, per day (reference group), “1 cup” per day, “2–3 cups” per day and “More than 3 cups” per day;
- -
- For Coca-Cola or Pepsi “Rarely or not at all”, per day (reference group), “up to 500 mL” per day, “up to 1 L” per day and “Over 1 L” per day;
- -
- For energy drinks “Rarely or not at all”, per day (reference group), “1 dose” per day, “2 doses” per day, “over 2 doses” per day.
4. Discussion
5. Conclusions
Author Contributions
Funding
Institutional Review Board Statement
Informed Consent Statement
Data Availability Statement
Conflicts of Interest
References
- Rejman, K.; Górska-Warsewicz, H.; Czeczotko, M.; Laskowski, W. Nonalcoholic Beverages as Sources of Nutrients in the Average Polish Diet. Nutrients 2020, 12, 1262. [Google Scholar] [CrossRef]
- Serrano Iglesias, M.; de Lourdes Samaniego Vaesken, M.; Varela Moreiras, G. Composition and Nutrient Information of Non-Alcoholic Beverages in the Spanish Market: An Update. Nutrients 2016, 8, 618. [Google Scholar] [CrossRef]
- Khaksar, G.; Assatarakul, K.; Sirikantaramas, S. Effect of cold-pressed and normal centrifugal juicing on quality attributes of fresh juices: Do cold-pressed juices harbor a superior nutritional quality and antioxidant capacity? Heliyon 2019, 5, e01917. [Google Scholar] [CrossRef] [PubMed]
- Gardner, P.T.; White, T.A.C.; McPhail, D.B.; Duthie, G.G. The relative contributions of vitamin C, carotenoids and phenolics to the antioxidant potential of fruit juices. Food Chem. 2000, 68, 471–474. [Google Scholar] [CrossRef]
- Mititelu, M.; Udeanu, D.I.; Nedelescu, M.; Neacsu, S.M.; Nicoară, A.C.; Oprea, E.; Ghica, M. Quality Control of Different Types of Honey and Propolis Collected from Romanian Accredited Beekeepers and Consumer’s Risk Assessment. Crystals 2022, 12, 87. [Google Scholar] [CrossRef]
- Mititelu, M.; Moroşan, E.; Neacsu, S.M.; Ioniţă, E.I. Research regarding the pollution degree from romanian Black Sea coast. Farmacia 2018, 66, 1059–1063. [Google Scholar] [CrossRef]
- Mititelu, M.; Nicolescu, T.O.; Ioniţă, C.A.; Nicolescu, F. Heavy Metals Analisys in Some Wild Edible Mushrooms. J. Environ. Prot. Ecol. 2012, 13, 875–879. [Google Scholar]
- Mititelu, M.; Stanciu, G.; Drăgănescu, D.; Ioniță, A.C.; Neacșu, S.M.; Dinu, M.; Stefanvan Staden, R.-I.; Moroșan, E. Mussel Shells, a Valuable Calcium Resource for the Pharmaceutical Industry. Mar. Drugs 2022, 20, 25. [Google Scholar] [CrossRef] [PubMed]
- Sikalidis, A.K.; Kelleher, A.H.; Maykish, A.; Kristo, A.S. Non-Alcoholic Beverages, Old and Novel, and Their Potential Effects on Human Health, with a Focus on Hydration and Cardiometabolic Health. Medicina 2020, 56, 490. [Google Scholar] [CrossRef]
- Kuriyama, S.; Shimazu, T.; Ohmori, K.; Kikuchi, N.; Nakaya, N.; Nishino, Y.; Tsubono, Y.; Tsuji, I. Green tea consumption and mortality due to cardiovascular disease, cancer, and all causes in Japan: The Ohsaki study. J. Am. Med. Assoc. 2006, 296, 1255–1265. [Google Scholar] [CrossRef] [PubMed]
- Huxley, R.; Lee, C.M.Y.; Barzi, F.; Timmermeister, L.; Czernichow, S.; Perkovic, V.; Grobbee, D.E.; Batty, D.; Woodward, M. Coffee, decaffeinated coffee, and tea consumption in relation to incident type 2 diabetes mellitus: A systematic review with meta-analysis. Arch. Intern. Med. 2009, 169, 2053–2063. [Google Scholar] [CrossRef]
- Tang, N.; Wu, Y.; Ma, J.; Wang, B.; Yu, R. Coffee consumption and risk of lung cancer: A meta-analysis. Lung Cancer 2010, 67, 17–22. [Google Scholar] [CrossRef] [PubMed]
- Available online: https://www.fda.gov/consumers/consumer-updates/spilling-beans-how-much-caffeine-too-much (accessed on 5 August 2023).
- Cappelletti, S.; Piacentino, D.; Sani, G.; Aromatario, M. Caffeine: Cognitive and physical performance enhancer or psychoactive drug? Curr. Neuropharmacol. 2015, 13, 71–88. [Google Scholar] [CrossRef] [PubMed]
- Rodak, K.; Kokot, I.; Kratz, E.M. Caffeine as a Factor Influencing the Functioning of the Human Body-Friend or Foe? Nutrients 2021, 13, 3088. [Google Scholar] [CrossRef]
- Malik, V.S.; Popkin, B.M.; Bray, G.A.; Després, J.P.; Hu, F.B. Sugar-sweetened beverages, obesity, type 2 diabetes mellitus, and cardiovascular disease risk. Circulation 2010, 121, 1356–1364. [Google Scholar] [CrossRef] [PubMed]
- Malik, V.S.; Pan, A.; Willett, W.C.; Hu, F.B. Sugar-sweetened beverages and weight gain in children and adults: A systematic review and meta-analysis. Am. J. Clin. Nutr. 2013, 98, 1084–1102. [Google Scholar] [CrossRef]
- Stern, D.; Mazariegos, M.; Ortiz-Panozo, E.; Campos, H.; Malik, V.S.; Lajous, M.; López-Ridaura, R. Sugar-Sweetened Soda Consumption Increases Diabetes Risk Among Mexican Women. J. Nutr. 2019, 149, 795–803. [Google Scholar] [CrossRef]
- Mekonnen, T.A.; Odden, M.C.; Coxson, P.G.; Guzman, D.; Lightwood, J.; Wang, Y.C.; Bibbins-Domingo, K. Health Benefits of Reducing Sugar-Sweetened Beverage Intake in High Risk Populations of California: Results from the Cardiovascular Disease (CVD) Policy Model. PLoS ONE 2013, 8, e81723. [Google Scholar] [CrossRef]
- Suez, J.; Korem, T.; Zeevi, D.; Zilberman-Schapira, G.; Thaiss, C.A.; Maza, O.; Israeli, D.; Zmora, N.; Gilad, S.; Weinberger, A.; et al. Artificial sweeteners induce glucose intolerance by altering the gut microbiota. Nature 2014, 514, 181–186. [Google Scholar] [CrossRef]
- Pearlman, M.; Obert, J.; Casey, L. The Association Between Artificial Sweeteners and Obesity. Curr. Gastroenterol. Rep. 2017, 19, 64. [Google Scholar] [CrossRef]
- Nettleton, J.A.; Lutsey, P.L.; Wang, Y.; Lima, J.A.; Michos, E.D.; Jacobs, D.R. Diet soda intake and risk of incident metabolic syndrome and type 2 diabetes in the multi-ethnic study of atherosclerosis (MESA). Diabetes Care 2009, 32, 688–694. [Google Scholar] [CrossRef] [PubMed]
- Alsunni, A.A. Energy Drink Consumption: Beneficial and Adverse Health Effects. Int. J. Health Sci. 2015, 9, 468–474. [Google Scholar] [CrossRef]
- Turner, S.; Ali, A.; Wham, C.; Rutherfurd-Markwick, K. Secondary School Students and Caffeine: Consumption Habits, Motivations, and Experiences. Nutrients 2023, 15, 1011. [Google Scholar] [CrossRef] [PubMed]
- Higgins, J.P.; Tuttle, T.D.; Higgins, C.L. Energy beverages: Content and safety. Mayo Clin. Proc. 2010, 85, 1033–1041. [Google Scholar] [CrossRef] [PubMed]
- De Sanctis, V.; Soliman, N.; Soliman, A.T.; Elsedfy, H.; Di Maio, S.; El Kholy, M.; Fiscina, B. Caffeinated energy drink consumption among adolescents and potential health consequences associated with their use: A significant public health hazard. Acta Biomed. 2017, 88, 222–231. [Google Scholar] [CrossRef]
- Arria, A.M.; Caldeira, K.M.; Kasperski, S.J.; Vincent, K.B.; Griffiths, R.R.; O’Grady, K.E. Energy drink consumption and increased risk for alcohol dependence. Alcohol. Clin. Exp. Res. 2011, 35, 365–375. [Google Scholar] [CrossRef]
- O’Brien, M.C.; McCoy, T.P.; Rhodes, S.D.; Wagoner, A.; Wolfson, M. Caffeinated cocktails: Energy drink consumption, high-risk drinking, and alcohol-related consequences among college students. Acad. Emerg. Med. 2008, 15, 453–460. [Google Scholar] [CrossRef]
- Scalese, M.; Denoth, F.; Siciliano, V.; Bastiani, L.; Cotichini, R.; Cutilli, A.; Molinaro, S. Energy Drink and Alcohol mixed Energy Drink use among high school adolescents: Association with risk taking behavior, social characteristics. Addict. Behav. 2017, 72, 93–99. [Google Scholar] [CrossRef]
- Droste, N.; Peacock, A.; Bruno, R.; Pennay, A.; Zinkiewicz, L.; Lubman, D.I.; Miller, P. Combined use of alcohol and energy drinks: Dose relationship with self-reported physiological stimulation and sedation side effects. Addict. Behav. 2017, 71, 68–74. [Google Scholar] [CrossRef]
- McKetin, R.; Coen, A.; Kaye, S. A comprehensive review of the effects of mixing caffeinated energy drinks with alcohol. Drug Alcohol. Depend. 2015, 151, 15–30. [Google Scholar] [CrossRef]
- Reid, S.D.; Gentius, J. Intensity of Energy Drink Use Plus Alcohol Predict Risky Health Behaviours among University Students in the Caribbean. Int. J. Environ. Res. Public. Health 2018, 15, 2429. [Google Scholar] [CrossRef]
- Emond, J.A.; Gilbert-Diamond, D.; Tanski, S.E.; Sargent, J.D. Energy drink consumption and the risk of alcohol use disorder among a national sample of adolescents and young adults. J. Pediatr. 2014, 165, 1194–1200. [Google Scholar] [CrossRef] [PubMed]
- WHO. WHO European Regional Obesity Report 2022; WHO Regional Office for Europe: Copenhagen, Denmark, 2022. Available online: https://apps.who.int/iris/bitstream/handle/10665/353747/9789289057738-eng.pdf (accessed on 1 August 2023).
- Romania|World Obesity Federation Global Obesity Observatory. Available online: https://data.worldobesity.org/country/romania-178/ (accessed on 6 August 2023).
- Pascu, B.M.; Miron, V.D.; Matei, E.R.; Craiu, M. Laboratory Findings in Children with Excess Body Weight in Romania. Medicina 2023, 59, 319. [Google Scholar] [CrossRef]
- ORDONANTA 16 15/07/2022—Portal Legislativ. Available online: https://legislatie.just.ro/Public/DetaliiDocument/257589 (accessed on 6 August 2023).
- Romania: Average Beverage Consumption by Type 2021|Statista. Available online: https://www.statista.com/statistics/1193424/romania-average-beverage-consumption-by-type/ (accessed on 6 August 2023).
- Lawshe, C.H. A quantitative approach to content validity. Pers. Psychol. 1975, 28, 563–575. [Google Scholar] [CrossRef]
- Yusoff, M.S.B. ABC of Content Validation and Content Validity Index Calculation. Educ. Med. J. 2019, 11, 49–54. [Google Scholar]
- Ioniță-Mîndrican, C.-B.; Mititelu, M.; Musuc, A.M.; Oprea, E.; Ziani, K.; Neacșu, S.M.; Grigore, N.D.; Negrei, C.; Dumi-trescu, D.-E.; Mireșan, H.; et al. Honey and Other Beekeeping Products Intake among the Romanian Population and Their Therapeutic Use. Appl. Sci. 2022, 12, 9649. [Google Scholar] [CrossRef]
- Năstăsescu, V.; Mititelu, M.; Stanciu, T.I.; Drăgănescu, D.; Grigore, N.D.; Udeanu, D.I.; Stanciu, G.; Neacșu, S.M.; Dinu-Pîrvu, C.E.; Oprea, E.; et al. Food Habits and Lifestyle of Romanians in the Context of the COVID-19 Pandemic. Nutrients 2022, 14, 504. [Google Scholar] [CrossRef] [PubMed]
- Ionus, E.; Bucur, L.A.; Lupu, C.E.; Gird, C.E. Evaluation of the chemical composition of Ajuga chamaepitys (L.) schreb. From the spontaneous flora of Romania. Farmacia 2021, 69, 461–466. [Google Scholar] [CrossRef]
- Leahu, A.; Lupu, E.C. Statistical simulation and prediction in software reliability. Analele Univ. Ovidius Constanta Ser. Mat. 2008, 16, 81–90. [Google Scholar]
- Suciu, F.; Stoicescu, I.; Lupu, E.C.; Musuc, A.M.; Popescu, A.; Mititelu, M.; Roșca, A.C.; Dumitrescu, D.-E.; Badea, F.C.; Caraiane, A.; et al. HPLC Analysis of Polyphenolic Compounds in Lysimachia nummularia L. and Comparative Determination of Antioxidant Capacity. Appl. Sci. 2023, 13, 2159. [Google Scholar] [CrossRef]
- Branca, F.; Nikogosian, H.; Lobstein, T. World Health Organization. Regional Office for Europe. In The Challenge of Obesity in the WHO European Region and the Strategies for Response; WHO Regional Office for Europe: Copenhagen, Denmark, 2007; ISBN 9789289014083. [Google Scholar]
- Ashwell, M.; Gibson, S. Waist-to-height ratio as an indicator of early health risk: Simpler and more predictive than us-ing a matrix based on BMI and waist circumference. BMJ Open 2016, 6, e010159. [Google Scholar] [CrossRef] [PubMed]
- Mititelu, M.; Stanciu, T.I.; Udeanu, D.I.; Popa, D.E.; Drăgănescu, D.; Cobelschi, C.; Grigore, N.D.; Pop, A.L.; Ghica, M. The impact of COVID-19 lockdown on the lifestyle and dietary patterns among romanian population. Farmacia 2021, 1, 1–11. [Google Scholar] [CrossRef]
- Ruxton, C.H.S.; Myers, M. Fruit Juices: Are They Helpful or Harmful? An Evidence Review. Nutrients 2021, 13, 1815. [Google Scholar] [CrossRef]
- Grosso, G.; Galvano, F.; Mistretta, A.; Marventano, S.; Nolfo, F.; Calabrese, G.; Buscemi, S.; Drago, F.; Veronesi, U.; Scuderi, A. Red Orange: Experimental Models and Epidemiological Evidence of Its Benefits on Human Health. Oxid. Med. Cell Longev. 2013, 2013, 157240. [Google Scholar] [CrossRef] [PubMed]
- FoodData Central. Available online: https://fdc.nal.usda.gov/fdc-app.html#/food-details/175093/nutrients (accessed on 6 August 2023).
- Coca-Cola® Original|Coca-Cola®. Available online: https://us.coca-cola.com/products/coca-cola/original# (accessed on 6 August 2023).
- Coca-Cola® Caffeine Free|Coca-Cola®. Available online: https://us.coca-cola.com/products/coca-cola/caffeine-free (accessed on 6 August 2023).
- Coca-Cola® Zero Sugar|Coca-Cola®. Available online: https://us.coca-cola.com/products/coca-cola-zero-sugar/coca-cola-zero-sugar# (accessed on 6 August 2023).
- Pepsi MAX—Ingredients & Nutritional Information. Available online: https://www.pepsi.co.uk/products/pepsi-max (accessed on 6 August 2023).
- Pepsi Diet—Ingredients & Nutritional Information. Available online: https://www.pepsi.co.uk/products/pepsi-diet (accessed on 6 August 2023).
- Pepsi—Ingredients & Nutritional Information. Available online: https://www.pepsi.co.uk/products/pepsi (accessed on 6 August 2023).
- FoodData Central. Available online: https://fdc.nal.usda.gov/fdc-app.html#/food-details/173206/nutrients (accessed on 6 August 2023).
- Orange|Fanta®. Available online: https://www.fanta.com/products/orange# (accessed on 6 August 2023).
- FoodData Central. Available online: https://fdc.nal.usda.gov/fdc-app.html#/food-details/173210/nutrients (accessed on 6 August 2023).
- FoodData Central. Available online: https://fdc.nal.usda.gov/fdc-app.html#/food-details/171935/nutrients (accessed on 6 August 2023).
- FoodData Central. Available online: https://fdc.nal.usda.gov/fdc-app.html#/food-details/1104559/nutrients (accessed on 6 August 2023).
- FoodData Central. Available online: https://fdc.nal.usda.gov/fdc-app.html#/food-details/495178/nutrients (accessed on 6 August 2023).
- FoodData Central. Available online: https://fdc.nal.usda.gov/fdc-app.html#/food-details/764018/nutrients (accessed on 6 August 2023).
- Miller, C.; Ettridge, K.; Wakefield, M.; Pettigrew, S.; Coveney, J.; Roder, D.; Durkin, S.; Wittert, G.; Martin, J.; Dono, J. Consumption of Sugar-Sweetened Beverages, Juice, Artificially-Sweetened Soda and Bottled Water: An Australian Population Study. Nutrients 2020, 12, 817. [Google Scholar] [CrossRef] [PubMed]
- Khalid, S. Association of Unhealthy Food Practices with Nutritional Status of Adolescents. Biomed. J. Sci. Tech. Res. 2021, 33, 25766–25778. [Google Scholar] [CrossRef]
- Denney-Wilson, E.; Crawford, D.; Dobbins, T.; Hardy, L.; Okely DEd, A.D. Influences on Consumption of Soft Drinks and Fast Foods in Adolescents. Asia Pac. J. Clin. Nutr. 2009, 18, 447–452. [Google Scholar]
- Gamal, N.; Abourabia, N.M.; Elebiary, F.H.; Khalaf, G.; Raafat, M.H.; Ibrahim, S.H.; Omar, S.M.M.; Ibrahim, G.A.; Omar, A.E. The Effect of Diet Carbonated Drinks and Monosodium Glutamate on the Cerebellar Cortex and the Kidney of Adult Male Albino Rats. Histological and Immuno-Histochemical Study. QJM Int. J. Med. 2020, 113, hcaa051-002. [Google Scholar] [CrossRef]
- Niaz, K.; Zaplatic, E.; Spoor, J. Extensive Use of Monosodium Glutamate: A Threat to Public Health? EXCLI J. 2018, 17, 273. [Google Scholar] [CrossRef]
- Hanover, L.M.; White, J.S. Manufacturing, Composition, and Applications of Fructose. Am. J. Clin. Nutr. 1993, 58, S724–S732. [Google Scholar] [CrossRef]
- Ng, S.W.; Slining, M.M.; Popkin, B.M. Use of Caloric and Non-Caloric Sweeteners in US Consumer Packaged Foods 2005–2009. J. Acad. Nutr. Diet 2012, 112, 1828. [Google Scholar] [CrossRef] [PubMed]
- Silva, P.D.; Cruz, R.; Casal, S. Sugars and Artificial Sweeteners in Soft Drinks: A Decade of Evolution in Portugal. Food Control. 2021, 120, 107481. [Google Scholar] [CrossRef]
- Das, A.; Chakraborty, R. Sweeteners: Classification, Sensory and Health Effects. Encycl. Food Health 2016, 234–240. [Google Scholar] [CrossRef]
- Peteliuk, V.; Rybchuk, L.; Bayliak, M.; Storey, K.B.; Lushchak, O. Natural Sweetener Stevia Rebaudiana: Functionalities, Health Benefits and Potential Risks. EXCLI J. 2021, 20, 1412. [Google Scholar] [CrossRef]
- Farid, A.; Hesham, M.; El-Dewak, M.; Amin, A. The Hidden Hazardous Effects of Stevia and Sucralose Consumption in Male and Female Albino Mice in Comparison to Sucrose. Saudi Pharm. J. 2020, 28, 1290–1300. [Google Scholar] [CrossRef] [PubMed]
- Malik, V.S.; Li, Y.; Pan, A.; De Koning, L.; Schernhammer, E.; Willett, W.C.; Hu, F.B. Long-Term Consumption of Sugar-Sweetened and Artificially Sweetened Beverages and Risk of Mortality in US Adults. Circulation 2019, 139, 2113–2125. [Google Scholar] [CrossRef] [PubMed]
- Yin, J.; Zhu, Y.; Malik, V.; Li, X.; Peng, X.; Zhang, F.F.; Shan, Z.; Liu, L. Intake of Sugar-Sweetened and Low-Calorie Sweetened Beverages and Risk of Cardiovascular Disease: A Meta-Analysis and Systematic Review. Adv. Nutr. 2021, 12, 89–101. [Google Scholar] [CrossRef]
- Imamura, F.; O’Connor, L.; Ye, Z.; Mursu, J.; Hayashino, Y.; Bhupathiraju, S.N.; Forouhi, N.G. Consumption of Sugar Sweetened Beverages, Artificially Sweetened Beverages, and Fruit Juice and Incidence of Type 2 Diabetes: Systematic Review, Meta-Analysis, and Estimation of Population Attributable Fraction. Br. J. Sports Med. 2016, 50, 496–504. [Google Scholar] [CrossRef]
- Deshpande, A.D.; Harris-Hayes, M.; Schootman, M. Epidemiology of Diabetes and Diabetes-Related Complications. Phys. Ther. 2008, 88, 1254. [Google Scholar] [CrossRef]
- Jequier, E.; Constant, F. Water as an essential nutrient: The physiological basis of hydration. Eur. J. Nutr. 2010, 64, 115–123. [Google Scholar] [CrossRef]
- Nakamura, Y.; Watanabe, H.; Tanaka, A.; Yasui, M.; Nishihira, J.; Murayama, N. Effect of Increased Daily Water Intake and Hydration on Health in Japanese Adults. Nutrients 2020, 12, 1191. [Google Scholar] [CrossRef]
- Benton, D.; Burgess, N. The effect of the consumption of water on the memory and attention of children. Appetite 2009, 53, 143–146. [Google Scholar] [CrossRef] [PubMed]
- Mullane, S.L.; Buman, M.P.; Zeigler, Z.S.; Crespo, N.C.; Gaesser, G.A. Acute effects on cognitive performance following bouts of standing and light-intensity physical activity in a simulated workplace environment. J. Sci. Med. Sport. 2017, 20, 489–493. [Google Scholar] [CrossRef]
- Jakicic, J.M.; Rogers, R.J.; Davis, K.K.; Collins, K.A. Role of physical activity and exercise in treating patients with overweight and obesity. Clin. Chem. 2018, 64, 99–107. [Google Scholar] [CrossRef] [PubMed]
- Park, J.H.; Moon, J.H.; Kim, H.J.; Kong, M.H.; Oh, Y.H. Sedentary Lifestyle: Overview of Updated Evidence of Potential Health Risks. Korean J. Fam. Med. 2020, 41, 365–373. [Google Scholar] [CrossRef] [PubMed]
- Rees-Punia, E.; Evans, E.M.; Schmidt, M.D.; Gay, J.L.; Matthews, C.E.; Gapstur, S.M.; Patel, A.V. Mortality Risk Reductions for Replacing Sedentary Time With Physical Activities. Am. J. Prev. Med. 2019, 56, 736–741. [Google Scholar] [CrossRef] [PubMed]



| Total Population n (%) | Male n (%) | Female n (%) | |
|---|---|---|---|
| 1754 (100) | 327 (18.6) | 1424 (81.4) | |
| Age (years) | p < 0.0001 | ||
| 18–25 | 613 (34.9) | 158 (48.3) | 455 (31.9) |
| 26–35 | 341 (19.4) | 50 (15.3) | 291 (20.4) |
| 36–50 | 513 (29.2) | 73 (22.3) | 440 (30.8) |
| >50 | 287 (16.4) | 46 (14.1) | 241 (16.9) |
| Residence areas | p = 0.673 | ||
| Urban areas | 1409 (80.3) | 268 (82.0) | 1141 (80.0) |
| Rural areas | 166 (19.7) | 59 (18.00) | 286 (20.0) |
| Level of education | p < 0.0001 | ||
| General/primary studies | 166 (9.5) | 49 (15.0) | 117 (8.2) |
| Secondary education (baccalaureate degree) | 375 (21.4) | 80 (24.5) | 295 (20.7) |
| Post-secondary studies | 146 (8.3) | 15 (4.6) | 131 (9.2) |
| Higher education (bachelor’s degree) | 596 (34.0) | 115 (35.2) | 481 (33.7) |
| Postgraduate studies (master’s degree, residency, doctorate, other specializations) | 471 (26.9) | 68 (20.8) | 403 (28.2) |
| Employment status | p < 0.0001 | ||
| Unemployed | 23 (1.3) | 7 (2.1) | 16 (1.1) |
| Socially assisted | 2 (0.1) | 0 (0.0) | 2 (0.1) |
| Householder | 91 (5.2) | 5 (1.5) | 86 (6.0) |
| Retired | 90 (5.1) | 21 (6.4) | 69 (4.8) |
| Student | 577 (32.9) | 138 (42.2) | 439 (30.8) |
| Teleworking | 47 (2.7) | 9 (2.8) | 38 (2.7) |
| I go to work every day | 767 (43.7) | 106 (32.4) | 661 (46.3) |
| I work in a mixed regime (telework and commuting) | 157 (9.0) | 41 (12.5) | 116 (8.1) |
| Body mass index (BMI) | p < 0.0001 | ||
| Underweight category (<18.5) | 122 (7.0) | 5 (1.5) | 117 (8.2) |
| Normal weight (18.5–24.9) | 955 (54.4) | 143 (43.7) | 812 (56.9) |
| Overweight category (25–29.9) | 435 (24.8) | 118 (36.1) | 317 (22.2) |
| Obese (≥30) | 242 (13.8) | 61 (18.7) | 181 (12.7) |
| The Type of Drink | Calories per Serving | Total Carbohydrate Content | Sweeteners | Reference |
|---|---|---|---|---|
| Fresh orange | 41 kcal (100 mL) | 9.1 g | Natural carbohydrates | [49] |
| Fresh red orange | 34 kcal (100 mL) | 9.4 g | Natural carbohydrates | [50] |
| Coca-Cola | 37 kcal (100 mL) | 9.56 g | High fructose corn syrup, Sugars, Natural Flavors | [51,52] |
| Coca-Cola Caffeine Free | 140 kcal (354 mL/12 fl oz) | 39 g | High fructose corn syrup, Sugars, Natural Flavors | [53] |
| Coca-Cola Zero Sugar | 0 kcal (221 mL/7.5 fl oz) | 0 g | Aspartam, Acesulfame, Natural Flavors | [54] |
| Pepsi Max | 0.4 kcal (100 mL) | 0 g | Aspartame, Acesulfame K | [55] |
| Diet Pepsi | 0.6 kcal (100 mL) | 0 g | Aspartame, Acesulfame K | [56] |
| Pepsi | 18 kcal (100 mL) | 4.6 g | Acesulfame K, Sucralose, Sugars | [57] |
| Sprite | 40 kcal (100 mL) | 10.1 g | Sugars | [58] |
| Fanta Orange | 100 kcal (221 mL/7.5 fl oz) | 28 g | High fructose corn syrup, Sugars | [59] |
| Red Bull | 43 kcal (100 mL) | 10.2 g | Sugars, Natural and Artificial Flavors | [60] |
| Monster | 47 kcal (100 mL) | 11.3 g | Acesulfame K, Sucralose, Sugars | [61] |
| Gatorade G | 26 kcal (100 mL) | 6.43 g | Sugars, Natural and Artificial Flavors | [62] |
| Prigat Grapefruit | 38 kcal (100 mL) | 9.17g | Aspartame, Sugars | [63] |
| Lipton Iced Tea Peach | 19 kcal (100 mL) | 5.01 g | High fructose corn syrup, Acesulfame K Sucralose | [64] |
| Frequency of Soft-Drinks Consumption | Age | Gender | ||||||||||
|---|---|---|---|---|---|---|---|---|---|---|---|---|
| 18–25 | 26–35 | 36–50 | >50 | Female | Male | |||||||
| n | (%) | n | (%) | n | (%) | n | (%) | n | (%) | n | (%) | |
| (A) | (B) | (C) | (D) | (A) | (B) | |||||||
| Coffee | χ2 = 278.84, p < 0.0001 | χ2 = 34.12, p < 0.0001 | ||||||||||
| Daily | 269 | 43.9% | 220 A | 64.5% | 430 A,B | 83.8% | 245 A,B | 85.4% | 992 B | 69.5% | 172 | 52.6% |
| 2–3 times a week | 132 B,C,D | 21.5% | 26 D | 7.6% | 21 | 4.1% | 8 | 2.8% | 138 | 9.7% | 49 A | 15.0% |
| Once a week | 32 C | 5.2% | 12 | 3.5% | 4 | 0.8% | 5 | 1.7% | 39 | 2.7% | 14 | 4.3% |
| 2–3 times a month | 34 | 11.8% | 137 | 22.3% | 63 | 18.5% | 78 | 15.2% | 29 | 2.0% | 10 | 3.1% |
| Very rarely or not at all | 27 C,D | 9.4% | 158 C,D | 25.8% | 74 | 21.7% | 52 | 10.1% | 229 | 16.0% | 82 A | 25.1% |
| Coca-Cola or Pepsi (or other variants) | χ2 = 195.03, p < 0.0001 | χ2 = 40.44, p < 0.0001 | ||||||||||
| Daily | 56 D | 9.1% | 36 D | 10.6% | 47 D | 9.2% | 5 | 1.7% | 110 | 7.7% | 34 | 10.4% |
| 2–3 times a week | 120 C,D | 19.6% | 50 | 14.7% | 46 | 9.0% | 16 | 5.6% | 159 | 11.1% | 73 A | 22.3% |
| Once a week | 102 D | 16.6% | 48 D | 14.1% | 61 D | 11.9% | 8 | 2.8% | 174 | 12.2% | 45 | 13.8% |
| 2–3 times a month | 137 C,D | 22.3% | 63 D | 18.5% | 78 | 15.2% | 34 | 11.8% | 255 | 17.9% | 57 | 17.4% |
| Very rarely or not at all | 198 | 32.3% | 144A | 42.2% | 281D | 54.8% | 224 A,B,C | 78.0% | 729 B | 51.1% | 118 | 36.1% |
| Energy drinks | χ2 = 155.4, p < 0.0001 | χ2 = 28.23, p < 0.0001 | ||||||||||
| Daily | 19 D | 3.1% | 7 | 2.1% | 4 | 0.8% | 1 | 0.3% | 21 | 1.5% | 10 | 3.1% |
| 2–3 times a week | 58 B,C,D | 9.5% | 6 | 1.8% | 9 | 1.8% | 1 | 0.3% | 50 | 3.5% | 24 A | 7.3% |
| Once a week | 35 C,D | 5.7% | 8 | 2.3% | 12 | 2.3% | 2 | 0.7% | 41 | 2.9% | 16 | 4.9% |
| 2–3 times a month | 54 C,D | 8.8% | 15 D | 4.4% | 10 | 1.9% | 2 | 0.7% | 56 | 3.9% | 25 A | 7.6% |
| Very rarely or not at all | 447 | 72.9% | 305 A | 89.4% | 478 A | 93.2% | 281 A,B,C | 97.9% | 1259 B | 88.2% | 252 | 77.1% |
| Green tea | χ2 = 12.65, p = 0.394 | χ2 = 8.84, p = 0.065 | ||||||||||
| Daily | 15 | 2.4% | 12 | 3.5% | 12 | 2.3% | 10 | 3.5% | 38 | 2.7% | 11 | 3.4% |
| 2–3 times a week | 37 | 6.0% | 13 | 3.8% | 28 | 5.5% | 20 | 7.0% | 81 | 5.7% | 17 | 5.2% |
| Once a week | 29 | 4.7% | 7 | 2.1% | 15 | 2.9% | 7 | 2.4% | 45 | 3.2% | 13 | 4.0% |
| 2–3 times a month | 82 | 13.4% | 46 | 13.5% | 63 | 12.3% | 41 | 14.3% | 174 | 12.2% | 58 A | 17.7% |
| Very rarely or not at all | 450 | 73.4% | 263 | 77.1% | 395 | 91.3% | 209 | 72.8% | 1089 B | 76.3% | 228 | 69.7% |
| Black tea | χ2 = 29.17, p = 0.004 | χ2 = 10.43, p = 0.034 | ||||||||||
| Daily | 15 | 2.4% | 9 | 2.6% | 7 | 1.4% | 2 | 0.7% | 21 | 1.5% | 12 A | 3.7% |
| 2–3 times a week | 28 C | 4.6% | 9 | 2.6% | 8 | 1.6% | 6 | 2.1% | 38 | 2.7% | 13 | 4.0% |
| Once a week | 17 | 2.8% | 8 | 2.3% | 15 | 2.9% | 3 | 1.0% | 33 | 2.3% | 10 | 3.1% |
| 2–3 times a month | 51 | 8.3% | 34 | 10.0% | 29 | 5.7% | 14 | 4.9% | 101 | 7.1% | 27 | 8.3% |
| Very rarely or not at all | 502 | 81.9% | 281 | 82.4% | 454 A | 88.5% | 262 A,B | 91.3% | 1234 B | 86.5% | 265 | 81.0% |
| Carbonated or sweetened drinks (1 serving = 330 mL, a glass) | χ2 = 225,73, p < 0.0001 | χ2 = 27.74, p < 0.0001 | ||||||||||
| Daily, more than one serving | 71 D | 11.6% | 40 D | 11.7% | 38 D | 7.4% | 6 | 2.1% | 116 | 8.1% | 39 A | 11.9% |
| Daily, one serving | 32 | 5.2% | 18 | 5.3% | 32 D | 6.2% | 6 | 2.1% | 64 | 4.5% | 24 A | 7.3% |
| More than 2 times a week | 103 C,D | 16.8% | 38 D | 11.1% | 46 | 9.0% | 15 | 5.2% | 154 | 10.8% | 48 A | 14.7% |
| Twice a week | 102 B,C,D | 16.6% | 31 | 9.1% | 33 | 6.4% | 14, | 4.9% | 135 | 9.5% | 45 A | 13.8% |
| Once a week | 105 D | 17.1% | 74 C,D | 21.7% | 73D | 14.2% | 17 | 5.9% | 221 | 15.5% | 48 | 14.7% |
| Very rarely or not at all | 200 | 32.6% | 140 | 41.1% | 291 A,B | 56.7% | 229 A,B,C | 79.8% | 737 B | 51.6% | 123 | 37.6% |
| Alcoholic beverages (1 glass wine = 125 mL, 1 glass pure alcohol = 50 mL) | χ2 = 45.37, p < 0.0001 | χ2 = 84.25, p < 0.0001 | ||||||||||
| Daily, more than one serving | 7 | 1.1% | 6 | 1.8% | 4 | 0.8% | 7 | 2.4% | 5 | 0.4% | 19 A | 5.8% |
| Daily, one serving | 3 | 0.5% | 4 | 1.2% | 16 A | 3.1% | 7 | 2.4% | 21 | 1.5% | 9 | 2.8% |
| More than 2 times a week | 31 | 5.1% | 10 | 2.9% | 39 B | 7.6% | 18 | 6.3% | 67 | 4.7% | 31 A | 9.5% |
| Twice a week | 26 | 4.2% | 29 A | 8.5% | 43 A | 8.4% | 19 | 6.6% | 241 | 16.9% | 53 | 16.2% |
| Once a week | 89 | 14.5% | 68 | 19.9% | 87 A | 17.0% | 50 | 17.4% | 86 | 6.0% | 31 | 9.5% |
| Very rarely or not at all | 457 B,C,D | 74.6% | 224 | 65.7% | 324 | 63.2% | 186 | 64.8% | 1007 A | 70.6% | 184 | 56.3% |
| Independent Variables | 1 Cup per Day | 2–3 Cups per Day | More than 3 Cups per Day | ||||||
|---|---|---|---|---|---|---|---|---|---|
| OR | 95% CI | p | OR | 95% CI | p | OR | 95% CI | p | |
| Gender | |||||||||
| Male | 1 | 1 | 1 | ||||||
| Female | 1.776 | (1.266–2.491) | 0.001 | 1.547 | (1.075–2.227) | 0.019 | 1.000 | (0.518–1.938) | 0.999 |
| Age (years) | |||||||||
| 18–25 | 0.220 | (0.138–0.315) | <0.0001 | 0.150 | (0.091–0.248) | <0.0001 | 0.192 | (0.074–0.493) | 0.001 |
| 26–35 | 0.317 | (0.193–0.521) | <0.0001 | 0.298 | (0.176–0.503) | <0.0001 | 0.483 | (0.187–1.249) | 0.133 |
| 36–50 | 0.717 | (0.438–1.173) | 0. 185 | 1.072 | (0.647–1.777) | 0.786 | 1.438 | (0.592–3.494) | 0.423 |
| >50 | 1 | 1 | 1 | ||||||
| Body mass index (BMI) | |||||||||
| Underweight | 1 | 1 | 1 | ||||||
| Normal weight | 1.269 | (0.812–1.986) | 0.296 | 1.644 | (0.990–2.730) | 0.055 | 1.265 | (0.424–3.777) | 0.673 |
| Overweight | 1.959 | (1.192–3.220) | 0.008 | 3.016 | (1.739–5.231)) | <0.0001 | 1.961 | (0.572–6.716) | 0.284 |
| Obese | 1.457 | (0.849–2.500) | 0.173 | 2.299 | (1.273–4.150) | 0.006 | 1.467 | (0.439–4.904) | 0.534 |
| Smoking | |||||||||
| Occasionally | 2.226 | (1.372–3.612) | 0.001 | 3.056 | (1.829–5.106) | <0.0001 | 5.571 | (2.311–8.426) | <0.0001 |
| 1–2 cigarettes daily | 1.854 | (1.029–3.342) | 0.040 | 2.508 | (1.342–4.688) | 0.004 | 0.908 | (0.115–4.167) | 0.927 |
| Excessive daily | 3.972 | (2.474–6.379) | <0.0001 | 9.165 | (5.696–14.748) | <0.0001 | 9.697 | (5.179–15.2846) | <0.0001 |
| No | 1 | 1 | 1 | ||||||
| Slipping time (hours) | |||||||||
| I have frequent insomnia | 1.194 | (0.634–2.250) | 0.582 | 1.851 | (0.991–3.456) | 0.053 | 6.075 | (2.405–15.347) | <0.0001 |
| Under 7 h per night | 0.958 | (0.732–1.253) | 0.754 | 1.248 | (0.946–1.645) | 0.117 | 3.006 | (1.727–5.231) | <0.0001 |
| Over 9 h per night | 0.358 | (0.188–0.684) | 0.020 | 0.370 | (0.182–0.752) | 0.006 | 0.405 | (0.053–3.122) | 0.386 |
| 7–9 h per night | 1 | 1 | 1 | ||||||
| Independent Variables | Up to 500 mL per Day | Up to 1 L per Day | Over 1 L per Day | ||||||
|---|---|---|---|---|---|---|---|---|---|
| OR | 95% CI | p | OR | 95% CI | p | OR | 95% CI | p | |
| Gender | |||||||||
| Male | 1 | 1 | 1 | ||||||
| Female | 0.668 | (0.514–0.867) | 0.0021 | 0.391 | (0.234–0.653) | <0.0001 | 0.495 | (0.243–1.009) | 0.053 |
| Age (years) | |||||||||
| 18–25 | 2.1 | (1.448–3.045) | <0.0001 | 5.369 | (3.613–7.978) | <0.0001 | 6.524 | (2.208–9.677) | 0.006 |
| 26–35 | 1.534 | (1.012–2.324) | 0.044 | 4.347 | (2.841–6.651) | <0.0001 | 5.289 | (1.971–8.589) | 0.009 |
| 36–50 | 1.31 | (0.893–1.923) | 0.168 | 3.279 | (2.184 –4.922) | <0.0001 | 4.429 | (0.530–7.023) | 0.17 |
| >50 | 1 | 1 | 1 | ||||||
| Body mass index (BMI) | |||||||||
| Underweight | 1 | 1 | 1 | ||||||
| Normal weight | 1.021 | (0.667–1.562) | 0.925 | 1.622 | (0.539–3.884) | 0.39 | 1.817 | (0.395–8.351) | 0.443 |
| Overweight | 1.425 | (0.888–2.287) | 0.142 | 2.934 | (0.913–9.439) | 0.071 | 2.648 | (0.508–13.798) | 0.248 |
| Obese | 1.903 | (1.122–3.229) | 0.017 | 5.064 | (1.473–14.411) | 0.01 | 5.29 | (1.572–15.721) | 0.013 |
| Smoking | |||||||||
| Occasionally | 1.702 | (1.190–2.435) | 0.004 | 1.818 | (0.785–4.210) | 0.163 | 1.818 | (0.608–5.434) | 0.285 |
| 1–2 cigarettes daily | 2.213 | (1.430–3.423) | <0.0001 | 2.263 | (0.887–6.293) | 0.085 | 1.031 | (0.586–1.778) | 0.942 |
| Excessive daily | 2.746 | (2.096–3.598) | <0.0001 | 4.59 | (2.693–7.823) | <0.0001 | 4.76 | (2.408–9.409) | <0.0001 |
| No smoke | 1 | 1 | 1 | ||||||
| Slipping time (hours) | |||||||||
| I have frequent insomnia | 1.161 | (0.705–1913) | 0.558 | 2.932 | (1.296–6.633) | 0.01 | 5.56 | (2.143–14.683) | <0.0001 |
| Under 7 h per night | 1.332 | (1067–1.6621) | 0.011 | 1.478 | (0.890–2.457) | 0.131 | 3.908 | (1.737–8.789) | 0.001 |
| Over 9 h a night | 1.234 | (0.674–2.257) | 0.496 | 0.573 | (0.076–4.307) | 0.588 | 1.416 | (0.853–2.321) | 0.186 |
| 7–9 h per night | 1 | 1 | 1 | ||||||
| Independent Variables | 1 Dose per Day | 2 Doses per Day | Over 2 Doses per Day | ||||||
|---|---|---|---|---|---|---|---|---|---|
| OR | 95% CI | p | OR | 95% CI | p | OR | 95% CI | p | |
| Gender | |||||||||
| Male | 1 | 1 | 1 | ||||||
| Female | 0.515 | (0.333–0.798) | 0.003 | 0.761 | (0.442–1.310) | 0.324 | 0.289 | (0.131–0.637) | 0.002 |
| Age (years) | |||||||||
| 18–25 | 4.149 | (2.981–12.191) | <0.0001 | 1.764 | (0.876–3.551) | 0.112 | 2.421 | (0.640–9.162) | 0.193 |
| 26–35 | 3.276 | (1.057–10.149) | 0.04 | 1.364 | (0.647–2.878) | 0.414 | 1.081 | (0.244–4.799) | 0.918 |
| 36–50 | 3.473 | (1.167–10.333) | 0.025 | 1.136 | (0.566–2.281) | 0.72 | 1.186 | (0.294–4.796) | 0.81 |
| >50 | 1 | 1 | 1 | ||||||
| Smoking | |||||||||
| Occasionally | 2.162 | (1.225–3.815) | 0.008 | 2.313 | (1.228–4.355) | 0.009 | 1.247 | (0.354–4.388) | 0.731 |
| 1–2 cigarettes daily | 2.815 | (1.820–4.353) | 0.001 | 0.824 | (0.250–2.720) | 0.751 | 0.827 | (0.107–6.398) | 0.855 |
| Excessive daily | 3.168 | (1.643–6.112) | <0.0001 | 2.087 | (1.251–3.481) | 0.005 | 1.663 | (0.713–3.880) | 0.239 |
| No smoke | 1 | 1 | 1 | ||||||
Disclaimer/Publisher’s Note: The statements, opinions and data contained in all publications are solely those of the individual author(s) and contributor(s) and not of MDPI and/or the editor(s). MDPI and/or the editor(s) disclaim responsibility for any injury to people or property resulting from any ideas, methods, instructions or products referred to in the content. |
© 2023 by the authors. Licensee MDPI, Basel, Switzerland. This article is an open access article distributed under the terms and conditions of the Creative Commons Attribution (CC BY) license (https://creativecommons.org/licenses/by/4.0/).
Share and Cite
Mititelu, M.; Oancea, C.-N.; Neacșu, S.M.; Olteanu, G.; Cîrțu, A.-T.; Hîncu, L.; Gheonea, T.C.; Stanciu, T.I.; Rogoveanu, I.; Hashemi, F.; et al. Evaluation of Non-Alcoholic Beverages and the Risk Related to Consumer Health among the Romanian Population. Nutrients 2023, 15, 3841. https://doi.org/10.3390/nu15173841
Mititelu M, Oancea C-N, Neacșu SM, Olteanu G, Cîrțu A-T, Hîncu L, Gheonea TC, Stanciu TI, Rogoveanu I, Hashemi F, et al. Evaluation of Non-Alcoholic Beverages and the Risk Related to Consumer Health among the Romanian Population. Nutrients. 2023; 15(17):3841. https://doi.org/10.3390/nu15173841
Chicago/Turabian StyleMititelu, Magdalena, Carmen-Nicoleta Oancea, Sorinel Marius Neacșu, Gabriel Olteanu, Alexandru-Tiberiu Cîrțu, Lucian Hîncu, Theodora Claudia Gheonea, Tiberius Iustinian Stanciu, Ion Rogoveanu, Fallah Hashemi, and et al. 2023. "Evaluation of Non-Alcoholic Beverages and the Risk Related to Consumer Health among the Romanian Population" Nutrients 15, no. 17: 3841. https://doi.org/10.3390/nu15173841
APA StyleMititelu, M., Oancea, C.-N., Neacșu, S. M., Olteanu, G., Cîrțu, A.-T., Hîncu, L., Gheonea, T. C., Stanciu, T. I., Rogoveanu, I., Hashemi, F., Stanciu, G., Ioniță-Mîndrican, C.-B., Angelica, C., Măru, N., Lupu, S., & Lupu, C. E. (2023). Evaluation of Non-Alcoholic Beverages and the Risk Related to Consumer Health among the Romanian Population. Nutrients, 15(17), 3841. https://doi.org/10.3390/nu15173841


