
Digital Anthropometry: A Systematic Review on Precision, Reliability and Accuracy of Most Popular Existing Technologies
 , , and
Abstract
:1. Introduction
- Random error can be expressed in terms of precision and reliability (relative or absolute) level.
- Precision expresses the variability between repeated measurements by a particular observer using a particular device to measure a particular variable. Imprecision can be caused by flawed measuring equipment, inadequately trained measurers, or poor technique. Common indices of precision are absolute intra- and inter- Technical Error of Measurement (TEM) and relative TEM (%TEM). According to the International Society for the Advancement of Kinanthropometry (ISAK) protocol, acceptable TEMs are 0.1 kg, 3 cm and 2 cm for weight, stature, and body circumferences, respectively. Another example is the precision error of repeated measurements (PE).
- Absolute reliability regards the consistency of scores for individuals or, in other terms, the degree to which repeated measurements vary for individuals. It can be expressed by the coefficient of variation (CV) and the standard error of measurement of a group estimate (SEM).
- Relative reliability is the degree to which individuals maintain their position in a sample over repeated measurements; it is expressed by the reliability coefficient R and the intraclass correlation coefficient (ICC).
- Systematic error or bias depends on accuracy, defining the level of correlation or agreement between an under-validation (bedside) method and a reference method when measuring the same variable. It may depend on equipment bias (lack of calibration, device complexity) or operator error. As mentioned before, it is possible to classify accuracy in terms of:
- Correlation at a mean level: paired t-tests, Pearson’s correlation coefficient, concordance correlation coefficient (CCC), linear regression. The latter involves calculating the coefficient of determination (R2), standard error of the estimate (SEE), and root mean square error (RMSE). CCC appears useful to describe methods agreement (association and identity) when more than two operators and/or repeated measurements come into play. While ICC relies on ANOVA assumptions, CCC does not; both indices concurrently involve precision and accuracy assessment.
- Agreement or concordance, at an individual level: the Bland–Altman plot compares the level of agreement of two different technologies by plotting the difference against the arithmetic mean (M) of each pair of measurements, the total mean difference (bias), and the 95% limits of agreement (LoA), with their respective confidence intervals.
- Random error
- Precision
- ○
- Absolute Technical Error of Measurement (TEM) = √(ΣD2/2n)
- ○
- Relative Technical Error of Measurement (%TEM) = (TEM/M) × 100
- ○
- Precision Error (PE) = √(ΣSD2/n)
D = Δ between the 2 measurements, n = number of subjects, M = arithmetic mean of measurements, SD = standard deviation of measurements - Absolute Reliability
- ○
- Coefficient of Variation (CV) = SD/M
- ○
- Standard Error of Measurement (SEM) = SD√(1 − rxx)
rxx = chosen coefficient of reliability, usually ICC - Relative Reliability
- ○
- Reliability Coefficient (R) = 1 − (total TEM2/SD2)1 − (%TEM/CV)2
- ○
- Intraclass correlation coefficient (ICC)different forms according to the ANOVA model, number of raters, and consistency/absolute agreement
SD2 = total inter-subject variance
- Systematic error or bias
- Correlation, at a mean level
- ○
- Pearson’s correlation coefficient (r)
- ○
- Coefficient of determination (R2)
- ○
- Standard Error of the Estimate (SEE) = √[Σ(Y − X)2/(n − 2)]
- ○
- Root Mean Square Error (RMSE) = √[Σ(Y − X)2/n]
- ○
- Concordance Correlation Coefficient (CCC)
- ○
- Mean difference (groups)
- ○
- Paired t-tests
Y = measured value; X = predicted value - Agreement or concordance, at an individual level
- ○
- Bland–Altman plot
- ○
- LoA = mean difference ± (1.96 × SD)
Y = reference method; X = bedside method
2. Materials and Methods
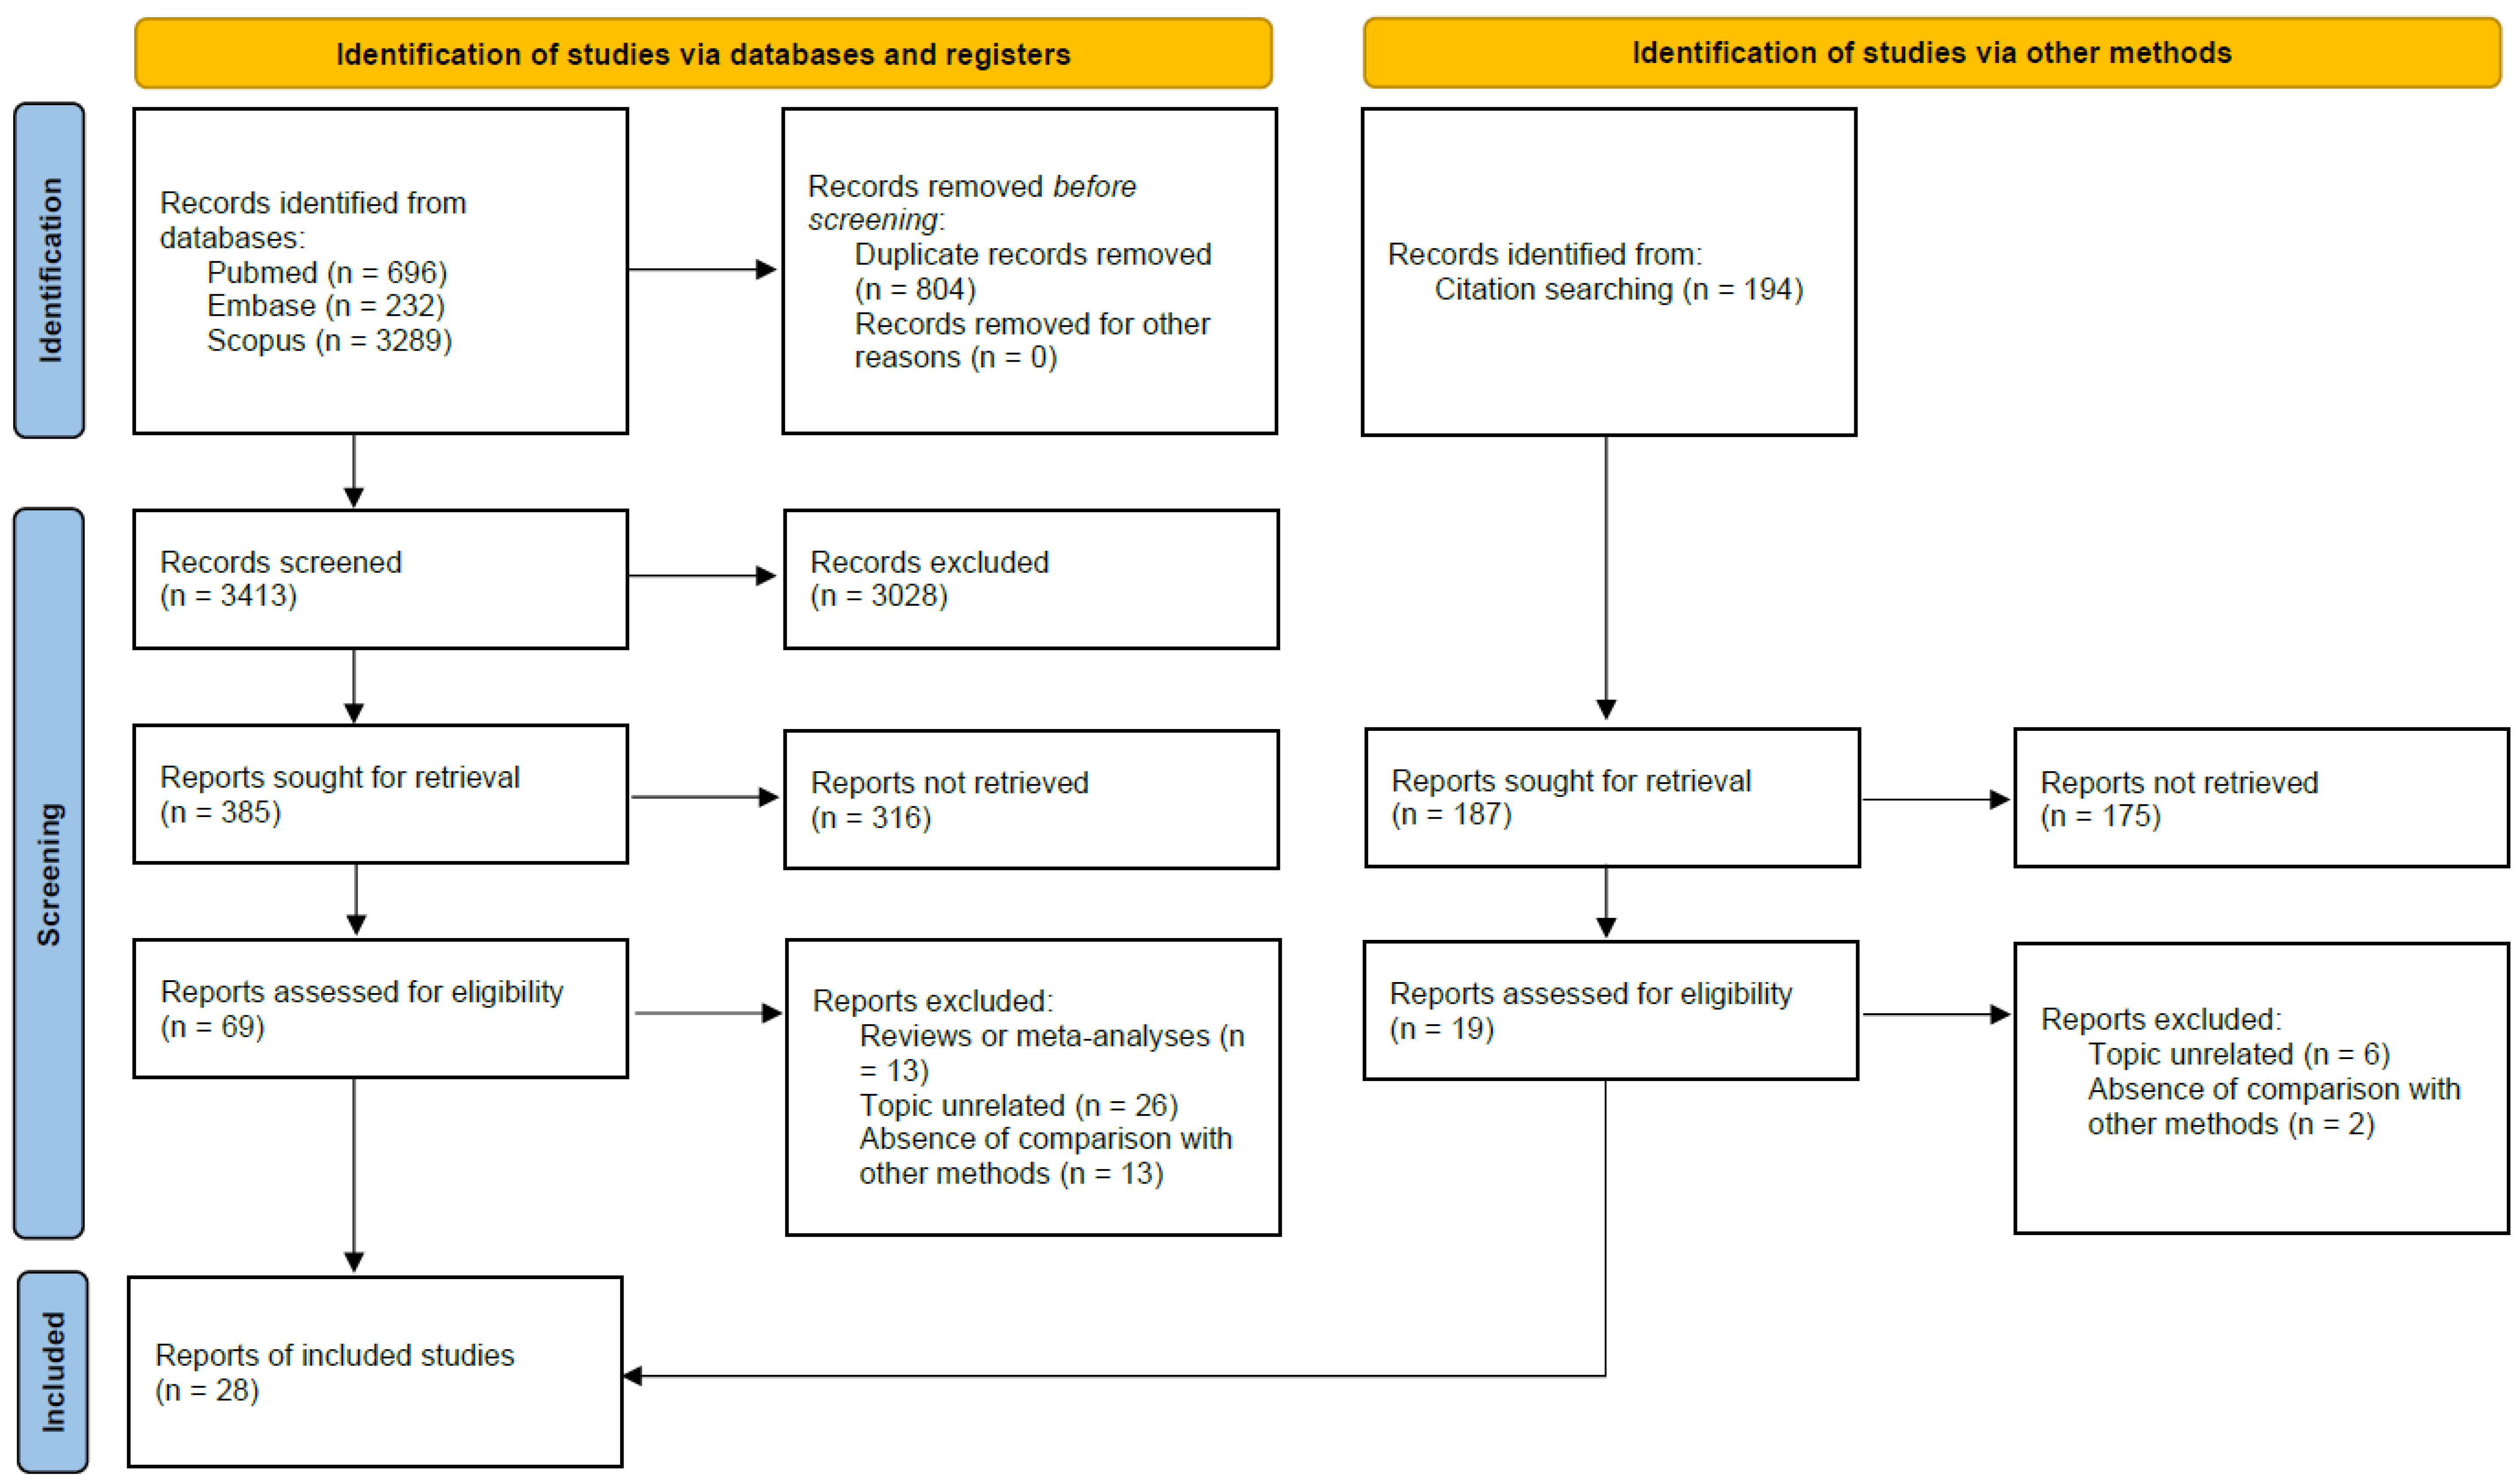
2.1. Search Strategy
2.2. Eligibility Criteria and Procedures for Article Selection
2.3. Data Extraction and Quality Assessment
3. Results
3.1. Quality Assessment
3.2. Comparison between Digital Anthropometry (DA; 3D Scanners) and Classic Manual Anthropometry (CA) Measurements: Body Circumferences, Lengths, and Shape
3.2.1. Reliability
3.2.2. Accuracy
3.3. Comparison between Digital Anthropometry (DA; 3D Scanners) and Classic Manual Anthropometry (CA) Measurements: Body Composition, Volume, FM and FFM
3.3.1. Reliability
3.3.2. Accuracy
3.4. Certainty in the Evidence
4. Discussion
Limitations
5. Conclusions
Supplementary Materials
Author Contributions
Funding
Institutional Review Board Statement
Informed Consent Statement
Data Availability Statement
Acknowledgments
Conflicts of Interest
References
- Rumbo-Rodríguez, L.; Sánchez-SanSegundo, M.; Ferrer-Cascales, R.; García-D’Urso, N.; Hurtado-Sánchez, J.; Zaragoza-Martí, A. Comparison of Body Scanner and Manual Anthropometric Measurements of Body Shape: A Systematic Review. Int. J. Environ. Res. Public Health 2021, 18, 6213. [Google Scholar] [CrossRef] [PubMed]
- Brožek, J.; Prokopec, M. Historical note: Early history of the anthropometry of body composition. Am. J. Hum. Biol. 2001, 13, 157–158. [Google Scholar] [CrossRef] [PubMed]
- Marfell-Jones, M.J.; Stewart, A.D.; de Ridder, J.H. International Standards for Anthropometric Assessment; International Society for the Advancement of Kinanthropometry: Wellington, New Zealand, 2012; Available online: https://repository.openpolytechnic.ac.nz/handle/11072/1510 (accessed on 22 November 2022).
- Leone, M.; Lariviere, G.; Comtois, A.S. Discriminant analysis of anthropometric and biomotor variables among elite adolescent female athletes in four sports. J. Sports Sci. 2002, 20, 443–449. [Google Scholar] [CrossRef] [PubMed]
- Streiner, D.L.; Norman, G.R. “Precision” and “Accuracy”: Two Terms That Are Neither. J. Clin. Epidemiol. 2006, 59, 327–330. [Google Scholar] [CrossRef] [PubMed]
- Earthman, C.P. Body Composition Tools for Assessment of Adult Malnutrition at the Bedside: A Tutorial on Research Considerations and Clinical Applications’. J. Parenter. Enter. Nutr. 2015, 39, 787–822. [Google Scholar] [CrossRef]
- Bruton, A.; Conway, J.H.; Holgate, S.T. Reliability: What is it, and how is it measured? Physiotherapy 2000, 86, 94–99. [Google Scholar] [CrossRef]
- Koo, T.K.; Li, M.Y. A Guideline of Selecting and Reporting Intraclass Correlation Coefficients for Reliability Research. J. Chiropr. Med. 2016, 15, 155–163. [Google Scholar] [CrossRef] [Green Version]
- van Stralen, K.; Dekker, F.; Zoccali, C.; Jager, K. Measuring agreement, more complicated than it seems. Nephron Clin. Pr. 2012, 120, c162–c167. [Google Scholar] [CrossRef]
- Chen, C.C.; Barnhart, H.X. Comparison of ICC and CCC for assessing agreement for data without and with replications. Comput. Stat. Data Anal. 2008, 53, 554–564. [Google Scholar] [CrossRef]
- Tur, J.A.; Del Mar Bibiloni, M. Anthropometry, Body Composition and Resting Energy Expenditure in Human. Nutrients 2019, 11, 1891. [Google Scholar] [CrossRef]
- Eveleth, P.B. Physical Status: The Use and Interpretation of Anthropometry; Report of a WHO Expert Committee. World Health Organ Tech. Rep. Ser. 1995, 854, 1–452. [Google Scholar] [CrossRef]
- Britton, K.A.; Massaro, J.M.; Murabito, J.M.; Kreger, B.E.; Hoffmann, U.; Fox, C.S. Body fat distribution, incident cardiovascular disease, cancer, and all-cause mortality. J. Am. Coll. Cardiol. 2013, 62, 921–925. [Google Scholar] [CrossRef] [PubMed] [Green Version]
- Bawadi, H.; Abouwatfa, M.; Alsaeed, S.; Kerkadi, A.; Shi, Z. Body Shape Index Is a Stronger Predictor of Diabetes. Nutrients 2019, 11, 1018. [Google Scholar] [CrossRef] [PubMed] [Green Version]
- Sánchez-García, S.; García-Peña, C.; Duque-López, M.X.; Juárez-Cedillo, T.; Cortés-Núñez, A.R.; Reyes-Beaman, S. Anthropometric measures and nutritional status in a healthy elderly population. BMC Public Health 2007, 7, 2. [Google Scholar] [CrossRef] [Green Version]
- Razumov, A.; Vybornaya, K.V.; Pogonchenkova, I.V.; A Rozhkova, E.; Akyeva, N.; Klochkova, S.; Alekseeva, N.T.; Nikityuk, D.B. Characteristics of some indicators of physical development and frequency of occurrence of certain somatotypes of women in older age groups. Probl. Nutr. 2016, 85, 22–27. [Google Scholar]
- Jayawardena, R.; Ranasinghe, P.; Ranathunga, T.; Mathangasinghe, Y.; Wasalathanththri, S.; Hills, A.P. Novel anthropometric parameters to define obesity and obesity-related disease in adults: A systematic review. Nutr. Rev. 2020, 78, 498–513. [Google Scholar] [CrossRef]
- Page, M.J.; McKenzie, J.E.; Bossuyt, P.M.; Boutron, I.; Hoffmann, T.C.; Mulrow, C.D.; Shamseer, L.; Tetzlaff, J.M.; Akl, E.A.; Brennan, S.E.; et al. The PRISMA 2020 statement: An updated guideline for reporting systematic reviews. BMJ Br. Med. J. 2021, 372, n71. [Google Scholar] [CrossRef]
- Downes, M.J.; Brennan, M.L.; Williams, H.C.; Dean, R.S. Development of a critical appraisal tool to assess the quality of cross-sectional studies (AXIS). BMJ Open 2016, 6, e011458. [Google Scholar] [CrossRef] [Green Version]
- Herzog, R.; Álvarez-Pasquin, M.J.; Díaz, C.; Del Barrio, J.L.; Estrada, J.M.; Gil, Á. Are healthcare workers intentions to vaccinate related to their knowledge, beliefs and attitudes? A systematic review. BMC Public Health 2013, 13, 154 . [Google Scholar] [CrossRef] [Green Version]
- Jüni, P.; Witschi, A.; Bloch, R.; Egger, M. The hazards of scoring the quality of clinical trials for meta-analysis. JAMA 1999, 282, 1054–1060. [Google Scholar] [CrossRef] [Green Version]
- Wiss, D.A.; Brewerton, T.D. Adverse Childhood Experiences and Adult Obesity: A Systematic Review of Plausible Mechanisms and Meta-Analysis of Cross-Sectional Studies. Physiol. Behav. 2020, 223, 112964. [Google Scholar] [CrossRef] [PubMed]
- Thornton, J.; Alderson, P.; Tan, T.; Turner, C.; Latchem, S.; Shaw, E.; Ruiz, F.; Reken, S.; Mugglestone, M.A.; Hill, J.; et al. Introducing GRADE across the NICE clinical guideline program. J. Clin. Epidemiol. 2012, 66, 124–131. [Google Scholar] [CrossRef] [PubMed]
- Koepke, N.; Zwahlen, M.; Wells, J.C.; Bender, N.; Henneberg, M.; Rühli, F.J.; Staub, K. Comparison of 3D laser-based photonic scans and manual anthropometric measurements of body size and shape in a validation study of 123 young Swiss men. PeerJ 2017, 5, e2980. [Google Scholar] [CrossRef] [Green Version]
- Sager, R.; Güsewell, S.; Rühli, F.; Bender, N.; Staub, K. Multiple measures derived from 3D photonic body scans improve predictions of fat and muscle mass in young Swiss men. PLoS ONE 2020, 15, e0234552. [Google Scholar] [CrossRef]
- Garlie, T.N.; Obusek, J.P.; Corner, B.D.; Zambraski, E.J. Comparison of body fat estimates using 3D digital laser scans, direct manual anthropometry, and DXA in men. Am. J. Hum. Biol. 2010, 22, 695–701. [Google Scholar] [CrossRef]
- Beckmann, C.; Aldakak, L.; Eppenberger, P.; Rühli, F.; Staub, K.; Bender, N. Body height and waist circumference of young Swiss men as assessed by 3D laser-based photonic scans and by manual anthropometric measurements. PeerJ 2019, 7, e8095. [Google Scholar] [CrossRef] [PubMed] [Green Version]
- Japar, S.; Manaharan, T.; Shariff, A.A.; Mohamed, A.M.; Merican, A.F. Assessment of abdominal obesity using 3D body scanning technology. Sains Malays. 2017, 46, 567–573. [Google Scholar] [CrossRef]
- Heuberger, R.; Domina, T.; Macgillivray, M. Body scanning as a new anthropometric measurement tool for health-risk assessment. Int. J. Consum. Stud. 2008, 32, 34–40. [Google Scholar] [CrossRef]
- Milanese, C.; Giachetti, A.; Cavedon, V.; Piscitelli, F.; Zancanaro, C. Digital three-dimensional anthropometry detection of exercise-induced fat mass reduction in obese women. Sport Sci. Health 2014, 11, 67–71. [Google Scholar] [CrossRef]
- Pepper, M.R.; Freeland-Graves, J.H.; Yu, W.; Stanforth, P.R.; Cahill, J.M.; Mahometa, M.; Xu, B. Validation of a 3-dimensional laser body scanner for assessment of waist and hip circumference. J. Am. Coll. Nutr. 2010, 29, 179–188. [Google Scholar] [CrossRef]
- Pepper, M.R.; Freeland-Graves, J.H.; Yu, W.; Stanforth, P.R.; Xu, B. Evaluation of a rotary laser body scanner for body volume and fat assessment. J. Test. Eval. 2010, 39, 1–6. [Google Scholar] [CrossRef] [PubMed]
- Harbin, M.M.; Kasak, A.; Ostrem, J.D.; Dengel, D.R. Validation of a three-dimensional body scanner for body composition measures. Eur. J. Clin. Nutr. 2018, 72, 1191–1194. [Google Scholar] [CrossRef]
- Bourgeois, B.; Ng, B.K.; Latimer, D.; Stannard, C.R.; Romeo, L.; Li, X.; A Shepherd, J.; Heymsfield, S.B. Clinically applicable optical imaging technology for body size and shape analysis: Comparison of systems differing in design. Eur. J. Clin. Nutr. 2017, 71, 1329–1335. [Google Scholar] [CrossRef] [PubMed]
- Wagner, D.; Castaneda, F.; Bohman, B.; Sterr, W. ANTHROPOMETRY Comparison of a 2D iPad application and 3D body scanner to air displacement plethysmography for measurement of body fat percentage. J. Hum. Nutr. Diet. 2019, 32, 781–788. [Google Scholar] [CrossRef] [PubMed]
- Cabre, H.; Blue, M.N.M.; Hirsch, K.R.; Gould, L.; Nelson, A.; Smith-Ryan, A.E. Validity of a Three-Dimensional Body Scanner: Comparison Against a 4-Compartment Model and Dual Energy X-Ray Absorptiometry. Appl. Physiol. Nutr. Metab. 2021, 46, 644–650. [Google Scholar] [CrossRef]
- Wong, M.C.; Ng, B.K.; Kennedy, S.F.; Hwaung, P.; Liu, E.Y.; Kelly, N.N.; Pagano, I.S.; Garber, A.K.; Chow, D.; Heymsfield, S.B.; et al. Children and Adolescents’ Anthropometrics Body Composition from 3-D Optical Surface Scans. Obesity 2019, 27, 1738–1749. [Google Scholar] [CrossRef] [Green Version]
- Conkle, J.I.; Suchdev, P.S.; Alexander, E.; Flores-ayala, R.; Ramakrishnan, U.; Martorell, R. Accuracy and reliability of a low-cost, handheld 3D imaging system for child anthropometry. PLoS One 2018, 13, e0205320. [Google Scholar] [CrossRef] [Green Version]
- Kennedy, S.; Hwaung, P.; Kelly, N.; Liu, Y.E.; Sobhiyeh, S.; Heo, M.; Shepherd, J.A.; Heymsfield, S.B. Optical imaging technology for body size and shape analysis: Evaluation of a system designed for personal use. Eur. J. Clin. Nutr. 2020, 74, 920–929. [Google Scholar] [CrossRef]
- Sobhiyeh, S.; Dunkel, A.; Dechenaud, M.; Mehrnezhad, A.; Kennedy, S.; Shepherd, J.; Wolenski, P.; Heymsfield, S.B. Digital anthropometric volumes: Toward the development and validation of a universal software. Med. Phys. 2021, 48, 3654–3664. [Google Scholar] [CrossRef]
- Tinsley, G.M.; Moore, M.L.; Benavides, M.L.; Dellinger, J.R.; Adamson, B.T. 3-Dimensional optical scanning for body composition assessment: A 4-component model comparison of four commercially available scanners. Clin. Nutr. 2020, 39, 3160–3167. [Google Scholar] [CrossRef]
- Kennedy, S.; Smith, B.; Sobhiyeh, S.; Dechenaud, M.E.; Wong, M.; Kelly, N.; Shepherd, J.; Heymsfield, S.B. Digital anthropometric evaluation of young children: Comparison to results acquired with conventional anthropometry. Eur. J. Clin. Nutr. 2021, 76, 251–260. [Google Scholar] [CrossRef] [PubMed]
- Sobhiyeh, S.; Kennedy, S.; Dunkel, A.; Dechenaud, M.E.; Weston, J.A.; Shepherd, J.; Wolenski, P.; Heymsfield, S.B. Digital anthropometry for body circumference measurements: Toward the development of universal three-dimensional optical system analysis software. Obes. Sci. Pr. 2021, 7, 35–44. [Google Scholar] [CrossRef] [PubMed]
- Lee, J.; Freeland-Graves, J.; Pepper, M.; Stanforth, P.; Xu, B. Prediction of android and gynoid body adiposity via a three-dimensional stereovision body imaging system and dual-energy x-ray absorptiometry. J. Am. Coll. Nutr. 2015, 34, 367–377. [Google Scholar] [CrossRef] [PubMed]
- Ng, B.K.; Hinton, B.J.; Fan, B.; Kanaya, A.M.; Shepherd, J.A. Clinical anthropometrics and body composition from 3D whole-body surface scans. Eur. J. Clin. Nutr. 2016, 70, 1265–1270. [Google Scholar] [CrossRef] [Green Version]
- Wang, J.; Gallagher, D.; Thornton, J.C.; Yu, W.; Horlick, M.; Pi-Sunyer, F.X. Validation of a 3-dimensional photonic scanner for the measurement of body volumes, dimensions, and percentage body fat. Am. J. Clin. Nutr. 2006, 83, 809–816. [Google Scholar] [CrossRef] [PubMed] [Green Version]
- Tinsley, G.M.; Moore, M.L.; Dellinger, J.R.; Adamson, B.T.; Benavides, M.L. Digital anthropometry via three-dimensional optical scanning: Evaluation of four commercially available systems. Eur. J. Clin. Nutr. 2020, 74, 1054–1064. [Google Scholar] [CrossRef]
- Wells, J.C.K.; Stocks, J.; Bonner, R.; Raywood, E.; Legg, S.; Lee, S.; Treleaven, P.; Lum, S. Acceptability, Precision and Accuracy of 3D Photonic Scanning for Measurement of Body Shape in a Multi-Ethnic Sample of Children Aged 5–11 Years: The SLIC Study. PLoS One 2015, 10, e0124193. [Google Scholar] [CrossRef] [Green Version]
- Bušic, A.; Bušić, J.; Coleman, J.; Šimenko, J. Comparison of Manual Anthropometry and a Mobile Digital Anthropometric System. In Proceedings of the icSPORTS 2020—Proceedings of the 8th International Conference on Sport Sciences Research and Technology Support, Budapest, Hungary, 5–6 November 2020; pp. 109–115. [Google Scholar] [CrossRef]
- Simenko, J.; Cuk, I. Reliability and validity of NX-16 3D body scanner. Int. J. Morphol. 2016, 34, 1506–1514. [Google Scholar] [CrossRef] [Green Version]
- Lu, J.M.; Wang, M.J.J. The evaluation of scan-derived anthropometric measurements. IEEE Trans. Instrum. Meas. 2010, 59, 2048–2054. [Google Scholar] [CrossRef]
- Ratner, B. The correlation coefficient: Its values range between +1/−1, or do they? J. Target. Meas. Anal. Mark. 2009, 17, 139–142. [Google Scholar] [CrossRef]
- Bartol, K.; Bojanic, D.; Petkovic, T.; Pribanic, T. A Review of Body Measurement Using 3D Scanning. IEEE Access 2021, 9, 67281–67301. [Google Scholar] [CrossRef]
- Schwarz-Müller, F.; Marshall, R.; Summerskill, S. Development of a positioning aid to reduce postural variability and errors in 3D whole body scan measurements. Appl. Ergon. 2018, 68, 90–100. [Google Scholar] [CrossRef] [PubMed] [Green Version]
- Sobhiyeh, S.; Borel, N.; DeChenaud, M.; A Graham, C.; Wong, M.; Wolenski, P.; Shepherd, J.; Heymsfield, S.B. Fully Automated Pipeline for Body Composition Estimation from 3D Optical Scans using Principal Component Analysis: A Shape Up Study. Proc. Annu. Int. Conf. IEEE Eng. Med. Biol. Soc. EMBS 2020, 2020, 1853–1858. [Google Scholar] [CrossRef]
- Ng, B.K.; Sommer, M.J.; Wong, M.C.; Pagano, I.; Nie, Y.; Fan, B.; Kennedy, S.; Bourgeois, B.; Kelly, N.; E Liu, Y.; et al. Detailed 3-dimensional body shape features predict body composition, blood metabolites, and functional strength: The Shape Up! studies. Am. J. Clin. Nutr. 2019, 110, 1316–1326. [Google Scholar] [CrossRef] [Green Version]
- Naglic, M.M.; Petrak, S. A method for body posture classification of three-dimensional body models in the sagittal plane. Text. Res. J. 2019, 89, 133–149. [Google Scholar] [CrossRef]
- Gorton, G.E.; Young, M.L.; Masso, P.D. Accuracy, reliability, and validity of a 3-dimensional scanner for assessing torso shape in idiopathic scoliosis. Spine 2012, 37, 957–965. [Google Scholar] [CrossRef] [PubMed] [Green Version]
- Barcalová, M.; Živčák, J.; Lenková, R.; Vojtaško, Ľ.; Liptáková, E.; Rajťúková, V.; Krajňáková, V. The use of noninvasive diagnostic methods in the assessment of postural changes in university students. Lek. A Tech. 2017, 47, 23–29. [Google Scholar] [CrossRef]
- Donini, L.; Brunani, A.; Sirtori, A.; Savina, C.; Tempera, S.; Cuzzolaro, M.; Spera, G.; Cimolin, V.; Precilios, H.; Raggi, A.; et al. Assessing disability in morbidly obese individuals: The Italian Society of Obesity test for obesity-related disabilities. Disabil. Rehabil. 2011, 33, 2509–2518. [Google Scholar] [CrossRef]
- Meneguzzo, P.; Behrens, S.C.; Favaro, A.; Tenconi, E.; Vindigni, V.; Teufel, M.; Skoda, E.-M.; Lindner, M.; Quiros-Ramirez, M.A.; Mohler, B.; et al. Body Image Disturbances and Weight Bias After Obesity Surgery: Semantic and Visual Evaluation in a Controlled Study, Findings from the BodyTalk Project. Obes. Surg. 2021, 31, 1625–1634. [Google Scholar] [CrossRef]
- Cammarota, C.; Pinto, A. Variable selection and importance in presence of high collineari-ty: An application to the prediction of lean body mass from multi-frequency bioelectrical im-pedance. J. Appl. Stat. 2021, 48, 1644–1658. [Google Scholar] [CrossRef]

| Authors and Year of Publication | Study Design | Country | Number of Participants | Average Age (Year ± SD) | Males | Males % | Average Age (Year ± SD) | Females | Females % | Average Age (Year ± SD) | ||||||
|---|---|---|---|---|---|---|---|---|---|---|---|---|---|---|---|---|
| Harbin et al. (2018) [33] | Cross-sectional | USA | 265 | 22.1 | ± | 2.5 | 119 | 45% | 22.4 | ± | 2.7 | 146 | 55% | 21.8 | ± | 2.4 |
| Bourgeois et al. (2017) [34] | Cross-sectional | USA | 113 | 44 | ± | 17 | 40 | 35% | 41 | ± | 17 | 73 | 65% | 47 | ± | 17 |
| Koepke et al. (2017) [24] | Cross-sectional | Switzerland | 123 | 24.55 | ± | 4.18 | 123 | 100% | 0 | 0% | ||||||
| Garlie et al. (2010) [26] | Cross-sectional | USA | 37 | 28.4 | ± | 12.7 | 37 | 100% | 0 | 0% | ||||||
| Wagner et al. (2019) [35] | Cross-sectional | USA | 79 | 32.9 | ± | 12.4 | 42 | 53% | 33.2 | ± | 11.9 | 37 | 47% | 32.5 | ± | 13.1 |
| Busic et al. (2020) [49] | Cross-sectional | Slovenia | 51 | NA | 12 | 24% | NA | 39 | 76% | NA | ||||||
| Sager et al. (2020) [25] | Cross-sectional | Switzerland | 104 | 20.5 | ± | 1.1 | 104 | 100% | 0 | 0% | ||||||
| Japar et al. (2017) [28] | Cross-sectional | Malaysia | 200 | 29.83 | 0 | 0% | 200 | 100% | NA | |||||||
| Cabre et al. (2021) [36] | Cross-sectional | USA | 194 | 23.52 | ± | 5.47 | 83 | 43% | 23.8 | ± | 6.1 | 111 | 57% | 23.2 | ± | 4.9 |
| Wells et al. (2015) [48] | Cross-sectional | UK | 1022 | 8.44 | ± | 1.57 | NA | NA | ||||||||
| Wong et al. (2019) [37] | Cross-sectional | USA | 112 | 12.5 | ± | 3.3 | 46 | 41% | 12.3 | ± | 3.3 | 66 | 59% | 12.7 | ± | 3.3 |
| Conkle et al. (2018) [38] | Cross-sectional | USA | 474 | 2.17 | 246 | 52% | NA | 228 | 48% | NA | ||||||
| Heuberger et al. (2008) [29] | Cross-sectional | USA | 85 | 19.5 | ± | 1.4 | 0 | 0% | 85 | 100% | ||||||
| Lu et al. (2010) [51] | Cross-sectional | China | 263 | 18–30 | 172 | 65% | NA | 91 | 35% | NA | ||||||
| Beckmann et al. (2019) [27] | Cross-sectional | Switzerland | 52 | 19–23 | 52 | 100% | NA | 0 | 0% | |||||||
| Kennedy et al. (2020) [39] | Cross-sectional | USA | 90 | 7–74 | 36 | 40% | NA | 54 | 60% | NA | ||||||
| Sobhiyeh, Dunkel et al. (2021) [40] | Cross-sectional | USA | 356 | 21–79 | 155 | 44% | NA | 201 | 56% | NA | ||||||
| Tinsley, Benavides et al. (2020) [47] | Cross-sectional | USA | 179 | 33.6 | ± | 15.3 | 76 | 42% | 33.8 | ± | 14.5 | 103 | 58% | 33.4 | ± | 15.9 |
| Kennedy et al. (2022) [42] | Cross-sectional | USA | 64 | 5–8 | 29 | 45% | 6.9 | ± | 1.1 | 35 | 55% | 6.6 | ± | 1.2 | ||
| Tinsley, Adamson et al. (2020) [41] | Cross-sectional | USA | 171 | 33.1 | ± | 15.2 | 75 | 44% | NA | 96 | 56% | NA | ||||
| 139 | 65 | 47% | NA | 74 | 53% | NA | ||||||||||
| Milanese et al. (2015) [30] | Cross-sectional | Italy | 25 | 20–60 | 0 | 0% | 25 | 100% | ||||||||
| Pepper et al. (2010) [31] | Cross-sectional | USA | 70 | 30.91 | ± | 1.31 | 0 | 0% | 70 | 100% | ||||||
| Pepper et al. (2011) [32] | Cross-sectional | USA | 70 | 29.74 | ± | 1.41 | 0 | 0% | 70 | 100% | ||||||
| Sobhiyeh, Kennedy et al. (2021) [43] | Cross-sectional | USA | 35 | NA | 23 | 66% | 22.7 | ± | 2.9 | 12 | 34% | 22 | ± | 3.2 | ||
| Lee et al. (2015) [44] | Cross-sectional | USA | 121 | 34.38 | ± | 0.98 | 67 | 55% | NA | 54 | 45% | NA | ||||
| Ng et al. (2016) [45] | Cross-sectional | USA | 39 | 44.3 | ± | 15.5 | 20 | 51% | NA | 19 | 49% | NA | ||||
| 37 | 18 | 49% | NA | 19 | 51% | NA | ||||||||||
| Simenko et al. (2016) [50] | Cross-sectional | Slovenia | 31 | 22.1 | ± | 4.63 | 17 | 55% | NA | 14 | 45% | NA | ||||
| Wang et al. (2006) [46] | Cross-sectional | USA | 92 | 6–83 | 44 | 48% | NA | 48 | 52% | NA | ||||||
| Authors and Year of Publication | Scanner Utilised | DA Technology | Comparison Method |
|---|---|---|---|
| Harbin et al. (2018) [33] | Styku body scanner (MYBODEETM, Styku, Los Angeles, CA, USA) | time-of-flight | Manual measurements, BIA and hydrostatic weighing |
| Bourgeois et al. (2017) [34] | KX-16 scanner (TC LABS, Apex, NC, USA) Styku S100 scanner (Styku, Los Angeles, CA, USA) Fit3D Scanner (Redwood City, CA, USA) | structured light time-of-flight structured light ir | Manual measurements, DXA, ADP |
| Koepke et al. (2017) [24] | BS Vitus Smart XXL (Human solution GmbH, Kaiserslautern, Germany) | structured light laser | Manual measurements |
| Garlie et al. (2010) [26] | Cyberware WB4 laser body scanner (Cyberware Inc., Monterey, CA, USA) | structured light laser | Manual measurements and DXA |
| Wagner et al. (2019) [35] | Fit3D Scanner (Redwood City, CA, USA) | structured light ir | Manual measurements and ADP |
| Busic et al. (2020) [49] | BodyRecog mobile 3D scanner (BodyRecog Metrics, Boston, MA, USA) | structured light ir | Manual measurements |
| Sager et al. (2020) [25] | Anthroscan VITUS body scan (Human solution GmbH, Kaiserslautern, German) | structured light laser | Manual measurements |
| Japar et al. (2017) [28] | NX-16 body scanner (Cary, NC, USA) | structured light white light | Manual measurements |
| Cabre et al. (2021) [36] | Styku body scanner (MYBODEETM, Styku, Los Angeles, CA, USA) | time-of-flight | BIA, DXA, ADP |
| Wells et al. (2015) [48] | NX-16 body scanner (Cary, NC, USA) | structured light white light | Manual measurements |
| Wong et al. (2019) [37] | Fit3D Proscanner® (Redwood City, CA, USA) | structured light ir | Manual measurements and DXA |
| Conkle et al. (2018) [38] | AutoAnthro scanner (Occipital, San Francisco, CA, USA) | structured light white light | Manual measurements |
| Heuberger et al. (2008) [29] | VITUS Smart 3D (Human solution GmbH, Kaiserslautern, Germany) | structured light laser | Manual measurements |
| Lu et al. (2010) [51] | Vitronic Vitus-3D 1600 scanning system (Human solution GmbH, Kaiserslautern, Germany) | structured light laser | Manual measurements |
| Beckmann et al. (2019) [27] | VITUS body scan (Human solution GmbH, Kaiserslautern, Germany) | structured light laser | Manual measurements |
| Kennedy et al. (2020) [39] | Naked Body Scanner (Naked Labs Inc., Redwood City, CA, USA) | structured light ir | Manual measurements, DXA |
| Sobhiyeh, Dunkel et al. (2021) [40] | Styku S100 (Los Angeles, CA, USA) Size Stream SS20 (Cary, NC, USA) | time-of-flight structured light ir | ADP and DXA |
| Tinsley, Benavides et al. (2020) [47] | Naked Labs 3D Fitness Tracker (Redwood City, CA, USA) Fit3D Proscanner® (Redwood City, CA, USA) Size Stream SS20 (Cary, NC, USA) Styku S100 (Styku, Los Angeles, CA, California) | structured light ir structured light ir structured light ir time-of-flight | ADP and DXA |
| Kennedy et al. (2022) [42] | Fit3D Proscanner® (Redwood City, CA, USA) Size Stream SS20 (Cary, NC, USA) Styku S100 (Styku, Los Angeles, CA, USA) | structured light ir structured light ir time-of-flight | Manual measurements |
| Tinsley, Adamson et al. (2020) [41] | Naked Labs 3D Fitness Tracker (Redwood City, CA, USA) Fit3D Proscanner® (Redwood City, CA, USA) Size Stream SS20 (Cary, NC, USA) Styku S100 (Styku, Los Angeles, CA, USA) | structured light ir structured light ir structured light ir time-of-flight | 4-component (4C) model (BIA-BIS, DXA, ADP, scale) |
| Milanese et al. (2015) [30] | Breuckmann GmbH Body-SCAN (Breuckmann GmbH, Meersburg, Germany) | structured light white light | DXA |
| Pepper et al. (2010) [31] | Rotatory Laser Body scanner (by Bugao Xu) (University of Texas, Austin, TX, USA) | structured light laser | DXA, hydrostatic weighing |
| Pepper et al. (2011) [32] | Rotatory Laser Body scanner (by Bugao Xu) (University of Texas, Austin, TX, USA) | structured light laser | Manual measurements |
| Sobhiyeh, Kennedy et al. (2021) [43] | Fit3D Proscanner® (Redwood City, CA, USA) Size Stream SS20 (Cary, NC, USA) Styku S100 (Styku, Los Angeles, CA, USA) | structured light ir structured light ir time-of-flight | Manual measurements |
| Lee et al. (2015) [44] | Stereovision body imaging (prototype by Bugao Xu) (University of Texas, Austin, TX, USA) | passive stereo | Manual measurements |
| Ng et al. (2016) [45] | Fit3D Proscanner® (Redwood City, CA, USA) | structured light ir | Manual measurements |
| Simenko et al. (2016) [50] | NX-16 body scanner (Cary, NC, USA) | structured light white light | Manual measurements |
| Wang et al. (2006) [46] | C9036-02 (Hamamatsu Photonics KK, Hamamatsu, Japan) | structured light laser | Manual measurements, hydrostatic weighing |
| Authors and Year of Publication | Summary Statistics | Results | Conclusion | |
|---|---|---|---|---|
| Reliability | Accuracy | |||
| Koepke et al. (2017) [24] | Reliability: Technical Error of Measurement (TEM), intraclass correlation coefficient (ICC) Accuracy: Pearson’s coefficient (r), concordance correlation coefficient (CCC), mean difference (groups), t-test, Bland–Altmann plot | No significant differences between repeated DA and repeated CA, except for CA for chest and waist. TEM in DA (height: 0.45, chest: 1.24, waist: 0.98, buttock 1.18, hip: 1.05) than in CA (height: 0.50, chest: 8.19, waist: 4.36, buttock: 6.84, hip: 2.50); ICCs in CA (chest: 0.968, waist: 0.990, buttock: 0.955, hip: 0.972) and DA (chest: 0.981, waist: 0.993, buttock: 0.997, hip: 0.994), for height (in CA 0.999, in DA 0.998). | Correlation between methods (r between 0.933 and 0.993, CCC between 0.718 and 0.960); buttock circumference (r = 0.828, CCC = 0.258) and significant mean differences (height: −2.01, p < 0.001; chest: 3.88, p < 0.001; waist: 1.17, p < 0.001; buttock: 12.62, p < 0.001; hip: 4.37, p < 0.001); Body shape: significant difference between two methods (WHR: −0.03, p < 0.001; WHtR: 0.01, p < 0.001; BMI: 0.52, p < 0.001); correlation (r 0.979–0.996, CCC 0.920–0.974); WHR (r = 0.857, CCC = 0.673). | The precision and the intraclass correlation coefficients were better in DA than in CA, and the two methods were highly correlated, but there were significant differences between two methods. |
| Busic et al. (2020) [49] | Reliability: coefficient of variation (CV), standard error of estimate (SEM) Accuracy: Pearson’s coefficient (r), coefficient of determination (R2), mean difference (groups), t-test, Bland–Altman plot | Analysis of 15 measures, CVs were >5%, except for the hip circumference (in DA = 4.243%; in CA = 4.295%), and higher in DA (5.265%–10.291%) than in CA (5.090%–10.178%). SEM values were similar between two methods, higher in chest and breast circumferences. | The correlation measured by r (0.865–0.995) and R2 (0.749–0.990) was high in almost all measurements. Significant differences between means in 7 measurements (breast, right and left wrist, right and left upper leg, right and left lower leg circumference) of 15 (p < 0.005). Bland–Altman plots indicated good agreement. | CV values do not demonstrate good performance. The agreement between the methods was good, but there were significant differences in over half of the measurements. |
| Sager et al. (2020) [25] | Accuracy: Spearman Rho, mean difference (groups), Bland–Altman plot | Strong correlation between DA and CA for the height (Spearman Rho = 0.98), waist circumference and WHtR (Spearman Rho = 0.96) and BMI (Spearman Rho = 1). Bland–Altman plot indicated a constant bias for the height and a trend in the upper part of the range in DA than CA. | Body measurements obtained with both methods were strongly correlated; there was a constant bias for DA measures | |
| Japar et al. (2017) [28] | Accuracy: mean difference (groups), t-test | Significant differences between DA and CA for waist (in DA: 85.34 ± 13.36, in CA: 84.63 ± 13.82, p < 0.05) and hip circumferences (in DA: 103.47 ± 11.53, in CA: 94.88 ± 15.08, p < 0.01) and waist to hip ratio (in DA: 0.82 ± 0.02, in CA: 0.89 ± 0.04, p < 0.01). | The DA produced higher readings in waist and hip circumferences compared with CA. | |
| Wells et al. (2015) [48] | Reliability: technical error of measurement (TEM) Accuracy: Pearson’s coefficient (r), coefficient of determination (R2), standard error of estimate (SEE), mean difference (groups), t-test, Bland–Altmann plot | TEM higher in DA (circumference of chest: 1.57, waist: 1.49, knee: 1.36, calf: 0.90) than in CA (circumference of chest: 0.13, waist: 0.06, knee: 0.06, calf: 0.04) | Strong correlation between two methods (r ≥ 0.95, R2 ≥ 0.89, SEE 0.80–2.37). The mean differences of circumferences (chest: 3.67 ± 2.23, waist: 1.36 ± 2.37, knee: 1.39 ± 1.21, calf: 0.62 ± 0.80) and Bland–Altman plots showed a significant (p < 0.0001) and proportional bias. | The reliability was better in CA, and the correlation between DA and CA was strong, but there were biases that varied with outcome size (DA produced larger measures than CA). |
| Conkle et al. (2018) [38] | Reliability: technical error of measurement (TEM) and percentage technical error of measurement (%TEM), coefficient of reliability (R), intraclass correlation coefficient (ICC) Accuracy: mean difference (groups), paired t-test, Bland–Altmann plot | In DA, intraobserver TEM and TEM% (stature 0.62 cm–0.8%, HC 0.41 cm–0.9%, MUAC 0.35 cm–2.3%) and interobserver TEM (stature 0.46 cm–0.5%, HC 0.30 cm–0.7%, MUAC 0.25 cm–1.7%) were higher than in CA intraobserver TEM (stature 0.36 cm–0.4%, HC 0.20 cm–0.4%, MUAC 0.20 cm–1.3%) and interobserver TEM (stature 0.37 cm–0.5%, HC 0.26 cm–0.6%, MUAC 0.24 cm–1.6%). The inter-observer TEM was higher than the intra-observer TEM for CA and not for DA. For CA, total TEM was 0.51 cm for stature, 0.33 cm for HC, 0.31 cm for MUAC, compared with 0.77 cm for stature, 0.51 cm for HC, for 0.43 cm for MUAC for DA. The R and ICC were close to 1.00 for repeated measurements for both techniques. | According to Bland–Altman plots, there were significant differences (p < 0.001) for height (mean difference 0.59 and LoA −0.1–1.2), for head circumference (mean difference 0.32 and LoA −0.1–0.8), and for arm circumference (mean difference −0.19 and LoA −0.6–0.2). | The measures were reliable with both methods, but the precision was better in the CA. The agreement was good, but there was significant bias with an overestimation of height (+0.6 mm) and head circumference (+0.3 mm) and an underestimation for arm circumference (−0.2 mm). |
| Heuberger et al. (2008) [29] | Accuracy: coefficient of determination (R2) | The linear regression R2 of hip (0.63, p < 0.05) and waist-to-hip ratio (0.53, p < 0.05) were significant. For waist, height and weight, the same results were not found; significant differences (p < 0.01) existed between DA and CA for circumferences of hip (DA: 40 ± 4.5 cm; CA: 39 ± 4.7 cm) and waist (DA: 33 ± 4.2 cm; CA: 32 ± 4.2 cm). | The accuracy of measures of hip and waist-to-hip ratio decreased when the measure increased. DA produced an overestimation of waist and hip circumferences. | |
| Lu et al. (2010) [51] | Accuracy: mean difference, t-test | Significant differences between DA and CA in eight of the 12 measurements (shoulder breadth, p = 0.0047; anterior chest breadth, p = 0.0004; cervical to waist length, p = 0.0023; chest circumference, p = 0.0008; waist circumference, p = 0.0090; sleeve length, p = 0.0001; front length, p = 0.008; back length, p = 0.0167). | The accuracy of DA was lower than of CA, probably due to variations caused by human subjects. | |
| Beckmann et al. (2019) [27] | Accuracy: Pearson’s coefficient (r), Spearman Rho, concordance correlation coefficient (CCC), mean difference, t-test, Bland–Altmann plot | The correlation between DA and CA for waist (r = 0.979, CCC = 0.964, Rho = 0.964) and height (r = 0.995, CCC = 0.988, Rho = 0.989) was strong. The mean differences between two methods for waist (−1.50 cm) and height (0.77 cm) were significant (p < 0.001). The agreement at the Bland–Altman plot was very good, but there was a systematic bias. | The correlation was good. The waist circumference was systematically smaller in DA than in CA, and height was less in CA than DA | |
| Kennedy et al. (2022) [42] | Accuracy: t-test, coefficient of determination (R2) of multiple regression, Bland–Altman plot, mean differences (between groups) | All three scanners showed significant mean differences (paired t-test, p < 0.01) with CA (Δ mean: Fit3D Proscanner® (Redwood City, CA, USA), 1.2–4.2 cm; Styku body scanner (Los Angeles, CA, California), 1.0–5.5 cm; Size Stream SS20 (Cary, NC, USA), 1.6–3.4 cm; p < 0.01). The only exception was left thigh measurement by the Fit3D Proscanner® (Redwood City, CA, USA) (Δ mean: 0.3 cm). Linear regression analysis: DA significantly predicted manual measurements (R2: Fit3D Proscanner® (Redwood City, CA, USA), 0.70–0.96; Styku S100 scanner (Los Angeles, CA, USA), 0.54–0.97; Size Stream SS20 (Cary, NC, USA), 0.68–0.97; p < 0.01), with Fit3D Proscanner® (Redwood City, CA, USA) being the best predictor of body size in small children (R2 > 0.70 for all measurements, p < 0.01). Bland–Altman plots displayed significant, systematic bias for Fit3D Proscanner (Redwood City, CA, USA) (all sites: +1.5 cm–4.0 cm), Size Stream SS20 (Cary, NC, USA) (hip and arms +1.6–2.5 cm, thigh −3.0 cm) and Styku S100 (Styku, Los Angeles, CA, USA) (heterogeneous magnitude). | In the processed scans, mean 3DO-tape circumference differences tended to be small (~1–9%) and varied across systems; correlations and bias estimates also varied in strength across anatomic sites and systems. Overall findings differed across devices; the best results were found for the multi-camera stationary system and less so for two rotating single- or dual-camera systems. | |
| Pepper et al. (2011) [32] | Reliability: coefficient of variation (CV), intraclass correlation coefficient (ICC) with 2-way mixed-effects ANOVA Accuracy: standard error of the estimate (SEE), Pearson’s correlation coefficient (r), coefficient of determination (R2) of univariate regression analysis, Bland–Altman Plot | CVs showed little difference between within-subject measurements, with a high level of concordance among 8 repeated measures (CV 0.53–1.68%). All ICCs were ≥0.99, with abdomen, waist and hip showing the highest values (ICC = 1.00) and chest circumference having the lowest ICC = 0.992. | No significant differences for waist, hip, or waist:hip ratio according to Paired samples t-tests (p = 0.05); significant correlation by Pearson’s r (0.998, 0.989, and 0.984 for waist, hip, and waist:hip ratio respectively, p = 0.01). No significant systematic bias in Bland–Altman plots shown by r and regression analysis. No impact of age, BMI, and body size on circumference measurement bias in univariate regression analysis | Body volume estimations by laser body scanner and hydrodensitometry were strongly related, and agreement was high. Measurements of % body fat also agreed strongly with each other between methods, and mean % fat estimates by body imaging did not differ from criterion methods. Body imaging is an accurate measure of body fat compared with dual energy X-ray absorptiometry |
| Sobhiyeh, Kennedy et al. (2021) [43] | Accuracy: mean difference, t-test, coefficient of determination (R2) of linear regression, Bland–Altman plot, root mean square error (RMSE) in regression analysis | Mean circumference values by CA and DA were comparable.Statistically significant differences were observed (absolute mean ∆ ~2 cm across digital scanners and body sites, with a few outliers). Mean systematic differences were negative for Styku S100 scanner (Los Angeles, CA, USA) and positive for Fit3D Proscanner (Redwood City, CA, USA) and Size Stream SS20 (Cary, NC, USA). Relative CA-DA differences were smaller for chest, waist, and hip measurements (∼2–3%) but larger for arms (∼5–7%) and ankles (∼8–10%). Linear regression analysis showed a RMSE of 1–3 cm, with a trend for higher error for Styku; high R2 values were also seen (majority > 0.90, p < 0.001), with a few exceptions for limbs. Bland–Altman plots displayed significant systematic bias in 11/33 evaluations; correlations between CA and DA waist circumference estimates had R2s of 0.95–0.97 (p < 0.001), with measurement bias significant only for the Fit3D Proscanner (Redwood City, CA, USA) (p < 0.05). | Site location error sometimes had a significant impact on various girth measurements. The magnitude of this error varied according to the girth measurement being taken, sex, and BMI. Special care should be applied when measuring girths on females, especially waist girths on lean females. | |
| Simenko et al. (2016) [50] | Reliability: coefficient of variation (CV), standard error of measurement (SEM), intraclass correlation coefficient (ICC) Accuracy: Pearson’s correlation coefficient, coefficient of determination (R2) of univariate linear regression, Bland–Altman plot, mean differences, t-test | DA body circumferences %CV 6.62–11.29, SEM 0.13–0.46 (corresponding manual %CVs and SEMs consistently higher at each body site). Accuracy: 10 out of 14 paired measurements showed statistically significant (p < 0.05) but clinically small differences (Mean differences 0.273–0.974 cm; average relative error 0.006–0.037) with non-significant Bland–Altman plots. High correlation and explained variance in univariate linear regression in all measurements (Pearson’s r > 0.96, R2 > 0.906). | Digital body scan measurements correlated strongly to criterion methods. However, systematic differences were observed for each measure due to discrepancies in landmark positioning. Predictive body composition equations showed strong agreement for whole body and arms, legs and trunk. Visceral fat prediction showed moderate agreement. | |
| Authors and Year of Publication | Summary Statistics | Results | Conclusion | |
|---|---|---|---|---|
| Reliability | Accuracy | |||
| Bourgeois et al. (2017) [34] | Reliability: coefficient of variation (CV) Accuracy: coefficient of determination (R2), root mean square error (RMSE), mean difference (groups), paired t-test, Bland–Altman plot | Comparing the DA and reference method, CV values were lower for CA (between 0.2 and 0.4%) than for DA (between 0.1 and 2.6%), except for the hip circumference with Styku S100 scanner (Styku, Los Angeles, CA, USA) (0.2% in CA, 0.1% in DA), and lower with DXA (between 0.2 and 1.5%) than with DA (between 0.4 and 5.7%), except with the Styku S100 scanner (Los Angeles, CA, USA) for the trunk (0.6% with DXA, 0.3% with the scan) and left leg (1% with DXA, 0.8% with scan). | Measures obtained with DA significantly correlated with CA (R2 0.72–0.96, p < 0.0001, RMSE 1.9–7.7), DXA (R2 0.69–0.99, p < 0.0001, RMSE 0.8–12) and ADP (R2 0.99, p < 0.0001). Significant difference of means between DA and CA, except for waist with KX-16 scanner (TC LABS, Aoex, NC, USA), hip and right thigh with Styku S100 scanner (Styku, Los Angeles, CA, USA) and right arm with Fit3D Proscanner (Redwood City, CA, USA), and between DA and ADP and DXA. Bland–Altman plots showed a significant underestimation, especially for subjects with higher volumes, except for hip circumference and trunk volume, with R2 ranging from 0.0005 to 0.85. | The reliability was higher in the reference methods (tape measurements and DXA). The measurements of circumferences and regional body volume obtained from 3D optical devices were well correlated with those obtained from tape measurements and DXA, but there were significant differences and an underestimation, especially in body volume for larger subjects; total body volume determined by DA were highly correlated with ADP volumes. |
| Wong et al. (2019) [37] | Reliability: coefficient of variation (CV) Accuracy: coefficient of determination (R2), root mean squared error (RMSE), Bland–Altman plot | In CA, %CVs of circumferences (waist: 0.28%, hip: 0.20%, arm: 0.46%, thigh: 0.98%) were lower than CVs in DA (waist: 1.37%, hip: 0.79%, arm: 2.51%, thigh: 2.59%); %CVs of indices of body shape in DA were 1.50% for waist-hip ratio, 1.82% for waist-height ratio and 1.29% for waist-width ratio; %CVs of measures of body composition in DA were 3.30% for FM and 1.34% for FFM. | Strong association between DA and CA for waist circumference (R2 = 0.939, RMSE 3.783) and hip (R2 = 0.987, RMSE 1.828) and between DA and DXA (total body volume: R2 0.995, RMSE 1.618; trunk volume: R2 0.968, RMSE 1.683; arm volume: R2 0.968, RMSE 0.255; leg volume: R2 0.763, RMSE 2.159; %FM: R2 0.855, RMSE 3.630). Bland–Altman plot showed a good agreement for %BF and a size related bias for waist and hip circumferences and regional body volumes. | Each method was reliable and estimates of 3D body composition and circumferences were strongly associated with the manual measurements and DXA. With the strong correlation and low RMSE, 3D can substitute as a reasonable alternative method if DXA is not available. There was an overestimation of waist and hip circumferences and the volumes for total body, leg and arm and an underestimation for trunk volume. |
| Kennedy et al. (2020) [39] | Reliability: coefficient of variation (%CV), mean difference (among repeated measures) Accuracy: paired t-test, coefficient of determination (R2) of multiple regression, Bland–Altman plot, root mean square error (RMSE) in regression analysis, mean group differences (between methods) | Naked Body Scanners (Naked Labs Inc., Redwood City, CA, USA) showed lower repeatability than CA for body circumferences (CV 0.4–2.7% vs. 0.2–0.4%). The average mean difference between duplicate measurements by DA was 0.4 ± 0.4 cm for hip and 0.7 ± 0.7 cm for waist circumferences (CA: 0.2 ± 0.4 cm for all locations). The most precise measurement was hip circumference (DA:CV = 0.4%; CA:CV = 0.2%). %BF was consistent among repeated measures by DA (CV = 2.4%). | Mean group differences between DA and CA ranged from 1.5 cm (arms) and 3.2 cm (thighs). Only hip circumference was not significantly different between the two methods. For all sites, explained variance in linear regression by DA was high (R2s, 0.84–0.97; p < 0.0001). Bland–Altman plots displayed how the Naked Body Scanners (Naked Labs Inc., Redwood City, CA, USA) significantly overestimated waist circumferences by ~2.0 cm compared with CA (p < 0.0001). Significant bias was also found for left and right thighs, with a mean overestiamtion of ~3.0 cm (p < 0.0001). %BF: no significant difference between DA and DXA, with a linear regression R2 = 0.73 (p < 0.0001). Bland–Altman plot revealed a quasi-significant systematic bias by DA to underestimate %BF (p = 0.09). | DA exhibited greater variation in test–retest reliability between the six measured anatomic locations compared with manual measurements. All six device-derived circumferences correlated with flexible tape references. The %fat estimates correlated with DXA results with no significant bias. |
| Pepper et al. (2010) [31] | Reliability: coefficient of variation (CV), intraclass correlation coefficient (ICC) Accuracy: Pearson’s correlation coefficient (r), coefficient of determination (R2) of univariate linear regression, standard error of the estimate (SEE), ICC (between methods) | Volumes: all ICCs were ≥0.99, with thigh volume having the lowest ICC (0.997). CVs showed little difference between within-subject measurements, with total body volume the most reliable (CV 0.41%) and thigh volume the most variable (CV 2.26%). | %BF showed good agreement among all methods, with an overall ICC = 0.86 (p < 0.01); RM-ANOVA showed no significant difference after pairwise comparison between DA and DXA or hydrodensitometry mean %BF (p = 0.81 and 0.43, respectively). | Evaluation of waist and hip circumferences measured by body scanner did not differ significantly from tape measure (p < 0.05), with no bias between laser scanning and tape measure. The 3-dimensional laser body scanner is reliable and valid in order to estimate waist and hip circumference compared with tape measure. |
| Ng et al. (2016) [45] | Reliability: coefficient of variation (CV). Accuracy: mean difference, paired t-test, coefficient of determination (R2) of stepwise multiple regression, root mean square error (RMSE) | Good test-retest precision with %CV < 5% in almost all measurements: 0.75–2.24% (circumferences), 0.81–3.45% (surface area), volume (0.91–4.49%). Higher CV% in derived regional FM and FFM (VAT: 6.69%; Arms FFM: 6.67%; Arms FM: 11.63%). RMSE 0.03–1.41 (generally 0.5–0.7). | For calibration group, significant paired t-test for waist and hip circumferences. Mean differences were 1.75 cm (CI 0.58–2.91) and 3.17 cm (CI 1.43–4.41), respectively. High association with ADP and DXA whole body volumes were observed (R2 = 0.99 and 0.97, respectively). Regional DA volume estimates showed strong correlation with DXA measured counterparts (R2 = 0.73–0.97), with less volume included in limbs and relatively more volume in the trunk compartment (all p < 0.001). | The R2 of the prediction equations for fat mass and percent body fat were 93.2% and 76.4% for android, and 91.4% and 66.5% for gynoid, respectively. Prediction values for fat mass and percent fat were 94.6% and 88.9% for total body, 93.9% and 71.0% for trunk, and 92.4% and 64.1% for leg, respectively |
| Wang et al. (2006) [46] | Reliability: coefficient of variation (CV), intraclass correlation coefficient (ICC). Accuracy: paired t-test, Pearson’s correlation coefficient, coefficient of determination (R2), standard error of the estimate (SEE), mean absolute differences | Lowest CVs for circumferences (0.9) and partial thigh length (1.2). As for volumes, the CVs ranged from 1.9 to 2.5 for head, upper and lower limbs and torso volumes, while total-body volume showed a CV = 0.4. All ICCs > 0.97 (lenghts, volumes, circumferences). | No significant difference in %BF according to paired t-tests between 3DPS and UWW (p = 0.4801), although differences were higher than in volumes. Total body volumes between 3DPS and UWW showed high linear correlation with R2 = 0.999 and SEE = 0.892 L, with DA showing significant slightly greater values than UWW (p < 0.001). Body circumferences values by DA were slightly greater than CA ones (p < 0.001). | Body shape of white American adults differs from that of their UK counterparts. Among Americans, ethnic differences in body shape closely track reported differences in prevalence of metabolic syndrome. 3D photonic scanning offers a novel approach for categorizing the risk of metabolic syndrome. |
| Tinsley, Benavides et al. (2020) [47] | Reliability: RMS-% CV (=%TEM), coefficient of variation (CV), intraclass correlation coefficient (ICC) with 2-way mixed-effects ANOVA. Accuracy: coefficient of determination (R2) of univariate linear regression, Bland–Altman plot, root mean square error (RMSE) in regression analysis | Body circumferences: all body scanners showed high precision with ICCs 0.974–0.999. When averaged across all body regions, the four body scanners produced a RMS-% CV of 1.1–1.3%, with the lowest value for hip (RMS-% CV < 1% for all), followed by waist (0.7–1.6%) and thigh (0.8–1.4%), neck (1.2–2.0%), and arm circumferences (1.4–2.8%). Three scanners measured body volumes, with ICCs 0.952–0.999. When averaged across all body regions, RMS-% CV was 1.9–2.3%, with the lowest value for total body (RMS-% CV < 1% for all), followed by torso (~1.2%), leg (~2.5%), and arm (~3 to 5%) volumes. | Total BV: strong linear correlation was observed between DA and reference methods (R2: 0.98–1.0); significant overestimation by Size Stream® (Cary, NC, USA) and underestimation by Styku S100 scanner® (Los Angeles, CA, USA) was observed (p < 0.01) and no true equivalence from Fit3D Proscanner® (Redwood City, CA, USA) (in contrast to all DXA-derived equations). Bland–Altman plots showed systematic proportional bias of various degrees for all four scanners. DA RMSE: 4.2–10.5 L, with LoA 2.9–5.3 L (both larger compared with DXA-related indices). Similar accuracy issues (strong linear correlation with significant overestimation and proportional bias) were reported in regional volumes. | All scanners produced precise estimates. Precision for circumferences generally decreased in the order of: hip, waist and thigh, chest, neck, and arms. Precision for volumes generally decreased in the order of: BV, torso, legs, and arms. No total or regional 3DO volume estimates exhibited equivalence with reference methods using 5% equivalence regions, and proportional bias of varying magnitudes was observed. |
| Study | Random Error
| Systematic Error or Bias Accuracy or Validity Accuracy (Validity): Accuracy and Validity Are Used Synonymously | |||||||||||||
|---|---|---|---|---|---|---|---|---|---|---|---|---|---|---|---|
| P | AR | RR | Correlation, at a Mean Level | Agreement or Concordance at an Individual Level | |||||||||||
| TEM | %TEM | PE | CV | SEM | R | ICC | r | R2 | SEE | RMSE | CCC | Δ Means | t-Test | Bland–Altman Plot | |
| Harbin et al. (2018) [33] | X | X | X | X | |||||||||||
| Garlie et al. (2010) [26] | X | X | X | X | X | X | |||||||||
| Sobhiyeh, Kennedy et al. (2021) [43] | X | X | X | X | X | ||||||||||
| Tinsley, Benavides et al. (2020) [47] | X | X | X | X | X | X | X | X | |||||||
| Kennedy et al. (2022) [42] | X | X | X | X | |||||||||||
| Tinsley, Adamson et al. (2020) [41] | X | X | X | X | X | X | X | ||||||||
| Pepper et al. (2010) [31] | X | X | X | X | X | X | X | X | |||||||
| Pepper et al. (2011) [32] | X | X | X | X | X | X | |||||||||
| Lee et al. (2015) [44] | X | X | X | ||||||||||||
| Wang et al. (2006) [46] | X | X | X | X | X | X | X | ||||||||
| Bourgeois et al. (2017) [34] | X | X | X | X | X | X | |||||||||
| Wagner et al. (2019) [35] | X | X | X | X | X | X | X | X | |||||||
| Cabre et al. (2021) [36] | X | X | X | X | X | X | X | ||||||||
| Wong et al. (2019) [44] | X | X | X | X | |||||||||||
| Conkle et al. (2018) [38] | X | X | X | X | X | ||||||||||
| Heuberger et al. (2008) [29] | X | ||||||||||||||
| Kennedy et al. (2020) [39] | X | X | X | X | X | X | |||||||||
| Sobhiyeh, Dunkel et al. (2021) [40] | X | X | |||||||||||||
| Koepke et al. (2017) [24] | X | X | X | X | X | X | X | ||||||||
| Sager et al. (2020) [25] | X | X | |||||||||||||
| Beckmann et al. (2019) [27] | X | X | X | X | X | ||||||||||
| Wells et al. (2015) [48] | X | X | X | X | X | X | X | ||||||||
| Busic et al. (2020) [49] | X | X | X | X | X | X | X | ||||||||
| Simenko et al. (2016) [50] | X | X | X | X | X | X | X | X | |||||||
| Japar et al. (2017) [28] | X | X | |||||||||||||
| Milanese et al. (2015) [30] * | X | X | X | X | X | ||||||||||
| Lu et al. (2010) [51] | X | X | |||||||||||||
| Ng et al. (2016) [45] | X | X | X | X | X | ||||||||||
| Authors and Year of Publication | Summary Statistics | Results | Conclusion | |
|---|---|---|---|---|
| Reliability | Accuracy | |||
| Harbin et al. (2018) [33] | Accuracy: Pearson’s coefficient (r), mean difference (groups), Bland–Altmnn plot | The correlation between DA and other methods for %BF was measured: r was 0.816 with HW, 0.888 with BIA, 0.817 with skinfolds, and 0.875 with circumferences. According to Bland–Altman plot, there was a proportional bias when measuring %BF in DA compared with circumferences (mean differences: −3.20 ± 9.022, LoA: −12.22–5.822), skinfolds (mean differences: −1.743 ± 1.133, LoA: −12.88–9.391), BIA (mean differences: −1.954 ± 8.167, LoA: −10.12–6.213), HW (mean differences: −4.704 ± 9.808, LoA: −14.51–5.104) and a reduced accuracy among subjects with increased adiposity. | The %BF from 3D was underestimated compared with other methods, and there was a proportional bias, probably attributable to inconsistencies with landmark and partition position in the 3D scan analysis algorithm. | |
| Wagner et al. (2019) [35] | Reliability: standard error of measurement (SEM), intraclass correlation coefficient (ICC) Accuracy: Pearson’s coefficient (r), coefficient of determination (R2), standard error of estimate (SEE), mean difference (groups), t-test, Bland–Altman plot | The ICC and the SEM for the DA was 0.995 and 0.57, showing a high test-retest reliability. | There was a high correlation between DA and ADP for %BF (r = 0.899, r2 = 0.809, SEE 4.13%), but the mean difference (mean DA: 24 ± 6.8%; mean ADP: 21.9 ± 9.4%) and Bland–Altman (r = −0.597, LoA −6.7 to 11%) showed a significant (p < 0.001) and proportional bias with an overestimation of the lean body. | The scanner overestimated participants at the lean end of the sample and underestimated participants with the most body fat, not providing valid estimates of %BF compared with ADP. |
| Garlie et al. (2010) [26] | Accuracy: Pearson’s coefficient (r), concordance correlation coefficient (CCC), standard error of estimate (SEE), mean difference (groups), paired t-test, Bland–Altman plot | %BF measured by DA was correlated with %BF measured by DXA (r = 0.74, SEE 3.2, p < 0.05) and by CA (r = 0.96, SEE 1, p < 0.05). CCC revealed a moderate and statistically significant concordance correlation between DA and DXA (rho_c: 0.74) and DA and CA (rho_c: 0.96). There were no significant differences between DA and CA for height, neck and waist circumferences or between DA and DXA for %BF (mean differences: 0.11% ± 3.1%, LoA: −6.06–6.28%). | The correlation and concordance were high with DA and there were no significant differences of means. | |
| Cabre et al. (2021) [36] | Accuracy: Pearson’s coefficient (r), coefficient of determination (R2), standard error of estimate (SEE), root mean square error (RMSE), mean difference (groups), t-test, Bland–Altman plot | Strong correlation between 3D and DXA and 4C (for DXA: %BF r = 0.86, R2 = 0.74; %BF with 4C, r = 0.80, R2 = 0.63; FM with 4C FM, r = 0.9, R2 = 0.81; FFM r = 0.9, R2 = 0.88; for 4C: %BF, r = 0.80, R2 = 0.63; FM, r = 0.85, R2 = 0.72; FFM, r = 0.92, R2 = 0.84), and SEE was fairly good in %BF with DXA (4.20%), good in FM with DXA (2.91 kg), fair in FFM with DXA (3.77 kg) and FM with 4C (3.64 kg), poor in %BF and FFM with 4C (5.31% and 4.76 kg, respectively). The differences between DA and DXA were −0.10% for %BF, −0.28 kg for FM and −0.10 kg for FFM. Differences between DA and 4C were higher: 4.13% for %BF, 2.66 kg for FM, −3.15 kg for FF. According to paired t-test and Bland– Altman plot, there were significant differences between DA and 4C, not for values between DA and DXA but the LoA was wide (%BF: −8.46–8.25; FM: −5.99–5.42; FFM: −7.68–7.48). | DA produced acceptable measurements compared with DXA, and the two methods were in good agreement, especially in those with normal or high lean mass, but the LoA was wide so the agreement should be interpreted with caution. DA does not appear to be valid against 4C models. | |
| Sobhiyeh, Dunkel et al. (2021) [40] | Accuracy: one-way ANOVA, Pearson’s correlation coefficient (r), coefficient of determination (R2) of stepwise multiple regression, mean absolute error (MAE) | Volumes: total body volume measured by DXA and ADP showed high linear correlation with DA using a universal software (R2 0.98, MAE 1.34–2.17 for Styku S100 scanner® (Styku, Los Angeles, CA, USA); R2 = 1.00, MAE 1.19–1.79 for SS20 Size Stream SS20® (Cary, NC, USA)); a slight significant underestimation by Styku was observed. As for regional volumes, good agreement between DA and DXA was seen the regional volumes calculated by DXA (arms: R2 0.75 vs. 0.79, legs: R2 0.86 vs. 0.89, trunk: R2 0.97 vs. 0. 98, for Styku S100 scanner® (Styku, Los Angeles, CA, USA) vs. SS20 Size Stream SS20® (Cary, NC, USA). However, a significant though positive bias in the head-neck region was observed, with R2 0.43–0.59. Fat mass (FM) calculated with Siri equation: total FM by DA strongly agreed with DXA counterpart (R2 = 0.84 vs. 0.86, Styku S100 scanner® (Styku, Los Angeles, CA, USA) vs. SS20 Size Stream SS20® (Cary, NC, USA). Appendicular fat masses estimated by the universal software also showed good agreement with DXA regional fat masses (R2 0.72–0.88 for Styku S100 scanner® (Styku, Los Angeles, CA, USA) and R2 0.76–0.85 for SS20 Size Stream SS20® (Cary, NC, USA)), which were still lower than ADP values. | Total body and regional volumes measured by DXA and ADP had strong associations with corresponding estimates from the commercial 3D optical scanners coupled with the universal software. Regional body volumes also had strong correlation between DXA and the 3DO scanners. Similarly, there were strong associations between DXA-measured total body and regional fat mass and 3D optical estimates calculated by the universal software. Absolute differences in volumes and fat mass between the reference methods and the universal software values appeared. | |
| Tinsley, Adamson et al. (2020) [41] | Reliability: relative technical error of measurement (%TEM = RMS-% CV), precision error (PE), intraclass correlation coefficient (ICC) with 2-way mixed-effects ANOVA. Accuracy: mean difference, Bland–Altman plot, concordance correlation coefficient (CCC), root mean square error (RMSE) in regression analysis | All body scanners showed ICCs 0.975–0.999 (p < 0.0001). Naked 3D Fitness Trackers® (Redwood City, CA, USA), Styku S100 scanner® (Styku, Los Angeles, CA, USA), and Size Stream SS20® (Cary, NC, USA) were the most precise in terms of %BF (PE 0.5–0.7%, RMS-% CV 2.3–2.9%), with FIT3D Proscanner® (Redwood City, CA, USA)® showing slightly higher errors (PE: 1.0–1.1%; CV: 4.0–4.3%). All scanners showed similar precision for FM (kg), while FFM exhibited a RMS-% CV 0.7–1.4% for all scanners. | Size Stream SS20® (Cary, NC, USA), FIT3D Proscanner® (Redwood City, CA, USA), and Naked 3D Fitness Trackers® (Redwood City, CA, USA) were equivalent to the 4C model in terms of %BF, FM, and FFM (5% equivalence region = ±1.3% body fat, ±1.0 kg FM, and ±2.7 kg FFM). All scanners CCCs: 0.74–0.90 (%BF), 0.85–0.95 (FM), 0.93–0.97 (FFM). FIT3D Proscanner® (Redwood City, CA, USA) displayed the lowest RMSE for all variables (2.8 kg for FM and FFM; 3.7% for %BF), similar to Naked 3D Fitness Trackers® (Redwood City, CA, USA) and Size Stream SS20® (Cary, NC, USA); Styku S100 scanner® (Styku, Los Angeles, CA, USA) displayed the largest RMSE (4.6 kg for FM and FFM, 6.1% for %BF). Bland–Altman plots showed that FIT3D Proscanner® (Redwood City, CA, USA) had narrowest LoA (±7% for %BF and ±~5.5 kg for FM and FFM), with slightly higher values for all other scanners (±~9.0–9.5% for %BF and ±~7.0 kg for FM and FFM). Proportional bias was largest for %BF, with regression coefficients ± 0.1–0.3 for all scanners (p < 0.01). Naked 3D Fitness Trackers® (Redwood City, CA, USA) showed no systematic bias for FM, and Styku S100 scanner® (Styku, Los Angeles, CA, USA) showed no systematic bias for FFM. | All scanners produced reasonably reliable estimates and, except Styku, demonstrated equivalence with 4C, using 5% equivalence regions, and constant errors of <1% for %BF and 0.5 kg for FM and FFM. |
| Milanese et al. (2015) [30] | Accuracy: paired t-test, Pearson’s correlation coefficient (r), coefficient of determination (R2) of multiple linear regression, standard error of the estimate (SEE) | All pre-post absolute changes in DA whole-body FM showed fair linear correlation with DXA counterparts (r > 0.5); 4 out of 6 regional DA trunk FM changes correlated with DXA measurements. As for relative changes, only TB %FM and trunk % FM correlated with their respective DA measurements. When individually used as predictor variables in simple linear regression analysis, several DA anthropometric measurements produced significant models (p < 0.05, adjusted R2 12.0–39.9%) with no improvement when implemented in a stepwise regression analysis. | Variation in DXA-measured FM and % FM (at both the TB and trunk level) of women with obesity after exercise training showed several significant correlations, with variation in automatic digital anthropometric measurements. | |
| Lee et al. (2015) [44] | Accuracy: coefficient of determination (R2) of stepwise multiple regression, standard error of the estimate (SEE), mean errors, Bland–Altman plot | Prediction equations for android and gynoid FM (kg) showed higher prediction values (R2 93.2% android and 91.4% gynoid) than %BF (76.4% android and 66.5% gynoid). Total and regional body FM (kg) was better predicted (R2 from 92.4 to 94.6%), as opposed to predicted %BF (R2 from 64.1 to 89.9%). Cross-validation of the proposed equations showed no statistical difference between DXA and predicted body fat by the equation (all mean error CI included 0). Android and gynoid FM and %BF data distribued within Bland–Altman plots, 95% LoA with few outliers and a systematic bias ~0 cm. | Overall, group mean digital and conventional body circumferences values were in good agreement, with ∼2 cm systematic differences and highly correlated (all p values < 0.01). The bias tended to be small, but significant depending on anatomic site and device. | |
| Outcomes | Risk of Bias | Inconsistency | Indirectness | Imprecision | Publication Bias | Overall Quality of Evidence |
|---|---|---|---|---|---|---|
| Anthropometric measures | Serious | Not serious | Not serious | Serious | Not serious |  |
| Body composition | Serious | Not serious | Serious | Serious | Not serious | |
Disclaimer/Publisher’s Note: The statements, opinions and data contained in all publications are solely those of the individual author(s) and contributor(s) and not of MDPI and/or the editor(s). MDPI and/or the editor(s) disclaim responsibility for any injury to people or property resulting from any ideas, methods, instructions or products referred to in the content. |
© 2023 by the authors. Licensee MDPI, Basel, Switzerland. This article is an open access article distributed under the terms and conditions of the Creative Commons Attribution (CC BY) license (https://creativecommons.org/licenses/by/4.0/).
Share and Cite
Mocini, E.; Cammarota, C.; Frigerio, F.; Muzzioli, L.; Piciocchi, C.; Lacalaprice, D.; Buccolini, F.; Donini, L.M.; Pinto, A. Digital Anthropometry: A Systematic Review on Precision, Reliability and Accuracy of Most Popular Existing Technologies. Nutrients 2023, 15, 302. https://doi.org/10.3390/nu15020302
Mocini E, Cammarota C, Frigerio F, Muzzioli L, Piciocchi C, Lacalaprice D, Buccolini F, Donini LM, Pinto A. Digital Anthropometry: A Systematic Review on Precision, Reliability and Accuracy of Most Popular Existing Technologies. Nutrients. 2023; 15(2):302. https://doi.org/10.3390/nu15020302
Chicago/Turabian StyleMocini, Edoardo, Camillo Cammarota, Francesco Frigerio, Luca Muzzioli, Claudia Piciocchi, Doriana Lacalaprice, Fabio Buccolini, Lorenzo Maria Donini, and Alessandro Pinto. 2023. "Digital Anthropometry: A Systematic Review on Precision, Reliability and Accuracy of Most Popular Existing Technologies" Nutrients 15, no. 2: 302. https://doi.org/10.3390/nu15020302