
Relationship between Animal Sourced Food Consumption and Early Childhood Development Outcomes
 , , ,
, , ,
Abstract
:1. Introduction
2. Materials and Methods
2.1. Data Collection
2.2. Anthropometric Data
2.3. ECD Assessment
2.4. Child’s Diet and ASF Consumption
- ASF consumption: defined as having consumed any ASF in the past 24 h (yes/no, binary variable).
- Number of ASF consumed: defined as the total number of different ASF consumed in the past 24 h (possible range from 0 to 10). For instance, if a child consumed milk, meat, and eggs in the past 24 h, then the score equals 3.
- ASF consumption frequency: defined as the total number of times each ASF was consumed by the child in the past 24 h. For instance, if a child consumed milk thrice and eggs once respectively in the past 24 h, then the score equals 4.
- Cumulative number of ASF consumed: defined as the total number of ASF consumed in the past 24 h cumulated for all 4 time points (i.e., 6, 9, 12 and 18 months). For example, if for a child, the variable “number of ASF consumed” at each round of data collection was two, the cumulative number of ASF variable for that child is 8.
- Cumulative ASF consumption frequency: defined as the total number of times each type of ASF consumed in the past 24 h cumulated for 4 time points. For example, if the variable “the ASF consumption frequency” at each time point was 4, the cumulative ASF consumption frequency variable is 16.
2.5. Other Characteristics and Variables
2.6. Statistical Analysis
3. Results
3.1. Descriptive Characteristics
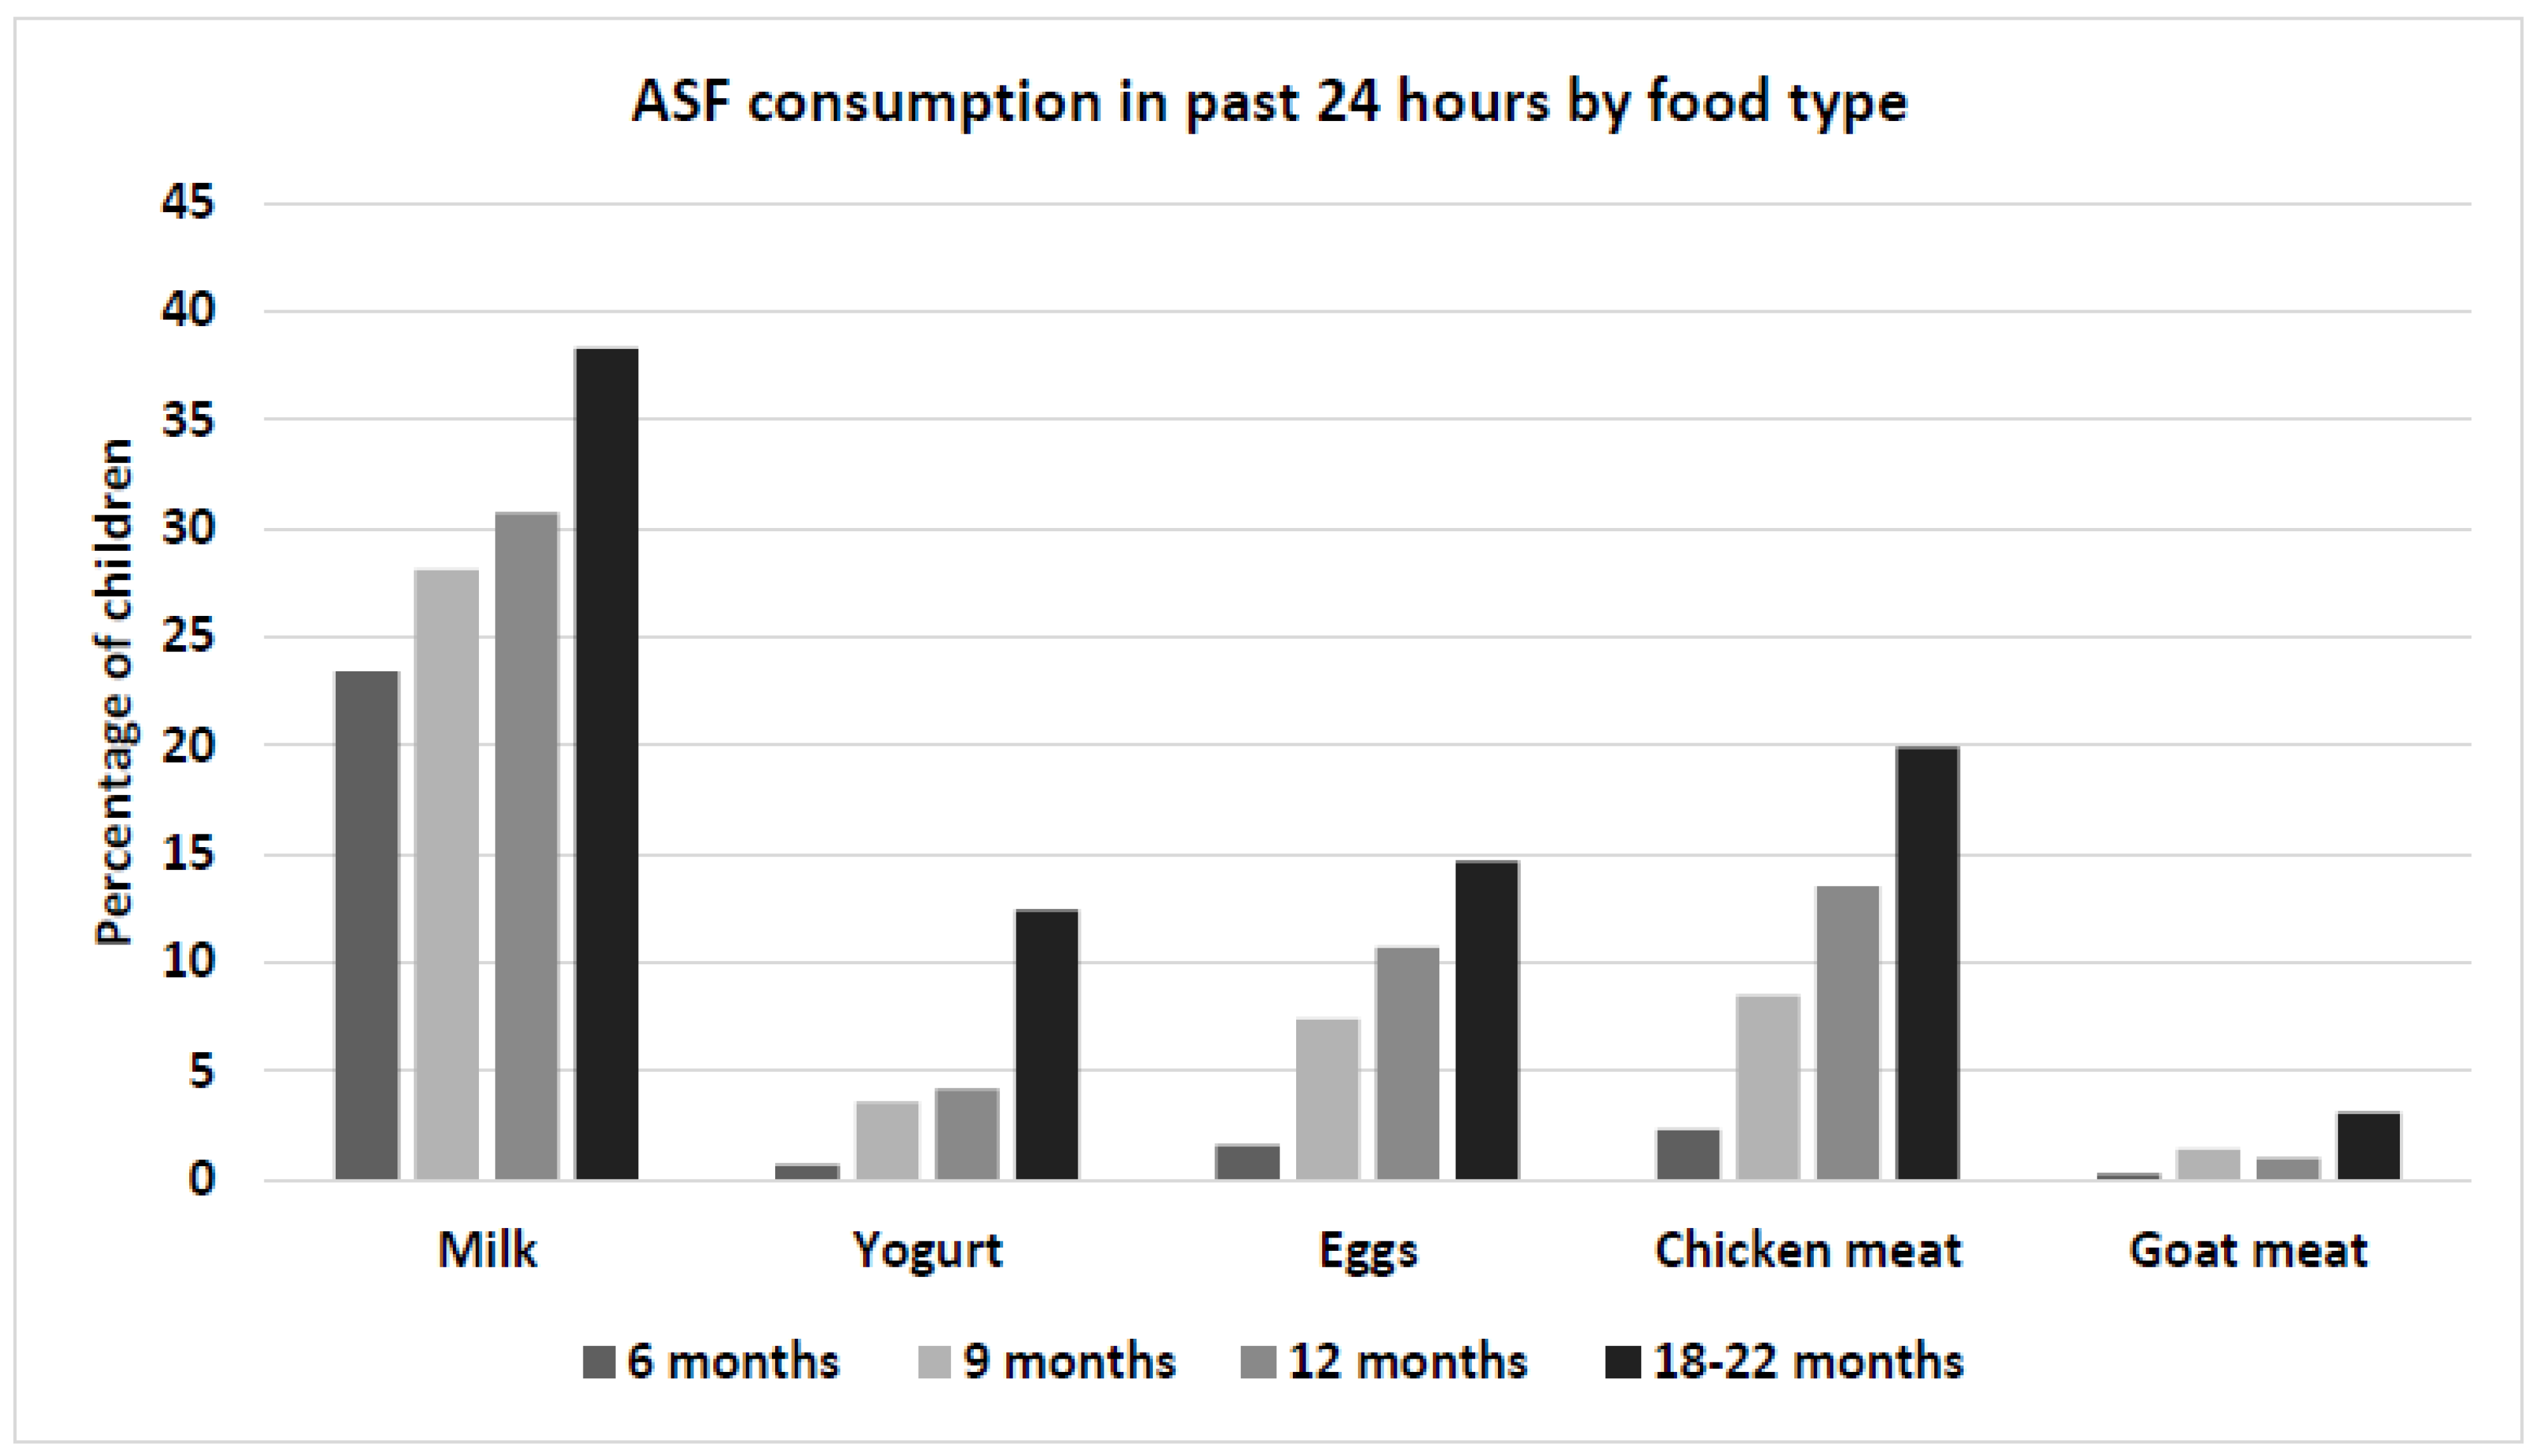
3.2. Child Diet
3.3. Bi-Variate Associations
3.4. Relationship between ASQ Scores and ASF Consumption
3.5. Relationship between HCZ and ASF Consumption and LAZ and ASF Consumption
4. Discussion
5. Conclusions
Author Contributions
Funding
Institutional Review Board Statement
Informed Consent Statement
Data Availability Statement
Acknowledgments
Conflicts of Interest
Appendix A


| Total ASQ Score | HCZ Score | LAZ Score | ||||
|---|---|---|---|---|---|---|
| β | Robust S.E. | β | Robust S.E. | β | Robust S.E. | |
| Female child | 0.71 | (3.49) | −0.12 | (0.06) | −0.03 | (0.10) |
| Child age | −3.51 | (2.59) | 0.00 | (0.04) | 0.03 | (0.04) |
| Mother’s schooling (REF: None) | ||||||
| Primary | 6.84 | (6.83) | −0.05 | (0.08) | 0.23 * | (0.09) |
| Secondary | 9.93 | (4.98) | 0.08 | (0.09) | 0.60 *** | (0.12) |
| More than Secondary | 11.65 | (6.97) | 0.37 * | (0.13) | 0.78 *** | (0.13) |
| Household Wealth Quintile (REF: Poorest) | ||||||
| Poor | −2.59 | (6.98) | −0.01 | (0.07) | 0.05 | (0.14) |
| Middle | 0.67 | (5.50) | 0.00 | (0.07) | 0.03 | (0.09) |
| Rich | 3.07 | (5.26) | 0.27 * | (0.12) | 0.07 | (0.12) |
| Richest | 4.46 | (6.53) | 0.16 | (0.09) | −0.16 | (0.10) |
| LAZ at 24 months | 14.11 *** | (1.98) | - | - | - | - |
| HCZ at 24 months | 1.40 | (1.89) | - | - | - | - |
| Daily legumes and nuts consumption (Y/N) | ||||||
| at 6 months | −0.91 | (4.02) | 0.19 | (0.10) | 0.12 | (0.10) |
| at 9 months | 0.29 | (4.65) | −0.01 | (0.09) | −0.03 | (0.07) |
| at 12 months | 9.51 | (4.79) | 0.03 | (0.11) | −0.18 | (0.12) |
| at 18 months | 4.85 | (5.68) | −0.05 | (0.08) | 0.05 | (0.10) |
| Daily vitamin A rich food consumption (Y/N) | ||||||
| at 9 months | −0.97 | (2.54) | 0.21 * | (0.08) | 0.17 * | (0.06) |
| at 12 months | −0.45 | (4.92) | −0.06 | (0.06) | 0.15 | (0.11) |
| at 18 months | −1.91 | (4.21) | 0.03 | (0.05) | 0.15 * | (0.06) |
| Daily other fruits and vegetables consumption (Y/N) | ||||||
| at 6 months | −0.16 | (4.84) | 0.08 | (0.05) | 0.10 | (0.08) |
| at 9 months | 2.25 | (2.86) | 0.08 | (0.05) | 0.07 | (0.07) |
| at 12 months | 0.94 | (3.29) | 0.02 | (0.09) | 0.21 | (0.12) |
| at 18 months | 13.50 * | (5.49) | 0.10 | (0.08) | 0.00 | (0.06) |
| Daily ASF consumption (Y/N) | ||||||
| at 6 months | −0.45 | (3.47) | 0.02 | (0.09) | 0.06 | (0.08) |
| at 9 months | 4.02 | (2.59) | 0.09 | (0.08) | 0.16 | (0.09) |
| at 12 months | −2.54 | (3.99) | −0.08 | (0.06) | 0.11 * | (0.05) |
| at 18 months | 8.98 ** | (2.95) | 0.24 *** | (0.06) | 0.13 | (0.12) |
| n | 700 | 701 | 700 | |||
| Adjusted R-square | 0.21 | 0.12 | 0.18 | |||
| Total ASQ Score | HCZ Score | LAZ Score | ||||
|---|---|---|---|---|---|---|
| β | Robust S.E. | β | Robust S.E. | β | Robust S.E. | |
| Female child | 0.30 | (3.42) | −0.12 | (0.06) | −0.03 | (0.10) |
| Child age | −3.20 | (2.78) | 0.01 | (0.04) | 0.03 | (0.04) |
| Mother’s schooling (REF: None) | ||||||
| Primary | 6.70 | (7.23) | −0.08 | (0.07) | 0.18 | (0.09) |
| Secondary | 10.12 | (5.03) | 0.06 | (0.09) | 0.56 *** | (0.12) |
| More than Secondary | 11.35 | (7.71) | 0.35 * | (0.13) | 0.76 *** | (0.13) |
| Household Wealth Quintile (REF: Poorest) | ||||||
| Poor | −2.38 | (7.01) | −0.02 | (0.08) | 0.05 | (0.14) |
| Middle | 0.92 | (5.23) | −0.02 | (0.06) | 0.04 | (0.10) |
| Rich | 2.40 | (4.56) | 0.23 * | (0.11) | 0.04 | (0.13) |
| Richest | 5.19 | (6.26) | 0.17 | (0.08) | −0.15 | (0.10) |
| LAZ at 24 months | 14.00 *** | (2.10) | - | - | - | - |
| HCZ at 24 months | 1.80 | (1.92) | - | - | - | - |
| Daily number of grains and tubers consumed | ||||||
| at 6 months | 3.60 | (3.07) | −0.06 | (0.06) | −0.03 | (0.06) |
| at 9 months | −0.21 | (2.49) | −0.03 | (0.04) | −0.07 | (0.05) |
| at 12 months | 0.47 | (2.01) | −0.02 | (0.03) | 0.03 | (0.04) |
| at 18 months | −0.15 | (0.20) | 0.01 | (0.01) | 0.01 *** | (0.00) |
| Daily number of legumes and nuts consumed | ||||||
| at 6 months | −4.96 | (3.38) | 0.14 | (0.09) | 0.09 | (0.09) |
| at 9 months | 0.87 | (2.90) | −0.02 | (0.05) | 0.06 | (0.03) |
| at 12 months | 5.33 | (2.80) | 0.07 | (0.07) | −0.06 | (0.06) |
| at 18 months | 0.43 | (1.85) | −0.00 | (0.03) | 0.03 | (0.05) |
| Daily number of vitamin A rich food consumed | ||||||
| at 9 months | −1.56 | (2.20) | 0.21 * | (0.07) | 0.12 | (0.06) |
| at 12 months | −0.48 | (4.36) | −0.07 | (0.07) | 0.12 | (0.10) |
| at 18 months | −2.07 | (3.52) | −0.00 | (0.04) | 0.11 | (0.05) |
| Daily number of other fruits and vegetables consumed | ||||||
| at 6 months | −0.74 | (3.35) | 0.06 | (0.04) | 0.03 | (0.06) |
| at 9 months | 0.01 | (1.73) | 0.05 | (0.03) | 0.10 | (0.05) |
| at 12 months | −1.21 | (1.94) | 0.04 | (0.04) | 0.06 | (0.04) |
| at 18 months | 2.84 | (1.50) | 0.04 | (0.02) | 0.04 | (0.02) |
| Daily number of ASF consumed | ||||||
| at 6 months | −0.70 | (3.16) | 0.05 | (0.08) | 0.03 | (0.08) |
| at 9 months | 1.69 | (1.77) | 0.01 | (0.06) | 0.06 | (0.05) |
| at 12 months | 0.63 | (2.22) | −0.07 | (0.05) | 0.06 | (0.04) |
| at 18 months | 2.89 | (1.86) | 0.13 ** | (0.04) | 0.06 | (0.06) |
| n | 700 | 701 | 700 | |||
| Adjusted R-square | 0.20 | 0.13 | 0.18 | |||
| Total ASQ Score | HCZ Score | LAZ Score | ||||
|---|---|---|---|---|---|---|
| β | Robust S.E. | β | Robust S.E. | β | Robust S.E. | |
| Female child | 0.43 | (3.32) | −0.10 | (0.06) | −0.02 | (0.10) |
| Child age | −3.04 | (2.85) | 0.01 | (0.04) | 0.02 | (0.04) |
| Mother’s schooling (REF: None) | ||||||
| Primary | 7.05 | (7.15) | −0.09 | (0.08) | 0.19 * | (0.09) |
| Secondary | 11.71 * | (4.87) | 0.04 | (0.09) | 0.55 *** | (0.13) |
| More than Secondary | 15.07 | (7.73) | 0.38 ** | (0.13) | 0.75 *** | (0.11) |
| Household Wealth Quintile (REF: Poorest) | ||||||
| Poor | −1.97 | (7.42) | −0.00 | (0.08) | 0.04 | (0.13) |
| Middle | 1.33 | (5.22) | −0.02 | (0.06) | 0.05 | (0.09) |
| Rich | 3.88 | (4.75) | 0.25 * | (0.11) | 0.03 | (0.12) |
| Richest | 7.27 | (6.48) | 0.18 * | (0.07) | −0.14 | (0.09) |
| LAZ at 24 months | 14.34 *** | (2.20) | - | - | - | - |
| HCZ at 24 months | 1.81 | (2.06) | - | - | - | - |
| Daily grains and tubers consumption frequency | ||||||
| at 6 months | 0.12 | (1.09) | −0.01 | (0.03) | 0.01 | (0.03) |
| at 9 months | 0.05 | (1.06) | −0.00 | (0.02) | −0.00 | (0.03) |
| at 12 months | −0.38 | (0.87) | −0.03 | (0.02) | 0.01 | (0.03) |
| at 18 months | 0.31 | (1.06) | −0.01 | (0.01) | −0.05 ** | (0.02) |
| Daily legumes and nuts consumption frequency | ||||||
| at 6 months | −1.49 | (1.80) | 0.07 | (0.05) | 0.06 | (0.05) |
| at 9 months | 0.45 | (1.92) | 0.01 | (0.03) | 0.03 | (0.03) |
| at 12 months | 0.87 | (1.40) | 0.02 | (0.04) | −0.04 | (0.03) |
| at 18 months | 0.19 | (0.93) | −0.02 | (0.02) | −0.00 | (0.03) |
| Daily vitamin A rich food consumption frequency | ||||||
| at 6 months | −2.54 | (6.41) | 0.30 ** | (0.10) | 0.22 | (0.18) |
| at 9 months | 0.32 | (1.82) | 0.13 | (0.06) | 0.10 | (0.05) |
| at 12 months | 1.94 | (2.64) | −0.06 | (0.04) | 0.06 | (0.06) |
| at 18 months | −1.20 | (1.46) | −0.00 | (0.02) | 0.08 * | (0.03) |
| Daily other fruits and vegetables consumption frequency | ||||||
| at 6 months | 1.42 | (1.28) | 0.03 * | (0.01) | −0.01 | (0.03) |
| at 9 months | 0.93 | (1.36) | 0.04 | (0.02) | 0.07 | (0.04) |
| at 12 months | −1.28 | (1.32) | 0.03 | (0.03) | 0.03 | (0.03) |
| at 18 months | 1.24 | (1.08) | 0.04 * | (0.01) | 0.03 | (0.01) |
| Daily ASF consumption frequency | ||||||
| at 6 months | −0.57 | (1.33) | −0.00 | (0.03) | 0.02 | (0.04) |
| at 9 months | 1.60 | (1.55) | 0.03 | (0.03) | 0.05 | (0.04) |
| at 12 months | −1.50 | (1.69) | −0.06 | (0.03) | 0.04 | (0.02) |
| at 18 months | 1.88 | (1.18) | 0.08 ** | (0.03) | 0.03 | (0.04) |
| n | 700 | 701 | 700 | |||
| Adjusted R-square | 0.19 | 0.13 | 0.19 | |||
| Total ASQ Score | HCZ Score | LAZ Score | ||||
|---|---|---|---|---|---|---|
| β | Robust S.E. | β | Robust S.E. | β | Robust S.E. | |
| Female child | 0.74 | (3.20) | −0.10 | (0.06) | −0.02 | (0.09) |
| Child age | −2.97 | (2.72) | 0.01 | (0.04) | 0.02 | (0.03) |
| Mother’s schooling (REF: None) | ||||||
| Primary | 7.73 | (6.79) | −0.08 | (0.07) | 0.18 | (0.09) |
| Secondary | 10.07 | (5.13) | 0.06 | (0.09) | 0.56 *** | (0.12) |
| More than Secondary | 11.14 | (7.38) | 0.37 ** | (0.12) | 0.76 *** | (0.13) |
| Household Wealth Quintile (REF: Poorest) | ||||||
| Poor | −2.67 | (7.10) | 0.02 | (0.09) | 0.05 | (0.13) |
| Middle | 0.47 | (5.35) | 0.01 | (0.06) | 0.05 | (0.09) |
| Rich | 2.91 | (4.62) | 0.27 * | (0.12) | 0.04 | (0.12) |
| Richest | 5.62 | (6.01) | 0.19 * | (0.07) | −0.15 | (0.10) |
| LAZ at 24 months | 13.73 *** | (1.99) | - | - | - | - |
| HCZ at 24 months | 1.96 | (1.79) | - | - | - | - |
| Cumulative total of the number of grains and tubers consumed | −0.08 | (0.16) | 0.00 | (0.01) | 0.01 * | (0.00) |
| Cumulative total of the number of legumes and nuts consumed | 1.26 | (1.13) | 0.03 | (0.02) | 0.01 | (0.02) |
| Cumulative total of the number of vitamin A rich foods consumed | −1.44 | (1.79) | 0.06 * | (0.02) | 0.12 *** | (0.03) |
| Cumulative total of the number of other fruits and vegetables consumed | 0.94 | (0.78) | 0.04 * | (0.01) | 0.05 ** | (0.01) |
| Cumulative total of the number of ASFs consumed | 1.38 | (0.68) | 0.03 | (0.02) | 0.06 * | (0.02) |
| n | 700 | 701 | 700 | |||
| Adjusted R-square | 0.19 | 0.10 | 0.17 | |||
| Total ASQ Score | HCZ Score | LAZ Score | ||||
|---|---|---|---|---|---|---|
| β | Robust S.E. | β | Robust S.E. | β | Robust S.E. | |
| Female child | 0.43 | (3.23) | −0.11 | (0.06) | −0.03 | (0.10) |
| Child age | −3.00 | (2.72) | 0.01 | (0.04) | 0.02 | (0.03) |
| Mother’s schooling (REF: None) | ||||||
| Primary | 7.86 | (6.82) | −0.08 | (0.07) | 0.19 * | (0.09) |
| Secondary | 11.47 * | (4.97) | 0.09 | (0.09) | 0.59 *** | (0.12) |
| More than Secondary | 14.02 | (7.36) | 0.42 ** | (0.12) | 0.78 *** | (0.10) |
| Household Wealth Quintile (REF: Poorest) | ||||||
| Poor | −2.50 | (7.14) | 0.02 | (0.09) | 0.04 | (0.13) |
| Middle | 1.13 | (5.25) | 0.04 | (0.07) | 0.07 | (0.09) |
| Rich | 2.94 | (4.75) | 0.27 * | (0.12) | 0.02 | (0.12) |
| Richest | 6.56 | (6.27) | 0.20 ** | (0.06) | −0.14 | (0.09) |
| LAZ at 24 months | 13.95 *** | (2.08) | ||||
| HCZ at 24 months | 2.19 | (1.83) | ||||
| Cumulative total of the grains and tubers consumption frequency | −0.02 | (0.42) | −0.01 | (0.01) | −0.01 | (0.01) |
| Cumulative total of the legumes and nuts consumption frequency | 0.34 | (0.66) | 0.02 | (0.01) | 0.01 | (0.02) |
| Cumulative total of the vitamin A rich foods consumption frequency | −0.18 | (0.88) | 0.03 | (0.02) | 0.08 ** | (0.02) |
| Cumulative total of other fruits and vegetables consumption frequency | 0.51 | (0.60) | 0.04 *** | (0.01) | 0.04 ** | (0.01) |
| Cumulative total of ASFs consumption frequency | 0.30 | (0.37) | 0.01 | (0.01) | 0.03 ** | (0.01) |
| n | 700 | 701 | 700 | |||
| Adjusted R-square | 0.18 | 0.09 | 0.17 | |||
| Total ASQ Score | HCZ Score | LAZ Score | ||||
|---|---|---|---|---|---|---|
| Mean Score or Correlation Coefficient | p-Value | Mean Score or Correlation Coefficient | p-Value | Mean Score or Correlation Coefficient | p-Value | |
| Any ASF consumption (Y/N) a | ||||||
| at 6 months | Y: 254 N: 241 | 0.0024 | Y: −1.44 N: −1.73 | 0.0003 | Y: −1.49 N: −1.91 | 0.0000 |
| at 9 months | Y: 253 N: 239 | 0.0002 | Y: −1.52 N: −1.73 | 0.0029 | Y: −1.54 N: −1.97 | 0.0000 |
| at 12 months | Y: 249 N: 240 | 0.0229 | Y: −1.59 N: −1.71 | 0.1073 | Y: −1.63 N: −1.97 | 0.0000 |
| at 18 months | Y: 251 N: 234 | 0.0000 | Y: −1.53 N: −1.86 | 0.0000 | Y: −1.69 N: −1.99 | 0.0006 |
| Number of ASFs consumed b | ||||||
| at 6 months | 0.10 | 0.0067 | 0.14 | 0.0002 | 0.16 | 0.0000 |
| at 9 months | 0.14 | 0.0001 | 0.11 | 0.0026 | 0.19 | 0.0000 |
| at 12 months | 0.12 | 0.0010 | 0.06 | 0.0759 | 0.17 | 0.0000 |
| at 18 months | 0.17 | 0.0000 | 0.19 | 0.0000 | 0.17 | 0.0000 |
| ASF consumption frequency b | ||||||
| at 6 months | 0.09 | 0.0201 | 0.09 | 0.0156 | 0.16 | 0.0000 |
| at 9 months | 0.13 | 0.0004 | 0.10 | 0.0055 | 0.19 | 0.0000 |
| at 12 months | 0.08 | 0.0354 | 0.04 | 0.2492 | 0.17 | 0.0000 |
| at 18 months | 0.13 | 0.0004 | 0.17 | 0.0000 | 0.14 | 0.0002 |
| Cumulative Consumption (6–18 months) b | ||||||
| Number of ASF consumed | 0.21 | 0.0000 | 0.19 | 0.0000 | 0.26 | 0.0000 |
| Frequency of ASF consumption | 0.16 | 0.0000 | 0.14 | 0.0001 | 0.24 | 0.0000 |
| n | 701 | 701 | 700 | |||
References
- Grantham-McGregor, S.; Cheung, Y.B.; Cueto, S.; Glewwe, P.; Richter, L.; Strupp, B.; International Child Development Steering Group. Developmental potential in the first 5 years for children in developing countries. Lancet 2007, 369, 60–70. [Google Scholar] [CrossRef] [PubMed] [Green Version]
- Engle, P.L.; Black, M.M.; Behrman, J.R.; de Mello, M.C.; Gertler, P.J.; Kapiriri, L.; Martorell, R.; Young, M.E.; International Child Development Steering Group. Strategies to avoid the loss of developmental potential in more than 200 million children in the developing world. Lancet 2007, 369, 229–242. [Google Scholar] [CrossRef] [PubMed] [Green Version]
- Cisneros-Franco, J.M.; Voss, P.; Thomas, M.E.; de Villers-Sidani, E. Critical periods of brain development. Handb. Clin. Neurol. 2020, 173, 75–88. [Google Scholar] [CrossRef]
- Lyall, A.E.; Shi, F.; Geng, X.; Woolson, S.; Li, G.; Wang, L.; Hamer, R.M.; Shen, D.; Gilmore, J.H. Dynamic Development of Regional Cortical Thickness and Surface Area in Early Childhood. Cereb. Cortex 2014, 25, 2204–2212. [Google Scholar] [CrossRef] [Green Version]
- Black, M.M.; Walker, S.P.; Fernald, L.C.H.; Andersen, C.T.; DiGirolamo, A.M.; Lu, C.; McCoy, D.C.; Fink, G.; Shawar, Y.R.; Shiffman, J.; et al. Advancing Early Childhood Development: From Science to Scale 1: Early Childhood Development Coming of Age: Science through the Life Course. Lancet 2017, 389, 77–90. [Google Scholar] [CrossRef] [PubMed] [Green Version]
- Tran, T.D.; Holton, S.; Nguyen, H.; Fisher, J. Physical growth: Is it a good indicator of development in early childhood in low- and middle-income countries? BMC Pediatr. 2019, 19, 276. [Google Scholar] [CrossRef] [PubMed] [Green Version]
- Heo, J.; Krishna, A.; Perkins, J.M.; Lee, H.-Y.; Lee, J.-K.; Subramanian, S.; Oh, J. Community Determinants of Physical Growth and Cognitive Development among Indian Children in Early Childhood: A Multivariate Multilevel Analysis. Int. J. Environ. Res. Public Health 2019, 17, 182. [Google Scholar] [CrossRef] [Green Version]
- Larson, L.M.; Martorell, R.; Bauer, P.J. A Path Analysis of Nutrition, Stimulation, and Child Development Among Young Children in Bihar, India. Child Dev. 2018, 89, 1871–1886. [Google Scholar] [CrossRef] [Green Version]
- Christian, P.; Murray-Kolb, L.E.; Tielsch, J.M.; Katz, J.; LeClerq, S.C.; Khatry, S.K. Associations between preterm birth, small-for-gestational age, and neonatal morbidity and cognitive function among school-age children in Nepal. BMC Pediatr. 2014, 14, 58. [Google Scholar] [CrossRef] [Green Version]
- Scharf, R.J.; Rogawski, E.T.; Murray-Kolb, L.E.; Maphula, A.; Svensen, E.; Tofail, F.; Rasheed, M.; Abreu, C.; Vasquez, A.O.; Shrestha, R.; et al. Early childhood growth and cognitive outcomes: Findings from theMAL-EDstudy. Matern. Child Nutr. 2018, 14, e12584. [Google Scholar] [CrossRef]
- Siegel, E.H.; Stoltzfus, R.J.; Kariger, P.K.; Katz, J.; Khatry, S.K.; LeClerq, S.C.; Pollitt, E.; Tielsch, J.M. Growth Indices, Anemia, and Diet Independently Predict Motor Milestone Acquisition of Infants in South Central Nepal. J. Nutr. 2005, 135, 2840–2844. [Google Scholar] [CrossRef] [PubMed] [Green Version]
- Miller, A.C.; Murray, M.B.; Thomson, D.R.; Arbour, M.C. How consistent are associations between stunting and child development? Evidence from a meta-analysis of associations between stunting and multidimensional child development in fifteen low- and middle-income countries. Public Health Nutr. 2015, 19, 1339–1347. [Google Scholar] [CrossRef] [PubMed] [Green Version]
- Sudfeld, C.R.; McCoy, D.C.; Danaei, G.; Fink, G.; Ezzati, M.; Andrews, K.G.; Fawzi, W.W. Linear Growth and Child Development in Low- and Middle-Income Countries: A Meta-Analysis. Pediatrics 2015, 135, e1266–e1275. [Google Scholar] [CrossRef] [Green Version]
- Gale, C.R.; O’Callaghan, F.J.; Godfrey, K.M.; Law, C.M.; Martyn, C.N. Critical periods of brain growth and cognitive function in children. Brain 2004, 127, 321–329. [Google Scholar] [CrossRef] [Green Version]
- Bartholomeusz, H.H.; Courchesne, E.; Karns, C.M. Relationship between Head Circumference and Brain Volume in Healthy Normal Toddlers, Children, and Adults. Neuropediatrics 2002, 33, 239–241. [Google Scholar] [CrossRef]
- Ferreira, H.D.S.; Júnior, A.F.S.X.; De Assunção, M.L.; Dos Santos, E.A.; Horta, B.L. Effect of Breastfeeding on Head Circumference of Children from Impoverished Communities. Breastfeed. Med. 2013, 8, 294–301. [Google Scholar] [CrossRef] [PubMed] [Green Version]
- The MAL-ED Network Investigators; Acosta, A.M.; Chavez, C.B.; Flores, J.T.; Olotegui, M.P.; Pinedo, S.R.; Trigoso, D.R.; Vasquez, A.O.; Ahmed, I.; Alam, D.; et al. The MAL-ED Study: A Multinational and Multidisciplinary Approach to Understand the Relationship Between Enteric Pathogens, Malnutrition, Gut Physiology, Physical Growth, Cognitive Development, and Immune Responses in Infants and Children Up to 2 Years of Age in Resource-Poor Environments. Clin. Infect. Dis. 2014, 59, S193–S206. [Google Scholar] [CrossRef] [Green Version]
- Alam, A.; Richard, S.A.; Fahim, S.M.; Mahfuz, M.; Nahar, B.; Das, S.; Shrestha, B.; Koshy, B.; Mduma, E.; Seidman, J.C.; et al. Impact of early-onset persistent stunting on cognitive development at 5 years of age: Results from a multi-country cohort study. PLoS ONE 2020, 15, e0227839. [Google Scholar] [CrossRef]
- Casale, D.; Desmond, C. Recovery from stunting and cognitive outcomes in young children: Evidence from the South African Birth to Twenty Cohort Study. J. Dev. Orig. Health Dis. 2015, 7, 163–171. [Google Scholar] [CrossRef] [Green Version]
- Dror, D.K.; Allen, L.H. The Importance of Milk and other Animal-Source Foods for Children in Low-Income Countries. Food Nutr. Bull. 2011, 32, 227–243. [Google Scholar] [CrossRef]
- Headey, D.; Hirvonen, K.; Hoddinott, J. Animal Sourced Foods and Child Stunting. Am. J. Agric. Econ. 2018, 100, 1302–1319. [Google Scholar] [CrossRef] [PubMed] [Green Version]
- Hulett, J.L.; Weiss, R.E.; Bwibo, N.O.; Galal, O.M.; Drorbaugh, N.; Neumann, C.G. Animal source foods have a positive impact on the primary school test scores of Kenyan schoolchildren in a cluster-randomised, controlled feeding intervention trial. Br. J. Nutr. 2013, 111, 875–886. [Google Scholar] [CrossRef] [PubMed] [Green Version]
- Krebs, N.F.; Mazariegos, M.; Tshefu, A.; Bose, C.; Sami, N.; Chomba, E.; Carlo, W.; Goco, N.; Kindem, M.; Wright, L.L.; et al. Meat Consumption is Associated with Less Stunting among Toddlers in Four Diverse Low-Income Settings. Food Nutr. Bull. 2011, 32, 185–191. [Google Scholar] [CrossRef] [PubMed] [Green Version]
- Miller, L.C.; Neupane, S.; Joshi, N.; Shrestha, M.; Neupane, S.; Lohani, M.; Thorne-Lyman, A.L. Diet quality over time is associated with better development in rural Nepali children. Matern. Child Nutr. 2020, 16, e12964. [Google Scholar] [CrossRef] [PubMed]
- Thorne-Lyman, A.L.; Shrestha, M.; Fawzi, W.W.; Pasqualino, M.; Strand, T.A.; Kvestad, I.; Hysing, M.; Joshi, N.; Lohani, M.; Miller, L.C. Dietary Diversity and Child Development in the Far West of Nepal: A Cohort Study. Nutrients 2019, 11, 1799. [Google Scholar] [CrossRef] [Green Version]
- Miller, L.C.; Joshi, N.; Lohani, M.; Singh, R.; Bhatta, N.; Rogers, B.; Griffiths, J.K.; Ghosh, S.; Mahato, S.; Singh, P.; et al. Head growth of undernourished children in rural Nepal: Association with demographics, health and diet. Ann. Trop. Paediatr. Int. Child Health 2016, 36, 91–101. [Google Scholar] [CrossRef]
- Krebs, N.F.; Westcott, J.E.; Butler, N.; Robinson, C.; Bell, M.; Hambidge, K.M. Meat as a First Complementary Food for Breastfed Infants: Feasibility and Impact on Zinc Intake and Status. J. Pediatr. Gastroenterol. Nutr. 2006, 42, 207–214. [Google Scholar] [CrossRef]
- Stewart, C.P.; Caswell, B.; Iannotti, L.; Lutter, C.; Arnold, C.D.; Chipatala, R.; Prado, E.L.; Maleta, K. The effect of eggs on early child growth in rural Malawi: The Mazira Project randomized controlled trial. Am. J. Clin. Nutr. 2019, 110, 1026–1033. [Google Scholar] [CrossRef] [Green Version]
- Krasevec, J.; An, X.; Kumapley, R.; Bégin, F.; Frongillo, E.A.; Krasevec, J.; An, X.; Kumapley, R.; Bégin, F.; Frongillo, E.A. Diet quality and risk of stunting among infants and young children in low- and middle-income countries. Matern. Child Nutr. 2017, 13, e12430. [Google Scholar] [CrossRef] [Green Version]
- Iannotti, L.L.; Lutter, C.K.; Stewart, C.P.; Riofrío, C.A.G.; Malo, C.; Reinhart, G.; Palacios, A.; Karp, C.; Chapnick, M.; Cox, K.; et al. Eggs in Early Complementary Feeding and Child Growth: A Randomized Controlled Trial. Pediatrics 2017, 140, e20163459. [Google Scholar] [CrossRef]
- Ghosh, S.; Suri, D.; Griffiths, J. Dairy consumption is associated with a lower risk of stunting in Ethiopian children 6–24 months of age. FASEB J. 2014, 28, 620.10. [Google Scholar] [CrossRef]
- Zaharia, S.; Ghosh, S.; Shrestha, R.; Manohar, S.; Thorne-Lyman, A.L.; Bashaasha, B.; Kabunga, N.; Gurung, S.; Namirembe, G.; Appel, K.H.; et al. Sustained intake of animal-sourced foods is associated with less stunting in young children. Nat. Food 2021, 2, 246–254. [Google Scholar] [CrossRef]
- Kaimila, Y.; Divala, O.; Agapova, S.E.; Stephenson, K.B.; Thakwalakwa, C.; Trehan, I.; Manary, M.J.; Maleta, K.M. Consumption of Animal-Source Protein is Associated with Improved Height-for-Age z Scores in Rural Malawian Children Aged 12–36 Months. Nutrients 2019, 11, 480. [Google Scholar] [CrossRef] [PubMed] [Green Version]
- World Health Organization. Length/Height-for-Age, Weight-for-Age, Weight-for-Length, Weight-for-Height and Body Mass Index-for-Age Methods and Development; World Health Organization: Geneva, Switzerland, 2006.
- Yu, L.-M.; Hey, E.; Doyle, L.W.; Farrell, B.; Spark, P.; Altman, D.G.; Duley, L.; on behalf of the Magpie Trial Follow-Up Study Collaborative Group. Evaluation of the Ages and Stages Questionnaires in identifying children with neurosensory disability in the Magpie Trial follow-up study. Acta Paediatr. 2007, 96, 1803–1808. [Google Scholar] [CrossRef]
- Singh, A.; Yeh, C.J.; Blanchard, S.B. Ages and Stages Questionnaire: A global screening scale. Bol. Med. Del Hosp. Infant. Mex. 2017, 74, 5–12. [Google Scholar] [CrossRef]
- Kvestad, I.; Taneja, S.; Kumar, T.; Hysing, M.; Refsum, H.; Yajnik, C.S.; Bhandari, N.; Strand, T. Folate and Vitamin B12 Study Group Vitamin B12 and Folic Acid Improve Gross Motor and Problem-Solving Skills in Young North Indian Children: A Randomized Placebo-Controlled Trial. PLoS ONE 2015, 10, e0129915. [Google Scholar] [CrossRef] [Green Version]
- Kyerematen, V.; Hamb, A.; Oberhelman, R.A.; Cabrera, L.; Bernabe-Ortiz, A.; Berry, S.J. Exploratory application of the Ages and Stages (ASQ) child development screening test in a low-income Peruvian shantytown population. BMJ Open 2014, 4, e004132. [Google Scholar] [CrossRef] [Green Version]
- Addo, O.Y.; Tripp, K.; Nanama, S.; Albert, B.; Sandalinas, F.; Nanema, A.; Jefferds, M.E.; Clayton, H.B.; Whitehead, R.D.; Garg, A.; et al. An Integrated Infant and Young Child Feeding and Small-Quantity Lipid-based Nutrient Supplementation Program Is Associated with Improved Gross Motor and Communication Scores of Children 6-18 Months in the Democratic Republic of Congo. J. Pediatr. 2020, 222, 154–163. [Google Scholar] [CrossRef]
- Kvestad, I.; Hysing, M.; Shrestha, M.; Ulak, M.; Thorne-Lyman, A.L.; Henjum, S.; Ueland, P.M.; Midttun, Ø.; Fawzi, W.; Chandyo, R.K.; et al. Vitamin B-12 status in infancy is positively associated with development and cognitive functioning 5 y later in Nepalese children. Am. J. Clin. Nutr. 2017, 105, 1122–1131. [Google Scholar] [CrossRef] [Green Version]
- Squires, J.; Bricker, D. Score Adjustment Chart for ASQ-3TM. 2009. Available online: www.brookespublishing.com (accessed on 4 May 2021).
- Campbell, R.K.; Talegawkar, S.A.; Christian, P.; Leclerq, S.C.; Khatry, S.K.; Wu, L.S.F.; Stewart, C.P.; West, K.P. Evaluation of a Novel Single-administration Food Frequency Questionnaire for Assessing Seasonally Varied Dietary Patterns among Women in Rural Nepal. Ecol. Food Nutr. 2015, 54, 314–327. [Google Scholar] [CrossRef]
- Klemm, R.D.; Manohar, W.S.; Rajbhandary, R.; Shrestha, K.; Gauchan, D.; Adhikari, R.; Thorne-Lyman, A.L.; Nonyane, B.A.S.; Ghosh, S.; Webb, P.; et al. Pathways from Agriculture-to-Nutrition: Design and Conduct of the National PoSHAN Surveys of Nepal. J. Food Secur. 2018, 6, 79–89. Available online: https://pubs.sciepub.com/jfs/6/2/5 (accessed on 11 November 2022).
- World Health Organization. Indicators for Assessing Infant and Young Child Feeding Practices; World Health Organization: Geneva, Switzerland, 2008.
- World Health Organization. Global Nutrition Monitoring Framework: Operational Guidance for Tracking Progress in Meeting Targets for 2025; WHO: Geneva, Switzerland, 2017.
- Rutstein, S.O. Steps to Constructing the New DHS Wealth Index; ICF International: Rockville, MD, USA, 2015. [Google Scholar]
- Suchdev, P.S.; Boivin, M.J.; Forsyth, B.W.; Georgieff, M.K.; Guerrant, R.L.; Nelson, C.A. Assessment of Neurodevelopment, Nutrition, and Inflammation from Fetal Life to Adolescence in Low-Resource Settings. Pediatrics 2017, 139, S23–S37. [Google Scholar] [CrossRef] [PubMed] [Green Version]
- Dalton, A.; Wolmarans, P.; Witthuhn, R.C.; van Stuijvenberg, M.E.; Swanevelder, S.A.; Smuts, C.M. A randomised control trial in schoolchildren showed improvement in cognitive function after consuming a bread spread, containing fish flour from a marine source. Prostaglandins Leukot. Essent. Fat. Acids 2009, 80, 143–149. [Google Scholar] [CrossRef] [PubMed]
- Ivanovic, D.M.; Leiva, B.P.; Pérez, H.T.; Olivares, M.G.; Díaz, N.S.; Urrutia, M.S.C.; Almagià, A.F.; Toro, T.D.; Miller, P.T.; Bosch, E.O.; et al. Head size and intelligence, learning, nutritional status and brain development: Head, IQ, learning, nutrition and brain. Neuropsychologia 2004, 42, 1118–1131. [Google Scholar] [CrossRef] [Green Version]
- Shapiro, M.J.; Downs, S.M.; Swartz, H.J.; Parker, M.; Quelhas, D.; Kreis, K.; Kraemer, K.; West, K.P., Jr.; Fanzo, J. A Systematic Review Investigating the Relation Between Animal-Source Food Consumption and Stunting in Children Aged 6–60 Months in Low and Middle-Income Countries. Adv. Nutr. 2019, 10, 827–847. [Google Scholar] [CrossRef]
- MOHP. Ministry of Health and Population Nepal, New ERA, and ICF, Nepal Demographic and Health Survey 2016. Ministry of Health, Nepal: Kathmandu, Nepal, 2017. Available online: http://dhsprogram.com/pubs/pdf/FR336/FR336.pdf (accessed on 4 May 2021).
- Miller, L.C.; Neupane, S.; Joshi, N.; Lohani, M. MILK Symposium review: Milk consumption is associated with better height and weight in rural Nepali children over 60 months of age and better head circumference in children 24 to 60 months of age. J. Dairy Sci. 2020, 103, 9700–9714. [Google Scholar] [CrossRef]
| n | % or Mean (Standard Deviation) | Median (IQR) | |
|---|---|---|---|
| Pre-term birth (<37 weeks of gestation) | 65 | 9.3% | |
| Mean birth weight (kgs) | 688 | 2.8 (0.45) | |
| Female child | 365 | 52.1% | |
| Child ASQ total score | 701 | - | 258 (218, 280) |
| Communication domain score | - | 60 (50, 60) | |
| Gross motor domain score | - | 50 (30, 60) | |
| Fine motor domain score | - | 50 (40, 60) | |
| Problem solving domain score | - | 50 (40, 60) | |
| Personal-social domain score | - | 48 (48, 60) | |
| Child LAZ score | 700 | −1.8 (1.1) | −1.8 (−2.6, −1.0) |
| Moderately stunted child (LAZ ≤ −2 and ≥−3) | 211 | 30.1% | - |
| Severely stunted child (LAZ < −3) | 93 | 13.3% | - |
| Child HCZ score | 701 | −1.7 (0.9) | −1.6 (−2.2, −1.0) |
| Moderate microcephaly (HCZ ≤ −2 and ≥−3) | 193 | 27.5% | - |
| Severe microcephaly (HCZ < −3) | 51 | 7.3% | - |
| Child WLZ score | 696 | −0.9 (1) | −0.9 (−1.5, −0.3) |
| Moderately wasted child (WLZ ≤ −2 and ≥−3) | 76 | 11.0% | - |
| Severely wasted child (WLZ < −3) | 13 | 1.8% | - |
| Maternal age (years) | 701 | 26.3 (4.7) | |
| Mother’s schooling (%) | |||
| No schooling | 258 | 36.8 | - |
| Primary (1–5 years) | 149 | 21.3 | - |
| Secondary (6–10 years) | 235 | 33.5 | - |
| More than Secondary (>10 years) | 59 | 8.4 | - |
| Household Wealth Quintile (%) | |||
| Poorest | 127 | 18.1 | - |
| Poor | 149 | 21.3 | - |
| Middle | 143 | 20.4 | - |
| Rich | 128 | 18.3 | - |
| Richest | 154 | 21.9 | - |
| 6 Months | 9 Months | 12 Months | 18 Months | |
|---|---|---|---|---|
| Median (IQR) or % | Median (IQR) or % | Median (IQR) or % | Median (IQR) or % | |
| Any ASF consumption | 26.7% | 40.1% | 50.9% | 63.9% |
| Number of ASF consumed | 0 (0, 1) | 0 (0, 1) | 1 (0, 1) | 1 (0, 1) |
| ASF consumption frequency | 0 (0, 1) | 0 (0, 1) | 1 (0, 2) | 1 (0, 2) |
| Cumulative ASF consumption | ||||
| Cumulative number of ASF consumed | - | - | - | 2 (1, 4) |
| Cumulative ASF consumption frequency | - | - | - | 3 (1, 5) |
| Independent Variable | Multivariable Models | ||||
|---|---|---|---|---|---|
| (1) | (2) | (3) | (4) | (5) | |
| ASF consumption (Y/N) | |||||
| at 6 months | −0.45 (3.47) | ||||
| at 9 months | 4.02 (2.59) | ||||
| at 12 months | −2.54 (3.99) | ||||
| at 18 months | 8.98 ** (2.95) | ||||
| Number of ASF consumed | |||||
| at 6 months | −0.70 (3.16) | ||||
| at 9 months | 1.69 (1.77) | ||||
| at 12 months | 0.63 (2.22) | ||||
| at 18 months | 2.89 (1.86) | ||||
| ASF consumption frequency | |||||
| at 6 months | −0.57 (1.33) | ||||
| at 9 months | 1.60 (1.55) | ||||
| at 12 months | −1.50 (1.69) | ||||
| at 18 months | 1.88 (1.18) | ||||
| Cumulative consumption (6–18 months) | |||||
| Number of ASF consumed | 1.38 (0.68) | ||||
| Frequency of ASF consumption | 0.30 (0.37) | ||||
| n | 700 | 700 | 700 | 700 | 700 |
| Adjusted R-square | 0.21 | 0.20 | 0.19 | 0.19 | 0.18 |
| Independent Variable | Multivariable Models | ||||
|---|---|---|---|---|---|
| (1) | (2) | (3) | (4) | (5) | |
| ASF consumption (Y/N) | |||||
| at 6 months | 0.02 (0.09) | ||||
| at 9 months | 0.09 (0.08) | ||||
| at 12 months | −0.08 (0.06) | ||||
| at 18 months | 0.24 *** (0.06) | ||||
| Number of ASF consumed | |||||
| at 6 months | 0.06 (0.08) | ||||
| at 9 months | 0.00 (0.06) | ||||
| at 12 months | −0.07 (0.05) | ||||
| at 18 months | 0.13 ** (0.04) | ||||
| ASF consumption frequency | |||||
| at 6 months | −0.00 (0.03) | ||||
| at 9 months | 0.03 (0.03) | ||||
| at 12 months | −0.06 (0.03) | ||||
| at 18 months | 0.08 ** (0.03) | ||||
| Cumulative consumption (6–18 months) | |||||
| Number of ASF consumed | 0.03 (0.02) | ||||
| Frequency of ASF consumption | 0.01 (0.01) | ||||
| n | 701 | 701 | 701 | 701 | 701 |
| Adjusted R-square | 0.12 | 0.13 | 0.13 | 0.10 | 0.10 |
| Independent Variable | Multivariable Models | ||||
|---|---|---|---|---|---|
| (1) | (2) | (3) | (4) | (5) | |
| ASF consumption (Y/N) | |||||
| at 6 months | 0.06 (0.08) | ||||
| at 9 months | 0.16 (0.09) | ||||
| at 12 months | 0.11 * (0.05) | ||||
| at 18 months | 0.13 (0.12) | ||||
| Number of ASF consumed | |||||
| at 6 months | 0.03 (0.08) | ||||
| at 9 months | 0.06 (0.05) | ||||
| at 12 months | 0.06 (0.04) | ||||
| at 18 months | 0.06 (0.06) | ||||
| ASF consumption frequency | |||||
| at 6 months | 0.02 (0.04) | ||||
| at 9 months | 0.05 (0.04) | ||||
| at 12 months | 0.04 (0.02) | ||||
| at 18 months | 0.03 (0.04) | ||||
| Cumulative consumption (6–18 months) | |||||
| Number of ASF consumed | 0.06 * (0.02) | ||||
| Frequency of ASF consumption | 0.03 ** (0.01) | ||||
| n | 700 | 700 | 700 | 700 | 700 |
| Adjusted R-square | 0.18 | 0.18 | 0.19 | 0.17 | 0.17 |
Disclaimer/Publisher’s Note: The statements, opinions and data contained in all publications are solely those of the individual author(s) and contributor(s) and not of MDPI and/or the editor(s). MDPI and/or the editor(s) disclaim responsibility for any injury to people or property resulting from any ideas, methods, instructions or products referred to in the content. |
© 2023 by the authors. Licensee MDPI, Basel, Switzerland. This article is an open access article distributed under the terms and conditions of the Creative Commons Attribution (CC BY) license (https://creativecommons.org/licenses/by/4.0/).
Share and Cite
Pokharel, A.; Webb, P.; Miller, L.C.; Zaharia, S.; Shrestha, R.; Davis, D.; Trevino, J.A.; Baral, K.P.; Paudel, K.; Ghosh, S. Relationship between Animal Sourced Food Consumption and Early Childhood Development Outcomes. Nutrients 2023, 15, 315. https://doi.org/10.3390/nu15020315
Pokharel A, Webb P, Miller LC, Zaharia S, Shrestha R, Davis D, Trevino JA, Baral KP, Paudel K, Ghosh S. Relationship between Animal Sourced Food Consumption and Early Childhood Development Outcomes. Nutrients. 2023; 15(2):315. https://doi.org/10.3390/nu15020315
Chicago/Turabian StylePokharel, Ashish, Patrick Webb, Laurie C. Miller, Sonia Zaharia, Robin Shrestha, Dale Davis, Johanna Andrews Trevino, Kedar Prasad Baral, Krishna Paudel, and Shibani Ghosh. 2023. "Relationship between Animal Sourced Food Consumption and Early Childhood Development Outcomes" Nutrients 15, no. 2: 315. https://doi.org/10.3390/nu15020315