Article

Metabolite Profiling of Allium hookeri Leaves Using UHPLC-qTOF-MS/MS and the Senomorphic Activity of Phenolamides

Research Institute of Pharmaceutical Sciences, College of Pharmacy, Seoul National University, Seoul 08826, Republic of Korea
*
Author to whom correspondence should be addressed.
Nutrients 2023, 15(24), 5109; https://doi.org/10.3390/nu15245109
Submission received: 12 October 2023 / Revised: 29 November 2023 / Accepted: 7 December 2023 / Published: 14 December 2023

Abstract

:
The plant Allium hookeri, a member of the Allium genus, has a rich history of culinary and medicinal use. Recent studies have unveiled its potent antioxidant and anti-inflammatory properties. While research on A. hookeri has demonstrated its neuroprotective and anti-neuroinflammatory effects, the specific bioactive compounds responsible for these effects remain unidentified in prior research. This study utilized an untargeted metabolomic approach, employing HRESI-qTOF MS/MS-based molecular networking, to comprehensively profile the chemical composition of metabolites in A. hookeri and identify new compounds within the plant. As a result, ten compounds, comprising one novel flavonoid (2) and nine known compounds (1 and 310), were isolated and identified through NMR analysis. The inhibitory effects of all isolated compounds on the senescent cell-associated secretory phenotype (SASP), which is pivotal in neuroprotective actions, were evaluated. Biological activity testing revealed N-trans-feruloyltyramine (7) to be the most potent compound, effectively inhibiting SASP markers and contributing to the senomorphic activities of A. hookeri. These findings underscore the potential of phenolamides from A. hookeri as a promising source of bioactive compounds for mitigating senescence-associated diseases.

Graphical Abstract

1. Introduction

The Allium genus, which is the largest within the Amaryllidaceae family, comprises over 900 species [1], including well-recognized vegetables like onion (A. cepa), garlic (A. sativum), chives (A. schoenoprasum), leeks (A. ampeloprasum var. porrum), and rakkyo (A. chinense) [2]. Allium hookeri Thwaites, commonly known as hooker chive or wide-leaf chives, represent a herbaceous plant indigenous to regions such as India, Sri Lanka, Myanmar, Bhutan, southwestern China [3,4], and Nepal [5]. Its recent expansion has extended into the southern areas of Korea beginning in 2012 [6,7,8]. Due to the distinctive flavor characteristic of the Allium genus, both the leaves and fleshy roots of A. hookeri are used as vegetables, holding particular significance for the locals and serving as spices or supplementary foods [5,9]. Traditionally, the roots have been utilized by local communities in India for treating coughs, colds, burns, injuries, eruptions of the skin, and wound healing [5,10]. The leaves of A. hookeri are also employed for medicinal purposes, including the treatment of stomach ulcers, fever reduction, and blood pressure management [5,10]. Extensive studies on the roots of A. hookeri have unveiled regulatory effects against asthmatic changes [11], as well as antioxidant, neuroprotective [8,12,13], antimicrobial [14], anti-diabetic [15,16], immunomodulatory [17], anti-inflammatory [18,19], and bone-forming activities [20]. Additionally, the leaves of A. hoookeri also exhibited anti-obesity [21], anti-inflammatory, and immunomodulating effects [17]. The phytochemical profile of A. hookeri includes organosulphur compounds [22], flavonoids [23], fatty acids, phenolic, and polyphenols [12,14,23,24], and essential oils [25]. Despite the numerous reported activities of A. hookeri, only a few studies have established a direct link between compounds and their biological activities, such as fatty acids, phenolic and polyphenolic compounds with antimicrobial activity [14] and phenolic compounds with antioxidant properties [12].
The aging of the global population is becoming an increasingly significant medical concern. While life expectancy has increased over the past century, the additional years gained have not necessarily translated into a state of good health, especially for individuals aged 60 years and older [26]. In response to the challenges posed by population aging, the World Health Organization (WHO) has formulated a definition of healthy aging, describing it as a process of developing and maintaining functional abilities that contribute to well-being in older age [27]. Furthermore, the United Nations has designated the period from 2021 to 2030 as the UN Decade of Healthy Ageing [26]. The “hallmarks” of aging refer to the accumulation of damage, including genomic instability, telomere attrition, epigenetic alterations, the loss of proteostasis, mitochondrial dysfunctions, deregulated nutrient sensing, cellular senescence, stem cell exhaustion, and altered intercellular communication [28]. Among these hallmarks, cellular senescence, characterized by irreversible cell cycle arrest, the expression of senescence-associated beta-galactosidase (SA-β-gal), and the senescence-associated secretory phenotype (SASP) [29], plays a significant role in complex biological processes related to aging and age-related disorders [30]. Cellular senescence also plays a crucial role in the wound-healing process, involving inflammation, new tissue formation, and tissue remodeling as a physiological response to tissue injury [31]. While senescent fibroblasts contribute positively to wound healing by limiting any excess collagen deposition through the SASP, which includes collagen-degrading matrix metalloproteinases (MMPs) [32], their persistent presence in chronic wounds impedes closure. This persistence is marked by senescence indicators, oxidative stress, and proinflammatory cytokines in fibroblasts, highlighting their role in chronic wound pathology [33,34]. As individuals age, senescent cells tend to accumulate in tissues and organs, thereby contributing to the development of age-related diseases or chronic wounds [30]. The removal of senescent cells from tissues and organs may represent a crucial strategy for preventing and treating age-related diseases, thereby increasing the health span [28]. Senotherapeutics achieve their effect by targeting the following two approaches: eliminating senescent cells (senolytics) or inhibiting senescent phenotypes such as SA-β-gal or SASP secretion (senomorphics) [28]. To date, numerous natural products, such as quercetin, fisetin, piperlongumine, and the curcumin analog, have been recognized as senolytic agents [35]. Additionally, natural senomorphics like rapamycin, resveratrol, kaempferol, apigenin, and epigallocatechin gallate (EGCG) have been documented [36], indicating the potential of natural products as a promising source for senotherapeutic drug discovery.
This study aimed to investigate the phytochemical constituents in A. hookeri leaves using an untargeted metabolomic approach, incorporating feature-based molecular networking (FBMN), along with the isolation and characterization of major nodes. Additionally, the research evaluated their senomorphic effects, potentially contributing to their ethnomedicinal use in wound healing and in vitro neuroprotection. This study also sought to identify the key compounds responsible for the senomorphic effects of A. hookeri, examining both lipopolysaccharides (LPS)-induced nitric oxide (NO) production and the bleomycin-induced senescence model.

2. Materials and Methods

2.1. Materials

Optical rotations were determined using a JASCO P-2000 polarimeter (JASCO International Co., Ltd., Tokyo, Japan). IR spectra were measured with a Nicolet 6700 FT-IR spectrometer (Thermo Electron Corp., Waltham, MA, USA). NMR data analysis was performed with a JNM-ECA 600 MHz spectrometer (Jeol Ltd., Tokyo, Japan) coupled with a 5 mm CPTCI cryoprobe (Bruker, Germany). For column chromatography, silica gel (Merck KGaA, Darmstadt, Germany, particle size 63–200 μm) and RP-18 (Merck KGaA, particle size 75 μm) were used. Sephadex LH-20 from Sigma-Aldrich (St. Louis, MO, USA) was also used. Thin-layer chromatography (TLC) was conducted using silica gel 60 F254 and RP-18 F254 plates from Merck KGaA, Darmstadt, Germany. High-performance liquid chromatography (HPLC) was carried out using a Gilson system with a UV detector (at 201 and 254 nm) and an Optima Pak C18 column (10 × 250 mm, particle size 5 μm, RS TECH Co., Ltd., Chungcheongbuk-do, Korea).

2.2. Plant Material

A. hookeri was purchased from the commercial stores in March 2019 and was authenticated by Professor W. K. Oh. The samples were dried at room temperature, and a voucher specimen (2019-SNU-12) was deposited in the herbarium at the College of Pharmacy, Seoul National University, Seoul, Republic of Korea.

2.3. UHPLC-qTOF-MS/MS Experiments

The chemical profiling of A. hookeri was performed using an Agilent 6530 Q-TOF mass spectrometer equipped with an Agilent 1260 Infinity UHPLC (Agilent Technologies, Santa Clara, CA, USA). The chromatographic analysis utilized a Waters Acquity UHPLC® BEH C18 (100 mm × 2.1 mm, 1.7 μm) maintained at 40 °C, and LC-MS/MS analyses were conducted in the fast data-dependent acquisition (DDA) mode. The chromatographic separation was operated with the gradient of acetonitrile (contained 0.1% formic acid, B)/H2O (contained 0.1% formic acid, A) as follows: 0–20 min, 10–90% B; 20.1–22 min, 100% B; and 22.1–24.0 min, 10% B. Electrospray ionization (ESI) conditions included an untargeted MS scan from 100 to 1500 m/z in positive and negative ion modes. The instrumental parameters were set as follows: sheath gas temperature, 350 °C; gas flow, 10 L/min; nebulizer pressure, 30 psig. The scan source parameters encompassed the VCap (4000 V), nozzle voltage (1000 V), fragmentor (180 V), skimmer (65 V), and octopole RF peak voltages (750 V) with a collision energy of 50 eV.

2.4. Sample Preparation of A. hookeri for MS/MS Analysis

The fresh leaves of A. hooker (5 g) underwent sonication at room temperature for 1.5 h using 20 mL of 70% EtOH (3 times) at room temperature. The combined total extracts were then dried under a vacuum pump and then sequentially chromatographed using Sep-Pak® Plus Short C18 (360 mg Sorbent per Cartridge, 55–105 µm, Waters Corporation, Milford, MA, USA), eluting with H2O, 25%, 50%, 75%, 90%, and 100% MeOH/H2O. All the samples were dried and diluted to a final concentration of 2.0 mg/mL with HPLC-grade MeOH for further analysis. Following drying, all samples were diluted at a concentration of 2.0 mg/mL using HPLC-grade MeOH for subsequent analysis. Prior to injection into the mass spectrometer, all samples underwent filtration through a 0.20 μm membrane filter (Advantec, Tokyo Roshi Kaisha, Japan), with each sample injection consisting of 2 μL.

2.5. Extraction and Isolation

The air-dried leaves of A. hookeri were cut into small pieces and extracted with 70% EtOH using sonication for 90 min (three times) at room temperature. The resulting combined extract was then suspended in water and applied to a Diaion HP-20 column chromatography (CC). Elution was achieved using a MeOH/H2O gradient, resulting in the separation of the extract into the following three different fractions: H1 (50% MeOH), H2 (75% MeOH), H3 (100% MeOH). Fraction H3 was further subjected to normal-phase silica gel CC, eluting with an elution gradient of EtOAc/MeOH (2:1, 1:1, to 0:1) to obtain four fractions (N1-N4). Fraction N2, exhibiting the target peaks corresponding to flavones and amides, was further chromatographed on a reverse-phase C18 column with a mobile phase of 50–100% MeOH in water to provide 18 sub-fractions (R1-R18). Sub-fraction R2 was then processed through a Sephadex LH-20 column, with elution achieved using 100% MeOH and yielding ten fractions (L1-L10). Fraction L2 was subjected to purification via an HPLC system equipped with an RP C18 column, ultimately resulting in the isolation of compound 4 (5.6 mg); fraction L5 provided compound 2 (10.0 mg). Fraction L4 was further processed through an MPLC column, separating it into ten sub-fractions (M1-M10). After the purification of sub-fraction M3 through the HPLC system, compounds 1 (20.0 mg), 3 (5.0 mg), and 7 (3.8 mg) were obtained. Similarly, compounds 9 (4.3 mg) and 10 (8.5 mg) were yielded from sub-fraction M5 through the HPLC system, while sub-fraction M7 contained compounds 5 (12.5 mg), 6 (3.8 mg), and 8 (5.2 mg).

Physicochemical Properties of Isolated Compounds

Apigenin-7-O-glucuronide (1): pale yellow amorphous powder; [ α ] D 25 = −32.1 (c 0.1, MeOH); IR (KBr) νmax 3298, 2908, 2818, 1736, 1662, 1607, 1498, 1443, 1349, 1299, 1250, 1175, 1105, 1086, 1061, 1026, 833, 763, 679, 629 cm−1; 1H NMR (pyridine-d5, 600 MHz) and 13C NMR (pyridine-d5, 150 MHz): Figures S14 and S15; HRESIMS found m/z 477.0899 [M + H]+ (calcd for C21H19O11 at 477.0927, m/z error—5.87 ppm).
Apigenin-7-O-[α-L-rhamnopyranosyl(1→2)]β-D-glucuronic acid methyl ester (2): pale yellow amorphous powder; [ α ] D 25 = −13.4 (c 0.1, MeOH); UV (MeOH) λmax (log ε) 203 (−0.91), 253 (−0.67), 347 (−0.55); IR (KBr) νmax 3370, 2926, 2382, 2357, 2307, 1748, 1658, 1608, 1513, 1443, 1344, 1298, 1248, 1179, 1099, 949, 835, 679, 604 cm−1; 1H NMR (pyridine-d5, 600 MHz) and 13C NMR (pyridine-d5, 150 MHz): Table 1; HRESIMS found m/z 605.1500 [M − H] (calcd. for C28H29O15 at 605.1506, m/z error—1.0 ppm).
Apigenin 7-O-glucuronide methyl ester (3): pale yellow amorphous powder; [ α ] D 25 = −19.8 (c 0.1, MeOH); IR (KBr) νmax 3725, 3630, 3600, 3316, 2926, 2387, 2352, 2312, 1752, 1618, 1588, 1523, 1468, 1363, 1339, 1248, 1174, 1044, 835, 684, 670, 645 cm−1; 1H NMR (DMSO-d6, 600 MHz) and 13C NMR (DMSO-d6, 150 MHz): Figures S17 and S18; HRESIMS found m/z 461.1055 [M + H]+ (calcd. for C22H21O11 at 461.1084, m/z error—6.29 ppm).
Chrysoeriol-7-O-β-D-glucuronide (4): pale yellow amorphous powder; [ α ] D 25 = +30.7 (c 0.1, MeOH); UV (MeOH) λmax (log ε) 252 (−1.95), 350 (−1.85); IR (KBr) νmax 3730, 3620, 3595, 3300, 2946, 2387, 2307, 1748, 1613, 1503, 1418, 1333, 1174, 1039, 689, 670, 645 cm−1; 1H NMR (DMSO-d6, 500 MHz) and 13C NMR (DMSO-d6, 125 MHz): Figures S22 and S23; HRESIMS found m/z 477.1032 [M + H]+ (calcd. for C22H21O12 at 477.1033, m/z error—0.2 ppm).
Chrysoeriol-7-O-β-D-glucuronic acid methyl ester (5): pale yellow amorphous powder; [ α ] D 25 = −64.7 (c 0.1, MeOH); UV (MeOH) λmax (log ε) 203 (−0.90), 252 (−0.67), 348 (−0.52); IR (KBr) νmax 3725, 3700, 3625, 3595, 3306, 2966, 2387, 2362, 2342, 2307, 1748, 1513, 1418, 1363, 1333, 1049, 1034, 1014, 689, 674, 649, 615 cm−1; 1H NMR (DMSO-d6, 600 MHz) and 13C NMR (DMSO-d6, 150 MHz): Figures S27 and S28; HRESIMS found m/z 491.1193 [M + H]+ (calcd. for C23H23O12 at 491.1190, m/z error 0.61 ppm).
Paprazine (6): pale yellow amorphous powder; [ α ] D 25 = −18.1 (c 0.1, MeOH); IR (KBr) νmax 3717, 3696, 3627, 2972, 2386, 2351, 2302, 146, 1508, 1220, 1051, 818, 673 cm−1; 1H NMR (DMSO-d6, 500 MHz) and 13C NMR (DMSO-d6, 125 MHz): Figures S31 and S32; HRESIMS found m/z 284.1281 [M + H]+ (calcd. for C17H18NO3 at 284.1287, m/z error—2.11 ppm).
N-trans-feruloyltyramine (7): pale yellow amorphous powder; [ α ] D 25 = −24.7 (c 0.1, MeOH); IR (KBr) νmax 3731, 3702, 3627, 3597, 3344, 2942, 2381, 2357, 2307, 1592, 1508, 1265, 1225, 1031, 823, 679 cm−1; 1H NMR (DMSO-d6, 400 MHz) and 13C NMR (DMSO-d6, 100 MHz): Figures S35 and S36; HRESIMS found m/z 314.1381 [M + H]+ (calcd. for C18H20NO4 at 314.1392, m/z error—3.50 ppm).
N-trans-feruloyl-3-O-methyldopamine (8): pale yellow amorphous powder; [ α ] D 25 = −13.0 (c 0.1, MeOH); UV (MeOH) λmax (log ε) 240 (−1.60), 290 (−1.54), 318 (−1.49); IR (KBr) νmax 3737, 3726, 3702, 3627, 3592, 3305, 2972, 2938, 2381, 2357, 2312, 1752, 1602, 1508, 1269, 1220, 1126, 1036, 689, 669 cm−1; 1H NMR (DMSO-d6, 600 MHz) and 13C NMR (DMSO-d6, 150 MHz): Figures S40 and S41; HRESIMS found m/z 344.1427 [M + H]+ (calcd. for C19H21NO5 at 344.1420, m/z error 2.03 ppm).
5,7,4′-Trimethoxyflavone (9): pale yellow amorphous powder; [ α ] D 25 = −49.1 (c 0.1, MeOH); UV (MeOH) λmax (log ε) 230 (−0.85), 265 (−0.62), 328 (−0.56); IR (KBr) νmax 3349, 2942, 2351, 1642, 1607, 1518, 1458, 1424, 1349, 1255, 1220, 1181, 1160, 1126, 1091, 1051, 1026, 837, 673 cm−1; 1H NMR (DMSO-d6, 600 MHz) and 13C NMR (DMSO-d6, 150 MHz): Figures S45 and S46; HRESIMS found m/z 313.1084 [M + H]+ (calcd. for C18H17O5 at 313.1076, m/z error 2.6 ppm).
Diosgenin-3-O-[[β-D-glucopyranosyl(1→4)]-α-L-rhamnopyranosyl(1→4)]-[α-L-rhamnopyranosyl(1→2)]]β-D-glucopyranoside (10): pale yellow amorphous powder; [ α ] D 25 = −39.4 (c 0.1, MeOH); IR (KBr) νmax 3414, 2933, 2898, 2362, 2312, 1542, 1458, 1378, 1309, 1135, 1036, 907, 828, 673, 645 cm−1; 1H NMR (pyridine-d5, 500 MHz) and 13C NMR (pyridine-d5, 125 MHz): Figures S49 and S50; HRESIMS found m/z 1031.5406 [M + H]+ (calcd. for C28H29O15 at 1031.5427, m/z error—2.04 ppm).

2.6. Cell Culture

RAW264.7 cells were generously supplied by Prof. S. H. Sung (Seoul National University, Seoul, Republic of Korea) and were cultured in HyClone Dulbecco’s modified Eagle’s medium (DMEM) from, (Cytiva, Logan, UT, USA). The culture conditions included incubation at 37 °C in 5% CO2 and supplementation with 10% fetal bovine serum (FBS), 100 units/mL of penicillin, and 100 μg/mL of streptomycin. Subculturing was conducted every 48 h.

2.7. LPS-Induced NO Production and Cell Viability

The cells were seeded at a density of 5 × 10⁴ cells/well in 96-well plates and allowed to incubate overnight. Once the cells adhered to the wells, lipopolysaccharide (LPS, 1 μg/mL) was added, both with and without the addition of the isolated compounds. After the treatment of the tested compounds, the Griess reagent method was employed to access the nitrate levels, which consisted of a 1:1 ratio of solution A (1% sulfanilamide) and solution B (5% phosphoric acid with 0.1% naphthyl ethylenediamine-HCl). A microplate reader (VersaMax, Molecular Devices, LLC., San Jose, CA, USA) was used to measure the absorbance at 540 nm. A standard nitrite was used to evaluate the nitrite levels in the samples. Cell viability was assessed using a 3-(4,5-dimethyl-2-thiazolyl)-2,5-diphenyl-2H-tetrazolium bromide (MTT) assay. In short, 3T3-L1 adipocytes were seeded and cultured in DMEM with 10% FBS on 96-well plates. After 24 h of incubation, the cells were treated with the test compounds, which were dissolved in a serum-free medium for one day. Subsequently, 20 µL of the 2 mg/mL MTT solution (Sigma) was added to each well and left to incubate in the dark for 4 h. After discarding the supernatant, formazan was dissolved in DMSO, and the absorbance was measured at 550 nm using a microplate reader (VersaMax, Molecular Devices, LLC., San Jose, CA, USA).

2.8. Bleomycin-Induced Senescence Model

The A549 human lung carcinoma epithelial cell line, resembling the type II epithelial-like cell line, was procured from the Korean Cell Line Bank (Seoul, Republic of Korea). The cells were cultured in an RPMI 1640 medium (Welgene, Deajeon, Republic of Korea) supplemented with 10% FBS (Gibco), 100 U of penicillin, and 100 mg/mL of streptomycin (Hyclone). For experiments involving bleomycin-induced senescence, A549 cells were exposed to 5 mg/mL of bleomycin sulfate (Tokyo Chemical Industry Co., Ltd., Tokyo, Japan) for 4 days in a growth medium. To evaluate the senomorphic effect, cells were co-treated with 5 mg/mL of bleomycin and the indicated compounds for 6 days. Then, RNA was extracted to compare the aging-related markers after bleomycin-induced senescence.

Senescence-Associated β-Galactosidase Staining

Cells were subjected to staining with the Senescence β-Glactosidase Staining Kit (#9860, Cell Signaling Technology, Denver, MA, USA) according to the provided guidelines. Following the staining process, the cell samples were examined under an Olympus ix70 microscope (Olympus Corporation, Tokyo, Japan).

2.9. RNA Extraction and Quantitative Real-Time Polymerase Chain Reaction (qRT-PCR)

Human dermal fibroblast (HDF) cells were seeded in a 6-well plate at a density of 80,000 per well. After a 3-day treatment, 250 µL of the TRIzol reagent (Invitrogen, Waltham, MA, USA) was added to each well for total RNA extraction. Subsequently, 1 µg of the total RNA, along with the M-MLV Reverse Transcriptase kit (Bioneer, Daejeon, Republic of Korea), were used for cDNA synthesis in a 20 µL reaction, which was later diluted to 100 µL and utilized as a template in the following real-time qPCR reactions. Real-time qPCR was conducted using the AccuPower® 2X GreenStar™ qPCR Master Mix (Bioneer), and all reactions were executed in triplicate with the expression levels of the markers normalized to the expression level of 18s ribosomal RNA.

2.10. Statistical Analyses

The data underwent analysis through GraphPad PRISM 5 software (GraphPad Software, Inc., La Jolla, CA, USA) and are expressed as the mean ± standard deviation (SD) derived from triplicate experiments. To substantiate comparisons among the group means, an analysis of variance (ANOVA) was applied, followed by Tukey’s multiple comparison test for post hoc analysis. Statistical significance was established at a threshold of p < 0.05.

3. Results

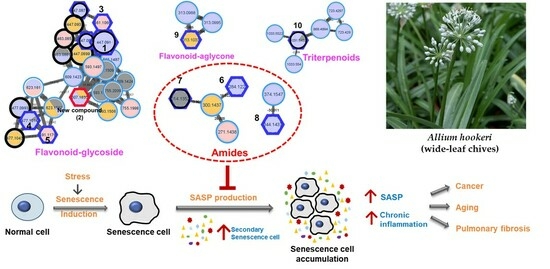
3.1. Feature-Based Molecular Networking of the A. hookeri Leaf Extract

The mass data of the total extract and three fractions (H1–H3) were analyzed using MassHunter software, and the results are shown in Figure S1 (Supplementary Materials) for the positive mode. For the molecular networking analysis, the feature-based molecular networking (FBMN) generated from the GNPS platform was visualized using Cytoscape, as shown in Figure S2 (Supplementary Materials) for the full network and Figure 1A for the clusters of interest.
As shown in Figure 1A, four clusters of interest were identified, including flavonoid-glycosides, amides, and triterpenoids. In the flavonoid–glycoside cluster, three compounds were annotated using the GNPS platform against the online database of GNPS, namely, apigenin-7-O-glucuronide (m/z 447 Da), (2S,3S,4S,5R,6S)-6-[2-(3,4-dihydroxyphenyl)-5-hydroxy-4-oxochromen-7-yl]oxy-3,4,5-trihydroxyoxane-2-carboxylic acid (m/z 463 Da), and (2S,3S,4S,5R,6S)-3,4,5-trihydroxy-6-[5-hydroxy-2-(4-hydroxyphenyl)-6-methoxy-4-oxochromen-7-yl]oxyoxane-2-carboxylic acid (m/z 477 Da). The amide cluster displayed the presence of moupinamide (N-trans-feruloyltyramine) (m/z 314 Da), while the triterpenoid group was suggested to contain the compound β-D-glucopyranoside (3β,22β,25R)-26-(β-D-glucopyranosyloxy)-22-hydroxyfurost-5-en-3-yl O-6-deoxy-α-L-mannopyranosyl-(1→2)-O-[6-deoxy-α-L-mannopyranosyl-(1→4)] (m/z 1031 Da). The mass data for each putative compound were analyzed in detail to understand their fragmentation pattern, which is exhibited in Figure 1B. Among these annotated compounds, compounds 1, 7, and 10 were isolated to confirm their structures.
Compound 1, observed within the flavonoid–glycoside cluster at an m/z value of 447.0899 Da (Figure 1A), was characterized as apigenin-7-O-glucuronide via a comparison against GNPS library matching. Additionally, its identification was corroborated via nuclear magnetic resonance (NMR) spectroscopy, referencing previously documented data from the literature [37]. The mass fragmentation analysis of compound 1 and the other identified nodes (black circle) within the flavonoid–glycoside cluster revealed the consistent presence of a glucuronic acid moiety, as evidenced by distinct m/z differences of 176 Da in their primary fragments (Figure 1B). A node of m/z 461.1068 Da was not assigned against GNPS libraries. However, this node was clustered in the same group as compound 1, and the mass difference of 14 Da suggests that an additional methoxy (-OCH3) replaced a hydroxy group. Compound 3 was then isolated, and the structure was confirmed as the apigenin 7-O-glucuronide methyl ester via NMR spectra compared to the literature [38] and mass fragmentation analysis (Figure 2A). Similarly, compound 4, which shared the same m/z value but had a different retention time to the annotated compound (2S,3S,4S,5R,6S)-3,4,5-trihydroxy-6-[5-hydroxy-2-(4-hydroxyphenyl)-6-methoxy-4-oxochromen-7-yl]oxyoxane-2-carboxylic acid was further confirmed by its mass fragments and NMR data to be chrysoeriol-7-O-β-D-glucuronide [39]. The mass data of compound 5 (m/z 491 Da) showed a loss of 191 Da, which is characteristic of a methyl-GlA, a methoxy (30 Da), and a hydroxy (17 Da). Additionally, a mass difference of 14 Da compared to compound 4 indicated that 5 had an additional methyl group attached in the GlA unit to form the methyl GlA ester. Compound 5 was also purified, and the structure was confirmed using NMR and comparing it to the reference, confirming it to be the chrysoeriol-7-O-β-D-glucuronic acid methyl ester [40]. Compound 9, situated within a flavonoid–aglycone cluster (Figure 1A) and exhibiting an observed m/z value of 313.1084 Da, was conclusively identified as 5,7,4′-trimethoxyflavone. This determination was based on its NMR spectroscopic data, which sufficiently matches the literature report [41] and is further supported by mass fragmentation analysis, which revealed the presence of a fragment with an m/z of 287 Da [M−OCH3]+, as shown in Figure 2A.
An analysis of the fragmentation of 7 suggested that it contained a methoxy unit due to the observation of a m/z 30 Da (-OCH3) loss. Following isolation, NMR elucidation, and comparison with the literature, 7 was identified to be the same as the GNPS assignment of N-trans-feruloyltyramine [42]. Compound 6 (m/z 284 Da) was located in the same cluster as 7 and showed a 30 Da mass difference, indicating the absence of the methoxy group compared to 7. Compound 6 was isolated, and its NMR confirmed the structure to be paprazine [43]. Compound 8 (m/z 344 Da) suggested the presence of an additional methoxy compared to 7. The NMR of 8 was analyzed and compared with previous reports to identify it as N-trans-feruloyl-3-O-methyldopamine [43].
In the triterpenoid cluster, compound 10 (m/z 1031 Da) was suggested to be diosgenin-3-O-[[β-d-glucopyranosyl(1→4)]-α-l-rhamnopyranosyl(1→4)]-[α-l-rhamnopyranosyl(1→2)]]β-d-glucopyranoside. The mass fragmentation analysis agreed with the presence of two rhamose (Rham) units, as evidenced by the mass loss at m/z 146 Da. It also contained two glucose (Glc) moieties, as indicated by the mass loss at m/z 162 Da. After isolation, NMR analysis, and comparison to previous reports, the structure of 10 was confirmed to be annotated [44]. Within this cluster, two nodes with m/z values of 1033 Da were observed, differing by two hydrogens from compound 10 yet sharing identical fragments, including those at 577, 739, and 885 Da. The mass loss analysis of these nodes indicates the presence of 2 Glc (−162 Da), 1 Rham (−146 Da), and Arabinose (Ara, −148 Da). This information allows for two possible structural configurations, as displayed in Figure S4A (Supplementary Materials). Similarly, a node at 869.4894 Da within the same cluster displayed fragments indicative of mass losses corresponding to two Rham (146 Da) and a Glc (162 Da). Compared to compound 10, this node exhibited a mass difference of 162 Da, suggesting the presence of an additional Glc. Consequently, this structure can be assigned to one of nine potential configurations, as illustrated in Figure S4B (Supplementary Materials). Furthermore, within this cluster, two nodes were identified at m/z 723.4238 and 723.4296 Da (with retention times of 8.15 and 13.36 min, respectively), indicating a 308 Da mass difference [= 162 (Glc) + 146 (Rham)] in comparison to compound 10. The mass fragmentation analysis of these two peaks was conducted and searched in SciFinder, revealing 19 possible structural candidates (Figure S4C,D, Supplementary Materials). These predicted compounds vary in their absolute configurations, which cannot be discerned solely through mass analysis.

3.2. Isolation and Structural Elucidation of New Compound 2

The crude extract was further applied to various column chromatography methods to isolate ten compounds, comprising one new compound (2) and nine known compounds (1, 310), as shown in Figure 1. The chemical structures of known compounds were confirmed via mass analysis and a comparison with previous reports, as mentioned above.
Compound 2 was obtained as a pale yellow powder with an established molecular formula of C28H30O15 based on its negative HRESIMS at 605.1500 [M − H] (calcd for C28H29O15 at 605.1506). In the FBMN, compound 2 was observed in a cluster of flavonoid–glycosides, suggesting that the structure of 2 has the same skeleton. As shown in Figure 3, the mass fragmentation of 2 indicated that it contained one Rham (m/z 146 Da) and one methyl-GlA (m/z 190 Da) unit. The 1H NMR spectrum of 2 showed five aromatic proton signals at δH 7.85 (2H, d, J = 5.1 Hz), 7.20 (overlap), 7.19 (2H, overlap), 7.04 (1H, s), one olefinic proton at δH 6.93 ppm, two anomeric signals at δH 5.44 (1H, d, J = 7.5 Hz) and 5.11 (1H, d, J = 1.8 Hz), six oxygenated protons [δH 4.65, t (7.8); 4.47, t (8.8); 4.52, t (8.8); 4.88, d (8.5); 4.84, br s; 4.58, d (7.7); 4.38, t (9.1); 4.80, m], one methoxy group (δH 3.90, s) and one methyl group [δH 1.18, d, (6.3)]. The 13C NMR data of 2 displayed 28 carbon signals, including one ketone (δC 183.3), an ester carbon (δC 170.4), 14 aromatic signals (δC 100.8–165.5), two anomeric carbons (δC 100.0, 95.6), eight carbons bearing oxygen (δC 70.6–78.7), and one methyl (δC 19.4). The HMBC data of 2 confirmed the presence of a flavone moiety via the correlations in the two aromatic rings (Figure 3B). The glucuronic acid attached to C-7 of the flavone moiety was revealed by the cross-peaks from H-1ʹ (δH 6.03, d, J = 7.3 Hz) to C-7 (δC 163.7). The methoxy group attached to C-3ʹ was confirmed by the correlation from the methoxy proton signal (δH 3.89, s) to aromatic carbon at δC 148.8 ppm. The rhamnose sugar moiety was identified by the presence of a methyl group (δH 1.18, d, (6.0)/δC 18.0 ppm) and its correlation with carbon signals of sugar at δC 69.4 and 73.0 ppm. The position of rhamnose moiety was represented by the correlation from H-1ʹʹʹ (δH 6.45 ppm) to C-2″ (δC 77.8 ppm). The absolute configuration of the sugar unit was determined following acid hydrolysis and compared with the authentic sugar. The retention time of the sugar derivative in 2 was consistent with that of authentic sugar. Therefore, the structure of 2 was identified, as shown in Figure 3, and named apigenin-7-O-[α-L-rhamnopyranosyl(1→2)]β-D-glucuronic acid methyl ester.

3.3. Bio-Activity of Isolated Compounds from A. hookeri

In our assay system, senescent human dermal fibroblast (HDF) or lung fibroblast (IMR-90) cells were induced by replicative exhaustion. SA-β-gal activity and SASP secretion were used to evaluate senomorphic activity. Positive SA-β-gal staining and overexpression of SASP factors such as IL-6, IL-8, and IL-1α were confirmed in replicative senescent HDF cells. Drugs that reduced SA-β-gal staining or inhibited expression of these SASP factors are thought to be senomorphic candidates.
Ten isolated compounds (110) from A. hookeri were evaluated for their capacity in reducing NO production. The cell viability of these compounds was tested at 5 and 20 µM on LPS-induced NO production in RAW 264.7 cells compared to quercetin, a positive control. As a result, no compounds showed any cytotoxicity up to 20 µM (Figure 4A), and among them, compound 6 showed the best effect in reducing NO production (Figure 4B). In addition, compounds 68 shared similar structures, so their senomorphic effects in bleomycin (BLM)-senescent A549 cells were further evaluated. Two SASP markers, IL-6 and IL-8, were used to test senomorphic activity. As shown in Figure 5A,B, compounds 68 reduced the expression of both IL-6 and IL-8 in stress-induced senescent A549 cells that were exposed to 5 µM of BML after 6 days of treatment. The dose-dependent manner of each compound was also tested, and compounds 68 were found to have senomorphic effects by decreasing the expression of IL-6 and IL-8 (Figure 5B). After 6 days of treatment, the SA-β-gal staining was significantly reduced by 10 µM without any detected toxicity for all three compounds (Figure 5C). Furthermore, the SASP inhibitory activities of 68 in replicative senescent HDF cells were tested. The compounds were treated at 10 µM on replicative senescent HDF cells, which were confirmed to be senescent through positive SA-β-gal staining (Figure S52, Supplementary Materials) and upregulated SASP makers, including IL-1α and IL-8. After 72 h of treatment, compounds 68 significantly reduced the expression of IL-1α and IL-8 (Figure 6A,B). Among them, compound 7 showed the best effect in replicative senescent HDF cells in a dose-dependent manner. As a result, compound 7 showed senomorphic activities in replicative senescent HDF cells at 5 and 10 µM by significantly reducing the expression levels of both IL-1α and IL-8 (Figure 6C,D).

4. Discussion

In this study, a new compound (2) was identified, alongside nine known compounds (1, 310), isolated from A. hookeri. The application of the feature-based molecular networking (FBMN) strategy not only provided a detailed chemical profile of metabolites in this extensively studied plant but also proved effective in isolating a novel compound from A. hookeri, thereby enriching its chemical diversity.
The senomorphic effects of all the isolated phytochemicals, characterized by a reduction in SASP markers, including IL-6, IL-8, IL-1α, and SA-β-gal, staining were evaluated. The results indicate that N-trans-feruloyltyramine (7) exhibits the most promising SASP-inhibitory activity among the isolated compounds. Notably, cellular senescence is integral to the wound-healing process, with the persistent presence of senescence-associated secretory phenotypes (SASP) marked by indicators of senescence, oxidative stress, and proinflammatory cytokines in fibroblasts, highlighting their involvement in the chronic wound pathology [33,34]. Consequently, the inhibition of SASP markers could potentially contribute to wound healing, aligning with the traditional use of A. hookeri. Furthermore, this is the first report of the senomorphic activity of N-trans-feruloyltyramine, which has previously been demonstrated to possess a wide range of biological effects, such as protection against scopolamine-induced cholinergic dysfunction on the cortex and hippocampus [45] and β-amyloid peptide-induced neurotoxicity [46], the inhibition of melanin biosynthesis [47], antioxidant, cytotoxic activities, and protection against H2O2-induced oxidative damage [48].
Of particular interest, the active compounds (68) had a similar skeleton to avenanthramide C (Avn C), with the only difference being the phenyl ethyl moieties of 6–8 and the unit of benzoic acid of avenanthramide C. Avenanthramide C has recently been extensively studied for its protective effects against pediatric pneumonia [49], allergic inflammation [50], its senomorphic effect [51], and ability to restore impaired plasticity and cognition in a mice model of Alzheimer’s disease [52]. The in vitro results from these studies suggested that Avn C reduces cytokines, including IL-4 [50], IL-6 [50,51], IL-8 [51], TNF-α [50,51], and SASP [51]. These findings are consistent with the present study’s data, which demonstrate the potential of phenolamides from A. hookeri to inhibit SASP in senescent cells and contribute to their senomorphic activities. Hence, its natural amide skeleton could be a promising analog for developing drugs to treat age-related diseases.
This study leveraged advanced analytical techniques, specifically UHPLC-qTOF-MS/MS-based molecular networking, to rapidly elucidate the secondary metabolite profile of hooker chive (A. hookeri), a plant of nutritional and medicinal significance. This approach facilitated the identification of a novel compound within the plant. Furthermore, the senomorphic activity of A. hookeri was elucidated for the first time, with particular attention given to the active skeleton, phenolamides, and the principal compound, N-trans-feruloyltyramine. This revelation establishes a link between the traditional uses of the plant and its in vitro physiological effects. Nevertheless, this study is not without limitations. Firstly, the chemical profiling of A. hookeri relied on putative constructions derived from GNPS libraries, which may have omitted certain well-established compounds that were not present in shared repositories or that were misaligned due to the structural isomers inherent in natural products. Secondly, the investigation has yet to unveil the mechanistic basis underlying the senomorphic effects exerted by the lead compound.

5. Conclusions

In summary, the study employed HRESI-qTOF-MS/MS-based molecular networking to the phytochemical profile of A. hookeri leaves, revealing flavonoid–glycosides, flavonoid–aglycones, triterpenoids, and phenolamides. Subsequently, ten compounds, comprising one new flavonoid (apigenin-7-O-[α-L-rhamnopyranosyl(1→2)]β-D-glucuronic acid methyl ester) and nine known ones, were isolated and identified through NMR analysis. An evaluation of these compounds demonstrated their impact on the senescent cell-associated secretory phenotype (SASP), with N-trans-feruloyltyramine (7) emerging as the most potent inhibitor. This underscores its crucial role in A. hookeri’s senomorphic activities, suggesting the potential of phenolamides as valuable bioactive compounds for combating senescence-associated diseases.

Supplementary Materials

The following supporting information can be downloaded at: https://www.mdpi.com/article/10.3390/nu15245109/s1, Figure S1. Total ion chromatography (TIC) using HR-ESI -qTOF-MS/MS of A. hookeri leaf extract and its fractions in positive mode. Figure S2. Total ion chromatography (TIC) of A. hookeri leaf extract and Sep-Pak fractions (0–100% MeOH/H2O) using HR-ESI -qTOF-MS/MS in positive mode, Figure S3. Feature-based molecular networking of fractions and crude extract from leaves of Allium hookeri using HRESI-qTOF-MS/MS. Mass data was recorded in positive mode, Figure S4. Chemical structures of putative identification of components from leaves of Allium hookeri using HRESI-qTOF-MS/MS-based molecular networking, Figure S5. Mass/mass fragmentation of triterpenoid cluster in FBMN, Figure S6. HRESIMS data of compound 2, Figure S7. IR(KBr) spectrum of compound 2, Figure S8. 1H NMR spectrum of compound 2 (600 MHz, pyridine-d5), Figure S9. 13C NMR spectrum of compound 2 (150 MHz, pyridine-d5), Figure S10. HSQC spectrum of compound 2, Figure S11. HMBC spectrum of compound 2, Figure S12. The COSY spectrum of compound 2, Figure S13. HRESIMS/MS of compound 1, Figure S14. IR(KBr) spectrum of compound 1, Figure S15. 1H NMR spectrum of compound 1 (400 MHz, DMSO-d6), Figure S16. HRESIMS/MS of compound 3, Figure S17. IR(KBr) spectrum of compound 3, Figure S18. 1H NMR spectrum of compound 3 (600 MHz, DMSO-d6), Figure S19. 13C NMR spectrum of compound 3 (150 MHz, DMSO-d6), Figure S20. HRESIMS data of compound 4, Figure S21. UV spectrum of compound 4, Figure S22. IR(KBr) spectrum of compound 4, Figure S23. 1H NMR spectrum of compound 4 (500 MHz, DMSO-d6), Figure S24. 13C NMR spectrum of compound 4 (125 MHz, DMSO-d6), Figure S25. HRESIMS data of compound 5, Figure S26. UV spectrum of compound 5, Figure S27. IR(KBr) spectrum of compound 5, Figure S28. 1H NMR spectrum of compound 5 (600 MHz, DMSO-d6), Figure S29. 13C NMR spectrum of compound 5 (150 MHz, DMSO-d6), Figure S30. HRESIMS data of compound 6, Figure S31. IR(KBr) spectrum of compound 6, Figure S32. 1H NMR spectrum of compound 6 (500 MHz, DMSO-d6), Figure S33. 13C NMR spectrum of compound 6 (125 MHz, DMSO-d6), Figure S34. HRESIMS data of compound 7, Figure S35. IR(KBr) spectrum of compound 7, Figure S36. 1H NMR spectrum of compound 7 (400 MHz, DMSO-d6), Figure S37. 13C NMR spectrum of compound 7 (100 MHz, DMSO-d6), Figure S38. HRESIMS data of compound 8, Figure S39. UV spectrum of compound 8, Figure S40. IR(KBr) spectrum of compound 8, Figure S41. 1H NMR spectrum of compound 8 (600 MHz, DMSO-d6), Figure S42. 13C NMR spectrum of compound 8 (150 MHz, DMSO-d6), Figure S43. HRESIMS/MS data of compound 9, Figure S44. UV spectrum of compound 9, Figure S45. IR(KBr) spectrum of compound 9, Figure S46. 1H NMR spectrum of compound 9 (600 MHz, DMSO-d6), Figure S47. 13C NMR spectrum of compound 9 (150 MHz, DMSO-d6), Figure S48. HRESIMS/MS data of compound 10, Figure S49. IR(KBr) spectrum of compound 10, Figure S50. 1H NMR spectrum of compound 10 (500 MHz, pyridine-d5), Figure S51. 13C NMR spectrum of compound 10 (125 MHz, pyridine-d5), Figure S52. Inhibitory effects of fractions and single compounds from A. hookeri on BLM-induced senescence system in RAW 264.7 cells using nitric oxide (NO) assay kit, Figure S53. SA-β-gal-positive senescent cells on replicative senescent HDF cell, Table S1. Putative identification of components from leaves of Allium hookeri using HRESI-qTOF-MS/MS-based molecular networking.

Author Contributions

Conceptualization and Methodology, T.-P.D., J.-P.A. and M.Z.; Investigation, T.-P.D., M.Z. and E.-J.P.; Resources, J.-E.P.-Z. and V.-H.M.; Data curation, T.-P.D., M.Z. and B.R.; Writing—original draft preparation, T.-P.D. and M.Z.; Writing—review and editing, T.-P.D. and W.-K.O.; Visualization, T.-P.D. and M.Z.; Supervision, Project administration, and Funding acquisition, W.-K.O. All authors have read and agreed to the published version of the manuscript.

Funding

This research was supported by grants from the Basic Science Research Program (NRF-2022R1A2C2005061) and (RS-2023-00218616) through the National Research Foundation of Korea (NRF), funded by the Ministry of Science and ICT in Korea.

Institutional Review Board Statement

Not applicable.

Informed Consent Statement

Not applicable.

Data Availability Statement

Data available in a publicly accessible repository.

Conflicts of Interest

The authors declare no conflict of interest.

References

  1. The World Flora Online Allium L. Available online: https://wfoplantlist.org/plant-list/taxon/wfo-4000001260-2023-06?page=1 (accessed on 24 November 2023).
  2. Sabiu, S.; Madende, M.; Ajao, A.A.; Aladodo, R.A.; Nurain, I.O.; Ahmad, J.B. The Genus Allium (Amaryllidaceae: Alloideae): Features, Phytoconstituents, and Mechanisms of Antidiabetic Potential of Allium Cepa and Allium Sativum. In Bioactive Food as Dietary Interventions for Diabetes; Elsevier: Amsterdam, The Netherlands, 2019; pp. 137–154. [Google Scholar]
  3. Ren, F.; Wang, L.; Zhuo, W.; Chen, D.; Huang, H.; Zhang, L. Complete Chloroplast Genome of the Rare Medicinal Vegetable Allium hookeri. Mitochondrial DNA Part B 2022, 7, 6–7. [Google Scholar] [CrossRef] [PubMed]
  4. Deka, B.; Manna, P.; Borah, J.C.; Talukdar, N.C. A Review on Phytochemical, Pharmacological Attributes and Therapeutic Uses of Allium hookeri. Phytomed. Plus 2022, 2, 100262. [Google Scholar] [CrossRef]
  5. Ayam, V. Allium hookeri, Thw. Enum. A Lesser Known Terrestrial Perennial Herb Used as Food and Its Ethnobotanical Relevance in Manipur. AJFAND 2011, 11, 5389–5412. [Google Scholar] [CrossRef]
  6. Bae, G.-C.; Bae, D.-Y. The Anti-Inflammatory Effects of Ethanol Extract of Allium hookeri Cultivated in South Korea. Korea J. Herbol. 2012, 27, 55–61. [Google Scholar] [CrossRef]
  7. Park, E.-K.; Noh, J.-G.; Lee, M.-J.; Nam, S.-Y.; Hong, E.-Y.; Lee, C.-H. Effects of Shading Rates on Growth and Yield of Allium hookeri Cultivation at Greenhouse in Middle Area of Korea. Prot. Hortic. Plant Fact. 2016, 25, 320–327. [Google Scholar] [CrossRef]
  8. Choi, J.-H.; Lee, E.-B.; Jang, H.-H.; Cha, Y.-S.; Park, Y.-S.; Lee, S.-H. Allium hookeri Extracts Improve Scopolamine-Induced Cognitive Impairment via Activation of the Cholinergic System and Anti-Neuroinflammation in Mice. Nutrients 2021, 13, 2890. [Google Scholar] [CrossRef] [PubMed]
  9. Sharma, G.; Gohil, R.N.; Kaul, V. Cytological Status of Allium hookeri Thwaites (2n = 22). Genet. Resour. Crop Evol. 2011, 58, 1041–1050. [Google Scholar] [CrossRef]
  10. Kala, C.P. Ethnomedicinal Botany of the Apatani in the Eastern Himalayan Region of India. J. Ethnobiol. Ethnomed. 2005, 1, 11. [Google Scholar] [CrossRef]
  11. Bok, S.; Seo, J.; Bae, C.; Kang, B.; Cho, S.; Park, D. Allium hookeri Root Extract Regulates Asthmatic Changes through Immunological Modulation of Th1/Th2-related Factors in an Ovalbumin-induced Asthma Mouse Model. Mol. Med. Rep. 2019, 20, 3215–3223. [Google Scholar] [CrossRef]
  12. Jun, H.-I.; Jang, H.; Ahn, D.; Kim, D.K.; Yang, J.H.; Yun, B.S.; Kim, Y.S. Isolation and Characterization of Phenolic Compound from Allium hookeri Root for Potential Use as Antioxidant in Foods. Food Sci. Biotechnol. 2015, 24, 2031–2034. [Google Scholar] [CrossRef]
  13. Rho, S.H.; You, S.; Kim, G.-H.; Park, H.J. Neuroprotective Effect of Allium hookeri against H2O2-Induced PC12 Cell Cytotoxicity by Reducing Oxidative Stress. Food Sci. Biotechnol. 2020, 29, 1519–1530. [Google Scholar] [CrossRef] [PubMed]
  14. Kim, J.E.; Seo, J.H.; Bae, M.S.; Bae, C.S.; Yoo, J.C.; Bang, M.A.; Cho, S.S.; Park, D.H. Antimicrobial Constituents from Allium hookeri Root. Nat. Prod. Commun. 2016, 11, 237–238. [Google Scholar] [CrossRef]
  15. Roh, S.S.; Kwon, O.J.; Yang, J.H.; Kim, Y.S.; Lee, S.H.; Jin, J.S.; Jeon, Y.D.; Yokozawa, T.; Kim, H.J. Allium hookeri Root Protects Oxidative Stress-Induced Inflammatory Responses and β-Cell Damage in Pancreas of Streptozotocin-Induced Diabetic Rats. BMC Complement. Altern. Med. 2016, 16, 63. [Google Scholar] [CrossRef]
  16. Park, S.H.; Bae, U.J.; Choi, E.K.; Jung, S.J.; Lee, S.H.; Yang, J.H.; Kim, Y.S.; Jeong, D.Y.; Kim, H.J.; Park, B.H.; et al. A Randomized, Double-Blind, Placebo-Controlled Crossover Clinical Trial to Evaluate the Anti-Diabetic Effects of Allium hookeri Extract in the Subjects with Prediabetes. BMC Complement. Med. Ther. 2020, 20, 211. [Google Scholar] [CrossRef] [PubMed]
  17. Lee, Y.; Hyen Lee, S.; Sun Jeong, M.; Kim, J.B.; Hee Jang, H.; Choe, J.; Kim, D.W.; Lillehoj, H.S. In Vitro Analysis of the Immunomodulating Effects of Allium hookeri on Lymphocytes, Macrophages, and Tumour Cells. J. Poult. Sci. 2017, 54, 142–148. [Google Scholar] [CrossRef]
  18. Jang, J.Y.; Lee, M.J.; You, B.R.; Jin, J.S.; Lee, S.H.; Yun, Y.R.; Kim, H.J. Allium hookeri Root Extract Exerts Anti-Inflammatory Effects by Nuclear Factor-ΚB down-Regulation in Lipopolysaccharide-Induced RAW264.7 Cells. BMC Complement. Altern. Med. 2017, 17, 126. [Google Scholar]
  19. Kim, H.; Rho, S.H.; Lim, J.; Park, H.J.; Jeong, H. Protective Effect of Linoleic Acid against Inflammatory Reactions by Mast Cell via Caspase-1 Cascade Pathways. J. Food Biochem. 2019, 43, e12932. [Google Scholar] [CrossRef]
  20. Park, H.; Jeong, J.; Hyun, H.; Kim, J.; Kim, H.; Oh, H.; Choi, J.; Hwang, H.; Oh, D.; Kim, J.; et al. Effects of a Hot-Water Extract of Allium hookeri Roots on Bone Formation in Human Osteoblast-Like MG-63 Cells In Vitro and in Rats In Vivo. Planta Med. 2016, 82, 1410–1415. [Google Scholar] [CrossRef]
  21. Park, S.; No, K.; Lee, J. Anti-Obesity Effect of Allium hookeri Leaf Extract in High-Fat Diet-Fed Mice. J. Med. Food 2018, 21, 254–260. [Google Scholar] [CrossRef]
  22. Yang, M.H.; Kim, N.H.; Heo, J.D.; Rho, J.R.; Ock, K.J.; Shin, E.C.; Jeong, E.J. Comparative Evaluation of Sulfur Compounds Contents and Antiobesity Properties of Allium hookeri Prepared by Different Drying Methods. Evid.-Based Complement. Altern. Med. 2017, 2017, 2436927. [Google Scholar] [CrossRef]
  23. Hwang, J.S.; Lee, B.H.; An, X.; Jeong, H.R.; Kim, Y.E.; Lee, I.; Lee, H.; Kim, D.O. Total Phenolics, Total Flavonoids, and Antioxidant Capacity in the Leaves, Bulbs, and Roots of Allium hookeri. Korean J. Food Sci. Technol. 2015, 47, 261–266. [Google Scholar] [CrossRef]
  24. Park, S.Y.; Je, J.Y.; Ahn, C.B. Phenolic Composition and Hepatoprotective Activities of Allium hookeri Against Hydrogen-Peroxide-Induced Oxidative Stress in Cultured Hepatocytes. J. Food Biochem. 2016, 40, 284–293. [Google Scholar] [CrossRef]
  25. Li, R.; Wang, Y.F.; Sun, Q.; Hu, H. Bin Chemical Composition and Antimicrobial Activity of the Essential Oil from Allium hookeri Consumed in Xishuangbanna, Southwest China. Nat. Prod. Commun. 2014, 9, 863–864. [Google Scholar] [PubMed]
  26. Thiyagarajan, J.A.; Mikton, C.; Harwood, R.H.; Gichu, M.; Gaigbe-Togbe, V.; Jhamba, T.; Pokorna, D.; Stoevska, V.; Hada, R.; Steffan, G.S.; et al. The UN Decade of Healthy Ageing: Strengthening Measurement for Monitoring Health and Wellbeing of Older People. Age Ageing 2022, 51, afac147. [Google Scholar] [CrossRef] [PubMed]
  27. Beard, J.R.; Officer, A.; de Carvalho, I.A.; Sadana, R.; Pot, A.M.; Michel, J.-P.; Lloyd-Sherlock, P.; Epping-Jordan, J.E.; Peeters, G.M.E.E.G.; Mahanani, W.R.; et al. The World Report on Ageing and Health: A Policy Framework for Healthy Ageing. Lancet 2016, 387, 2145–2154. [Google Scholar] [CrossRef] [PubMed]
  28. Boccardi, V.; Mecocci, P. Senotherapeutics: Targeting Senescent Cells for the Main Age-Related Diseases. Mech. Ageing Dev. 2021, 197, 111526. [Google Scholar] [CrossRef] [PubMed]
  29. Sun, Y.; Coppé, J.P.; Lam, E.W.F. Cellular Senescence: The Sought or the Unwanted? Trends Mol. Med. 2018, 24, 871–885. [Google Scholar] [CrossRef] [PubMed]
  30. van Deursen, J.M. The Role of Senescent Cells in Ageing. Nature 2014, 509, 439–446. [Google Scholar] [CrossRef]
  31. Huang, W.; Hickson, L.J.; Eirin, A.; Kirkland, J.L.; Lerman, L.O. Cellular Senescence: The Good, the Bad and the Unknown. Nat. Rev. Nephrol. 2022, 18, 611–627. [Google Scholar] [CrossRef]
  32. Jun, J.-I.; Lau, L.F. The Matricellular Protein CCN1 Induces Fibroblast Senescence and Restricts Fibrosis in Cutaneous Wound Healing. Nat. Cell Biol. 2010, 12, 676–685. [Google Scholar] [CrossRef]
  33. Thompson, E.L.; Pitcher, L.E.; Niedernhofer, L.J.; Robbins, P.D. Targeting Cellular Senescence with Senotherapeutics: Development of New Approaches for Skin Care. Plast. Reconstr. Surg. 2022, 150, 12S–19S. [Google Scholar] [CrossRef] [PubMed]
  34. Vande Berg, J.S.; Rose, M.A.; Haywood-Reid, P.L.; Rudolph, R.; Payne, W.G.; Robson, M.C. Cultured Pressure Ulcer Fibroblasts Show Replicative Senescence with Elevated Production of Plasmin, Plasminogen Activator Inhibitor-1, and Transforming Growth Factor-β1. Wound Repair Regen. 2005, 13, 76–83. [Google Scholar] [CrossRef] [PubMed]
  35. Li, W.; Qin, L.; Feng, R.; Hu, G.; Sun, H.; He, Y.; Zhang, R. Emerging Senolytic Agents Derived from Natural Products. Mech. Ageing Dev. 2019, 181, 1–6. [Google Scholar] [CrossRef] [PubMed]
  36. Luís, C.; Maduro, A.T.; Pereira, P.; Mendes, J.J.; Soares, R.; Ramalho, R. Nutritional Senolytics and Senomorphics: Implications to Immune Cells Metabolism and Aging—From Theory to Practice. Front. Nutr. 2022, 9, 958563. [Google Scholar] [CrossRef] [PubMed]
  37. Lee, Y.; Kim, H.M.; Kim, J.H.; Lee, J.-H.; Zhang, K.X.; Gao, E.M.; Jeon, J.-S.; Syed, A.S.; Son, R.H.; Kim, J.-Y.; et al. Chemical Constituents of the Ajuga Multiflora Bunge and Their Protective Effects on Dexamethasone-Induced Muscle Atrophy in C2C12 Myotubes. Nat. Prod. Res. 2023, 37, 1978–1985. [Google Scholar] [CrossRef]
  38. Lehbili, M.; Alabdul Magid, A.; Kabouche, A.; Voutquenne-Nazabadioko, L.; Abedini, A.; Morjani, H.; Gangloff, S.C.; Kabouche, Z. Antibacterial, Antioxidant and Cytotoxic Activities of Triterpenes and Flavonoids from the Aerial Parts of Salvia Barrelieri Etl. Nat. Prod. Res. 2018, 32, 2683–2691. [Google Scholar] [CrossRef]
  39. Myagchilov, A.V.; Gorovoi, P.G.; Sokolova, L.I. Flavonoids from Serratula Komarovii Iljin (the Asteraceae Family). Russ. J. Bioorg. Chem. 2021, 47, 1418–1423. [Google Scholar] [CrossRef]
  40. Yanting, L.R.J.B.X.Z. Chrysoeriol-7-O-Beta-D Glucuronic Acid Methyl Ester and Extraction Method and Application Thereof. Patent CN107446009A, 8 December 2017. [Google Scholar]
  41. Sutthanut, K.; Sripanidkulchai, B.; Yenjai, C.; Jay, M. Simultaneous Identification and Quantitation of 11 Flavonoid Constituents in Kaempferia Parviflora by Gas Chromatography. J. Chromatogr. A 2007, 1143, 227–233. [Google Scholar] [CrossRef]
  42. van Zadelhoff, A.; Vincken, J.P.; de Bruijn, W.J.C. Facile Amidation of Non-Protected Hydroxycinnamic Acids for the Synthesis of Natural Phenol Amides. Molecules 2022, 27, 2203. [Google Scholar] [CrossRef]
  43. Zheng, Y.; Su, B.; Wang, Y.; Wang, H.; Liao, H.; Liang, D. New Tyramine- and Aporphine-Type Alkamides with NO Release Inhibitory Activities from Piper puberulum. J. Nat. Prod. 2021, 84, 1316–1325. [Google Scholar] [CrossRef]
  44. Chen, S.; Snyder, J.K. Diosgenin-Bearing, Molluscicidal Saponins from Allium Vineale: An NMR Approach for the Structural Assignment of Oligosaccharide Units. J. Org. Chem. 1989, 54, 3679–3689. [Google Scholar] [CrossRef]
  45. Thangnipon, W.; Ngampramuan, S.; Suthprasertporn, N.; Jantrachotechatchawan, C.; Tuchinda, P.; Nobsathian, S. Protective Roles of N-Trans-Feruloyltyramine Against Scopolamine-Induced Cholinergic Dysfunction on Cortex and Hippocampus of Rat Brains. Siriraj Med. J. 2021, 73, 413–422. [Google Scholar] [CrossRef]
  46. Thangnipon, W.; Suwanna, N.; Kitiyanant, N.; Soi-ampornkul, R.; Tuchinda, P.; Munyoo, B.; Nobsathian, S. Protective Role of N-Trans-Feruloyltyramine against β-Amyloid Peptide-Induced Neurotoxicity in Rat Cultured Cortical Neurons. Neurosci. Lett. 2012, 513, 229–232. [Google Scholar] [CrossRef] [PubMed]
  47. Efdi, M.; Ohguchi, K.; Akao, Y.; Nozawa, Y.; Koketsu, M.; Ishihara, H. N-Trans-Feruloyltyramine as a Melanin Biosynthesis Inhibitor. Biol. Pharm. Bull. 2007, 30, 1972–1974. [Google Scholar] [CrossRef] [PubMed]
  48. Gao, X.; Wang, C.; Chen, Z.; Chen, Y.; Santhanam, R.K.; Xue, Z.; Ma, Q.; Guo, Q.; Liu, W.; Zhang, M.; et al. Effects of N-Trans-Feruloyltyramine Isolated from Laba Garlic on Antioxidant, Cytotoxic Activities and H2O2-Induced Oxidative Damage in HepG2 and L02 cells. Food Chem. Toxicol. 2019, 130, 130–141. [Google Scholar] [CrossRef] [PubMed]
  49. Pu, Z.; Shen, C.; Zhang, W.; Xie, H.; Wang, W. Avenanthramide C from Oats Protects Pyroptosis through Dependent ROS-Induced Mitochondrial Damage by PI3K Ubiquitination and Phosphorylation in Pediatric Pneumonia. J. Agric. Food Chem. 2022, 70, 2339–2353. [Google Scholar] [CrossRef] [PubMed]
  50. Dhakal, H.; Yang, E.-J.; Lee, S.; Kim, M.-J.; Baek, M.-C.; Lee, B.; Park, P.-H.; Kwon, T.K.; Khang, D.; Song, K.-S.; et al. Avenanthramide C from Germinated Oats Exhibits Anti-Allergic Inflammatory Effects in Mast Cells. Sci. Rep. 2019, 9, 6884. [Google Scholar] [CrossRef]
  51. Lim, J.S.; Lee, D.Y.; Kim, H.S.; Park, S.C.; Park, J.T.; Kim, H.S.; Oh, W.K.; Cho, K.A. Identification of a Novel Senomorphic Agent, Avenanthramide C, via the Suppression of the Senescence-Associated Secretory Phenotype. Mech. Ageing Dev. 2020, 192, 111355. [Google Scholar] [CrossRef]
  52. Ramasamy, V.S.; Samidurai, M.; Park, H.J.; Wang, M.; Park, R.Y.; Yu, S.Y.; Kang, H.K.; Hong, S.; Choi, W.-S.; Lee, Y.Y.; et al. Avenanthramide-C Restores Impaired Plasticity and Cognition in Alzheimer’s Disease Model Mice. Mol. Neurobiol. 2020, 57, 315–330. [Google Scholar] [CrossRef]
Figure 1. (A) Molecular networking of the crude extract, EtOAc, and n-BuOH fractions from the leaves of Allium hookeri using HRESI-qTOF-MS/MS data recorded in the positive mode. The black frame was assigned using GNPS, and the blue frame for the accuracy of the MN was confirmed by isolating compounds (1–10) from each cluster and confirming their structures to the physicochemical properties of reported compounds using spectroscopic methods. The red frame shows the new compound 2, which was first identified from this plant. (B) An analysis of the cluster of interest related to flavonoid–glycoside suggested by molecular networking.
Nutrients 15 05109 g001aNutrients 15 05109 g001b
Figure 2. (A) Fragmentation analysis of isolated compounds. (B) Chemical profiling of isolated compounds in the A. hookeri leaf extract. Total ion chromatography (TIC) of Allium hookeri leaves recorded with HRESI-qTOF-MS/MS (positive mode). Compounds 110 were marked in the feature-based molecular networking displayed in Figure 1, and their structures are shown in Figure 3.
Nutrients 15 05109 g002
Figure 3. (A) Chemical structures of compounds 110 from A. hookeri. (B) Key COSY (bold) and HMBC (red arrows) correlations of the new compound 2 isolated from A. hookeri.
Nutrients 15 05109 g003
Figure 4. (A) The cell viability of compounds 110 from A. hookeri was measured using the EZ-Cytox cell viability assay. (B) The inhibitory effects of compounds 110 on LPS-induced NO production in RAW 264.7 cells compared to quercetin used as a positive control. Cell viability results indicate the relative cell viability compared to the untreated group (100%). NO assay data reflect the levels of NO production, calculated by utilizing the absorbance values at 540 nm and referencing a nitrite standard curve (white bar, untreated control group; black bar, LPS-treated control group); ### p < 0.05 compared to the LPS-treated control group.
Nutrients 15 05109 g004
Figure 5. Senomorphic effects in BLM-senescent A549 cells of compounds 68 from A. hookeri. (A) A549 cells were exposed to 5 µg/mL of bleomycin (BML) and co-treated with the indicated compounds for 6 days. Then, the cells were analyzed via RNA extraction or SA-β-gal staining. (B) Compounds 6–8 were tested in a dose-dependent manner, and all three compounds showed senomorphic effects by decreasing the expression of IL-6 and IL-8 in stress-induced senescent cells. (C) After 6 days of treatment, SA-β-gal staining was significantly reduced by 10 µM in all these compounds, and no severe toxicity was detected. Data are presented as the mean ± SDs (n = 3) with one-way ANOVA with Dunnett’s multiple comparisons were performed at ** p < 0.01, *** p < 0.001 and **** p < 0.0001 compared to the control samples; t-test, #### p < 0.0001.
Nutrients 15 05109 g005
Figure 6. SASP inhibitor in replicative senescent HDF cells of compounds 68 from A. hookeri. In total, 10 µM of compounds 68 were treated on replicative senescent HDF, which was confirmed via positive SA-β-gal staining (Figure S43) and upregulated SASP factors such as IL-1α and IL-8. (A,B) compounds 68 significantly reduced the expression of IL-1α or IL-8 after 72 h of treatment, and compound 7 showed the best effect among them. (C,D) Compound 7 was tested and found to have a senomorphic effect in replicative senescent HDF cells in a dose-dependent manner. Data are presented as the mean ± SDs (n = 3) with one-way ANOVA with Dunnett’s multiple comparisons at ** p < 0.01, *** p < 0.001 and **** p < 0.0001 compared to the control samples; t-test, #### p < 0.0001.
Nutrients 15 05109 g006aNutrients 15 05109 g006b
Table 1. 1H and 13C NMR data of compound 2.
Pos.2
δC aδH (J in Hz) b
2165.5
3104.56.93, s
4183.3
5158.3
695.67.20, overlap.
7163.7
8100.87.04, s
9163.4
10107.4
1′122.4
2′129.57.85, d (5.1)
3′117.47.19, overlap.
4′163.3
5′117.4
6′129.5
1″100.06.03, d (7.3)
2″77.84.65, t (7.8)
3″78.74.47, t (8.8)
4″73.34.52, t (8.8)
5″77.54.88, d (8.5)
-C=O170.4
-COOCH352.63.62, s
4′-OCH3
1‴103.16.45, s
2‴72.94.84, br s
3‴73.24.58, d (7.7)
4‴74.54.38, t (9.1)
5‴70.64.80, m
6‴19.41.85, d (6.0)
a Recorded in Pyridine-d5 at 600 MHz, b Recorded in Pyridine-d5 at 150 MHz.
Disclaimer/Publisher’s Note: The statements, opinions and data contained in all publications are solely those of the individual author(s) and contributor(s) and not of MDPI and/or the editor(s). MDPI and/or the editor(s) disclaim responsibility for any injury to people or property resulting from any ideas, methods, instructions or products referred to in the content.

