Abstract
Autism spectrum disorder (ASD) in children is associated with increased risks of overweight/obesity and underweight, altered nutrient profile, and abnormal feeding behaviors. This systematic review aimed to elucidate the literature on the nutritional status of children with ASD in the Middle East North Africa (MENA) region, by providing a summary and assessment of the body of evidence. A systematic review of English and Arabic publications up to November 2020 was conducted of five databases in addition to the grey literature, which include a nutrition-related parameter, from both experimental and observational study designs. Children with ASD (ASD-C) between 2 and 19 years in the MENA Region were the target population. For risk of bias, the Academy of Nutrition and Dietetics’ Quality Criteria Checklist (QCC) was adopted. The number of published articles was grossly limited. Forty-three articles were included, of which only four articles reported a low risk of bias; therefore, the results were interpreted in light of methodological limitations. Both overweight and underweight were common in ASD-C, although not consistently different than typically developing children. Nutrient inadequacies of energy, protein, omega-3, and others; deficiencies in serum iron indicators and calcium, as well as vitamins B12, B9, and D levels; and higher levels of homocysteine and omega-6/omega-3 ratios were reported. Feeding behavior problems were also common in ASD-C. Understanding nutritional requirements and food preferences can guide the planning of the appropriate comprehensive interventions for ASD-C. Various nutritional and behavioral concerns were identified in the included studies; however, they were subject to methodological weaknesses, which limited the generalizability of these results. Future research is warranted that must be directed to finding strong evidence using robust study designs on nutritional status and feeding behaviors of ASD-C, with a particular emphasis on the MENA Region.
1. Introduction
Autism spectrum disorder (ASD) is a neurodevelopmental condition characterized by persistent challenges in social interaction, speech, nonverbal communication, and repetitive/restrictive behavior [1]. Data on prevalence from countries in the Middle East and North Africa (MENA) region are scarce, yet the prevalence in Gulf counties ranged from 1.4 to 29 per 10,000 [2], including 4.3 per 10,000 in Bahrain [3], 20.35 per 10,000 in Oman [2], and 1 in 146 children in the United Arab Emirates (UAE) [4]. Evidence for both genetic and environmental factors contributing to ASD risk has been reported [5]. Common environmental risk factors include advanced parental age, cesarean section, suboptimal breastfeeding, prenatal complications, and lead exposure, among others [3,6,7,8].
Restrictive and repetitive diets, presence of medical comorbidities, hyperactivity, abnormal feeding practices, and parental dietary beliefs may increase their risk of under-nutrition, which can significantly impact the health-related quality of life [9,10]. ASD-C may also be predisposed to overweight and obesity attributed to side effects of psychotropic medication, sleeping problems, family environment, motor skill difficulties and lower engagement in physical activity [11,12,13], and food selectivity with the preference for energy-dense foods [14].
Further, ASD-C are at an increased risk of altered nutrient profiles. Feeding challenges can exacerbate inadequate nutritional status; deficiencies in folic acid, calcium, sodium, potassium, and zinc, as well as vitamins A, B5, B6, C, and D, may occur, which may exert adverse effects on their development [15,16,17,18]. Moreover, specific nutrients, such as vitamin D, may also play a key role in exacerbating symptoms of ASD [19,20]. Moreover, higher serum levels of saturated fatty acids, and lower levels of vitamin E, glutathione, and some polyunsaturated fatty acids, have been reported [3].
Early nutrition is critical for neurodevelopment [21]. It is necessary to understand the current trends in nutritional status and feeding behavior in ASD-C in order to provide an insight into the challenges that necessitate early and comprehensive interventions. The objective of this review is to elucidate the available literature regarding the nutritional status and feeding behavior in ASD-C in the MENA Region.
2. Materials and Methods
2.1. Eligibility Criteria
Community-based and clinical studies of any study design were included. The target population was children diagnosed with ASD, of both genders, ages 2–19 years, and where possible, the outcomes were compared with controls—typically developing children (TD-C). For an overall assessment of the nutritional status, the outcomes included anthropometric-related data (weight, height, body mass index (BMI), and circumferences), serum-level-related data (protein and micronutrient adequacy indicators, fatty acids levels, and hematology tests), nutrient-intake-related data (energy, macronutrient, and micronutrient intakes), and feeding-behavior-related data (number of meals and snacks, mealtime behavior, and feeding skills).
Other inclusion criteria were the availability of full-length published articles in either English or Arabic. Articles presented in conferences, magazines, or newspapers were excluded. If the data were reported in more than one publication, the more recent was included. This systematic review protocol was registered at the International Platform of Registered Systematic Review and Meta-analysis Protocols (INPLASY), registration number INPLASY202310066.
2.2. Search Strategy
Five electronic databases were searched: Cochrane library trials, EBSCO: CINAHL Complete, EBSCO: Academic Search Complete, Medline/PubMed, and Web of Science. Studies from any time range until November 2020 were accepted. The key terms included child-related terms separated by “OR”, AND autism-related terms separated by “OR”, AND nutrition-related and eating behavior-related terms separated by OR, AND country-related terms, all separated by the function “OR”. The search strategy is clarified in Table 1.

Table 1.
Search strategy.
Grey literature sources included the followiing: OpenGrey, Clinicaltrials.gov, Sigma Repository, OAIster, WHO library, and Open Access Theses and Dissertations. The search limiters included searching for the keyword “autism” and using filters (language, country, and disciplines) for refining search results. If the filters were not provided, a manual search was conducted. Google search engine was also used in an attempt to find more results, using a combination of the search strategy defined above.
2.3. Study Selection
One reviewer independently completed the study selection process by screening each article against the inclusion criteria of the target population, outcomes of interest, and article type. Figure 1 depicts the PRISMA flowchart for the study selection process [22]. Subsequent to the identification of studies, the titles were screened to include potential studies. Duplicate records were removed in this process. Next, the abstracts were reviewed against the eligibility criteria. Finally, the articles were chosen following the completion of a full-text screening. This process was manual, by saving the potential studies in distinct folders created for each database for each stage. For studies without an available published full-text version, the corresponding author was contacted. If no replies were received within 4 weeks, the article was excluded.
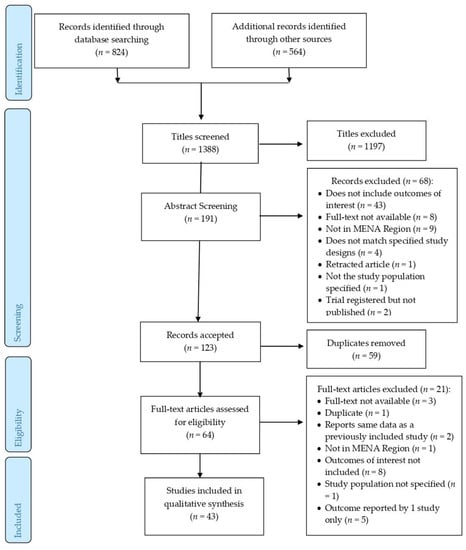
Figure 1.
Study selection process.
2.4. Data Collection
Data were extracted using a data extraction form designed for the purpose of this review. This form consisted of five main sections. The first section included general information (study characteristics, aim, design, and description of study population (and control group, if applicable)) and was applied to all studies. The rest were applied if the study reported the following outcomes of interest: anthropometric-related data, serum-level-related data, nutrient-intake-related data, or feeding-behavior-related data.
The outcome of interest was the mean and standard deviation (SD) of each value and the difference of means (SD) between ASD-C and TD-C. If an outcome was reported in two or more studies, it was included in the synthesis of results. From experimental studies, only the baseline data of participants were extracted. One author completed the data extraction process and no automation tools were applied in the process.
Quantitative variables were presented in tables corresponding to each type of nutritional parameter, expressed as the mean (SD) values for ASD-C and TD-C and whether there was a significant difference of means, which allowed for the analysis of the overall trends of nutritional outcomes and assessing the body of evidence. No other methods were applied for further data preparation. For feeding behaviors, all types of data were extracted and organized in a table under the study title, followed by a categorization of recurrent themes (e.g., snacking behaviors, mealtime behaviors, and so on).
2.5. Quality Appraisal
Two authors assessed the methodological quality and risk of bias. A third author was consulted in cases of disparities and resolved any disagreements. The Academy of Nutrition and Dietetics’ Quality Criteria Checklist (QCC) was used [23]. Overall, the reviewers rated each study on ten criteria, including the following: clear research questions, selection bias, comparable study groups, study withdrawals, blinding, description of intervention/exposure in detail, clear outcomes, valid and reliable measurements, statistical analysis, conclusions supported by results (bias taken into consideration), and study’s funding/sponsorship [23]. After examining each study’s design and execution, the QCC was used to assign an overall rating. A positive rating is assigned if five or more items are answered with “Yes”, including items 2, 3, 6, and 7, indicating a higher quality study and a less risk of bias. If five or more items are answered with “Yes”, but questions 2, 3, 6, and 7 are answered in a manner that does not indicate that the study is exceptionally strong, a neutral rating is assigned. A negative rating is assigned if six or more questions are answered as “No”.
3. Results
3.1. Study Description
Out of 1388 identified records, 43 papers based in 12 MENA countries were included in the final data synthesis. Most studies were from Egypt (n = 13) and Saudi Arabia (n = 8), followed by Iran (n = 6), Oman (n = 6), Jordan (n = 2), and Qatar (n = 2), and one study each from Iraq, Kuwait, Palestine, Syria, Tunisia, and UAE. All were published in English between June 2008 and August 2020. Table 2 presents the studies’ characteristics including the design, aim, cases’ and controls’ characteristics, and recruitment information. Most studies were observational, following either a cross-sectional (n = 28) or case-control (n = 10) study design, with an exception of four experimental studies, and one study with two phases (cross-sectional design followed by a trial). The sample sizes ranged from 11 to 344 participants, aged between 2 and 19 years, in the selected studies.
Table 2.
Characteristics of studies selected on children with autism spectrum disorder in the MENA region.
3.2. Risk of Bias Assessment
Of the 43 studies, 4 studies had a positive rating, 36 had a neutral rating, and 3 had a negative rating. The quality appraisal results are presented in Supplementary Table S1. Common limitations identified were sampling bias, sample non-representativeness, non-comparable groups, or insufficient description of samples/groupings. Sampling bias was expected owing to the difficulty in recruiting a random sample of ASD-C; therefore, most studies opted for a convenience sample. Observational studies mostly had a lack of blinding for the measurement of outcomes. Other frequent drawbacks included not mentioning methods of handling dropouts or not describing response rates, as seen in studies that obtained a neutral score. Negatively rated studies were restricted with a bias in sample recruitment, incomparable groups, failure to discuss dropout or response rates, conclusions did not consider biases nor study limitations, or possible biases from sponsorships.
3.3. Study Findings
3.3.1. Anthropometric Data
Anthropometric data are presented in Table 3. Regarding height, none of the four studies found a significant difference between ASD-C and controls. Six studies compared the weights of ASD-C with TD-C, two of which reported significantly higher weights in ASD-C [24,55]. Only one out of the five studies that reported BMI showed that ASD-C had a significantly higher BMI than TD-C [57]. The risk of bias in the studies reporting significant outcomes was neutral. Only one study with a positive methodological rating showed similar body weight values between groups with no significant difference.
Table 3.
Anthropometric data of children with autism spectrum disorder and controls in the MENA region.
Studies used different criteria for defining obesity in children according to BMI categories, including either ≥95th percentile [30,31,35,36,37,38] or ≥97th percentile on the BMI-for-age charts [24,62]. Bener et al., in 2014 and 2017, in their studies of positive methodological quality, compared to other studies reporting this outcome, showed that ASD-C were significantly more likely to fall in the combined underweight and normal weight group compared with TD-C. On the other hand, two studies reported no significant differences [24,31]. One study reported that both overweight and underweight were higher among ASD-C compared with TD-C [48]. In the other eight studies without a control group, four documented that ASD-C were more likely to be of normal weight [35,47,58,60]; however, a higher prevalence of the overweight/obese category in ASD-C was noted in the other four studies [30,62,63,64]. Examining these trends, it should be noted that the selected studies had a neutral risk of bias, except one study with a high risk, which reported a higher prevalence of the overweight/obese category.
3.3.2. Serum-Level Data
Table 4 presents data on hemoglobin (Hb), hematocrit, mean corpuscular volume (MCV), iron status (serum iron or ferritin levels), vitamin B12, and folate. Serum iron was significantly lower in ASD-C, based on two studies with positive and neutral methodological quality, respectively [38,55]. Additionally, Bener et al. (2017) reported significantly lower ferritin levels reflecting storage depletion, concurrent to the reduced serum iron in ASD-C. Al-Ali et al. (2014) also supported low ferritin levels in ASD-C, though not significantly different from TD-C.
Table 4.
Hematological biomarkers, iron status, vitamin B12, folate, and homocysteine data of children with autism spectrum disorder and controls in the MENA region.
A higher prevalence of anemia was evident in ASD-C (37.5%) compared with in TD-C (7.5%) [27]. Hb and hematocrit levels were reported to be significantly lower in two out of three studies in ASD-C, of neutral and positive methodological quality, respectively [25,38]. Bener et al. (2017) reported significantly lower MCV in ASD-C [38], while Al-Ali et al. (2015) reported a trend (p = 0.052) of lower mean MCV compared with TD-C and those with other mental disorders [25]. On the other hand, Al-Farsi et al. (2013a) reported a non-significant difference between ASD-C and TD-C [27], which may be expected as both vitamin B12 and folate levels associated with macrocytic anemia were significantly lower in ASD-C [27]. Two more studies reported significantly lower levels of both vitamins in ASD-C [29,55]. The significantly lower serum vitamin levels were based on three studies of neutral ranking in methodological quality. Significantly increased homocysteine was reported [27,29].
Serum-related data also included vitamin D, other minerals, and fatty acids (data presented in Supplementary Table S2 (vitamin D and minerals) and Supplementary Table S3 (fatty acids)). Ten studies reported that ASD-C had significantly lower mean serum vitamin D values than the controls [20,33,34,37,38,40,43,46,53,58], two of which had a positive ranking of methodological quality, while the rest were of neutral ranking. Only one study reported a non-significant difference; however, it is noted that the results for both groups reflect deficient levels [49]. Although Javadfar et al. (2020) did not provide a comparison group, the mean 25-OH-D level in ASD-C was severely deficient [51]. For other minerals, a general trend of lower levels in ASD-C was observed. To elaborate, five out of six studies reported significantly lower calcium levels [37,38,41,53,55], two out of three studies reported significantly lower phosphorus levels [37,38], and three out of four studies reported significantly lower magnesium levels than controls [37,38,55]. Zinc and potassium results were inconsistent [26,37,38,41,50].
Essential fatty acids in three studies (two neutral and one negative ranking in the methodological quality) consistently reported significantly lower levels of linolenic acid (omega-3), linoleic acid (omega-6), arachidonic acid (AA) (omega-6), and docosahexaenoic acid (DHA) (omega-3) than controls [52,59,60]. However, the AA/DHA ratio was significantly higher in ASD-C in three studies [52,59,60], and significantly lower in one [42]. Although the results were inconsistent, there seems to be an imbalance in the omega-6/omega-3 ratio among ASD-C.
3.3.3. Nutrient Intake Data
Significant differences were observed in the nutritional intakes of ASD-C and controls. The data on energy and macronutrient intakes (Table 5) show that lower energy intake was a common observation in ASD-C [28,31,48]. Generally, fat intake corresponded with energy intake, being significantly higher with increased caloric intake in ASD-C [24], and significantly lower with decreased caloric intake [31]. Protein intake was generally significantly lower in ASD-C [31,48,55]. No significant associations were observed with carbohydrate intake [24,31,48,55], and fiber intake results were inconsistent [54,55]. Al-Kindi et al. (2016) reported inadequate fiber intakes in both groups, yet significantly lower in ASD-C than TD-C [31]. Regarding macronutrient distribution of the diet, Aghaeinejad et al. (2013) reported a significantly higher fat intake and significantly lower protein and carbohydrate intakes in ASD than in the control group. Meguid et al. (2017) reported similar distributions, with no significant differences [55]. The studies comparing the macronutrient intake of ASD-C with control groups were all of neutral ranking in methodological quality.
Table 5.
Energy, macronutrient, and fiber intakes data of children with autism spectrum disorder and controls in the MENA region.
Regarding dietary fat quality (Table 6), significantly lower intakes of omega-3 in ASD-C were reported in two studies of neutral methodological quality [28,48]. Javadfar et al. (2020) did not provide a control group, yet mean intakes of omega-3 were grossly inadequate [51]. Saturated fats and cholesterol intakes were also lower in comparison with controls, consistent with a significantly lower total fat intake [31].
Table 6.
Dietary fat intake data of ASD-C and controls in the MENA region.
Micronutrient intake data are summarized in Table 7. Lower intakes of vitamin D were observed in ASD-C [31,46,48]; however, only one study reported significant differences with TD-C [31]. Vitamin B12 and folate also showed a trend of lower intakes in ASD-C, and two studies reported significantly lower levels in contrast to TD-C [27,55]. There were inconsistencies in vitamins C and B6 (pyridoxine) results. While one study reported significantly higher intakes of both in ASD-C [55], another found no significant differences with TD-C [31]. Vitamins A, B1, B2, B3, and E and phosphorus did not show any significant differences [31,55]. All of the reviewed studies in this section were of neutral ranking in methodological quality.
Table 7.
Micronutrient intake data of children with autism spectrum disorder and controls in the MENA region.
3.3.4. Feeding Behavior Data
Seven studies reported outcomes related to feeding and mealtime behaviors of ASD-C, out of which six were of neutral ranking of methodological quality, and one was negative. The variability among studies examining feeding behaviors was high; however, some common observations were noted. For example, regarding added sugar consumption, One study reported that 53.3% of ASD-C consumed soft drinks daily compared with 8.3% of TD-C [48]. ASD-C were more likely to consume sweet snacks including sweets and fruits (p = 0.02) [45]. A trend of increased sugar and sweet intakes was also reported [61], where almost all ASD-C (96.7%) consumed soft drinks, ranging from once a day (21.2%), twice a day (33.4%), thrice or more a day (11.9%), or on an irregular basis (30.2%); however, there was no comparison group. Similarly, another study reported 70.9% of children preferred sweet food items (e.g., chocolate, candy, cookies, and Arabic desserts) and that 20.1% of children had only one sweet snack item per day, up to 25.9% children having consumed at least two of them per day [61]. On the other hand, compared with TD-C in one study, ASD-C were reported to have no significant differences in the intakes of sweetened juices, sweets, and fruit intakes [48].
Other snacking behaviors were highlighted in different studies, including a significantly higher frequency of four or more snacks per day in 40% of ASD-C compared with 6.7% of TD-C [25], and three or more snacks per day in 35.8% of ASD-C consumed as compared with 20.5% of TD-C [45]. Further, 7.8% of children consumed three or more snacks/day between meals, while 31.7% consumed two snacks per day and 26.2% consumed one snack per day [61].
Regarding preferences, ASD-C were reported to have a high food selectivity for starchy foods [36,39]. Other preferences, such as food color, were highlighted, in which ASD-C were found to have a significant preference for the color ‘red’ compared with the control groups [25].
ASD-C also display more frequent eating problems. A higher frequency of eating problems including more limited food options (chicken, eggs, vegetables, and fruits), greater fear of trying new foods, pica, and increased difficulty in transitioning to solid foods were evident in ASD-C than TD-C [39]. Regarding food preferences, it was reported that ASD-C consumed significantly less milk, eggs, fresh vegetables, fish, ghee, butter, olive oil, and fast food [48], and showed a rejection rate of about 40% of total food items, with proteins (meats, fish, poultry, beans, and legumes) being the most often rejected in a different study [36]. Similarly, a third study reported that less than half of the children consumed milk, fish and seafood, fresh/cooked vegetables, and fruits [30]. Food neophobia was commonly observed [39], as 55.4% of children refused the introduction of new foods, and 58.8% of the children reported mood changes if a new food was introduced [30]. In contrast, 69.6% of ASD-C were occasionally willing to try new foods, while only 17.4% were never or rarely willing [36].
Further, ASD-C were more likely to demonstrate troubled mealtime behavior at restaurants than TD-C (p = 0.001) [39]. Other troubled mealtime behaviors included never remaining seated until the meal was finished (21.7% of ASD-C) [36], and lack of ability to remain calm during mealtime (15.9% of ASD-C), with a higher likelihood in children with a higher BMI (p = 0.026) [30].
4. Discussion
Despite the increased prevalence of ASD in the MENA region, as well as the observations of an altered nutritional status in ASD-C, data on this topic from the MENA region remain scarce and inconsistent. To the best of our knowledge, this is the first systematic review on the nutritional status of ASD-C in the MENA region, which included 43 studies on ASD-C of both genders, age ranging between 2.0 and 19 years. Our findings indicate that the available literature is highly limited in terms of the quality of the studies. The outcomes of these studies should be interpreted with caution owing to methodological limitations, especially a high risk of bias in sample selection. There was also a high degree of inconsistency in the results, limiting the ability to report and generalize definitive conclusions. These may be attributed to the use of different assessment tools and geographical variations influencing nutritional outcomes. Furthermore, only a few studies reported each outcome. To elaborate, we included circumferences as an outcome measure of anthropometric data; however, it was not reported in any of the reviewed studies. Yet, significantly higher waist circumference [65,66], waist/hip ratios [65], and waist/height ratios [66] have been reported in ASD-C compared with TD-C in the USA and Spain.
Anthropometric measurement results indicate that the weight and BMI status of ASD-C were usually similar to TD-C. These were consistent with a previous systematic review of 21 studies from various regions [67]. Nonetheless, some studies do raise concern about the ability of ASD-C to maintain a healthy weight, as they were either at a risk of overweight and/or obesity, as evident in Iran and Egypt [24,57], or underweight and malnutrition, as reported in studies from Oman and Qatar [9,37,38]. Hammouda et al. (2018) reported that both overweight and underweight were more common in ASD-C. These studies also differed in defining the cut-off points for obesity, at either the 95th or 97th percentile according to the BMI-for-age charts. A meta-analysis from different continents confirmed that, although ASD-C are more likely to be of normal body weight (52%), the remaining were more likely to be obese, overweight, or underweight (21.8%, 19.8%, and 6.4% respectively), which was higher than TD-C (11.7%, 16.5%, and 4.9% respectively) [68]. Overweight and obesity rates in ASD-C were also reported to be higher than in TD-C in different regions [69,70,71]. Significantly higher growth hormone levels may contribute to this difference [72], although factors other than the presence of a neurodevelopmental disorder, such as socioeconomic status, parental educational attainment, cultural environment, physical activity, and sleeping habits, can influence the weight status of children [73,74,75,76]. Further, Al-Kindi et al. (2016) reported a significantly lower energy intake, without significant difference in the weights of ASD-C and TD-C, and Meguid et al. (2017) reported no differences in caloric intake, but found that ASD-C were heavier than TD-C. However, Aghaeinejad (2013) observed significantly higher weight, energy, and fat intakes in ASD-C than in TD-C.
Owing to the restrictive eating behavior and the tendency of using elimination diets in ASD-C, nutritional adequacies may be compromised in them [67]. This necessitates appropriate and frequent monitoring and evaluation of the nutritional status of ASD-C owing to increased risk of nutrient deficiencies highlighted in this review. Despite mixed results, lower caloric and protein intakes were more commonly observed in ASD-C. Carbohydrate and fat intakes were inconsistent, although significantly lower omega-3 intakes were reported, which also translated into a lower serum profile of DHA [28]. Meguid et al. (2017) showed increased SFA intakes in all age groups among ASD-C. Nutritional inadequacies in micronutrients, most notably of vitamins D and B12 and folate, were observed, in line with the previous review of global studies on ASD-C [67]. Vitamin D deficiency in ASD-C may be attributed to lower sun exposure [37] or heritable vitamin D deficiency [77]. Moreover, it can also be strongly correlated with ASD severity, suggesting that early vitamin D monitoring and intervention is critical [78]. The deficiency levels of folate and vitamin B12 were also reported along a higher MCV in children (Al-Farsi et al., 2013a) and an increase in homocysteine levels (Ali et al., 2011). Homocysteine is significantly elevated in ASD-C [79] and correlates with ASD symptom severity too, indicating the importance of vitamin B12 and folate in the diets to ASD-C [80]. Furthermore, serum iron, ferritin, Hb, and hematocrit levels were commonly reported concerns, found to be significantly lower in Turkish ASD-C than in controls [81].
A high variability was reported in the status of other micronutrients. Micronutrient levels such as zinc could be geographically dependent. Faber et al. (2009) reported lower serum zinc and copper toxicity in ASD-C in the USA [82], whereas these differences were not significant in Brazil [83] and Ireland [84]. Significantly higher levels of serum potassium were reported [37,41], attributed to the increased extracellular potassium in ASD owing to reduced mitochondrial dysfunction, leading to a lower activity of ion pumps [41].
The differences reported in food preferences and mealtime behaviors may also influence the nutritional status. Selective eating and food rejection can lead to limited food intakes, compromising the adequacy of diet in important vitamins, minerals, and essential fatty acids [85]. A meta-analysis of 19 studies from the USA, Europe, and Asia also indicated lower nutrient intakes of protein, calcium, phosphorus, selenium, and omega-3, as well as vitamins B1, B2, B12, E, and D intakes, in ASD-C compared with TD-C [65]. The variability in feeding behavior is high among ASD-C [67]. Attlee et al. (2015) did not report a very high frequency of negative mealtime behavior; however, they reported that all children had inadequacies in at least five of the following nutrients: energy, protein, carbohydrates, fats, fiber, calcium, and iron, as well as vitamins A, C, and D.
Further, these behaviors differ between age groups, implying that age-specific analysis is warranted [86]. Feeding disorders, such as food refusals, limited preferences, and disrupted mealtime behavior, are commonly observed during ages 1 year to 3 years old [87]; reported frequently in ASD-C as sensory processing disorders, including tactile, taste/smell, and visual/auditory sensitivities that exert an influence on feeding behaviors [86]. Similar to on the current review on ASD-C, a high prevalence of added sugar consumption [88,89] and presence of disordered feeding behaviors [90,91,92] were also reported among TD-C in the MENA region. These are influenced by maternal obesity [90], mealtime setting, and food introduction methods following weaning [91]. Most studies in our review were limited for not including a comparison group to assess the feeding behavior in ASD-C. However, studies from other regions highlight that ASD-C do present with significantly more rapid increased feeding difficulties [93] and a higher frequency of neophobia, food selectivity, and emotional under-eating than TD-C [66].
One of the strengths of this review was the comprehensiveness of the research questions to summarize the nutritional status of ASD-C. Multiple databases enabled a comprehensive search of relevant evidence available in the MENA region. The search query covered both English and Arabic publications, and the grey literature was extensively searched. However, Persian (Iran’s official language) publications were not included. Despite including 20 countries in the search strategy of this review, there is a gross scarcity of available evidence in the MENA region, coupled with high variability among studies, and high heterogeneity in the outcomes discussed. Given the existent inconsistencies and the low methodological quality, further studies evaluating the different outcomes of nutritional status are warranted.
Most studies did not establish correlations between the various outcome measures used for assessing the nutritional status. For example, dietary assessments should be accompanied with biochemical assessments, especially for nutrients of high concern in this region. Dietary assessments should also be analyzed in coherence with mealtime behaviors and dietary preferences, given the high variability among ASD-C. In our results, there was a high variation in weight status, which did not always correlate with the dietary intake. Therefore, other socio-ecological and lifestyle factors should be considered. Overall, there is a need to adopt a comprehensive nutritional assessment approach of a combination of anthropometric, biochemical, clinical, and dietary methods to indicate the nutritional status of ASD-C through appropriate outcome measures.
5. Conclusions
Adapting an appropriate diet for ASD-C is critical as part of the conventional therapy plan because of its influence on disease severity itself; however, this is ideally tailored based on the individual’s nutritional requirements and food preferences. In our review, we identified 43 studies from 12 MENA countries, and noted the prevalence of the triple burden of malnutrition, both higher weight and BMI status and undernutrition, and micronutrients’ deficiencies in serum iron indicators and calcium, as well as vitamins B12, B9, and D, and higher levels of homocysteine and omega-6/omega-3 ratios in ASD-C in the MENA region. Lower intakes of protein and omega-3 fatty acids were also common. A high frequency of mealtime problems; disordered eating; and certain food selectivity behaviors, especially increased intakes of sweet food items and starchy foods, as well as decreased intakes of eggs, milk, vegetables, proteins (poultry and seafood), and fruits, are reported in ASD-C. Many studies have suffered from methodological weaknesses, which may contribute to the inconsistencies in the outcomes for assessing nutritional status and feeding behaviors in ASD-C in the MENA region. Future research must be directed to bring out strong evidence using robust study designs on nutritional status and feeding behaviors of ASD-C for early diagnosis of nutrition-related health issues that would aid in designing targeted interventions for ASD-C in the MENA region.
Supplementary Materials
The following supporting information can be downloaded at https://www.mdpi.com/article/10.3390/nu15030711/s1, Table S1: Risk of assessment bias; Table S2: Serum vitamin D, calcium, phosphorus, magnesium, potassium, and zinc levels of children with autism spectrum disorder and controls in the MENA region; Table S3: Serum PUFA levels of children with autism spectrum disorder and controls in the MENA region.
Author Contributions
Conceptualization, M.K. and A.A. (Amita Attlee); methodology, M.K.; formal analysis, M.K., A.A. (Asma Ahmadani) and A.A. (Amita Attlee); investigation, M.K., A.A. (Asma Ahmadani) and A.A. (Amita Attlee); writing—original draft preparation, M.K. and A.A. (Asma Ahmadani); writing—review and editing, M.K., A.A. (Asma Ahmadani), A.A. (Amita Attlee) and K.E.W.; supervision, A.A. (Amita Attlee); funding acquisition, A.A. (Amita Attlee). All authors have read and agreed to the published version of the manuscript.
Funding
The APC of this review is funded by Start-Up Grant—United Arab Emirates University (Grant code # G00003323).
Institutional Review Board Statement
Not applicable.
Informed Consent Statement
Not applicable.
Data Availability Statement
Data from published articles. No new data were created or analyzed in this study.
Conflicts of Interest
The authors declare no conflict of interest.
References
- American Psychiatric Association. What Is Autism Spectrum Disorder? Available online: https://www.psychiatry.org/patients-families/autism/what-is-autism-spectrum-disorder (accessed on 8 June 2021).
- Al-Mamri, W.; Idris, A.B.; Dakak, S.; Al-Shekaili, M.; Al-Harthi, Z.; Alnaamani, A.M.; Alhinai, F.I.; Jalees, S.; Al Hatmi, M.; El-Naggari, M.A.; et al. Revisiting the Prevalence of Autism Spectrum Disorder among Omani Children. Sultan Qaboos Univ. Med. J. 2019, 19, e305–e309. [Google Scholar] [CrossRef] [PubMed]
- Salhia, H.O.; Al-Nasser, L.A.; Taher, L.S.; Al-Khathaami, A.M.; El-Metwally, A.A. Systemic Review of the Epidemiology of Autism in Arab Gulf Countries. Neurosciences 2014, 19, 291–296. [Google Scholar] [PubMed]
- Virolainen, S.; Hussien, W.; Dalibalta, S. Autism Spectrum Disorder in the United Arab Emirates: Potential Environmental Links. Rev. Environ. Health 2020, 35, 359–369. [Google Scholar] [CrossRef] [PubMed]
- Kim, Y.S.; Leventhal, B.L. Genetic Epidemiology and Insights into Interactive Genetic and Environmental Effects in Autism Spectrum Disorders. Biol. Psychiatry 2015, 77, 66–74. [Google Scholar] [CrossRef]
- Hisle-Gorman, E.; Susi, A.; Stokes, T.; Gorman, G.; Erdie-Lalena, C.; Nylund, C.M. Prenatal, Perinatal, and Neonatal Risk Factors of Autism Spectrum Disorder. Pediatr. Res. 2018, 84, 190–198. [Google Scholar] [CrossRef]
- Kim, J.Y.; Son, M.J.; Son, C.Y.; Radua, J.; Eisenhut, M.; Gressier, F.; Koyanagi, A.; Carvalho, A.F.; Stubbs, B.; Solmi, M.; et al. Environmental Risk Factors and Biomarkers for Autism Spectrum Disorder: An Umbrella Review of the Evidence. Lancet Psychiatry 2019, 6, 590–600. [Google Scholar] [CrossRef]
- Modabbernia, A.; Velthorst, E.; Reichenberg, A. Environmental Risk Factors for Autism: An Evidence-Based Review of Systematic Reviews and Meta-Analyses. Mol. Autism 2017, 8, 13. [Google Scholar] [CrossRef]
- Al-Farsi, Y.M.; Al-Sharbati, M.M.; Waly, M.I.; Al-Farsi, O.A.; Al Shafaee, M.A.; Deth, R.C. Malnutrition among Preschool-Aged Autistic Children in Oman. Res. Autism Spectr. Disord. 2011, 5, 1549–1552. [Google Scholar] [CrossRef]
- Bölte, S.; Özkara, N.; Poustka, F. Autism Spectrum Disorders and Low Body Weight: Is There Really a Systematic Association? Int. J. Eat. Disord. 2002, 31, 349–351. [Google Scholar] [CrossRef]
- Curtin, C.; Jojic, M.; Bandini, L.G. Obesity in Children with Autism Spectrum Disorders. Harv. Rev. Psychiatry 2014, 22, 93–103. [Google Scholar] [CrossRef]
- Dhaliwal, K.K.; Orsso, C.E.; Richard, C.; Haqq, A.M.; Zwaigenbaum, L. Risk Factors for Unhealthy Weight Gain and Obesity among Children with Autism Spectrum Disorder. Int. J. Mol. Sci. 2019, 20, 3285. [Google Scholar] [CrossRef]
- Hill, A.P.; Zuckerman, K.E.; Fombonne, E. Obesity and Autism. Pediatrics 2015, 136, 1051–1061. [Google Scholar] [CrossRef]
- Schreck, K.A.; Williams, K.; Smith, A.F. A Comparison of Eating Behaviors between Children with and without Autism. Autism Dev. Disord 2004, 34, 433–438. [Google Scholar] [CrossRef]
- Cannell, J.J. Vitamin D and Autism, What’s New? Rev. Endocr. Metab. Disord. 2017, 18, 183–193. [Google Scholar] [CrossRef]
- Castro, K.; Faccioli, L.S.; Baronio, D.; Gottfried, C.; Perry, I.S.; Riesgo, R. Feeding Behavior and Dietary Intake of Male Children and Adolescents with Autism Spectrum Disorder: A Case-Control Study. Int. J. Dev. Neurosci. 2016, 53, 68–74. [Google Scholar] [CrossRef]
- Malhi, P.; Venkatesh, L.; Bharti, B.; Singhi, P. Feeding Problems and Nutrient Intake in Children with and without Autism: A Comparative Study. Indian J. Pediatr. 2017, 84, 283–288. [Google Scholar] [CrossRef]
- Xia, W.; Zhou, Y.; Sun, C.; Wang, J.; Wu, L. A Preliminary Study on Nutritional Status and Intake in Chinese Children with Autism. Eur. J. Pediatr. 2010, 169, 1201–1206. [Google Scholar] [CrossRef]
- Guo, M.; Zhu, J.; Yang, T.; Lai, X.; Lei, Y.; Chen, J.; Li, T. Vitamin A and Vitamin D Deficiencies Exacerbate Symptoms in Children with Autism Spectrum Disorders. Nutr. Neurosci. 2019, 22, 637–647. [Google Scholar] [CrossRef]
- Saad, K.; Abdel-Rahman, A.A.; Elserogy, Y.M.; Al-Atram, A.A.; Cannell, J.J.; Bjørklund, G.; Abdel-Reheim, M.K.; Othman, H.A.K.; El-Houfey, A.A.; Abd El-Aziz, N.H.R.; et al. Vitamin D Status in Autism Spectrum Disorders and the Efficacy of Vitamin D Supplementation in Autistic Children. Nutr. Neurosci. 2016, 19, 346–351. [Google Scholar] [CrossRef]
- Lee, B.K.; Eyles, D.W.; Magnusson, C.; Newschaffer, C.J.; McGrath, J.J.; Kvaskoff, D.; Ko, P.; Dalman, C.; Karlsson, H.; Gardner, R.M. Developmental Vitamin D and Autism Spectrum Disorders: Findings from the Stockholm Youth Cohort. Mol. Psychiatry 2019. [Google Scholar] [CrossRef]
- Moher, D.; Liberati, A.; Tetzlaff, J.; Altman, D.G.; Group, T.P. Preferred Reporting Items for Systematic Reviews and Meta-Analyses: The PRISMA Statement. PLoS Med. 2009, 6, e1000097. [Google Scholar] [CrossRef] [PubMed]
- Academy of Nutrition and Dietetics. Evidence Analysis Manual: Steps in the Academy Evidence Analysis Process; Academy of Nutrition and Dietetics: Chicago, IL, USA, 2016; pp. 8–91. [Google Scholar]
- Aghaeinejad, M.; Djafarian, K.; Mahmoudi, M.; Daneshi, M. Comparison of Energy and Macronutrients Intake between Children with Autism and Healthy Children. Int. Res. J. Appl. Basic Sci. 2013, 5, 667–670. [Google Scholar]
- Al-Ali, S.F.; Russo, D.S.; Alkaissi, D.A. Association between Autism Spectrum Disorder and Iron Deficiency in Children Diagnosed Autism Spectrum Disorder in the Northern West Bank. J. Health Med. Nur. 2015, 10. [Google Scholar]
- Al-Bazzaz, A.; A-Dahir, K.; Almashhadani, A.; Al-Ani, I. Estimation of Fasting Serum Levels of Glucose, Zinc, Copper, Zinc /Copper Ratio and Their Relation to the Measured Lipid Profile in Autistic Patients and Non-Autistic Controls in Jordan. Biomed. Pharmacol. J. 2020, 13, 481–488. [Google Scholar] [CrossRef]
- Al-Farsi, Y.M.; Waly, M.I.; Deth, R.C.; Al-Sharbati, M.M.; Al-Shafaee, M.; Al-Farsi, O.; Al-Khaduri, M.M.; Gupta, I.; Ali, A.; Al-Khalili, M.; et al. Low Folate and Vitamin B12 Nourishment Is Common in Omani Children with Newly Diagnosed Autism. Nutrition 2013, 29, 537–541. [Google Scholar] [CrossRef]
- Al-Farsi, Y.M.; Waly, M.I.; Deth, R.C.; Al-Sharbati, M.M.; Al-Shafaee, M.; Al-Farsi, O.; Al-Khaduri, M.M.; Al-Adawi, S.; Hodgson, N.W.; Gupta, I.; et al. Impact of Nutrition on Serum Levels of Docosahexaenoic Acid among Omani Children with Autism. Nutrition 2013, 29, 1142–1146. [Google Scholar] [CrossRef]
- Ali, A.; Waly, M.I.; Al-Farsi, Y.M.; Essa, M.M.; Al-Sharbati, M.M.; Deth, R.C. Hyperhomocysteinemia among Omani Autistic Children: A Case-Control Study. Acta Biochim. Pol. 2011, 58. [Google Scholar] [CrossRef]
- Alkazemi, D.; Rahman, A.; AlSaad, S.; Kubow, S. Parental Perceptions and Concerns of Weight Status in Children with Autism Spectrum Disorders in Kuwait. Res. Autism Spectr. Disord. 2016, 22, 1–9. [Google Scholar] [CrossRef]
- Al-Kindi, N.M.; Al-Farsi, Y.M.; Waly, M.I.; A-Shafaee, M.S.; Bakheit, C.S. Dietary Intake and Food Preferences of Autistic Children Versus Children with Typical Development: A Comparative Cross-Sectional Study. EC Nutrition 2016, 6, 72–85. [Google Scholar]
- Al-Kindi, N.M.; Al-Farsi, Y.M.; Al-Bulushi, B.; Ali, A.; Rizvi, S.G.A.; Essa, M.M. Food Selection and Preferences of Omani Autistic Children. Adv Neurobiol. 2020, 24, 505–523. [Google Scholar] [CrossRef]
- Alzghoul, L.; AL-Eitan, L.N.; Aladawi, M.; Odeh, M.; Abu Hantash, O. The Association Between Serum Vitamin D3 Levels and Autism Among Jordanian Boys. J. Autism Dev. Disord. 2020, 50, 3149–3154. [Google Scholar] [CrossRef]
- Arastoo, A.A.; Khojastehkia, H.; Rahimi, Z.; Khafaie, M.A.; Hosseini, S.A.; Mansouri, M.T.; Yosefyshad, S.; Abshirini, M.; Karimimalekabadi, N.; Cheraghi, M. Evaluation of Serum 25-Hydroxy Vitamin D Levels in Children with Autism Spectrum Disorder. Ital. J. Pediatr. 2018, 44, 150. [Google Scholar] [CrossRef]
- Ashour, N.A.; Ashour, A.A.; Basha, S. Association between Body Mass Index and Dental Caries among Special Care Female Children in Makkah City. Ann. Saudi Med. 2018, 38, 28–35. [Google Scholar] [CrossRef]
- Attlee, A.; Kassem, H.; Hashim, M.; Obaid, R.S. Physical Status and Feeding Behavior of Children with Autism. Indian J. Pediatr. 2015, 82, 682–687. [Google Scholar] [CrossRef]
- Bener, A.; Khattab, A.O.; Al-Dabbagh, M.M. Is High Prevalence of Vitamin D Deficiency Evidence for Autism Disorder?: In a Highly Endogamous Population. J. Pediatr. Neurosci. 2014, 9, 227–233. [Google Scholar] [CrossRef]
- Bener, A.; Khattab, A.; Bhugra, D.; Hoffmann, G. Iron and Vitamin D Levels among Autism Spectrum Disorders Children. Ann. Afr. Med. 2017, 16, 186. [Google Scholar] [CrossRef]
- Cherif, L.; Boudabous, J.; Khemekhem, K.; Mkawer, S.; Ayadi, H.; Moalla, Y. Feeding Problems in Children with Autism Spectrum Disorders. J. Fam. Med. 2018, 1, 30–39. [Google Scholar] [CrossRef]
- Desoky, T.; Hassan, M.H.; Fayed, H.; Sakhr, H.M. Biochemical Assessments of Thyroid Profile, Serum 25-Hydroxycholecalciferol and Cluster of Differentiation 5 Expression Levels among Children with Autism. NDT 2017, 13, 2397–2403. [Google Scholar] [CrossRef]
- El-Ansary, A.; Al-Daihan, S.; Al-Dbass, A.; Al-Ayadhi, L. Measurement of Selected Ions Related to Oxidative Stress and Energy Metabolism in Saudi Autistic Children. Clin. Biochem. 2010, 43, 63–70. [Google Scholar] [CrossRef]
- El-Ansary, A.K.; Ben Bacha, A.G.; Al-Ayahdi, L.Y. Impaired Plasma Phospholipids and Relative Amounts of Essential Polyunsaturated Fatty Acids in Autistic Patients from Saudi Arabia. Lipids Health Dis. 2011, 10, 63. [Google Scholar] [CrossRef]
- El-Ansary, A.; Cannell, J.J.; Bjørklund, G.; Bhat, R.S.; Al Dbass, A.M.; Alfawaz, H.A.; Chirumbolo, S.; Al-Ayadhi, L. In the Search for Reliable Biomarkers for the Early Diagnosis of Autism Spectrum Disorder: The Role of Vitamin D. Metab. Brain Dis. 2018, 33, 917–931. [Google Scholar] [CrossRef] [PubMed]
- ElBaz, F.M.; Zaki, M.M.; Youssef, A.M.; ElDorry, G.F.; Elalfy, D.Y. Study of Plasma Amino Acid Levels in Children with Autism: An Egyptian Sample. Egypt. J. Med. Hum. Genet. 2014, 15, 181–186. [Google Scholar] [CrossRef]
- El-Khatib, A.A.; tekeya, M.E.; Tantawi, M.E.; Omar, T. Oral Health Status and Behaviours of Children with Autism Spectrum Disorder: A Case-Control Study. Int. J. Paediatr. Dent. 2014. [Google Scholar] [CrossRef]
- Fahmy, F.; Sabri, N.; El Hamamsy, M.; El Sawi, M.; Zaki, O. Vitamin D Intake and Sun Exposure in Autistic Children. Int. J. Pharm. Sci. Res. 2016, 7, 1043–1049. [Google Scholar]
- Ghodsi, R.; Kheirouri, S.; Nosrati, R. Carnosine Supplementation Does Not Affect Serum Concentrations of Advanced Glycation and Precursors of Lipoxidation End Products in Autism: A Randomized Controlled Clinical Trial. Ann. Clin. Biochem. 2019, 56, 148–154. [Google Scholar] [CrossRef]
- Hammouda, S.A.I.; Farghal, S.; Al-Harbi, G.; Abduallah, M.; Al-Rehaly, R.; Al-Johani, G. Assessment of Nutritional Risk Factors Predisposing to Autism among Saudi Children. Nat. Food 2018, 6. [Google Scholar] [CrossRef]
- Hashemzadeh, M.; Moharreri, F.; Soltanifar, A. Comparative Study of Vitamin D Levels in Children with Autism Spectrum Disorder and Normal Children: A Case-Control Study. J. Fundam. Ment. Health 2015, 6, 197–201. [Google Scholar]
- Hawari, I.; Eskandar, M.B.; Alzeer, S. The Role of Lead, Manganese, and Zinc in Autism Spectrum Disorders (ASDs) and Attention-Deficient Hyperactivity Disorder (ADHD): A Case-Control Study on Syrian Children Affected by the Syrian Crisis. Biol. Trace Elem. Res. 2020, 197, 107–114. [Google Scholar] [CrossRef]
- Javadfar, Z.; Abdollahzad, H.; Moludi, J.; Rezaeian, S.; Amirian, H.; Foroughi, A.A.; Nachvak, S.M.; Goharmehr, N.; Mostafai, R. Effects of Vitamin D Supplementation on Core Symptoms, Serum Serotonin, and Interleukin-6 in Children with Autism Spectrum Disorders: A Randomized Clinical Trial. Nutrition 2020, 79–80, 110986. [Google Scholar] [CrossRef]
- Meguid, N.A.; Atta, H.M.; Gouda, A.S.; Khalil, R.O. Role of Polyunsaturated Fatty Acids in the Management of Egyptian Children with Autism. Clin. Biochem. 2008, 41, 1044–1048. [Google Scholar] [CrossRef]
- Meguid, N.A.; Hashish, A.F.; Anwar, M.; Sidhom, G. Reduced Serum Levels of 25-Hydroxy and 1,25-Dihydroxy Vitamin D in Egyptian Children with Autism. J. Altern. Complement. Med. 2010, 16, 641–645. [Google Scholar] [CrossRef]
- Meguid, N.; Anwar, M.; Zaki, S.; Kandeel, W.; Ahmed, N.; Tewfik, I. Dietary Patterns of Children with Autism Spectrum Disorder: A Study Based in Egypt. Open Access Maced. J. Med. Sci. 2015, 3, 262–267. [Google Scholar] [CrossRef]
- Meguid, N.A.; Anwar, M.; Bjørklund, G.; Hashish, A.; Chirumbolo, S.; Hemimi, M.; Sultan, E. Dietary Adequacy of Egyptian Children with Autism Spectrum Disorder Compared to Healthy Developing Children. Metab. Brain Dis. 2017, 32, 607–615. [Google Scholar] [CrossRef]
- Meguid, N.A.; Bjørklund, G.; Gebril, O.H.; Doşa, M.D.; Anwar, M.; Elsaeid, A.; Gaber, A.; Chirumbolo, S. The Role of Zinc Supplementation on the Metallothionein System in Children with Autism Spectrum Disorder. Acta Neurol Belg. 2019, 119, 577–583. [Google Scholar] [CrossRef]
- Metwally, F.M.; Rashad, H.; Zeidan, H.M.; Kilany, A.; Abdol Raouf, E.R. Study of the Effect of Bisphenol A on Oxidative Stress in Children with Autism Spectrum Disorders. Ind. J. Clin. Biochem. 2018, 33, 196–201. [Google Scholar] [CrossRef]
- Mostafa, G.A.; AL-Ayadhi, L.Y. Reduced Serum Concentrations of 25-Hydroxy Vitamin D in Children with Autism: Relation to Autoimmunity. J. Neuroinflammation 2012, 9, 686. [Google Scholar] [CrossRef]
- Mostafa, G.A.; El-Khashab, H.Y.; AL-Ayadhi, L.Y. A Possible Association between Elevated Serum Levels of Brain-Specific Auto-Antibodies and Reduced Plasma Levels of Docosahexaenoic Acid in Autistic Children. J. Neuroimmunol. 2015, 280, 16–20. [Google Scholar] [CrossRef]
- Mostafa, G.A.; AL-Ayadhi, L.Y. Reduced Levels of Plasma Polyunsaturated Fatty Acids and Serum Carnitine in Autistic Children: Relation to Gastrointestinal Manifestations. Behav. Brain Funct. 2015, 11, 4. [Google Scholar] [CrossRef]
- Murshid, E.Z. Diet, Oral Hygiene Practices and Dental Health in Autistic Children in Riyadh, Saudi Arabia. Oral Health Dent. Manag. 2014, 13, 6. [Google Scholar]
- Salehi, H.; Aghanoori, M.R.; Shahmohammadlu, S.; Hooseini, B.; Mitchell, S.E.; Mahmudi, M.; Djafarian, K. Body Composition in Iranian Boys with Autism Spectrum Disorders. Paediatr. Croat. 2015, 59, 159–165. [Google Scholar] [CrossRef]
- Shaaban, S.Y.; El Gendy, Y.G.; Mehanna, N.S.; El-Senousy, W.M.; El-Feki, H.S.A.; Saad, K.; El-Asheer, O.M. The Role of Probiotics in Children with Autism Spectrum Disorder: A Prospective, Open-Label Study. Nutr. Neurosci. 2018, 21, 676–681. [Google Scholar] [CrossRef] [PubMed]
- Wtwt, E.T.; Farhood, H.F. Feeding Problems and Nutritional Assessment in Children with Autism. 2015. Available online: https://iraqjournals.com/article_102620_0.html (accessed on 8 June 2021).
- Esteban-Figuerola, P.; Canals, J.; Fernández-Cao, J.C.; Arija Val, V. Differences in Food Consumption and Nutritional Intake between Children with Autism Spectrum Disorders and Typically Developing Children: A Meta-Analysis. Autism 2019, 23, 1079–1095. [Google Scholar] [CrossRef] [PubMed]
- Kral, T.V.E.; Souders, M.C.; Tompkins, V.H.; Remiker, A.M.; Eriksen, W.T.; Pinto-Martin, J.A. Child Eating Behaviors and Caregiver Feeding Practices in Children with Autism Spectrum Disorders. Public Health Nurs. 2015, 32, 488–497. [Google Scholar] [CrossRef] [PubMed]
- Marí-Bauset, S.; Zazpe, I.; Marí-Sanchis, A.; Llopis-González, A.; Suárez-Varela, M.M. Anthropometric Measurements and Nutritional Assessment in Autism Spectrum Disorders: A Systematic Review. Res. Autism Spectr. Disord. 2015, 9, 130–143. [Google Scholar] [CrossRef]
- Li, Y.-J.; Xie, X.-N.; Lei, X.; Li, Y.-M.; Lei, X. Global Prevalence of Obesity, Overweight and Underweight in Children, Adolescents and Adults with Autism Spectrum Disorder, Attention-Deficit Hyperactivity Disorder: A Systematic Review and Meta-Analysis. Obes. Rev. 2020, 21, e13123. [Google Scholar] [CrossRef]
- Curtin, C.; Anderson, S.E.; Must, A.; Bandini, L. The Prevalence of Obesity in Children with Autism: A Secondary Data Analysis Using Nationally Representative Data from the National Survey of Children’s Health. BMC Pediatr. 2010, 10, 11. [Google Scholar] [CrossRef]
- de Vinck-Baroody, O.; Shui, A.; Macklin, E.A.; Hyman, S.L.; Leventhal, J.M.; Weitzman, C. Overweight and Obesity in a Sample of Children With Autism Spectrum Disorder. Acad. Pediatr. 2015, 15, 396–404. [Google Scholar] [CrossRef]
- Mills, J.L.; Hediger, M.L.; Molloy, C.A.; Chrousos, G.P.; Manning-Courtney, P.; Yu, K.F.; Brasington, M.; England, L.J. Elevated Levels of Growth-Related Hormones in Autism and Autism Spectrum Disorder. Clin. Endocrinol. 2007, 67, 230–237. [Google Scholar] [CrossRef]
- Must, A.; Phillips, S.M.; Curtin, C.; Anderson, S.E.; Maslin, M.; Lividini, K.; Bandini, L.G. Comparison of Sedentary Behaviors between Children with Autism Spectrum Disorders and Typically Developing Children. Autism 2014, 18, 376–384. [Google Scholar] [CrossRef]
- Goyal, R.K.; Shah, V.N.; Saboo, B.D.; Phatak, S.R.; Shah, N.N.; Gohel, M.C.; Raval, P.B.; Patel, S.S. Prevalence of Overweight and Obesity in Indian Adolescent School Going Children: Its Relationship with Socioeconomic Status and Associated Lifestyle Factors. J. Assoc. Physicians India 2010, 58, 151–158. [Google Scholar]
- Lamerz, A.; Kuepper-Nybelen, J.; Wehle, C.; Bruning, N.; Trost-Brinkhues, G.; Brenner, H.; Hebebrand, J.; Herpertz-Dahlmann, B. Social Class, Parental Education, and Obesity Prevalence in a Study of Six-Year-Old Children in Germany. Int. J. Obes. 2005, 29, 373–380. [Google Scholar] [CrossRef]
- Lee, A.; Cardel, M.; Donahoo, W.T. Social and Environmental Factors Influencing Obesity. In Endotext; Feingold, K.R., Anawalt, B., Boyce, A., Chrousos, G., de Herder, W.W., Dhatariya, K., Dungan, K., Grossman, A., Hershman, J.M., Hofland, J., et al., Eds.; MDText.com, Inc.: South Dartmouth, MA, USA, 2000. [Google Scholar]
- Sahoo, K.; Sahoo, B.; Choudhury, A.K.; Sofi, N.Y.; Kumar, R.; Bhadoria, A.S. Childhood Obesity: Causes and Consequences. J. Fam. Med. Prim. Care 2015, 4, 187–192. [Google Scholar] [CrossRef]
- Cannell, J.J.; Grant, W.B. What Is the Role of Vitamin D in Autism? Derm. Endocrinol. 2013, 5, 199–204. [Google Scholar] [CrossRef]
- Kittana, M.; Ahmadani, A.; Stojanovska, L.; Attlee, A. The Role of Vitamin D Supplementation in Children with Autism Spectrum Disorder: A Narrative Review. Nutrients 2021, 14, 26. [Google Scholar] [CrossRef]
- Guo, B.-Q.; Li, H.-B.; Ding, S.-B. Blood Homocysteine Levels in Children with Autism Spectrum Disorder: An Updated Systematic Review and Meta-Analysis. Psychiatry Res. 2020, 291, 113283. [Google Scholar] [CrossRef]
- Puig-Alcaraz, C.; Fuentes-Albero, M.; Calderón, J.; Garrote, D.; Cauli, O. Increased Homocysteine Levels Correlate with the Communication Deficit in Children with Autism Spectrum Disorder. Psychiatry Res. 2015, 229, 1031–1037. [Google Scholar] [CrossRef]
- Gunes, S.; Ekinci, O.; Celik, T. Iron Deficiency Parameters in Autism Spectrum Disorder: Clinical Correlates and Associated Factors. Ital. J. Pediatr. 2017, 43, 86. [Google Scholar] [CrossRef]
- Faber, S.; Zinn, G.M.; Kern II, J.C.; Skip Kingston, H.M. The Plasma Zinc/Serum Copper Ratio as a Biomarker in Children with Autism Spectrum Disorders. Biomarkers 2009, 14, 171–180. [Google Scholar] [CrossRef]
- Saldanha Tschinkel, P.F.; Bjørklund, G.; Conón, L.Z.Z.; Chirumbolo, S.; Nascimento, V.A. Plasma Concentrations of the Trace Elements Copper, Zinc and Selenium in Brazilian Children with Autism Spectrum Disorder. Biomed. Pharmacother. 2018, 106, 605–609. [Google Scholar] [CrossRef]
- Sweetman, D.U.; O’Donnell, S.M.; Lalor, A.; Grant, T.; Greaney, H. Zinc and Vitamin A Deficiency in a Cohort of Children with Autism Spectrum Disorder. Child. Care Health Dev. 2019, 45, 380–386. [Google Scholar] [CrossRef]
- Monteiro, M.A.; dos Santos, A.A.A.; Gomes, L.M.M.; Rito, R.V.V.F. Autism Spectrum Disorder: A Systematic Review about Nutritional Interventions. Rev. Paul. Pediatr. 2020, 38, e2018262. [Google Scholar] [CrossRef] [PubMed]
- Zulkifli, F.N.A.; Rahman, P.A. Relationships Between Sensory Processing Disorders with Feeding Behavior Problems Among Children with Autism Spectrum Disorder. Mal. J. Med. Health Sci. 2021, 17 (Suppl. 3), 230–236. [Google Scholar]
- Silverman, A.H. Behavioral Management of Feeding Disorders of Childhood. ANM 2015, 66, 33–42. [Google Scholar] [CrossRef] [PubMed]
- Elamin, A.; Garemo, M.; Gardner, A. Dental Caries and Their Association with Socioeconomic Characteristics, Oral Hygiene Practices and Eating Habits among Preschool Children in Abu Dhabi, United Arab Emirates—The NOPLAS Project. BMC Oral Health 2018, 18, 104. [Google Scholar] [CrossRef]
- Sayegh, A.; Dini, E.L.; Holt, R.D.; Bedi, R. Food and Drink Consumption, Sociodemographic Factors and Dental Caries in 4–5-Year-Old Children in Amman, Jordan. Br. Dent. J. 2002, 193, 37–42. [Google Scholar] [CrossRef]
- Kutbi, H.A. Picky Eating in School-Aged Children: Sociodemographic Determinants and the Associations with Dietary Intake. Nutrients 2021, 13, 2518. [Google Scholar] [CrossRef]
- Mouallem, R.E.; Malaeb, D.; Akel, M.; Hallit, S.; Khalife, M.-C.F. Food Neophobia in Lebanese Children: Scale Validation and Correlates. Public Health Nutr. 2021, 24, 5015–5023. [Google Scholar] [CrossRef]
- Qazaryan, K.S.; Karim, S. The Clinical Link of Preschoolers’ Picky Eating Behavior with Their Growth, Development, Nutritional Status, and Physical Activity in Iraq/Kurdistan Region. Highlights Med. Med. Sci. 2019, 5, 119–132. [Google Scholar] [CrossRef]
- Ashley, K.; Steinfeld, M.B.; Young, G.S.; Ozonoff, S. Onset, Trajectory, and Pattern of Feeding Difficulties in Toddlers Later Diagnosed with Autism. J. Dev. Behav. Pediatr. 2020, 41, 165–171. [Google Scholar] [CrossRef]


Disclaimer/Publisher’s Note: The statements, opinions and data contained in all publications are solely those of the individual author(s) and contributor(s) and not of MDPI and/or the editor(s). MDPI and/or the editor(s) disclaim responsibility for any injury to people or property resulting from any ideas, methods, instructions or products referred to in the content. |
© 2023 by the authors. Licensee MDPI, Basel, Switzerland. This article is an open access article distributed under the terms and conditions of the Creative Commons Attribution (CC BY) license (https://creativecommons.org/licenses/by/4.0/).