Article

Effects of Parental Dietary Restriction on Offspring Fitness in Drosophila melanogaster

Department of Biological Sciences and Bioengineering, Inha University, Incheon 22212, Republic of Korea
*
Author to whom correspondence should be addressed.
These authors contributed equally to this work and share first authorship.
Nutrients 2023, 15(5), 1273; https://doi.org/10.3390/nu15051273
Submission received: 6 January 2023 / Revised: 18 February 2023 / Accepted: 2 March 2023 / Published: 3 March 2023

Abstract

:
Dietary restriction (DR) is a well-established strategy to increase lifespan and stress resistance in many eukaryotic species. In addition, individuals fed a restricted diet typically reduce or completely shut down reproduction compared to individuals fed a full diet. Although the parental environment can lead to changes epigenetically in offspring gene expression, little is known about the role of the parental (F0) diet on the fitness of their offspring (F1). This study investigated the lifespan, stress resistance, development, body weight, fecundity, and feeding rate in offspring from parental flies exposed to a full or restricted diet. The offspring flies of the parental DR showed increases in body weight, resistance to various stressors, and lifespan, but the development and fecundity were unaffected. Interestingly, parental DR reduced the feeding rate of their offspring. This study suggests that the effect of DR can extend beyond the exposed individual to their offspring, and it should be considered in both theoretical and empirical studies of senescence.

1. Introduction

Since McCay et al. reported that the restriction of food intake increases the maximum lifespan in rats [1], dietary restriction (DR), i.e., reduced nutrient intake without malnutrition, has been well described as an intervention to delay aging in a wide array of organisms from yeasts to primates and to prevent the onset of age- or diet-associated diseases in rodents and primates [2]. DR significantly impacts the life-history characteristics of organisms, including development, reproduction, locomotion, and lifespan. Altered life-history characteristics by the parental environment can lead to epigenetic modification in offspring gene expression. Life history theory asserts that a fundamental trade-off between the number of offspring tends to shift to “fewer but better-provisioned offspring” under stressful conditions [3]. In addition, the environmental programming of gene expression during gestation and early postnatal periods can produce long-term changes in the structure and function of an organism, allowing it to adapt better to its current environment [4,5]. Thus, DR may alter the phenotype of individuals exposed directly to DR and their offspring via parental effects [6,7].
Numerous studies have reported that the parental diet of rodents affects the fitness of their offspring. In most of these studies on rodents, however, a dietary regimen has been applied only during gestation and lactation [8,9,10,11]. Most studies on the effects of the parental diet during pre-pregnancy focused on the negative effects of obese parents [12,13,14] or the transgenerational effects of parental DR. For example, some researchers reported that a low maternal protein diet during pregnancy leads to reduced lifespan [8] or hyperinsulinemia and lowered insulin-signaling protein expression [9] in rat offspring or changes in the mitochondria gene expression in the liver and skeletal muscle of mice offspring [11]. Restricted diet during pregnancy also increased the low-density lipoprotein and global histone H3 acetylation but did not change the hepatic DNA methylation and expression in the offspring of rat fetuses [15,16,17]. Although the transgenerational effects of pre-pregnancy diets in vertebrates are still lacking, there are several studies of the transgenerational effects of DR in invertebrate model studies. In fruit flies, high sugar levels in the parental diet influence offspring obesity [12] or the obese-like phenotype [13], but parental sugar consumption does not affect the offspring’s lifespan [18]. In nematodes, the normal diet-fed offspring of a fasting-induced DR mother showed reduced fecundity, slower growth rate, decreased body size, and/or decreased mortality [19,20]. Although there is increasing evidence that the father’s diet or fitness also influences fitness in their offspring [18,21,22,23], most previous studies have focused only on the maternal DR effects and studies examining both maternal and paternal effects in a single experimental design are limited. In addition, the effect of early parental DR without fasting on offspring fitness is still unclear.
This study examined the effects of parental DR on the lifespan and fitness of their offspring using Drosophila melanogaster, one of the most widely used model organisms for studies on genetics and transgenerational effects. In this study, we investigated the intergenerational effect of DR (F0–F1) since previous studies suggested that the longevity effect of DR is instant, not persisting for multiple generations [20,24,25]. The results showed that short periods of parental DR increased the lifespan, resistance to environmental stress, and body weight but had little effect on the development, fecundity, and feeding rate of the offspring.

2. Materials and Methods

2.1. Fly Strain and Husbandry

The experiments were conducted using wild-type Canton-S flies, originally obtained from the Bloomington Drosophila Stock Center (Indiana University, Bloomington, IN, USA). All flies were cultured and reared at 25 °C and 65% humidity on 12:12 h light:dark cycles. Larval crowding was avoided by laying approximately 150 eggs on 250 cm3 fly bottles containing 25–30 mL of medium and were developed until the eclosion to adult. Standard CSY medium (52 g/L cornmeal, 110 g/L sugar, 25 g/L baker’s yeast, 8 g/L agar, 5 mL/L propionic acid, and 2.2 mL/L tegosept in 95% ethanol) was used to rear the fly larvae. Parental DR was administered by feeding the parent flies CSY food, including 160 g/L (full diet) or 40 g/L (restricted diet, 25% protein level of full diet) Saf-yeast extract.

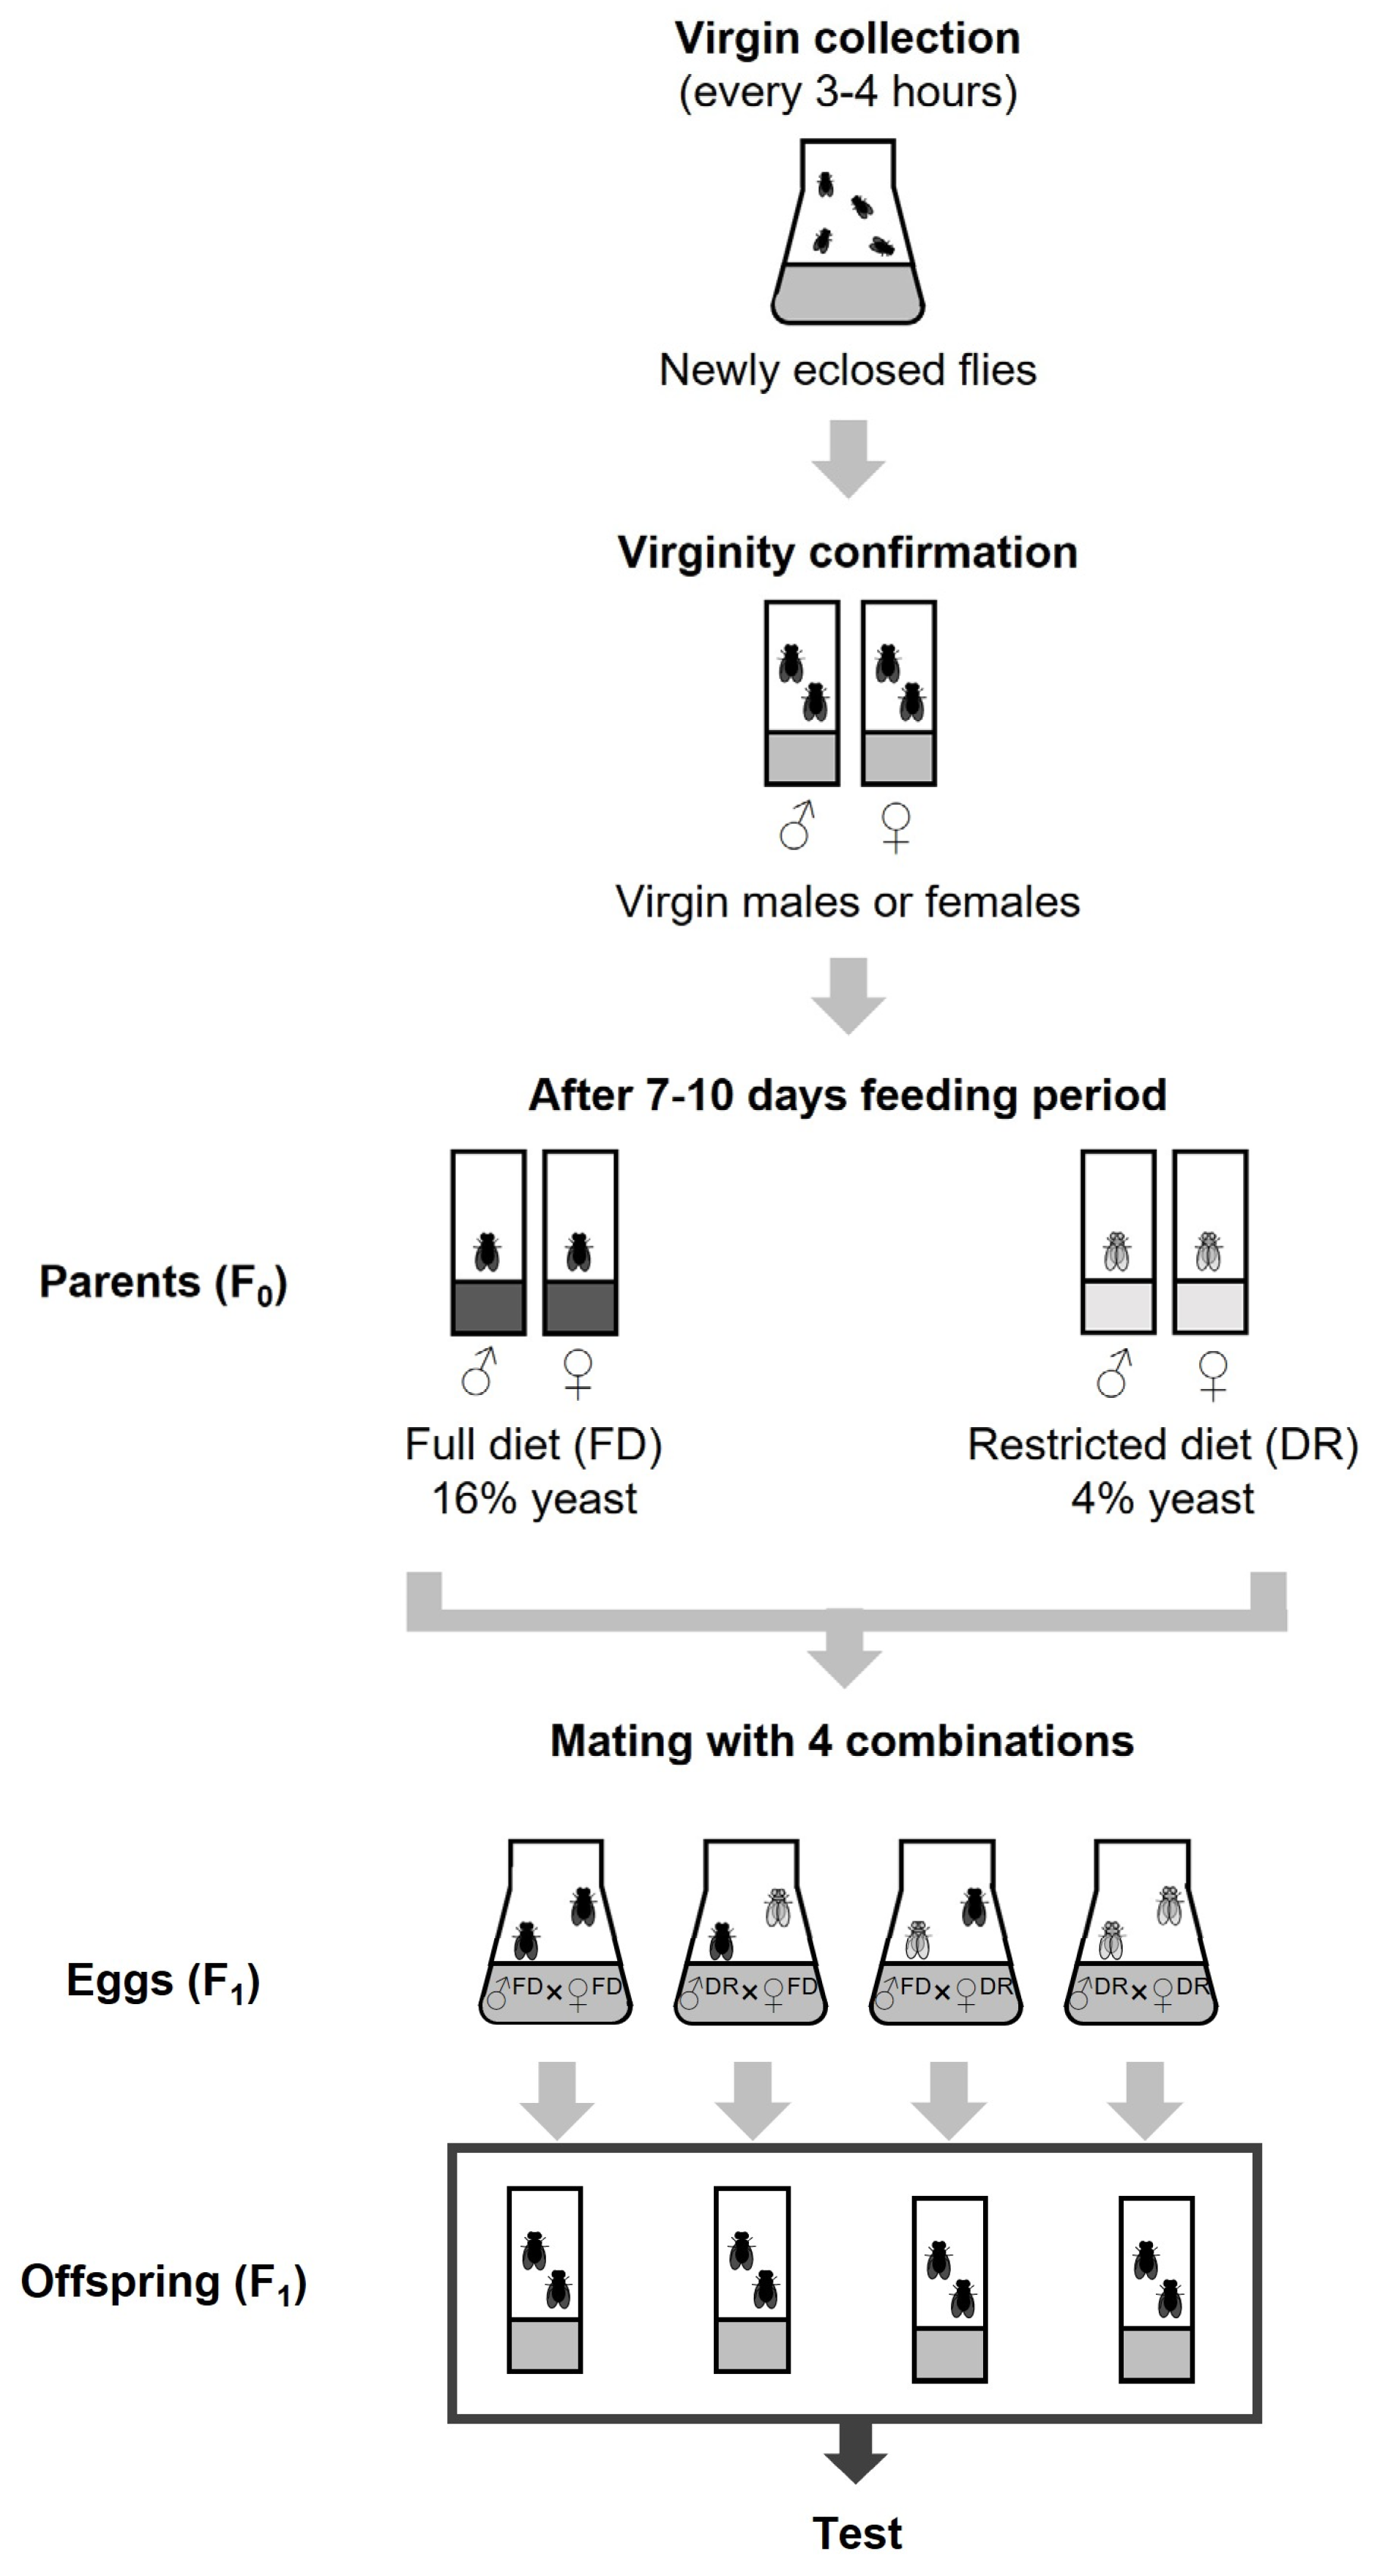
2.2. Fly Collection and Parental Breeding Design

Newly eclosed flies for parental generation were collected within 12 h and allocated to Φ25 × 100 mm vials containing full or restricted medium. Approximately 20 single-sex flies were kept per vial. The flies were transferred to fresh vials twice a week. After a 7–10 days feeding period, the parental flies were allocated to obtain eggs in standard CSY medium. The larval density of the offspring was adjusted by controlling the number of mating pairs of parents because the larval viability is influenced by larval density [26]. The number of parent flies used was 5 to 10 pairs in a full-fed diet group and 10 to 15 pairs in a restricted diet. Figure 1 outlines the experimental scheme.

2.3. Lifespan

Newly eclosed Canton-S adult flies were collected over 48 h and assigned randomly to a 500 cm2 demography cage to a final density of 100 males and 100 females per cage. All flies were cultured at 25 °C and 65% humidity on 12:12 h light:dark cycles. The fresh food was changed every two days, and all deaths were recorded. Three replicates were established for each group. Four trials were conducted to confirm the offspring’s lifespan. The parental flies were kept in mixed-sex groups similar to natural conditions (trials I and II) or in single-sex groups eliminating the reproductive effects (trials III and IV) to consider sexual interactions. The Kaplan–Meier survival estimator was used to estimate the survival function from the lifetime data. Log-rank tests were carried out to determine the statistical significance of the differences in the mean lifespan. In this study, maximum lifespan is defined as when the last 25% of the fruit flies used in the experiment are alive. The JMP statistical package (SAS Institute, Cary, NC, USA) and Statistical Package for the Social Sciences (SPSS, SPSS Inc., Chicago, IL, USA) were used for the analyses.

2.4. Stress Resistance

Seven- to ten-day-old offspring flies were transferred into a new vial (Φ25 × 100 mm) with ten single-sex flies in each. Fifteen vials were established for each group in each stress resistance test. All flies were tested at 25 °C and 65% humidity on 12:12 h light:dark cycles. For the stress resistance test with heat shock, the F1 flies were exposed to 39.5 °C by transferring heat through the air. The number of dead flies was recorded every 10 min until all the flies had died. For the starvation resistance test, the F1 flies were exposed to a medium that contained only 8 g/L agar. The number of dead flies was recorded every six hours until all the flies had died. The F0 flies were exposed to SY medium for the oxidative stress resistance test. The F1 flies were exposed to acute oxidative stress (18 mM paraquat). The food for oxidative stress contained 50 g/L sucrose (Sigma–Aldrich, St. Louis, MO, USA) to exclude the effects of starvation. The number of dead flies was recorded every three hours until all the flies had died. The Kaplan–Meier survival estimator was used to estimate the survival function from the lifetime data. Log-rank tests were carried out to determine the statistical significance of the differences in the mean lifespan. The JMP statistical package (SAS Institute, Cary, NC, USA) was used for the analyses.

2.5. Developmental Viability and Time

The 2-day-old flies were put in egg collection plate (90 × 15 mm diameter) containing standard CSY with 4% agar, and the eggs were collected for 12 h using the fast egg collection method. Then, 10 eggs were gently transferred to Φ25 × 100 mm vials containing standard CSY medium using a small brush. All flies were cultured at 25 °C and 65% humidity on 12:12 h light:dark cycles. The pupae and adult flies were counted every 12 h until no additional flies emerged. Fifteen replicates were established for each group. The data are presented as the mean ± SEM values.

2.6. Fecundity

Newly eclosed virgin flies were collected, and 24 h later, 1 female and 2 males were placed together in the Φ25 × 100 mm vial containing CSY medium. All flies were tested at 25 °C and 65% humidity on 12:12 h light:dark cycles. The flies were transferred carefully every 24 h, and the number of eggs laid on the medium was counted for 10 days. Twenty replicates for each group were established. The data are presented as the mean ± SEM.

2.7. Feeding Rate

The flies were pre-exposed to starvation for four hours before feeding. All flies were tested at 25 °C and 65% humidity. The 20-day-old-flies were fed a standard CSY medium containing 2.5% FD&C blue No.1 for 1 hour. The fly heads were cut off by quick freezing in liquid N2 to remove the red eyes of a fly. Then, 4 flies were placed in a 1.5 mL tube and homogenized with 100 µL of distilled water. The samples were centrifuged at 13,000 r/min (8400 × g) for 5 minutes at 4 °C. Subsequently, 100 µL of supernatant of the sample without lipid was transferred to another 1.5 mL tube and 100 µL distilled water was added. The absorbance was measured at 595 nm using a Sunrise microplate reader (TECAN, Männedorf, Switzerland). Eighteen replicates were established for each group. The data are presented as the mean ± SEM.

2.8. Body Weight

Newly eclosed flies were collected and transferred to Φ25 × 100 mm vials containing 10 single-sex flies each. All flies were reared at 25 °C and 65% humidity on 12:12 h light:dark cycles. The body weight of the flies was measured on a microbalance (PAG214C, Ohaus, Parsippany, NJ, USA) after CO2 anesthesia. After seven days on CSY foods, the body weight of the same flies was measured. Fifteen replicates were established for each group. The data are presented as the mean ± SEM.

2.9. Statistical Analysis

The log-rank tests for the lifespan and stress resistance data were carried out using survival models (Kaplan–Meier survival analysis) in the IBM SPSS statistics 21 (IBM, Armonk, NY, USA). The test for normality (Shapiro–Wilk test) and the statistical probabilities (F-test, t-test, and Wilcoxon rank sum test) of the data in this study were performed using R studio software.

3. Results

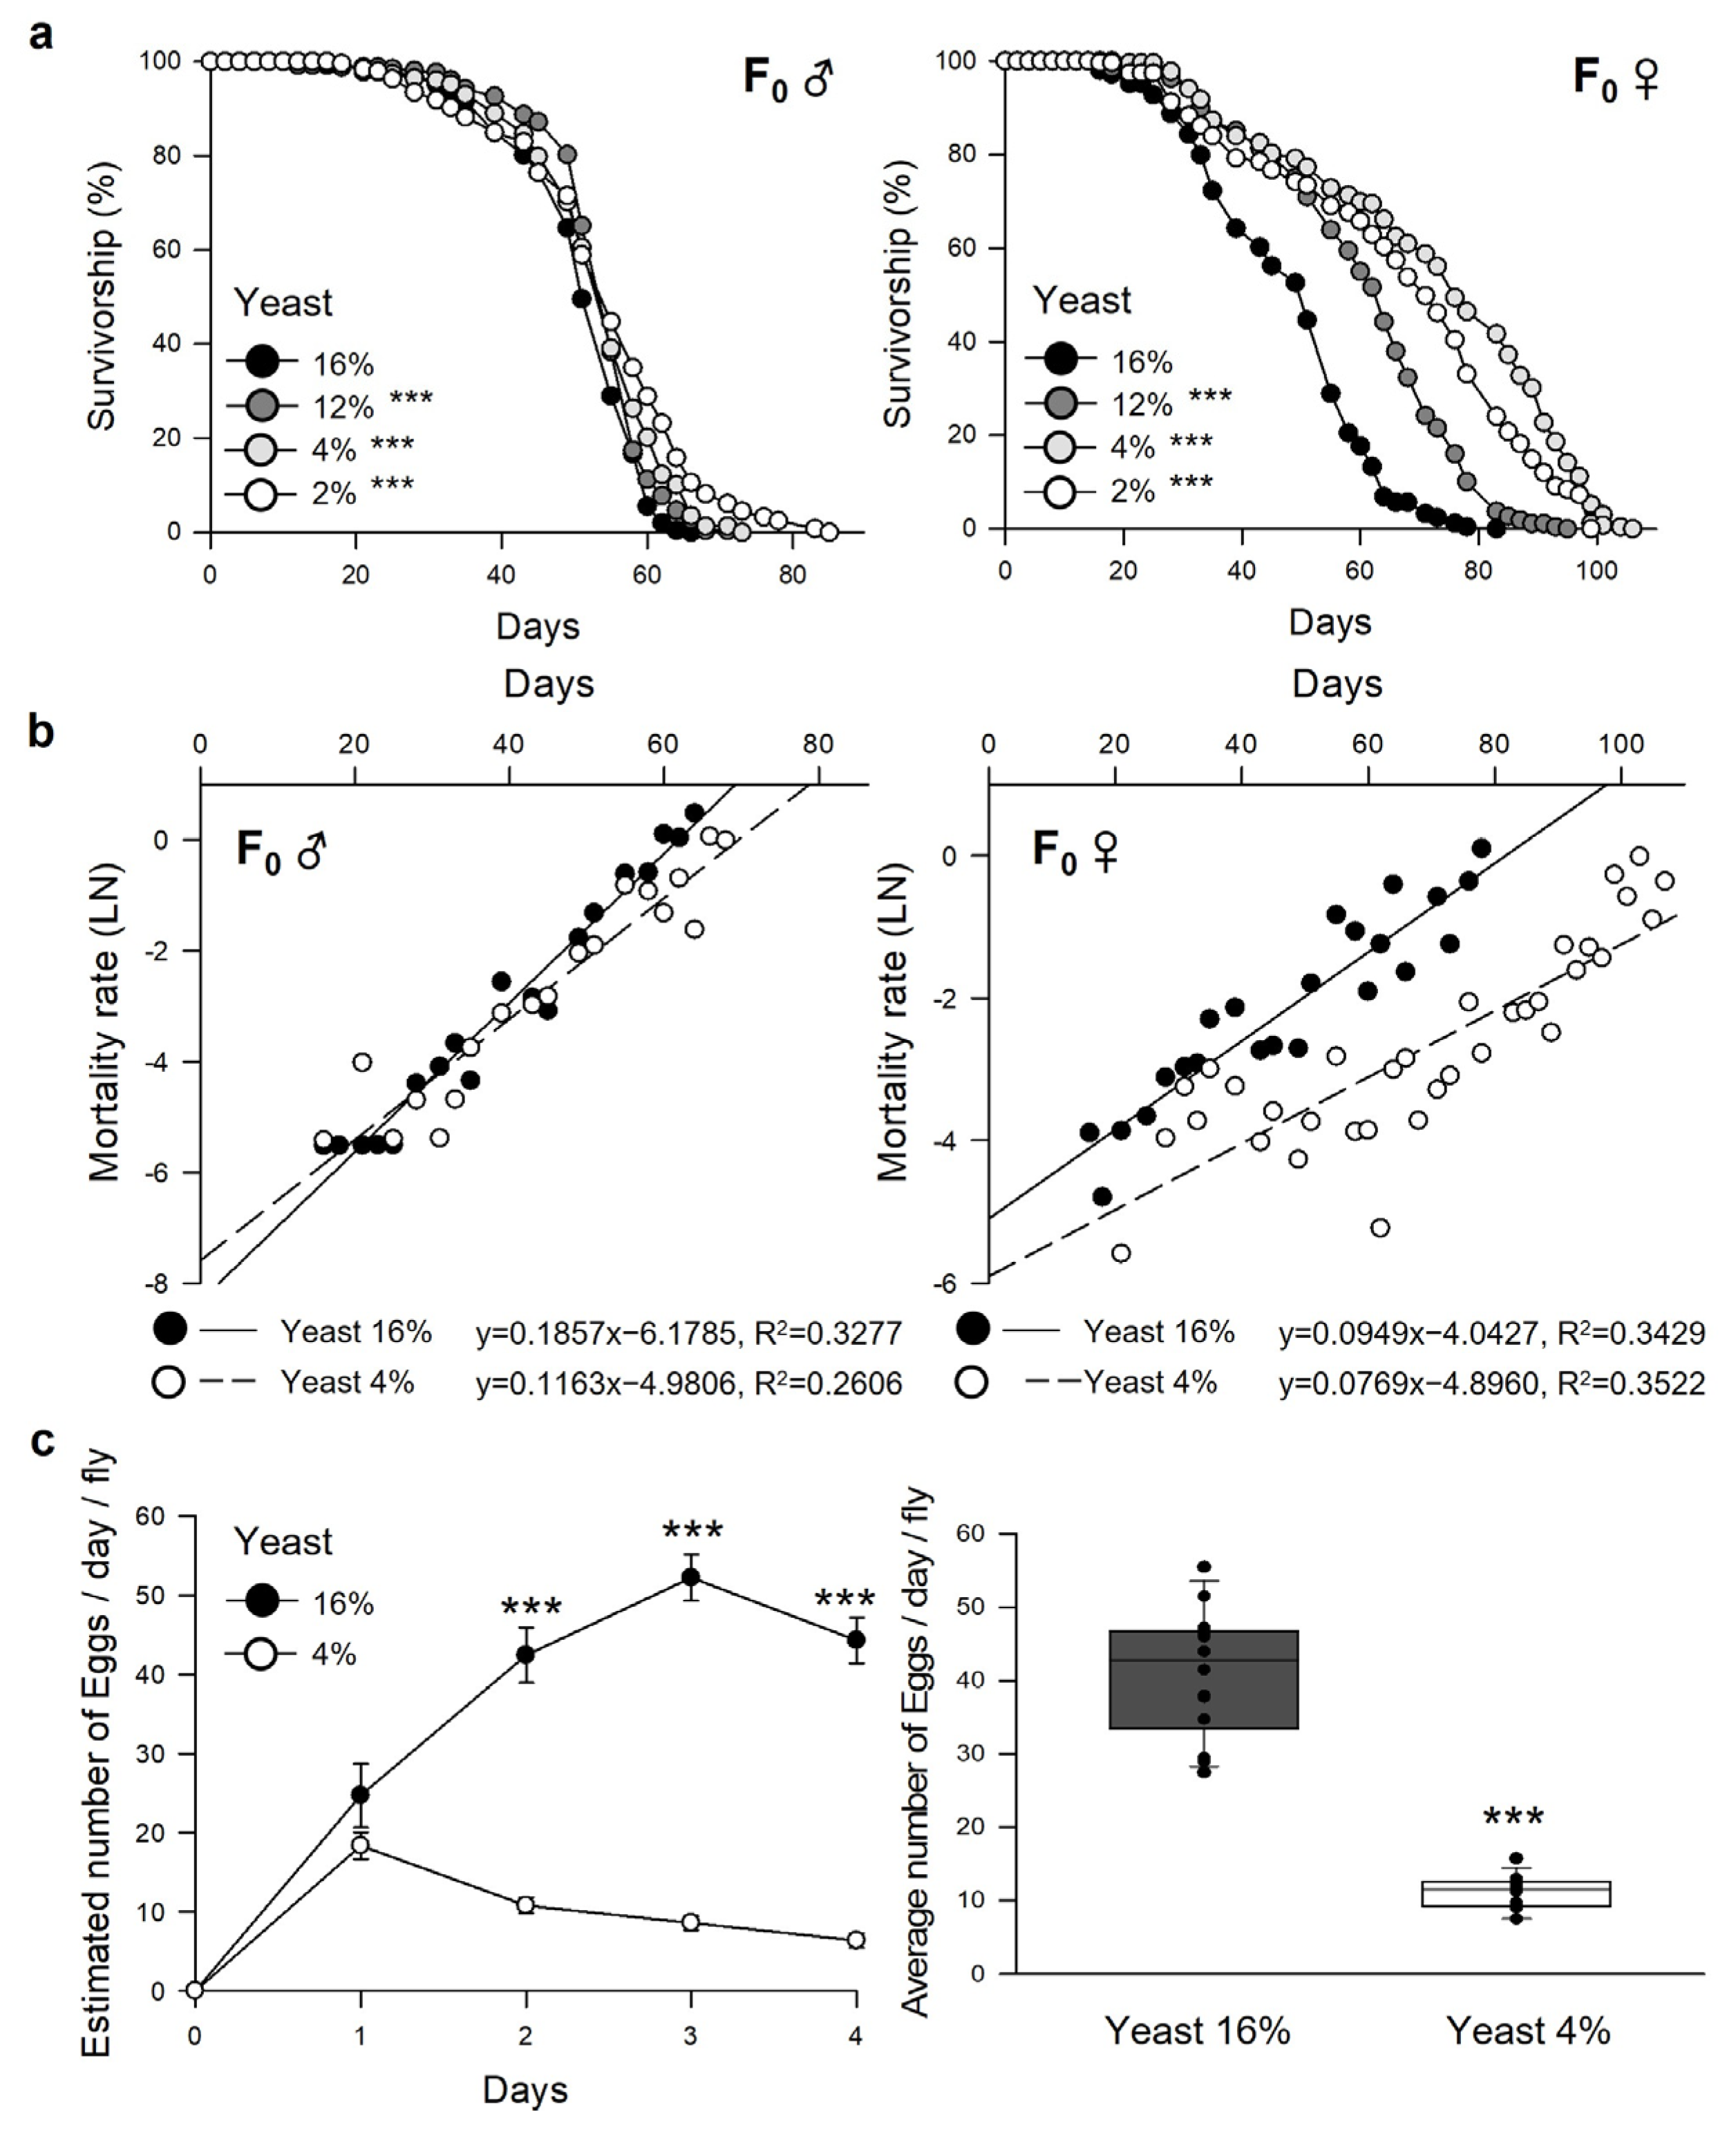
3.1. Dietary Restriction Increases the Lifespan and Reduces the Fecundity in Parent Flies

To determine optimal DR conditions in our laboratory conditions, parent fruit flies (F0) were fed a 2, 4, 12, or 16% yeast extract. The F0 male flies fed the 2 or 4% yeast extract diet had higher survival than those fed the 16% yeast diet (Figure 2a, Table 1, 16%, 50.89 ± 0.57 days; 12%, 53.64 ± 0.53 days, 5.4% increase, log-rank test, χ2 = 13.50, p < 0.0005; 4%, 53.21 ± 0.66 days, 4.6% increase, log-rank test, χ2 = 19.01, p < 0.0001; 2%, 53.05 ± 0.78 days, 4.2% increase, log-rank test, χ2 = 28.86, p < 0.0001). The F0 female flies fed the 2 or 4% yeast extract diet also had higher survival than those fed the 16% yeast diet (Figure 2b, Table 1, 16%, 47.66 ± 0.91 days; 12%, 60.41 ± 1.01 days, 26.8% increase, log-rank test, χ2 = 105.47, p < 0.0001; 4%, 72.36 ± 1.39 days, 51.8% increase, log-rank test, χ2 = 225.84, p < 0.0001; 2%, 66.73 ± 1.36 days, 40.0% increase, log-rank test, χ2 = 175.00, p < 0.0001). In the F0 females, however, the lifespan of the flies fed 2% yeast was 7.78% shorter than the flies with 4% yeast, indicating that this 2% yeast diet could lead to malnutrition in fruit flies [27,28]. Thus, 16% yeast was considered the full diet (FD), and 4% was the restricted diet (DR) for parental diet conditions.
DR in individuals reduced reproduction. The fecundity of F0 females was measured and adjusted for the number of eggs between the F0 groups fed an FD or DR to remove the possibility that reduced offspring population affects the physiological changes. As described elsewhere, DR reduced the fecundity of F0 females (Figure 2c; full diet, average number of eggs/days = 41 ± 2.3; restricted diet, average number of eggs/days = 11 ± 0.6, 73.1% decrease, student’s t-test, p < 0.0001). According to these results, the number of parent flies was controlled to 5 to 10 pairs in the full-fed diet group and 10 to 15 pairs in DR to obtain the offspring fruit flies (F1). Figure 1 shows the detailed mating scheme.

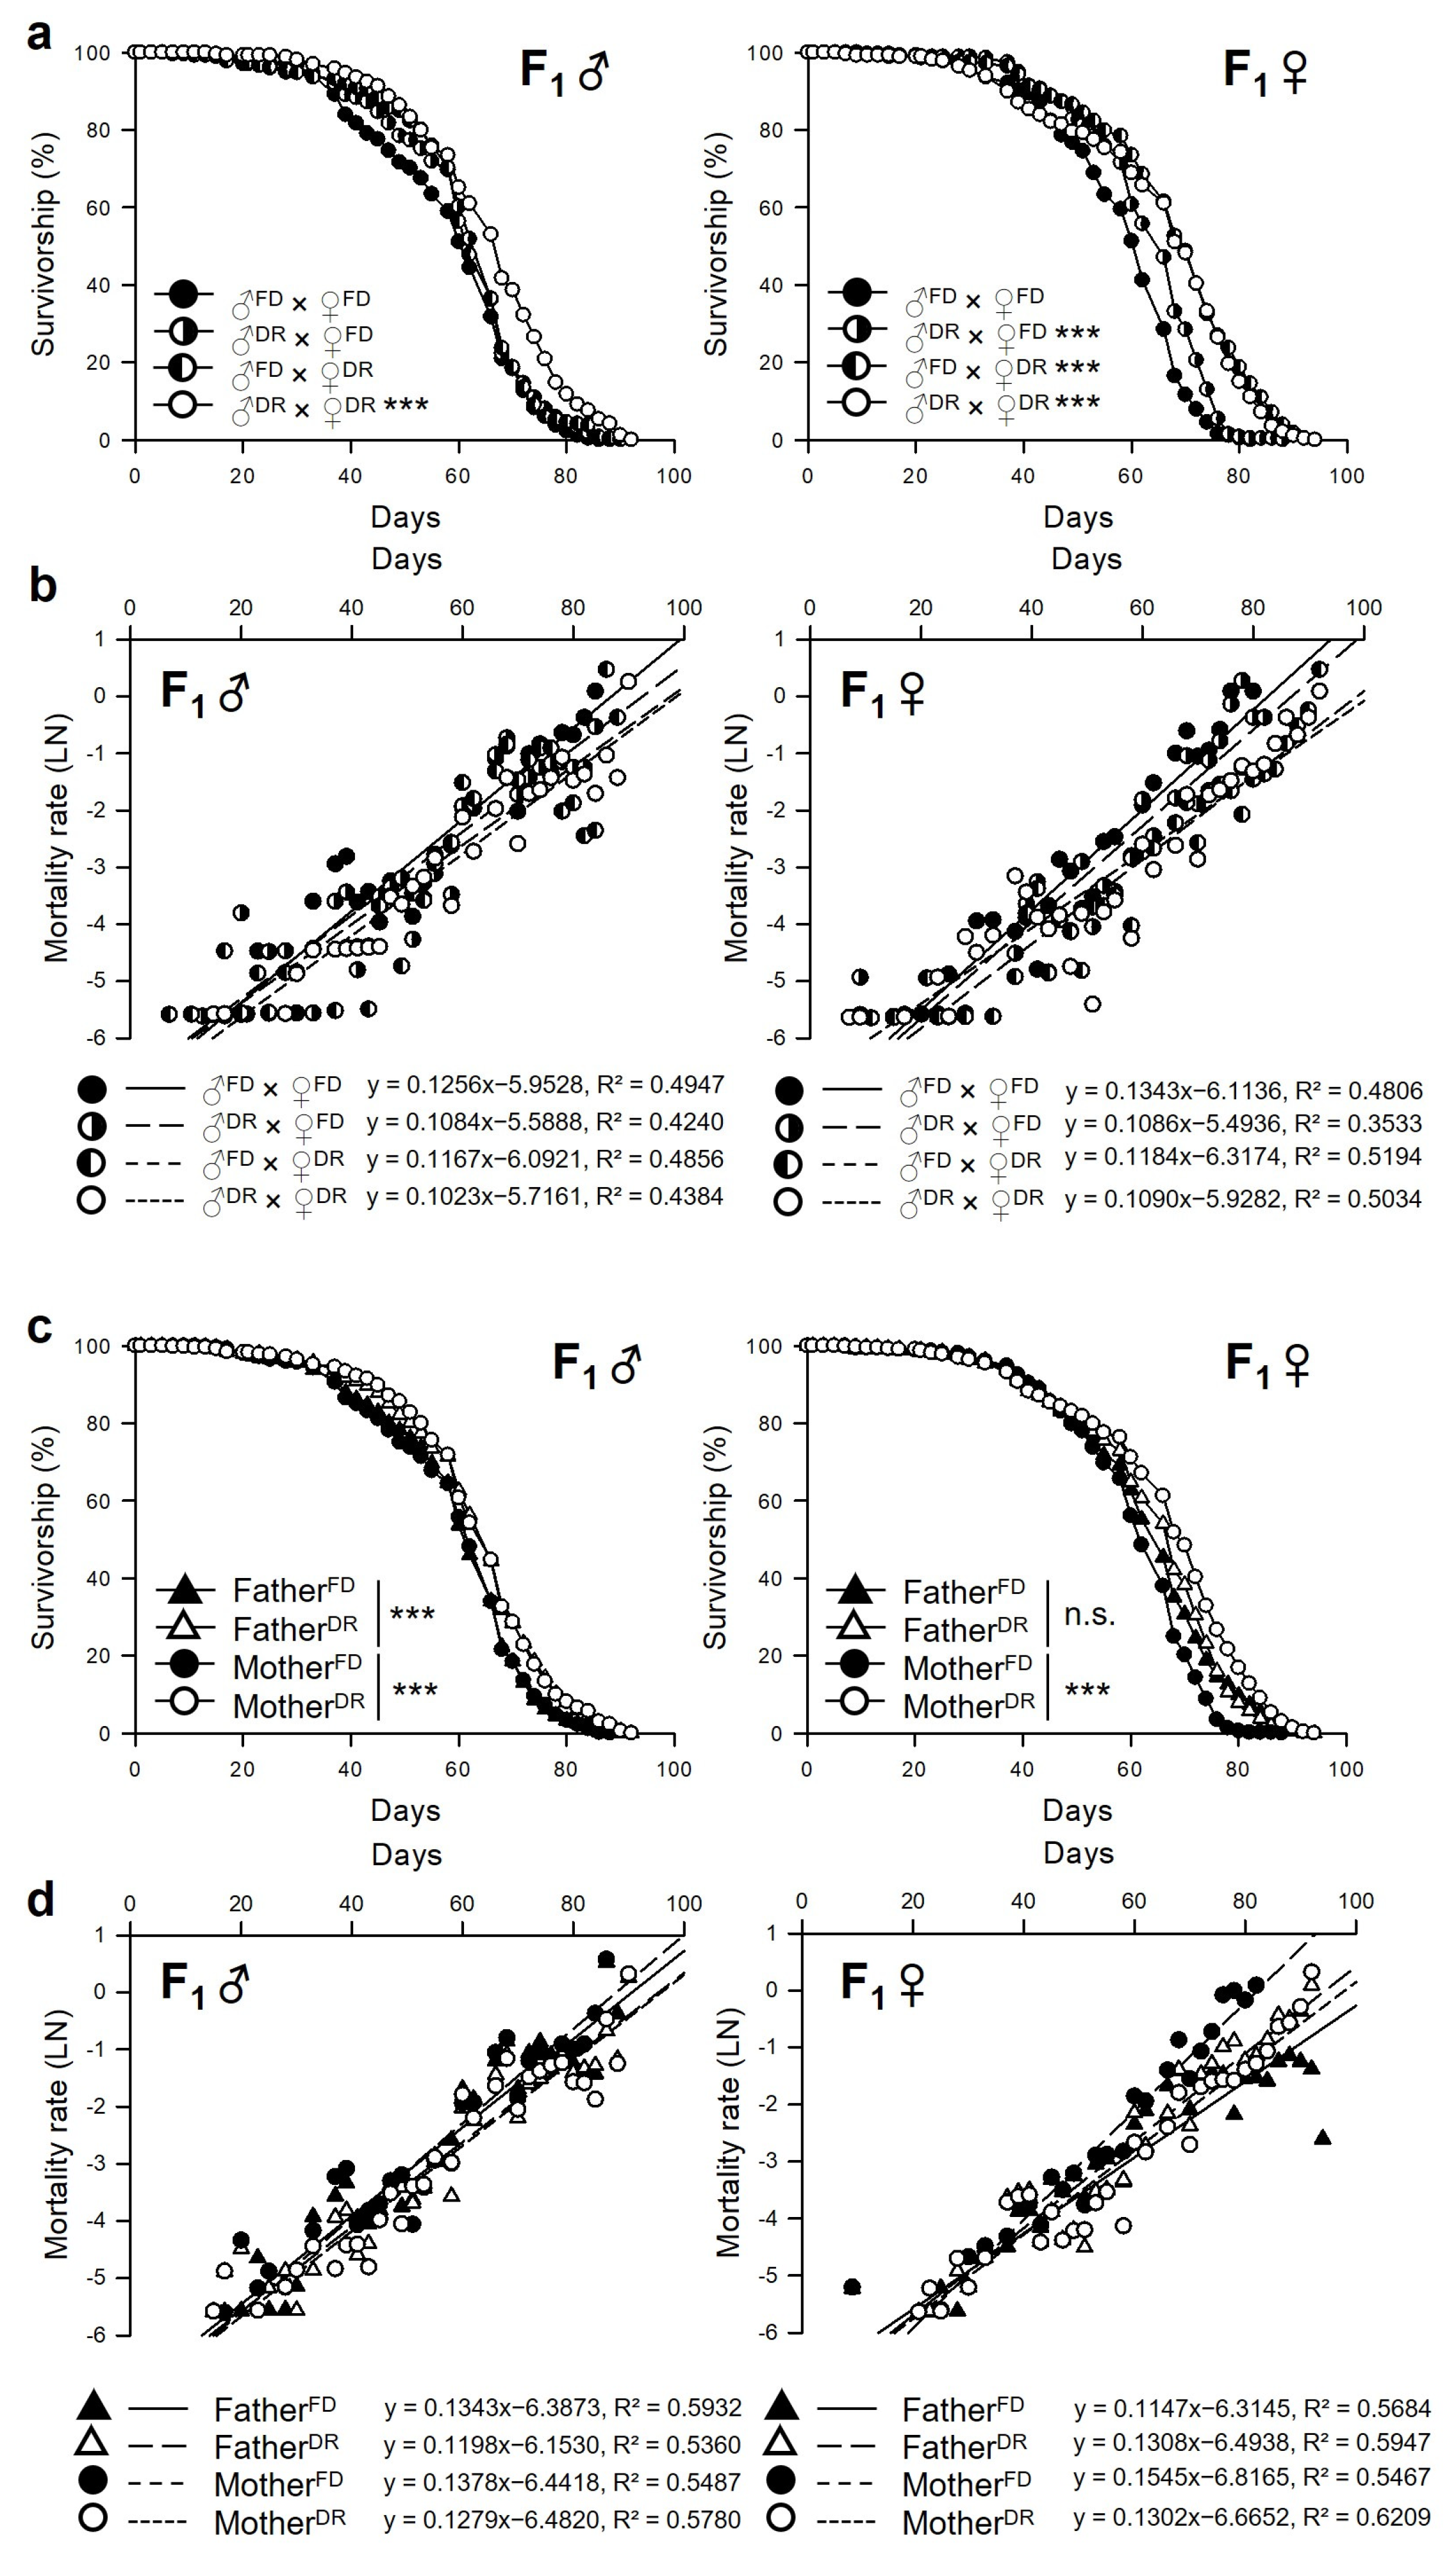
3.2. Parental Dietary Restriction Increases the Lifespan of the Offspring Flies

Four combinations of flies were used to determine if the longevity effect of parental DR affects the lifespan of their F1 flies: FD male and FD female (♂FD × ♀FD), DR male and FD female (♂DR × ♀FD), FD male and DR female (♂FD × ♀DR), and DR male and DR female (♂DR × ♀DR) were mated (Figure 1). The lifespan of F1 flies was measured under normal diet conditions (Figure 3). The F1 lifespan was increased, and the F1 mortality was decreased when their parents were fed on a DR instead of FD (Figure 3a,b and Table 2; Male, ♂FD × ♀FD, 55.87 ± 0.89 days; ♂DR × ♀DR, 63.42 ± 0.88 days, 13.5% increase, log-rank test, χ2 = 43.3299, p < 0.0001; Female, ♂FD × ♀FD, 56.04 ± 0.78 days; ♂DR × ♀DR, 63.20 ± 1.03 days, 13.3% increase, log-rank test, χ2 = 92.7941, p < 0.0001). Interestingly, cross-combination with the FD and DR (♂DR × ♀FD or ♂FD × ♀DR) extended the lifespan of only the F1 female (♂DR × ♀FD, 60.50 ± 0.74 days, 8.0% increase, log-rank test, χ2 = 24.138, p < 0.0001; ♂FD × ♀DR, 65.49 ± 0.92 days, 16.9% increase, log-rank test, χ2 = 109.4231, p < 0.0001) but not the F1 male (♂DR × ♀FD, 60.50 ± 0.74 days, log-rank test, χ2 = 3.6747, p = 0.0552; ♂FD × ♀DR, 58.80 ± 0.86 days, log-rank test, χ2 = 3.6341, p = 0.0566). The results were re-analyzed with the paternal or maternal diet to clarify which one of the father or mother affects the F1 lifespan. FatherFD included the ♂FD × ♀FD and ♂FD × ♀DR, FatherDR included the ♂DR × ♀FD and ♂DR × ♀DR, MotherFD included the ♂FD × ♀FD and ♂FD × ♀FD, and MotherDR included the ♂FD × ♀DR and ♂DR × ♀DR (Figure 3c,d and Table 3). The lifespan of an F1 male that had a DR-fed father or mother increased regardless of what the opposite parent was fed (FatherFD, 57.33 ± 0.62 days; FatherDR, 60.78 ± 0.63 days, 6.0% increase, log-rank test, χ2 = 24.2517, p < 0.0001; MotherFD, 57.06 ± 0.63 days; and MotherDR, 61.10 ± 0.62 days, 7.1% increase, log-rank test, χ2 = 25.3409, p < 0.0001). In females, only the DR-fed mother increased the lifespan; the father’s diet did not affect the lifespan of the F1 female (FatherFD, 60.90 ± 0.64 days; FatherDR, 61.85 ± 0.64 days, 1.6% increase, log-rank test, χ2 = 0.7762, p = 0.3783; MotherFD, 58.31 ± 0.55 days; and MotherDR, 64.35 ± 0.69 days, 10.4% increase, log-rank test, χ2 = 137.0076, p < 0.0001). Thus, in the case of the female offspring, the longevity effect by parental DR was more prominent than that of the male offspring, but it appears to be influenced mainly by the mother’s diet. On the other hand, the male offspring tended to extend their lifespan even if only one of the parents ate the restricted diet, but it showed a significant increase in lifespan when both parents restricted the diet.
The lifespan of F1 was measured independently in three repeated trials (Figure S1). These parental DR-induced longevity effects were also shown when the yeast type of the parental diet was changed from yeast extract to Brewer’s inactive yeast (Figure S1a). The mean lifespan of flies from parents fed on a DR tended to increase in the F1 males and females in all trials. In particular, the F1 females from parents fed a DR had significantly longer lifespans in all trials. Parents fed a DR tended to increase the lifespan of the F1 males, but only two trials (first and third) were statistically significant. Overall, seven days of exposure to different dietary regimens in parental flies had significant effects on the F1 lifespan, and there were also sex-specific effects on the offspring’s lifespan. Accordingly, subsequent experiments were performed using only the FD × FD and DR × DR groups to investigate the effects of parental DR on offspring by removing maternal–paternal factors.

3.3. Parental (F0) Dietary Restriction Increases the Resistance to Various Stressors in Offspring (F1) Flies

The effects of parental diet on the F1 susceptibility to environmental stresses were examined because resistance to environmental stress is closely related to individual longevity. The survival rate of the offspring under heat shock stress, oxidative stress, or starvation stress was evaluated. The resistance to heat shock was significantly greater in both male and female offspring from the parents fed on a DR (24% and 37%, respectively) than the offspring from parents fed on an FD (Figure 4a, Log-rank test, male, χ2 = 39.0, p < 0.0001; female, χ2 = 50.0, p < 0.0001). The resistance to oxidative stress was also increased by 18% and 17% in the male and female offspring of parents fed a DR, respectively, than offspring from parents fed on an FD (Figure 4b, Log-rank test, male, χ2 = 6.7, p < 0.01; female, χ2 = 4.1, p < 0.05). In the case of starvation stress, parental DR increased resistance to starvation in female offspring by 23% but not in male offspring (Figure 4c, Log-rank test, male, χ2 = 1.0, p = 0.316; female, χ2 = 33.6.0, p < 0.0001). Thus, stress resistance was generally greater in F1 from parents fed a DR than those from parents fed on an FD. Moreover, there also appeared to be sex-specific effects on offspring similar to the results of the lifespan tests. These results suggest that parental DR has beneficial effects on various environmental stress resistances of their offspring.

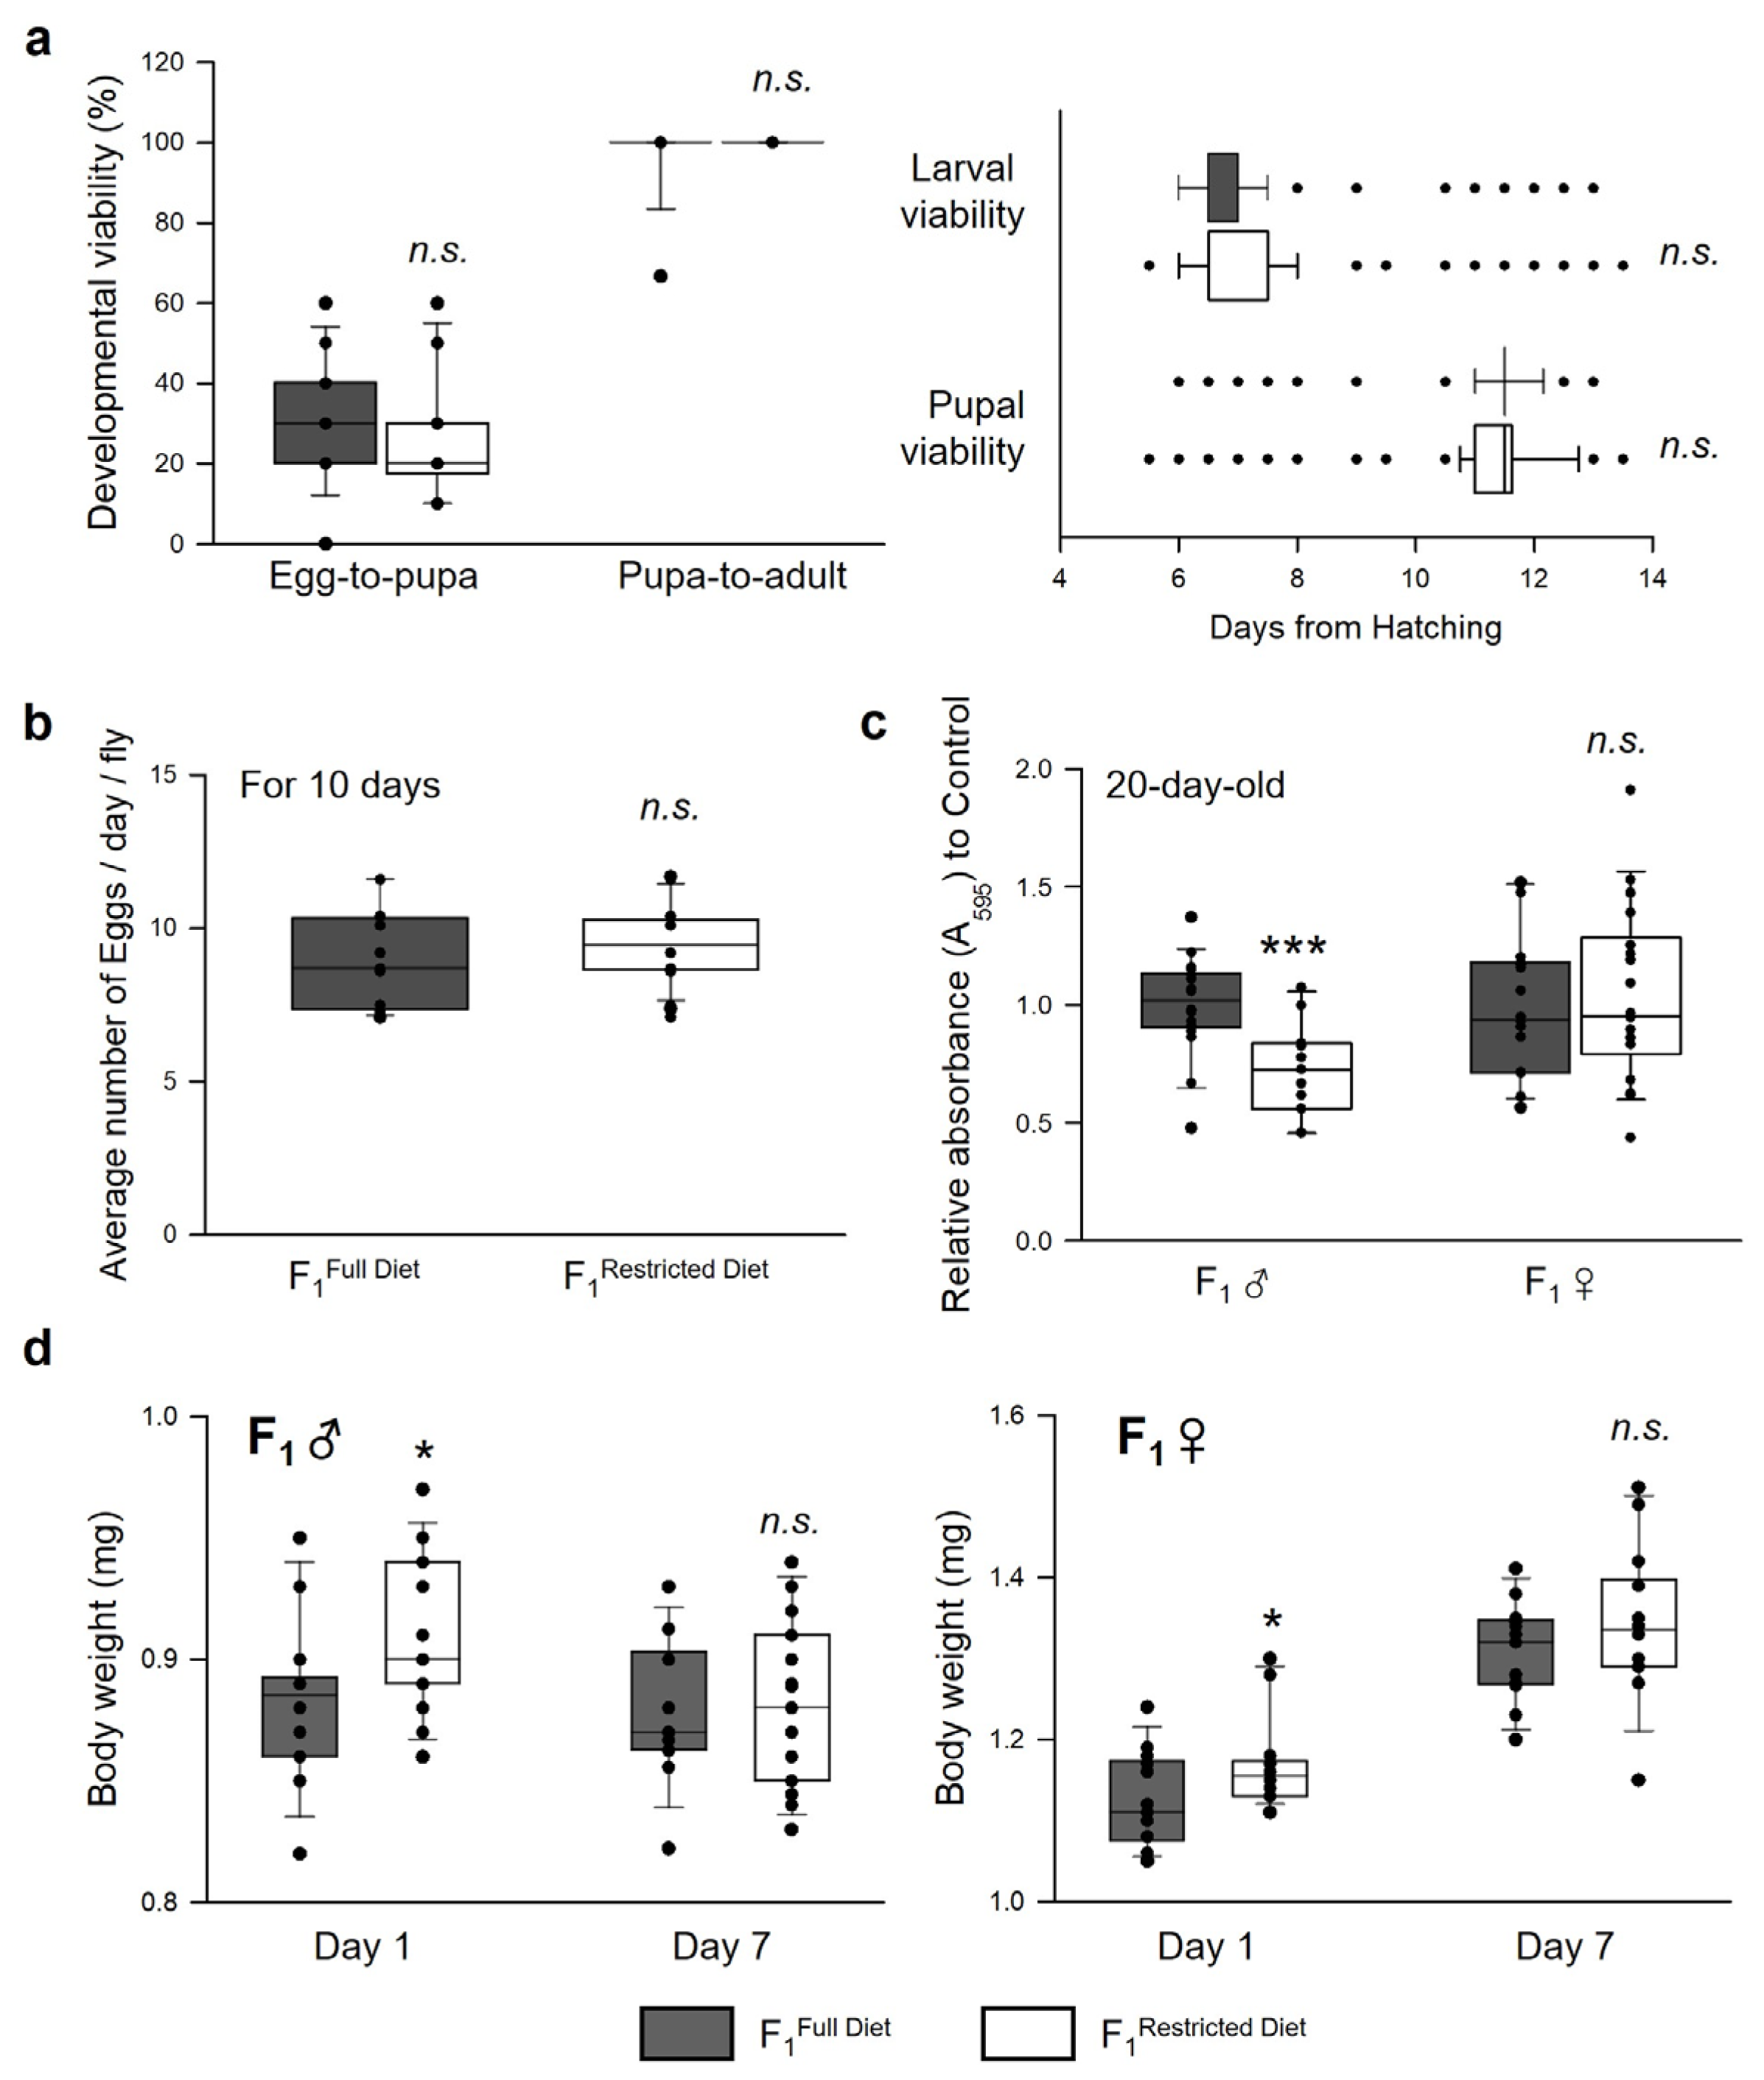
3.4. Parental Dietary Restriction Affects the Offspring’s Body Weight and Feeding Rate but Not the Development and Fecundity of the Offspring Flies

The offspring’s developmental viability, body weight, fecundity, and feeding rate, which can influence the ability to survive and thrive in the environment, were measured to examine the intergenerational effects of parental DR on various offspring (F1) traits. DR leads to delayed developmental timing and reduced fecundity, but the parental diet did not affect their offspring’s developmental viability (Figure 5a left, Wilcoxon rank sum test; egg-to-pupa, p = 0.124; pupa-to-adult, p = 0.164), developmental timing (Figure 5a right, Wilcoxon rank sum test; emergence to pupa, p = 0.361; emergence to adult, p = 0.401), and fecundity (Figure 5b, Student’s t-test, p = 0.382). The feeding rate of their offspring was measured to determine if parental feeding behaviors enhanced by DR were transmitted to the offspring. Interestingly, parental DR decreased the feeding rate of F1 males but not F1 females (Figure 5c; F1 ♂, Student’s t-test, p < 0.0001; F1 ♀, Student’s t-test, p = 0.733). The offspring’s body weight was then measured because it has been reported that parental diet could alter the body composition of their offspring [13]. In these results, newly hatched young adult male or female offspring (1 day of age) were heavier when their parents were fed DR than when their parents were fed the FD (Figure 5d; F1 ♂, Day 1, Student’s t-test, p < 0.05; F1 ♀, Day 1, Wilcoxon rank sum test, p < 0.05). These differences in the body weight at the 1-day-old age disappeared at the 7-day-old age (Figure 5d; F1 ♂, Day 7, Student’s t-test, p = 0.366; F1 ♀, Day 7, Student’s t-test, p = 0.289). Interestingly, the offspring of the 2 groups showed a difference in the rate of body weight change over 7 days in the same medium composition (male, F1Full Diet, 0.37% decrease, F1Restricted Diet, 9.37% decrease; female, F1Full Diet, 16.68% increase, F1Restricted Diet, 14.92% increase). It indicates that the offspring of DR-fed parents have more difficulty gaining weight than the offspring of FD-fed parents. Thus, the offspring’s body weight was increased by parental DR, but there were no changes in developmental time. Hence, the effects of reduced food intake might be a factor that leads to a longevity effect by parental DR because lifespan extension can be induced by the reduction of food intake [29].

4. Discussion

This study examined the effects of parental (F0) dietary restriction on the offspring (F1) fitness, such as lifespan, resistance to environmental stress, development, body weight, fecundity, and feeding rate, using the fruit fly, Drosophila melanogaster. In this study, we investigated intergenerational (F0–F1) effects of DR because previous studies indicated DR effects did not persist for several generations. Great-grand-offspring (F3) of fasting-induced DR mother showed a reduced fitness and increased mortality risk indicating that the transgenerational benefit of DR is instant in nematode [20]. Similarly, after 25 generations of DR, male DR flies had increased reproduction, but their survival rate did not increase [24]. In the case of females, after 50 generations of DR, female DR flies had increased reproduction, but their survival rate decreased [25]. These results indicate that longevity effects induced by DR may not persist over multiple generations, and organisms evolve to increase reproductivity under long-term DR conditions. This study showed that short periods of parental dietary restriction during the adult stage had a significant impact on fitness changes, particularly the lifespan in offspring flies (Figure 3). The offspring phenotype could be altered in response to adaptive parental effects, which might explain why lifespan extension occurred by reducing the intrinsic mortality in the individuals and their offspring. The lifespan and environmental stress resistance are correlated [30,31]. The offspring’s resistance to heat shock, starvation, or oxidative stress was examined in this study (Figure 4). Both male and female offspring from parents fed a restricted diet survived better than offspring from parents fed a full diet, except for survival with starvation resistance in male offspring. The intergenerational DR effects on lifespan and resistance to starvation stress were sex specific. Previous studies reported that parental environmental conditions might induce different epigenetic effects in sons versus daughters. For example, exposure to environmental compounds, such as endocrine disruptor vinclozolin, induced sex-specific transgenerational alterations in the brain transcriptomes and behavior in rats [32]. In a study using the springtail Orchesella cincta, similar to our results, the offspring of a DR-fed mother showed increased flexibility in low-food conditions, but these maternal effects were not observed in the sons [33]. Heat shock proteins (HSPs) are induced by several stressors, such as heat shock, oxidative stress, or even DR [34]. These proteins perform a chaperone function by assisting new proteins in correcting folding or refolding proteins damaged by cell stress [35]. DR, as hormetic metabolic stress, can activate several defense mechanisms to increase the lifespan and could induce the heat shock response [36]. For example, DR promoted the HSP70 protein and hsp70 mRNA synthesis in hepatocytes of 28-month-old rats [34]. Offspring from parents in the Artemia model who survived heat shock have greater tolerance to thermal stress than their respective offspring controls [37]. Thus, the parental DR can lead to compensatory effects related to extended lifespan and increased environmental stress resistance in the offspring. The theory of hormesis explains that a stressful circumstance could enhance the organism’s fitness after exposure [38].
The thrifty phenotype hypothesis is conceptually associated with hormesis, and these epigenetic effects can be passed from one generation to the next [39]. This hypothesis explains how flies might quickly and semi-permanently modify gene expression to adapt to a restricted regimen and pass these effects on to the next generation, thereby increasing the offspring’s survival by increasing their stress resistance. Several studies showed prenatal DR significantly changed the expression of major genes related with two epigenetic mechanisms (DNA methylation and histone modification) [15,16,17]. We investigated the expression of the sir2 gene, a well-known longevity effecter of DR, but the sir2 gene expression did not increase in the offspring of DR-fed parents (Figure S2). Previous studies reported that parental diet affects offspring’s energy metabolism, fat content, glucose homeostasis, and insulin resistance [40,41,42]. Thus, future studies are necessary to investigate the epigenetic effects of DR on energy metabolism, including fat and glucose homeostasis, to improve our understanding of the mechanisms of beneficial DR effects.
Increased resistance to starvation might be connected to the increased body weight of the offspring since body weight and starvation resistance are tightly related to each other. Our results showed that parents fed a restricted diet produced heavier offspring than those fed a full diet at birth (Figure 5d). Similarly, the offspring from parents fed a restricted diet showed increased body size [43] or body mass [44] in fruit flies. Given the well-known intraspecific trade-off between the number of offspring and offspring size [3,45], parents fed a restricted diet produce larger offspring. This outcome might be one of the mechanisms of adaptive parental effects [46]. In organisms without parental care, parental provisioning can be estimated by their offspring’s egg or newborn size [47]. However, the differences in body weight observed between the two groups of newly eclosed offspring disappeared after seven days in both sons and daughters (Figure 5d), suggesting that the effect of the parental diet on the offspring’s body weight is not sustained to the early adult stage of the offspring. In a mice study, interestingly, there was a similar result that food restriction of obese mice during pregnancy induced decreased body weight gain of offspring compared to that of high-fat diet mother’s offspring [48]. Additionally, many rodent studies showed that restricted protein content is associated with higher food intake in female offspring, but these differences in food intake disappeared when food intake was adjusted for body mass [49]. These results indicate that parental DR can reduce the risk of obesity in offspring as well as parents.
According to this present study, developmental viability from egg-to-pupa (pupation) or pupa-to-adult (eclosion) and developmental time to emergence showed no differences between the groups by their parental diet. Nevertheless, previous studies reported several contradictive effects of parental diet on offspring development in fruit fly or nematodes. The eggs from parents raised on a poor larval diet (approximately 1/4 to 1/8 of the standard diet) were heavier and developed faster than those from parents raised on standard food [44,46,50], but there are strain-specific differences in development time [44]. In contrast, the offspring from both parents raised on a poor diet have a longer development time than those from parents raised on standard food [43,44]. Interestingly, developmental time of the offspring was shortened when only one parent was raised on a poor diet [28] indicating that both maternal and paternal nutrition can influence offspring development. In the nematode, female offspring of fasting-induced DR mother showed reduced fecundity, slowed development time, and decreased body size [19,20]. On the other hand, most previous studies used “poor and standard” levels of dietary regimens or fasting-induced DR, but this study used full-fed and dietary restriction (reduced nutrient intake, especially yeast-protein source, without malnutrition) conditions. Additionally, this study adjusted the number of eggs between the F0 groups fed an FD or DR to remove the possibility that offspring population affects the physiological changes. Thus, the differences in the results of the previous and present studies might be due to the difference in fly strain, species, dietary composition, and/or population density control.
Parental DR reduced the food intake of their male offspring, but there were no significant changes in that of the female offspring (Figure 5c). This difference might be due to sexual dimorphic effects on feeding behavior. Because the lifespan is influenced significantly by food intake [29], reduced food consumption in male offspring whose parents were exposed to a restricted diet might be one factor that leads to an extended lifespan. Several reports suggested that transgenerational feeding behavior of offspring is influenced by parental dietary regimen in rat or fruit fly [51,52,53]. Several studies using fruit flies have shown that the longevity effect of DR is more effective in females than in males [54,55]. This may be because male and female generally pursue divergent reproductive strategies and thus have different sensitivities to nutritional interventions [56,57]. Therefore, the intrinsic changes in the mothers that led to the greater lifespan extension by DR may have been passed on to their daughters also. Our results suggest that the feeding behavior may be a heritable predisposition to their offspring, and the effects of reduced food intake might be one of the factors that lead to their extended lifespan.

5. Conclusions

Previous studies revealed the effects of diet restriction on aging, with lifespan extension and other beneficial effects observed in flies, nematodes, yeasts, insects, rodents, and possibly even primates [2]. The underlying mechanisms of hormetic DR effects on cellular responses remain conserved across the evolutionary tree, even though many organisms have diverged evolutionarily over time [58]. At the same time, theoretical models show that maternal effects can influence the speed and trajectory of evolutionary changes [59]. In this light, it would be worth determining if the parental effects of DR observed here apply to other organisms and developing an explicit theoretical treatment of the role of parental effects on the evolution of senescence.

Supplementary Materials

The following supporting information can be downloaded at: https://www.mdpi.com/article/10.3390/nu15051273/s1, Figure S1: Effects of parental (F0) DR on offspring (F1) lifespan of D. melanogaster in 2nd or 3rd trial; Figure S2: The mRNA levels of sir2 genes in the male or female offspring.

Author Contributions

Conceptualization, B.L., E.-J.L., and K.-J.M.; methodology, B.L. and E.-J.L.; software, H.-Y.L.; validation, B.L., E.-J.L., H.-Y.L., and K.-J.M.; investigation, B.L. and E.-J.L.; resources, K.-J.M.; data curation, H.-Y.L. and K.-J.M.; writing—original draft preparation, B.L. and H.-Y.L.; writing—review and editing, H.-Y.L. and K.-J.M.; visualization, H.-Y.L.; supervision, K.-J.M.; project administration, K.-J.M.; funding acquisition, K.-J.M. All authors have read and agreed to the published version of the manuscript.

Funding

This research was funded by Inha University Research grant, grant number 67873.

Institutional Review Board Statement

Not applicable.

Informed Consent Statement

Not applicable.

Data Availability Statement

The datasets during and/or analyzed during the current study are available from the corresponding author upon reasonable request.

Conflicts of Interest

The authors declare no conflict of interest.

References

  1. McCay, C.M.; Crowell, M.F.; Maynard, L.A. The effect of retarded growth upon the length of life span and upon the ultimate body size. J. Nutr. 1935, 10, 63–79. [Google Scholar] [CrossRef] [Green Version]
  2. Piper, M.D.; Bartke, A. Diet and aging. Cell Metab. 2008, 8, 99–104. [Google Scholar] [CrossRef] [PubMed] [Green Version]
  3. Smith, C.C.; Fretwell, S.D. The optimal balance between size and number of offspring. Am. Nat. 1974, 108, 499–506. [Google Scholar] [CrossRef]
  4. Stopher, K.V.; Pemberton, J.M.; Clutton-Brock, T.H.; Coulson, T. Individual differences, density dependence and offspring birth traits in a population of red deer. Proc. Biol. Sci. 2008, 275, 2137–2145. [Google Scholar] [CrossRef] [PubMed] [Green Version]
  5. Hales, C.N.; Barker, D.J. Type 2 (non-insulin-dependent) diabetes mellitus: The thrifty phenotype hypothesis. Int. J. Epidemiol. 1992, 42, 1215–1222. [Google Scholar] [CrossRef] [PubMed] [Green Version]
  6. Lansing, A.I. A nongenic factor in the longevity of rotifers. Ann. N. Y. Acad. Sci. 1954, 57, 455–464. [Google Scholar] [CrossRef]
  7. Mousseau, T.A.; Fox, C.W. The adaptive significance of maternal effects. Trends Ecol. Evol. 1998, 13, 403–407. [Google Scholar] [CrossRef]
  8. Aihie Sayer, A.; Dunn, R.; Langley-Evans, S.; Cooper, C. Prenatal exposure to a maternal low protein diet shortens life span in rats. Gerontology 2001, 47, 9–14. [Google Scholar] [CrossRef]
  9. Fernandez-Twinn, D.S.; Wayman, A.; Ekizoglou, S.; Martin, M.S.; Hales, C.N.; Ozanne, S.E. Maternal protein restriction leads to hyperinsulinemia and reduced insulin-signaling protein expression in 21-mo-old female rat offspring. Am. J. Physiol. Regul. Integr. Comp. Physiol. 2005, 288, R368–R373. [Google Scholar] [CrossRef]
  10. Martin-Gronert, M.S.; Tarry-Adkins, J.L.; Cripps, R.L.; Chen, J.H.; Ozanne, S.E. Maternal protein restriction leads to early life alterations in the expression of key molecules involved in the aging process in rat offspring. Am. J. Physiol. Regul. Integr. Comp. Physiol. 2008, 294, R494–R500. [Google Scholar] [CrossRef] [Green Version]
  11. Mortensen, O.H.; Olsen, H.L.; Frandsen, L.; Nielsen, P.E.; Nielsen, F.C.; Grunnet, N.; Quistorff, B. A maternal low protein diet has pronounced effects on mitochondrial gene expression in offspring liver and skeletal muscle; protective effect of taurine. J. Biomed. Sci. 2010, 17, S38. [Google Scholar] [CrossRef] [PubMed] [Green Version]
  12. Ost, A.; Lempradl, A.; Casas, E.; Weigert, M.; Tiko, T.; Deniz, M.; Pantano, L.; Boenisch, U.; Itskov, P.M.; Stoeckius, M.; et al. Paternal diet defines offspring chromatin state and intergenerational obesity. Cell 2014, 159, 1352–1364. [Google Scholar] [CrossRef] [PubMed] [Green Version]
  13. Buescher, J.L.; Musselman, L.P.; Wilson, C.A.; Lang, T.; Keleher, M.; Baranski, T.J.; Duncan, J.G. Evidence for transgenerational metabolic programming in Drosophila. Dis. Model Mech. 2013, 6, 1123–1132. [Google Scholar] [CrossRef] [Green Version]
  14. Li, Y.; Pollock, C.A.; Saad, S. Aberrant DNA Methylation Mediates the Transgenerational Risk of Metabolic and Chronic Disease Due to Maternal Obesity and Overnutrition. Genes 2021, 12, 1653. [Google Scholar] [CrossRef]
  15. Nowacka-Woszuk, J.; Madeja, Z.E.; Chmurzynska, A. Prenatal caloric restriction alters lipid metabolism but not hepatic Fasn gene expression and methylation profiles in rats. BMC Genet. 2017, 18, 78. [Google Scholar] [CrossRef] [Green Version]
  16. Nowacka-Woszuk, J.; Szczerbal, I.; Malinowska, A.M.; Chmurzynska, A. Transgenerational effects of prenatal restricted diet on gene expression and histone modifications in the rat. PLoS ONE 2018, 13, e0193464. [Google Scholar] [CrossRef] [Green Version]
  17. Nowacka-Woszuk, J.; Grzemski, A.; Sliwinska, M.; Chmurzynska, A. Hepatic DNA methylation and expression profiles under prenatal restricted diet in three generations of female rat fetuses. PLoS ONE 2019, 14, e0215471. [Google Scholar] [CrossRef] [PubMed]
  18. Camilleri, T.-L.; Piper, M.D.W.; Robker, R.L.; Dowling, D.K. Maternal and paternal sugar consumption interact to modify offspring life history and physiology. Funct. Ecol. 2022, 36, 1124–1136. [Google Scholar] [CrossRef]
  19. Mautz, B.S.; Lind, M.I.; Maklakov, A.A. Dietary restriction improves fitness of aging parents but reduces fitness of their offspring in Nematodes. J. Gerontol. A Biol. Sci. Med. Sci. 2020, 75, 843–848. [Google Scholar] [CrossRef] [Green Version]
  20. Ivimey-Cook, E.R.; Sales, K.; Carlsson, H.; Immler, S.; Chapman, T.; Maklakov, A.A. Transgenerational fitness effects of lifespan extension by dietary restriction in Caenorhabditis elegans. Proc. Biol. Sci. 2021, 288, 20210701. [Google Scholar] [CrossRef]
  21. Stanford, K.I.; Rasmussen, M.; Baer, L.A.; Lehnig, A.C.; Rowland, L.A.; White, J.D.; So, K.; De Sousa-Coelho, A.L.; Hirshman, M.F.; Patti, M.E.; et al. Paternal exercise improves glucose metabolism in adult offspring. Diabetes 2018, 67, 2530–2540. [Google Scholar] [CrossRef] [PubMed] [Green Version]
  22. Lee, J.-H.; Seo, W.; Lee, S.-H.; Lee, H.-Y.; Min, K.-J. Strain-specific effects of parental age on offspring in Drosophila melanogaster. Entomol. Res. 2019, 49, 187–202. [Google Scholar] [CrossRef]
  23. Dimofski, P.; Meyre, D.; Dreumont, N.; Leininger-Muller, B. Consequences of paternal nutrition on offspring health and disease. Nutrients 2021, 13, 2818. [Google Scholar] [CrossRef]
  24. Zajitschek, F.; Zajitschek, S.R.; Canton, C.; Georgolopoulos, G.; Friberg, U.; Maklakov, A.A. Evolution under dietary restriction increases male reproductive performance without survival cost. Proc. Biol. Sci. 2016, 283, 20152726. [Google Scholar] [CrossRef]
  25. Zajitschek, F.; Georgolopoulos, G.; Vourlou, A.; Ericsson, M.; Zajitschek, S.R.K.; Friberg, U.; Maklakov, A.A. Evolution Under dietary restriction decouples survival from fecundity in Drosophila melanogaster females. J. Gerontol. A Biol. Sci. Med. Sci. 2019, 74, 1542–1548. [Google Scholar] [CrossRef]
  26. Lewontin, R.C. The effects of population density and composition on viability in Drosophila melanogaster. Evolution 1955, 9, 27–41. [Google Scholar] [CrossRef]
  27. Good, T.P.; Tatar, M. Age-specific mortality and reproduction respond to adult dietary restriction in Drosophila melanogaster. J. Insect Physiol. 2001, 47, 1467–1473. [Google Scholar] [CrossRef] [PubMed]
  28. Min, K.J.; Tatar, M. Drosophila diet restriction in practice: Do flies consume fewer nutrients? Mech. Ageing Dev. 2006, 127, 93–96. [Google Scholar] [CrossRef] [PubMed]
  29. Kirkwood, T.B. Evolution of ageing. Nature 1977, 270, 301–304. [Google Scholar] [CrossRef]
  30. Cypser, J.R.; Johnson, T.E. Multiple stressors in Caenorhabditis elegans induce stress hormesis and extended longevity. J. Gerontol. A Biol. Sci. Med. Sci. 2002, 57, B109–B114. [Google Scholar] [CrossRef] [Green Version]
  31. Kapahi, P.; Boulton, M.E.; Kirkwood, T.B.L. Positive correlation between mammalian life span and cellular resistance to stress. Free. Radic. Biol. Med. 1999, 26, 495–500. [Google Scholar] [CrossRef] [PubMed]
  32. Skinner, M.K.; Anway, M.D.; Savenkova, M.I.; Gore, A.C.; Crews, D. Transgenerational epigenetic programming of the brain transcriptome and anxiety behavior. PLoS ONE 2008, 3, e3745. [Google Scholar] [CrossRef] [PubMed]
  33. Zizzari, Z.V.; van Straalen, N.M.; Ellers, J. Transgenerational effects of nutrition are different for sons and daughters. J. Evol. Biol. 2016, 29, 1317–1327. [Google Scholar] [CrossRef] [PubMed] [Green Version]
  34. Kanungo, M.S. Genes and Aging; Cambridge University Press: Cambridge, UK, 1994. [Google Scholar] [CrossRef]
  35. De Maio, A. Heat shock proteins: Facts, thoughts, and dreams. Shock 1999, 11, 1–12. [Google Scholar] [CrossRef]
  36. Dancso, B.; Spiro, Z.; Arslan, M.A.; Nguyen, M.T.; Papp, D.; Csermely, P.; Soti, C. The heat shock connection of metabolic stress and dietary restriction. Curr. Pharm. Biotechnol. 2010, 11, 139–145. [Google Scholar] [CrossRef] [PubMed] [Green Version]
  37. Norouzitallab, P.; Baruah, K.; Vandegehuchte, M.; Van Stappen, G.; Catania, F.; Vanden Bussche, J.; Vanhaecke, L.; Sorgeloos, P.; Bossier, P. Environmental heat stress induces epigenetic transgenerational inheritance of robustness in parthenogenetic Artemia model. FASEB J. 2014, 28, 3552–3563. [Google Scholar] [CrossRef] [PubMed]
  38. Gems, D.; Partridge, L. Stress-response hormesis and aging: “that which does not kill us makes us stronger”. Cell Metab. 2008, 7, 200–203. [Google Scholar] [CrossRef] [Green Version]
  39. Bird, A. DNA methylation patterns and epigenetic memory. Genes Dev. 2002, 16, 6–21. [Google Scholar] [CrossRef] [Green Version]
  40. Pinheiro, A.R.; Salvucci, I.D.; Aguila, M.B.; Mandarim-de-Lacerda, C.A. Protein restriction during gestation and/or lactation causes adverse transgenerational effects on biometry and glucose metabolism in F1 and F2 progenies of rats. Clin. Sci. 2008, 114, 381–392. [Google Scholar] [CrossRef] [Green Version]
  41. Strilbytska, O.; Velianyk, V.; Burdyliuk, N.; Yurkevych, I.S.; Vaiserman, A.; Storey, K.B.; Pospisilik, A.; Lushchak, O. Parental dietary protein-to-carbohydrate ratio affects offspring lifespan and metabolism in Drosophila. Comp. Biochem. Physiol. A Mol. Integr. Physiol. 2020, 241, 110622. [Google Scholar] [CrossRef]
  42. Strilbytska, O.M.; Stefanyshyn, N.P.; Semaniuk, U.V.; Lushchak, O.V. Yeast concentration in the diet defines Drosophila metabolism of both parental and offspring generations. Ukr. Biochem. J. 2021, 93, 119–129. [Google Scholar] [CrossRef]
  43. Valtonen, T.M.; Kangassalo, K.; Polkki, M.; Rantala, M.J. Transgenerational effects of parental larval diet on offspring development time, adult body size and pathogen resistance in Drosophila melanogaster. PLoS ONE 2012, 7, e31611. [Google Scholar] [CrossRef] [PubMed] [Green Version]
  44. Matzkin, L.M.; Johnson, S.; Paight, C.; Markow, T.A. Preadult parental diet affects offspring development and metabolism in Drosophila melanogaster. PLoS ONE 2013, 8, e59530. [Google Scholar] [CrossRef] [PubMed]
  45. Roff, D.A. Evolution of Life Histories: Theory and Analysis; Springer Science & Business Media: Berlin, Germany, 1992. [Google Scholar]
  46. Vijendravarma, R.K.; Narasimha, S.; Kawecki, T.J. Effects of parental larval diet on egg size and offspring traits in Drosophila. Biol. Lett. 2010, 6, 238–241. [Google Scholar] [CrossRef] [PubMed] [Green Version]
  47. Roff, D.A. Life History Evolution; Oxford University Press: Oxford, UK, 2001; pp. 1–7. [Google Scholar]
  48. Giraudo, S.Q.; Della-Fera, M.A.; Proctor, L.; Wickwire, K.; Ambati, S.; Baile, C.A. Maternal high fat feeding and gestational dietary restriction: Effects on offspring body weight, food intake and hypothalamic gene expression over three generations in mice. Pharmacol. Biochem. Behav. 2010, 97, 121–129. [Google Scholar] [CrossRef]
  49. Lagisz, M.; Blair, H.; Kenyon, P.; Uller, T.; Raubenheimer, D.; Nakagawa, S. Transgenerational effects of caloric restriction on appetite: A meta-analysis. Obes. Rev. 2014, 15, 294–309. [Google Scholar] [CrossRef]
  50. Prasad, N.G.; Shakarad, M.; Rajamani, M.; Joshi, A. Interaction between the effects of maternal and larval levels of nutrition on pre-adult survival in Drosophila melanogaster. Evol. Ecol. Res. 2003, 5, 903–911. [Google Scholar]
  51. Wright, T.M.; Fone, K.C.; Langley-Evans, S.C.; Voigt, J.P. Exposure to maternal consumption of cafeteria diet during the lactation period programmes feeding behaviour in the rat. Int. J. Dev. Neurosci. 2011, 29, 785–793. [Google Scholar] [CrossRef]
  52. Silva-Filha, E.; Costa, T.; Farias, B.; Santos, P.; Santana, M.; Macedo, F.; Santos, R.; Santana-Filho, V. Transgenerational effects on the feeding behavior of the offspring. FASEB J. 2015, 29, LB243. [Google Scholar] [CrossRef]
  53. Chandegra, B.; Tang, J.L.Y.; Chi, H.; Alic, N. Sexually dimorphic effects of dietary sugar on lifespan, feeding and starvation resistance in Drosophila. Aging 2017, 9, 2521–2528. [Google Scholar] [CrossRef] [Green Version]
  54. Magwere, T.; Chapman, T.; Partridge, L. Sex differences in the effect of dietary restriction on life span and mortality rates in female and male Drosophila melanogaster. J. Gerontol. A Biol. Sci. Med. Sci. 2004, 59, 3–9. [Google Scholar] [CrossRef] [PubMed] [Green Version]
  55. Mair, W.; Piper, M.D.W.; Partridge, L. Calories do not explain extension of life span by dietary restriction in Drosophila. PLoS Biol. 2005, 3, e223. [Google Scholar] [CrossRef] [PubMed] [Green Version]
  56. Lushchak, O.; Strilbytska, O.; Storey, K.B. Gender-specific effects of pro-longevity interventions in Drosophila. Mech. Ageing Dev. 2023, 209, 111754. [Google Scholar] [CrossRef]
  57. Camus, M.F.; Piper, M.D.; Reuter, M. Sex-specific transcriptomic responses to changes in the nutritional environment. Elife 2019, 8, 1–24. [Google Scholar] [CrossRef] [PubMed]
  58. Pletcher, S.D.; Libert, S.; Skorupa, D. Flies and their golden apples: The effect of dietary restriction on Drosophila aging and age-dependent gene expression. Ageing Res. Rev. 2005, 4, 451–480. [Google Scholar] [CrossRef]
  59. Kirkpatrick, M.; Lande, R. The Evolution of Maternal Characters. Evolution 1989, 43, 485–503. [Google Scholar] [CrossRef]
Figure 1. Schematic outline for methods to treat the medium for parents (F0) and offspring (F1). Newly eclosed flies for the parental generation were collected within 12 h and allocated to vials containing full diet (FD) or restricted diet (DR) medium. After a 7–10 day feeding period, parental flies were allocated to obtain eggs (F1) in the standard CSY medium. The number of parent flies used was 5 to 10 pairs in a full-fed diet group and 10 to 15 pairs in a restricted-fed diet.
Nutrients 15 01273 g001
Figure 2. Effects of dietary restriction on lifespan and fecundity of parental (F0) flies. (a,b) Lifespan (a) or mortality rate (b) of F0 males (left, F0 ♂) and F0 females (right, F0 ♀) fed on a CSY medium with 16%, 12%, 4%, or 2% yeast extract. *** p < 0.0001; Log-rank test vs. 16%. (c) Number of egg production per day for 4 days (left), and the average number of eggs for 4 days (right) of F0 females fed on a full diet (16%) or restricted diet (4%). The error bars correspond to the standard error of the mean (SEM) among replicates (n = 20). The lifespan of F0 flies is presented with black (16%), dark gray (12%), gray (4%), or white (2%) circles. The mortality rate and egg production per day of F0 flies are presented with black (16%) or white (4%) circles or boxes. *** p < 0.0001; Student’s t-test (one-, two-day, and the average number of eggs) or Wilcoxon rank sum test (three- and four-day).
Nutrients 15 01273 g002
Figure 3. Effects of parental (F0) DR on offspring (F1) lifespan in D. melanogaster. (a,b) Lifespan (a) and mortality rate (b) of F1 male (left, F1 ♂) and female (right, F1 ♀) from parents exposed to a full diet (FD) or restricted diet (DR) with four combinations of flies: FD male and FD female (♂FD × ♀FD), DR male and FD female (♂DR × ♀FD), FD male and DR female (♂FD × ♀DR), and DR male and DR female (♂DR × ♀DR). Lifespan and mortality rate of F1 flies is presented with black (♂FD × ♀FD), circles split in half (♂DR × ♀FD or ♂FD × ♀DR), or white (♂DR × ♀DR) circles. *** p < 0.0001; Log-rank test vs. ♂FD × ♀FD. (c,d) Lifespan (c) and mortality rate (d) of F1 males (left, F1 ♂) and females (right, F1 ♀) from parents exposed to a full diet (FD) or restricted diet (DR). The triangles indicate the data of F1 flies analyzed based on the father’s diet, and the circles indicate the data of F1 flies analyzed based on the mother’s diet. The black indicates the data of F1 flies from parents with FD, and the white indicates the data of F1 flies from parents with DR. *** p < 0.0001; Log-rank test vs. full diet parent (FatherFD or MotherFD).
Nutrients 15 01273 g003
Figure 4. Effects of parental (F0) DR on the resistance to environmental stressors in offspring (F1) male (left, F1 ♂) and female (right, F1 ♀). (a) Heat shock stress resistance of F1 male (left, F1 ♂) and female (right, F1 ♀). (b) Oxidative stress resistance of F1 male (left, F1 ♂) and female (right, F1 ♀). (c) Starvation resistance of F1 male (left, F1 ♂) and female (right, F1 ♀). The black circles indicate the lifespan of F1 flies from parents with FD, and the white circles indicate the lifespan of F1 flies from parents with DR. * p < 0.05; ** p < 0.005; *** p < 0.0001; Log-rank test (n = 150).
Nutrients 15 01273 g004
Figure 5. Effects of parental (F0) DR on development, fecundity, feeding behavior, and body weight of the offspring (F1) flies. (a) Developmental viability from egg to pupa, or from pupa to adult (left) and developmental timing to emergence (right) of F1 flies (n = 150). (b,c) Fecundity (b) and feeding rate (c) of F1 flies. The error bars correspond to the standard error of the mean (SEM) among replicates. *** p < 0.0001; Student’s t-test (Fecundity n = 20; feeding rate n = 18). (d) Adult body weight of one- or seven-day-old F1 male (left, F1 ♂) and female (right, F1 ♀). The error bars correspond to the standard error of the mean (SEM) among replicates. * p < 0.05; Student’s t-test (one-, seven-day-old F1 male, and seven-day-old F1 female; n = 150) or Wilcoxon rank sum test (one-day-old F1 female; n = 150). The black boxes indicate the lifespan of F1 flies from parents with FD, and the white boxes indicate the lifespan of F1 flies from parents with DR.
Nutrients 15 01273 g005
Table 1. Lifespan and mortality of parents (F0) fed a 16%, 12%, 4%, or 2% yeast diet.
SexYeast (%)nMean-LifespanChangeMedian-LifespanChangeMax. Lifespan
(75% Failures)
Changeχ2p-Value
Male1625250.89±0.57 51 58
1225853.64± 0.535.4%557.8%580.0%13.50370.0002
422853.21± 0.664.6%557.8%603.4%19.0097<0.0001
223853.05± 0.784.2%557.8%626.9%28.8639<0.0001
Female1624947.66±0.91 51 58
1226960.41± 1.0126.8%6425.5%7122.4%105.4658<0.0001
426972.36± 1.3951.8%7649.0%9156.9%225.8365<0.0001
227566.73± 1.3640.0%7139.2%8343.1%175.0049<0.0001
Table 2. Lifespan and mortality of male and female offspring (F1) from parents (F0) fed a full or restricted diet with four combinations.
SexGroupnMean-LifespanChangeMedian-LifespanChangeMax. Lifespan
(75% Failures)
Changeχ2p-Value
MaleFD × ♀FD26855.87±0.89 60 66
DR × ♀FD27458.23±0.874.2%623.3%660.0%3.67470.0552
FD × ♀DR26658.80±0.865.3%600.0%660.0%3.63410.0566
DR × ♀DR26463.42±0.8813.5%6610.0%7412.1%43.3299<0.0001
FemaleFD × ♀FD26756.04±0.78 60 66
DR × ♀FD27860.50±0.748.0%623.3%706.1%24.138<0.0001
FD × ♀DR28365.49±0.9216.9%6813.3%7615.2%109.4231<0.0001
DR × ♀DR28063.20±1.0312.8%6813.3%7615.2%92.7941<0.0001
FD, Full diet; DR, restricted diet; FD male and FD female (♂FD × ♀FD), DR male and FD female (♂DR × ♀FD), FD male and DR female (♂FD × ♀DR), and DR male and DR female (♂DR × ♀DR).
Table 3. Lifespan and mortality of male and female offspring (F1) from parents (F0) fed a full or restricted diet.
SexGroupnMean-LifespanChangeMedian-LifespanChangeMax. Lifespan
(75% Failures)
Changeχ2p-Value
MaleFatherFD53457.33±0.62 60 66
FatherDR53860.78±0.636.0%623.3%706.1%24.2517<0.0001
MotherFD54257.06±0.62 60 66
MotherDR53061.10±0.627.1%623.3%706.1%25.3409<0.0001
FemaleFatherFD55060.90±0.64 62 70
FatherDR55861.85±0.641.6%666.5%722.9%0.77620.3783
MotherFD54558.31±0.55 60 66
MotherDR56364.35±0.6910.4%6813.3%7615.2%137.008<0.0001
FD, Full diet; DR, restricted diet.
Disclaimer/Publisher’s Note: The statements, opinions and data contained in all publications are solely those of the individual author(s) and contributor(s) and not of MDPI and/or the editor(s). MDPI and/or the editor(s) disclaim responsibility for any injury to people or property resulting from any ideas, methods, instructions or products referred to in the content.

