Communication

Using Capillary Whole Blood to Quantitatively Measure Ferritin: A Validation Trial of a Point-of-Care System

by
Joanna L. Fiddler
1,2,*,
Michael I. McBurney
3,4 and
Jere D. Haas
1
1
Division of Nutritional Sciences, Cornell University, Ithaca, NY 14853, USA
2
Department of Food, Nutrition, and Packaging Sciences, Clemson University, Clemson, SC 29634, USA
3
Department of Human Health & Nutritional Sciences, University of Guelph, Guelph, ON N1G 2W1, Canada
4
Friedman School of Nutrition Policy and Science, Tufts University, Boston, MA 02111, USA
*
Author to whom correspondence should be addressed.
Nutrients 2023, 15(6), 1305; https://doi.org/10.3390/nu15061305
Submission received: 15 February 2023 / Revised: 28 February 2023 / Accepted: 2 March 2023 / Published: 7 March 2023
(This article belongs to the Section Micronutrients and Human Health)

Abstract

:
Iron deficiency is a public health problem with devastating health, developmental and behavioral effects which often exacerbated due to affordability and access to screening and diagnosis. Using IronScan™ a portable, point-of-care diagnostic system capable of quantitatively measuring ferritin in blood, we validated IronScan™ ferritin measurements using whole blood and serum with a lab-based, regulator-approved analytical device for measuring ferritin in venous serum. Capillary (finger stick) and venous whole blood samples were obtained from 44 male and female volunteers. Venous serum (vSer) ferritin concentrations were measured on Immulite 2000 Xpi (gold standard). Capillary whole blood (cWB), venous whole blood (vWB), and vSer ferritin levels were measured by IronScan™. cWB ferritin concentrations from IronScan™ were significantly correlated (R2 = 0.86) with vSer measured with the FDA-approved Immulite system. The results from the multiple regression analysis indicate that 10% of the variability was due to the method of blood collection (venous vs. capillary) and 6% was due to the form of blood analysis (whole blood vs. serum). The sensitivity of diagnosing iron deficiency using the WHO cutoff of <30 ng/mL is 90%, with a specificity of 96%. In conclusion, IronScan™ is a rapid viable option for measuring ferritin as a point-of-care system.

1. Introduction

Iron deficiency is the most common cause of anemia. Anemia is characterized by a reduced number of red blood cells often accompanied by diminished hemoglobin levels or altered RBC morphology, and is associated with increased risks of maternal and child mortality and reduced cognitive and physical performance [1,2,3,4,5]. In 2010, anemia accounted for 68.4 million years of life lived with disability (YLD) globally [6]. The Global Burden of Diseases, Injuries, and Risk Factors Study (GBD) quantified incidence, prevalence, and YLDs for 354 non-fatal health outcomes, 22 Level 2 and 167 Level 3 causes. Anemia was the leading impairment of YLD (for both sexes) and ranked as the 4th leading Level 2 and the leading Level 3 cause in terms of age-standardized YLD rates globally for females in 2017 [7]. The etiology of anemia is multifaceted; recent meta-analyses estimate that 50% of anemia cases can be attributed to iron deficiency [8]. Therefore, accurate determination of iron status is crucial for diagnostic and screening purposes in clinical settings and to guide public health interventions at the population level [9]. The WHO recommends blood ferritin concentration as a good marker of iron stores in apparently healthy individuals and in populations, with adjustment for α-1 acid glycoprotein (AGP) and/or C-reactive protein (CRP) for individuals with infection or inflammation [9]. Using validated biomarkers such as blood ferritin to objectively assess an individual’s iron status, it is possible to personalize dietary guidance and management of those diagnosed with iron deficiency. As an example, screening the ferritin levels of blood donors and informing those who had low ferritin results led donors to see a health care provider, increase their iron consumption, and return to donate 6 months later when their iron stores were normal; this resulted in a modest increase in the ferritin levels of returning donors [10]. Females at high risk, e.g., during menstruation, pregnancy, and lactation [11], can be tested to confirm that their iron status is optimal or being normalized by following therapeutic instruction. At the population level, the implementation of representative sampling is a promising strategy to identify and monitor groups at risk, e.g., iron deficiency in young children (1–3 years) [12,13]. The use of validated nutritional biomarkers, e.g., blood ferritin, can provide an objective assessment of the iron status of populations to guide resource prioritization and public health action, whether it be nutritional interventions or regulatory action. Finally, ongoing representative surveys are the best way to assess the efficacy of public health actions.
The majority of locations in which ID is prevalent do not have access to or the clinical capability to measure these biomarkers [14]; therefore, a portable, point-of-care, diagnostic device using capillary whole blood to measure ferritin could facilitate screening, diagnosis, and the implementation and monitoring of public health interventions. The methodology employed in this report is similar to other lateral flow immunoassay-based point-of-care diagnostic systems for quantifying human analyte concentrations [15,16]. This paper validates the performance of IronScan™, a proprietary point-of-care lateral flow assay designed to measure ferritin in capillary whole blood that was provided by VitaMe Technologies, Inc. (doing business as VitaScan).

2. Materials and Methods
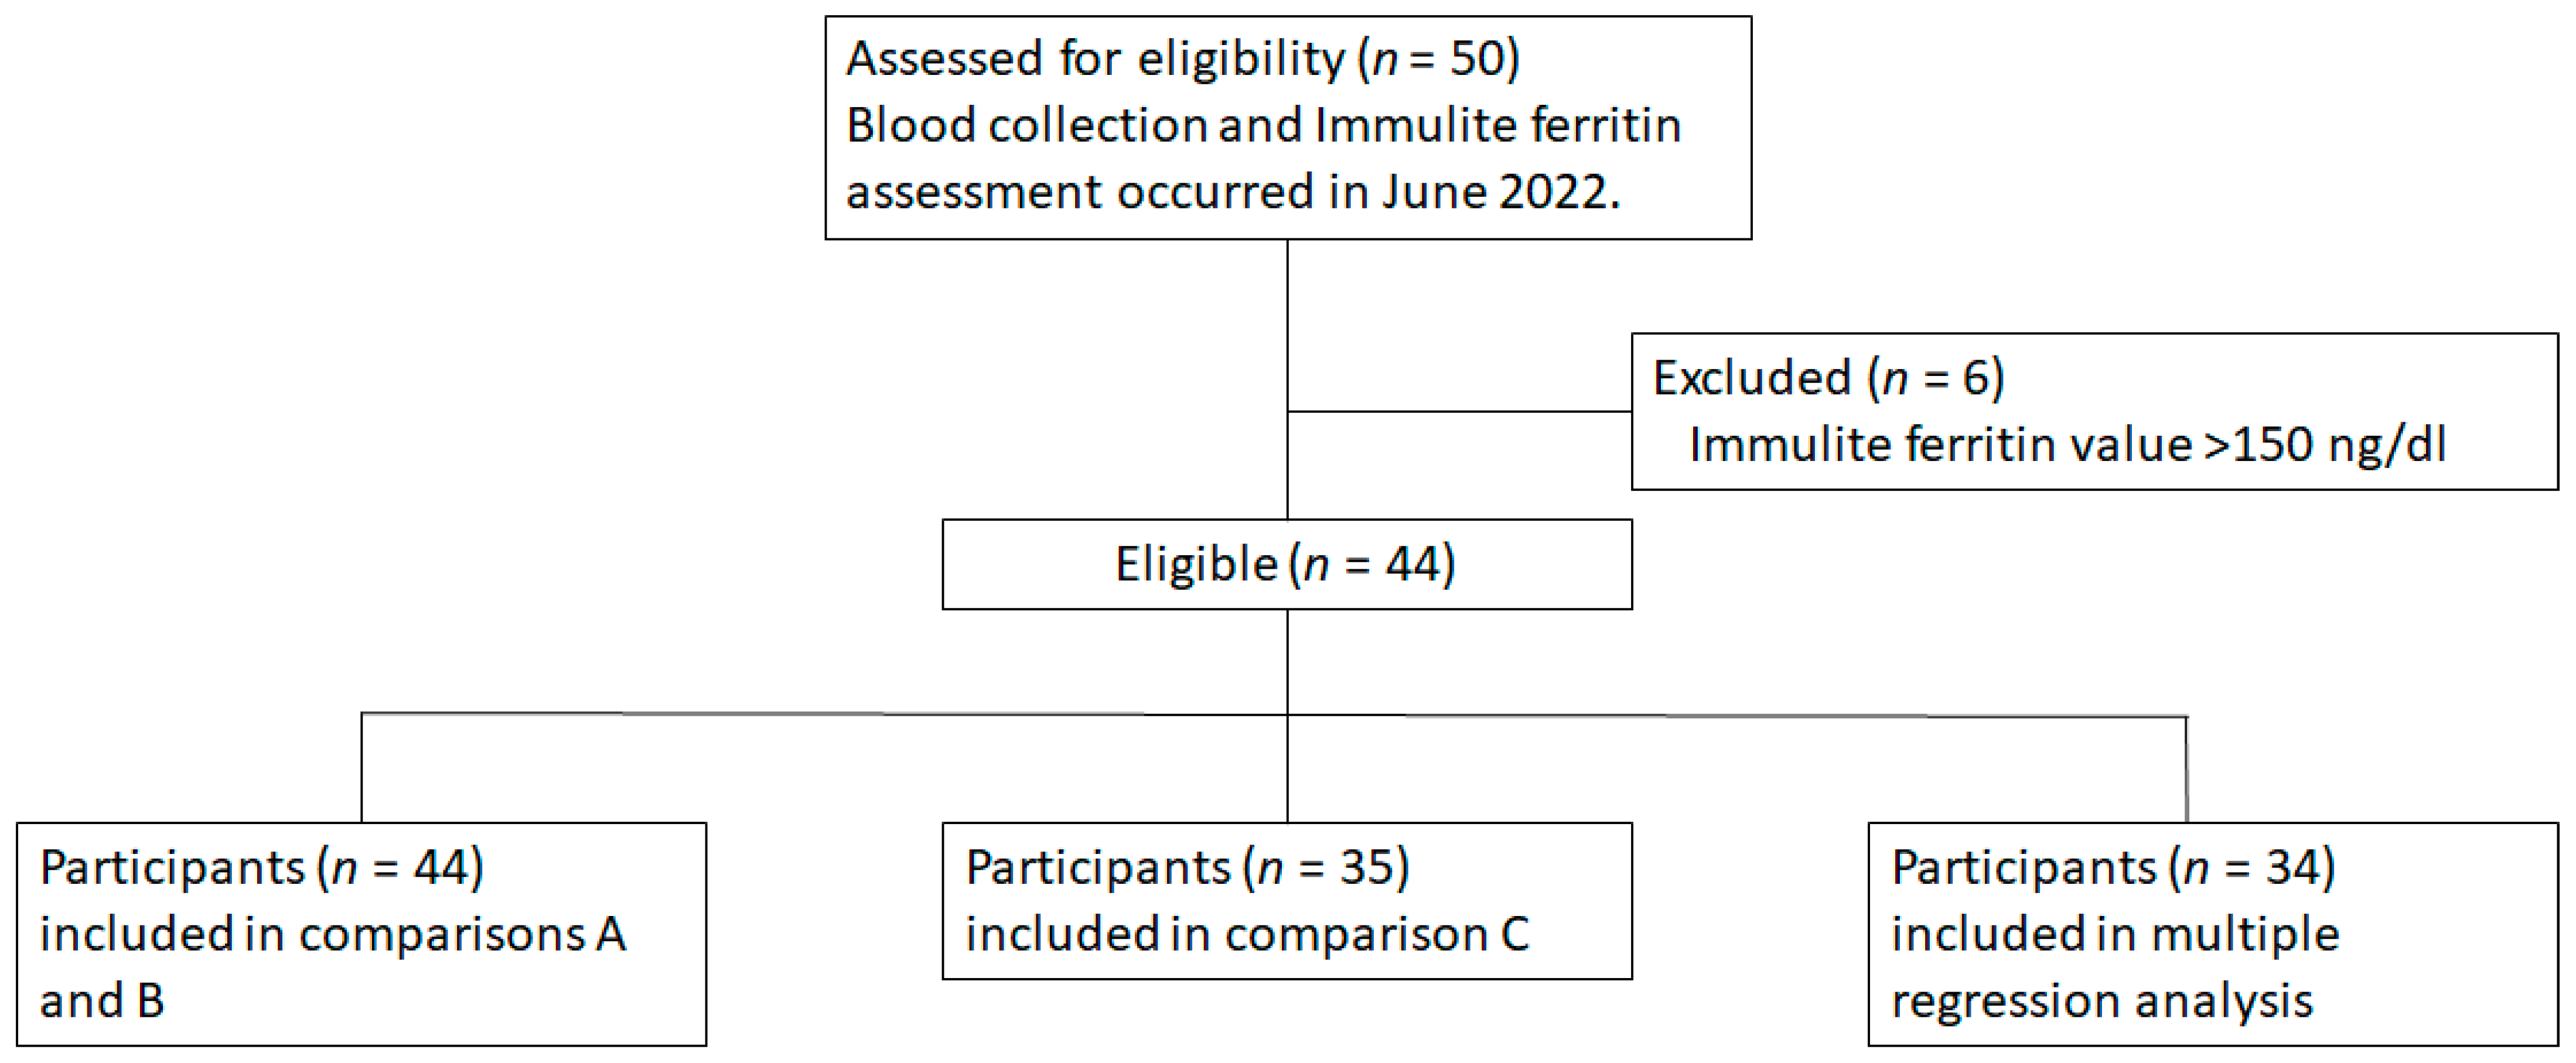
IronScan™ validation was completed using different blood samples (whole blood, serum) and at different sample sites (capillary, venous) with venous serum (vSer) measurements using a lab-based Immulite 2000 Xpi analyzer. VitaScan™ (Ithaca, NY, USA) provided calibrated cube readers (n = 6) manufactured by ChemBio (Berlin, Germany) and lateral flow immunoassay cartridges to measure ferritin in a proprietary system, i.e., IronScan™. The validation trial was conducted 27–29 June 2022 in the Human Metabolic Research Unit of the Division of Nutritional Sciences at Cornell University after obtaining approval from the Cornell University Institutional Review Board. Forty-four volunteers (37 female, 7 male) were recruited from a convenience sample of students, faculty, staff, and the community of Ithaca via an email advertisement (Figure 1). All participants provided written informed consent and completed a health history questionnaire prior to participation. Individuals < 18-year-old were excluded from the study. A trained phlebotomist collected finger stick whole blood (cWB) and venous whole blood (vWB) by venipuncture (~5 mL). cWB and vWB were immediately analyzed by IronScan™. vWB was centrifuged to obtain serum (vSer) and was analyzed by Immulite 2000 Xpi (Siemens Medical Solutions USA, Inc., Malvern, PA, USA) and IronScan™ on the collection day. All volunteers were nominally healthy. Two subjects were anemic based on hemoglobin (Hb) analysis from a Beckman Coulter Counter (Hb < 12.0 g/dL).
The objective of the study was to compare a portable, point-of-care, diagnostic system (IronScan™) with a lab-based, regulator-approved analytical device for the measurement of blood ferritin in venous serum, i.e., a gold standard system, Immulite 2000 Xpi [17]. IronScan™ was designed to identify iron deficiency with highest sensitivity at low- to mid-range ferritin values; therefore, samples with Immulite ferritin values > 150 ng/mL were excluded from analyses (Figure 1). All IronScan™ measurements were conducted in the Human Metabolic Research Unit, and all Immulite measurements were conducted in the Nutritional Chemistry Laboratory of the Division of Nutritional Sciences at Cornell University.
Three research questions were to be answered:
A.
How do the diagnostic devices compare under expected usage?
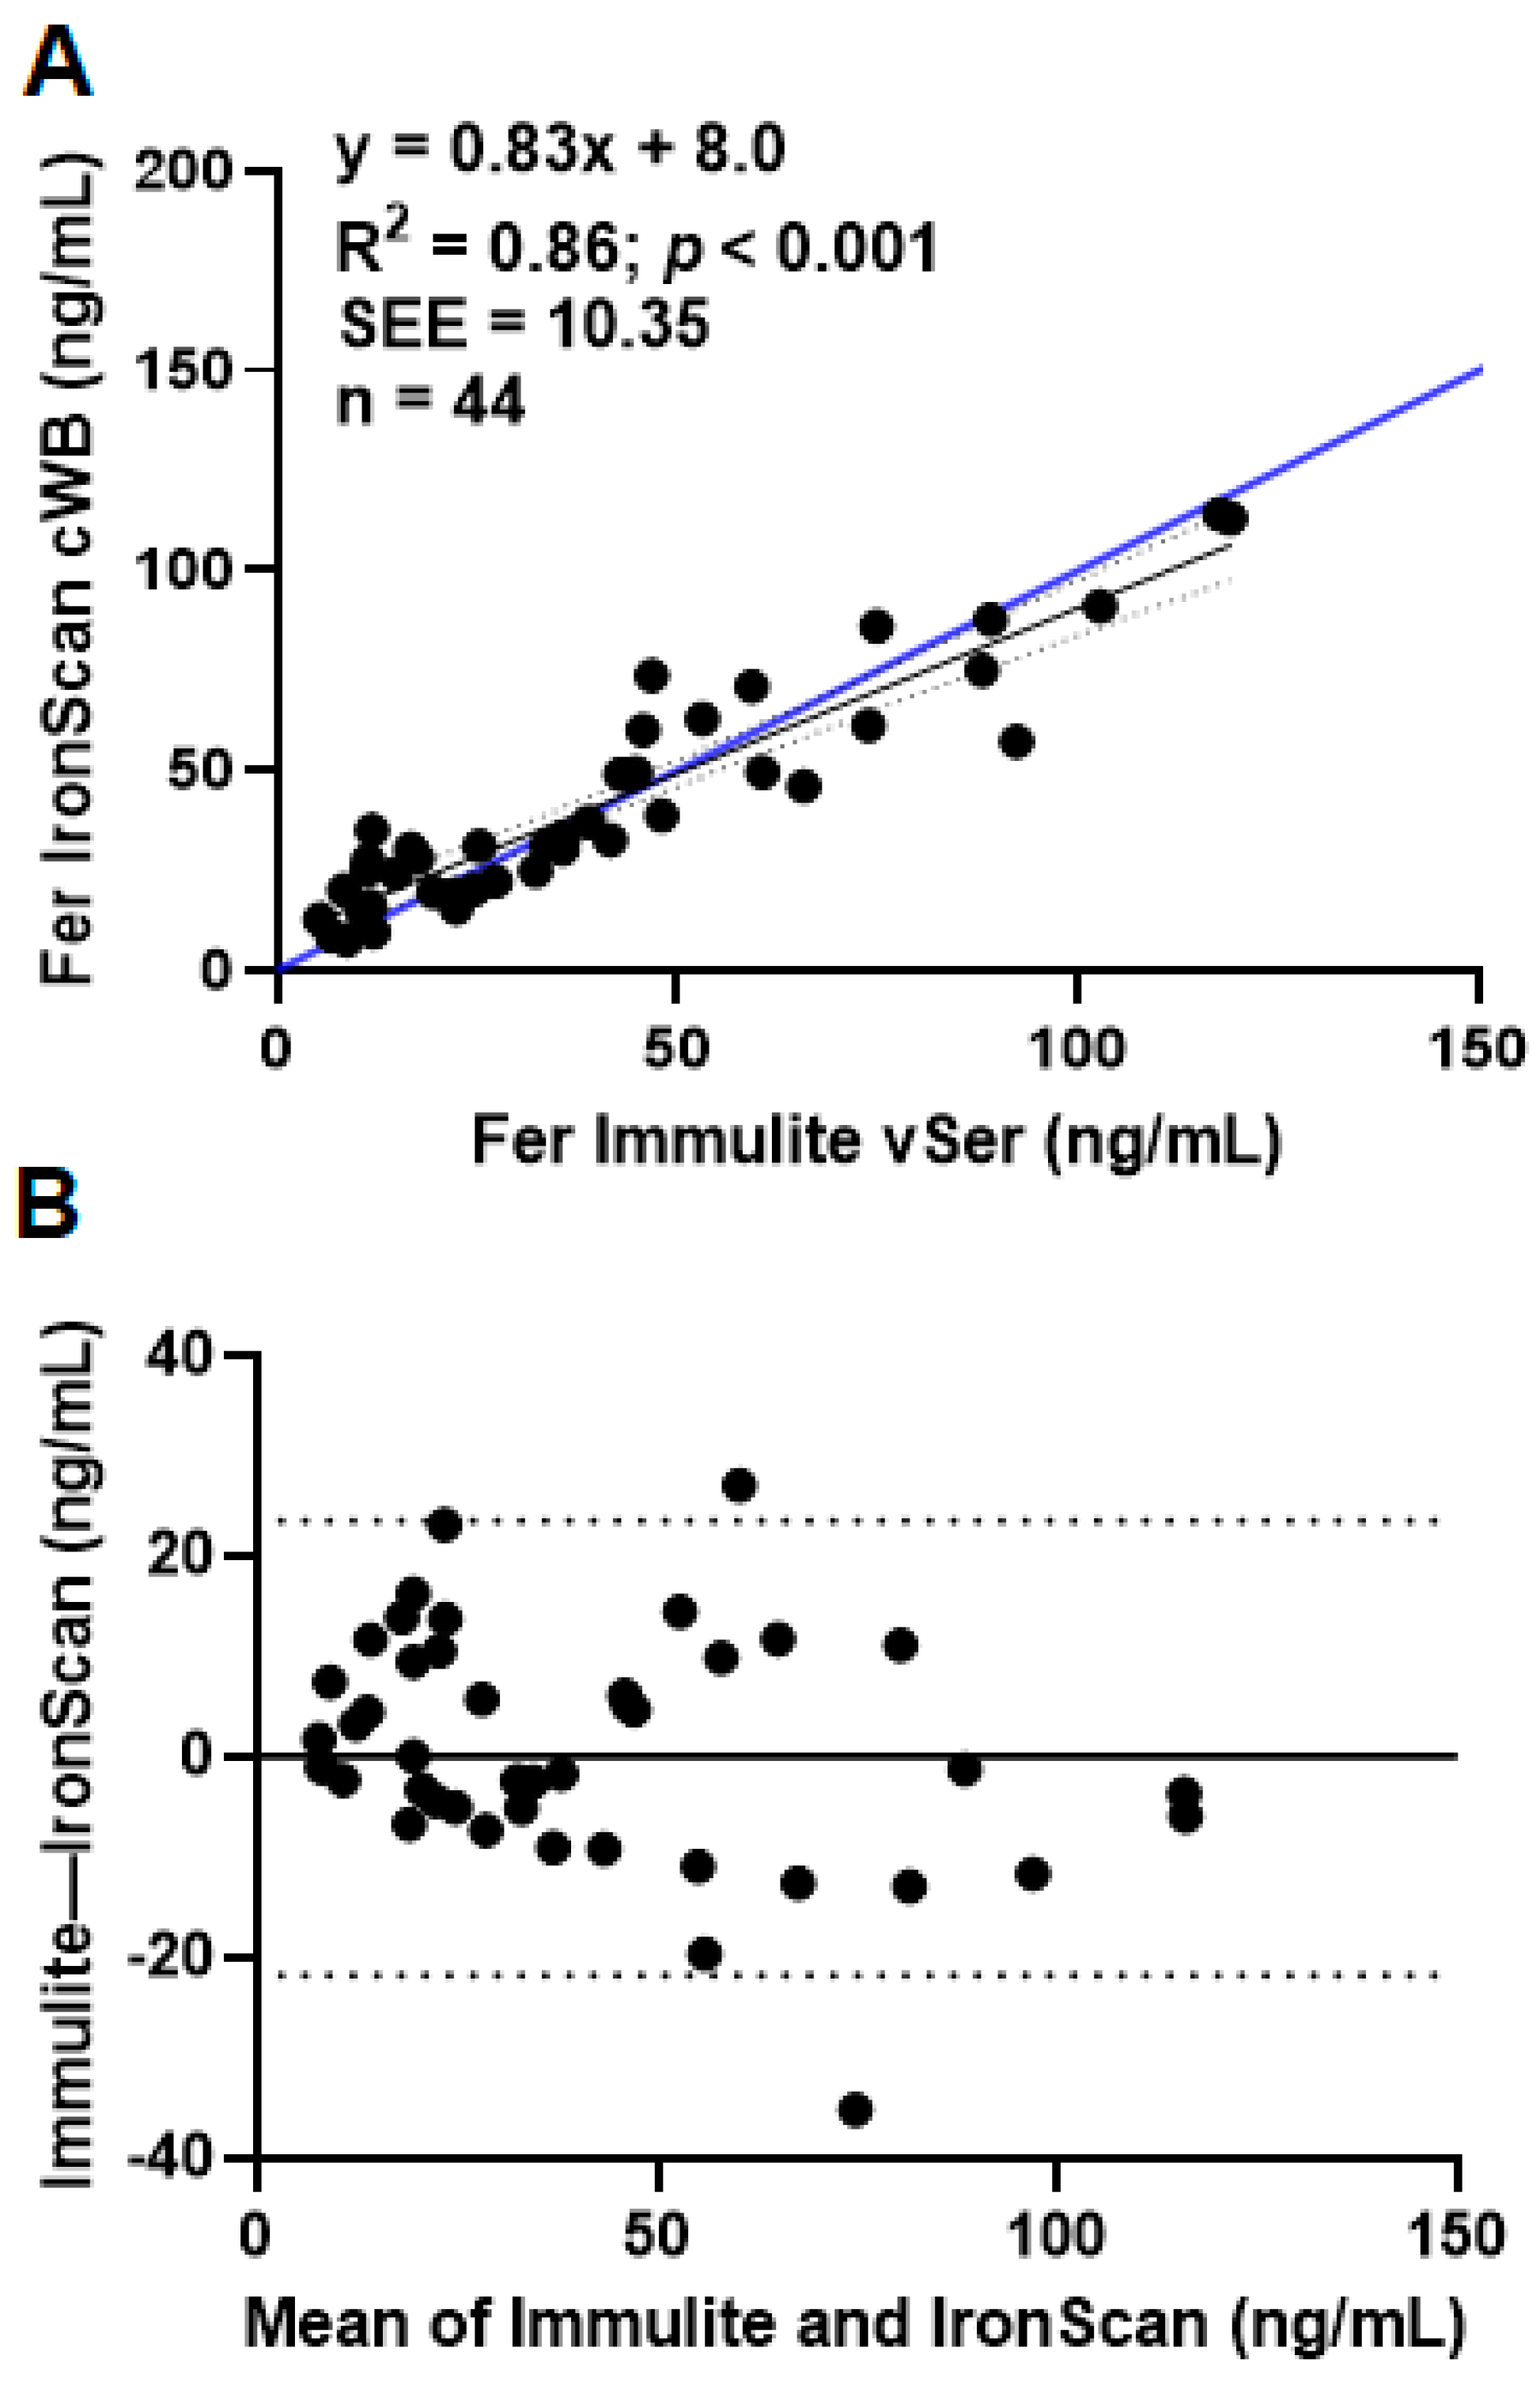
  • IronScan™ cWB blood vs. gold standard vSer in Immulite
B.
How do the diagnostic devices compare when using the same collection site (venous)?
  • IronScan™ vWB whole blood vs. gold standard vSer in Immulite
C.
How do the diagnostic devices compare when using the same collection site and form of blood (vSer)?
  • IronScan™ vSer vs. gold standard vSer in Immulite
All data analyses were completed with JMP® Pro statistical software version 15 (SAS Institute Inc., Cary, NC, USA) or Graphpad Prism 9.5.0. Correlation analysis, R2 values, and a Bland–Altman plot were calculated to compare the performance of the IronScan™ with the laboratory standard measurements made with the Immulite 2000 Xpi. Multiple regression analysis was used to compare all IronScan™ comparisons to the Immulite 2000 Xpi. Sensitivity and specificity analyses were conducted using the WHO cutoff for ferritin (<30 ng/dL) and the clinical cutoff for ferritin (<12 ng/dL), using methods previously described and adapted for our study [18,19]. Briefly, sensitivity is the probability that the IronScan™ system will diagnose iron deficiency among those with iron deficiency as measured by the Immulite 2000 Xpi (true positives). Specificity is the fraction of those without iron deficiency (true negatives as measured by the Immulite 2000 Xpi) that test as non-iron deficient on the IronScan™ system.

3. Results

3.1. Subject Characteristics

The subjects were healthy male and female adults (Table 1). The results of the analysis follow the order of the questions presented above.

3.1.1. Comparison A: Diagnostic Device Comparison under Expected Usage

Mean ferritin values analyzed across devices and blood sampling methods (Table 2) were similar for the primary comparisons (Immulite vSer versus IronScan™ cWB). Ferritin measured by IronScan™ in venous whole blood (vWB) is 38% higher than the mean values from capillary whole blood (cWB; the differences were not statistically significant by paired t-test (p = 0.66)). Ferritin cWB ferritin concentrations measured by IronScan™ were significantly correlated (R2 = 0.86) with the Immulite system vSer ferritin concentrations (Figure 2A). A Bland–Altman analysis revealed only two values fell outside the 95% confidence interval (Figure 2B), and the greatest deviation for the regression is for the values above 60 ng/mL.

3.1.2. Comparison B: IronScan™ versus Immulite Using Whole Blood or Serum from the Same Venous Collection Site

To determine whether sampling blood from capillary versus venous collection sites results in bias from the previous analysis (Figure 2), we used venous blood to determine ferritin values from both the Immulite and IronScan™. Ferritin values measured in vWB or vSer samples by IronScan™ and Immulite, respectively, were highly and linearly correlated (R2 = 0.86, Figure 3). The reduced slope is attributed to the IronScan™ overestimation of ferritin at higher values (<60 ng/mL).

3.1.3. Comparison C: IronScan™ versus Immulite Using Serum Obtained from the Same Venous Collection Site

To test the effect of the medium of blood used in the original analysis (Figure 2), we compared the Immulite versus IronScan™ using only serum obtained from a blood venous sample for a subset of 35 subjects (Figure 1). When ferritin concentrations were measured for both devices using the same sample site and medium (vSer), the relationship between devices fell along the line of unity and had an R2 = 0.94, and had the narrowest confidence intervals (0.91–1.10) (Figure 4).

3.1.4. Multiple Regression Analysis of All IronScan™ Comparisons to Immulite 2000 Xpi

To test for the combined contributions of the type of blood sampling (comparison B) and the medium of blood analyses (comparison C) to the relationship of the prescribed analysis (comparison A), we performed a multiple regression analysis on a subset of the sample (n = 35; Figure 1) that had ferritin measured across devices and all blood sampling methods (comparisons A, B, and C), with Immulite sVer as the dependent variable. The R2 = 0.85 was estimated for the bivariate comparison of IronScan™ cWB versus Immulite vSer, while the addition of IronScan™ vSer raises the R2 by 10% to 0.95. Lastly, the addition of IronScan™ vWB increases the R2 above IronScan™ vSer alone by 6% to 0.91.

3.1.5. Identification of Iron Deficiency Using the WHO or Clinical Cutoffs

The clinical purpose of blood ferritin measurements is to assess iron stores in the diagnosis of iron deficiency or iron deficiency anemia. Depending upon the cutoff (clinical or WHO), 22–46% of volunteers were classified as iron deficient using the gold standard, Immulite vSer (Table 3; Supplemental Table S1). At the clinical cutoff of 12 ng/mL, the IronScan™ sensitivity and specificity were 33% and 100%, respectively. At the WHO cutoff of 30 ng/mL, the IronScan™ sensitivity increased to 85%, and specificity remained high at 96%.

4. Discussion

Iron deficiency affects nearly 30% of the world’s population [8], and the WHO recommends ferritin measurements for diagnostic and screening purposes as well as to assess and monitor the impact of iron-related interventions [9]. Since venipuncture is required to obtain ~5 mL of serum, a phlebotomist is needed for venous serum (vSer) ferritin determinations. Venipuncture samples must be processed and typically transported to a clinical laboratory using specific labeling and handling requirements, i.e., a continuous cold chain, biological hazard with a regulatory-approved, bench-top ferritin analytical device. The process could be simplified with point-of-care devices capable of measuring ferritin in a very small sample of capillary blood. Furthermore, the economic impact of a point-of-care device would reduce patient costs. As a standard lateral flow assay, the IronScan™ system is estimated to sell at a commercial level for approximately USD 100 and at USD 1 per test.
This study validates IronScan™ as a point-of-care diagnostic device for measuring ferritin concentrations in whole blood and serum. IronScan™ has a wide linear range, with values outside this range reported as <5 or >150 ng/mL [15]. We established the utility and validity of using IronScan™ with cWB (finger stick) to diagnose iron deficiency (Table 3) with a small sample size represented mostly by women of reproductive age who are at greater risk for iron deficiency. Fewer than 5% of samples fall outside the 95% confidence interval (Figure 2B) compared to the gold standard method (Immulite 2000 Xpi), and these outliers were observed with cWB ferritin concentrations >60 ng/mL (Figure 2B), i.e., ferritin concentrations well outside the upper range for diagnosing iron deficiency in which false positives would be observed. The disparity between ferritin values in capillary versus venous blood samples (Table 2) is known, constant, and linear, within the range of 0 to 200 ng/mL [20]. The correlation between ferritin measurements remained high (R2 = 0.86) when venous blood was analyzed with both diagnostic devices (t 3), providing evidence that when a phlebotomist collects blood samples by venipuncture, IronScan™ could be used onsite to omit the transportation of biological samples under refrigeration to a remote laboratory for ferritin analysis. A high correlation (R2 = 0.94) along the line of unity was observed when venous blood provided serum for both devices (Figure 4). Since centrifuging whole blood to obtain serum is relatively straightforward, onsite use of IronScan™ to measure ferritin concentrations in venous serum samples would eliminate the need to transport serum samples to a remote clinical laboratory while still requiring trained personnel to take human blood. Furthermore, the identification of iron deficiency with IronScan™ using the WHO cutoff of 30 ng/mL yielded high sensitivity and specificity (Table 3); the sensitivity increased with the higher cutoff without compromising specificity, suggesting low misclassification of iron deficiency. The sensitivity of identifying iron deficiency using the clinical cutoff of 12 ng/mL was low (Table 2); a larger sample size may improve the sensitivity of IronScan™ using the clinical cutoff. There are many applications for a point-of-care device capable of measuring ferritin concentrations. Maternal iron status in pregnancy is associated with the iron status of the child at birth and to a lesser extent with the child’s neurodevelopment [21]. Routine Hb measurement is generally recommended at each trimester of pregnancy, but hemodilution is a confounder [22]. A ferritin test more accurately predicts iron status; however, a retrospective cohort population-based study in Ontario, Canada found that only <59.4% of pregnant women had their ferritin levels measured, and that the odds of a ferritin test being administered were negatively associated with annual household income [11]. Socioeconomic factors should not be a barrier to iron screening.
With respect to the screening of children 6–18 months of age, it is predicted that both universal and targeted (negative ferritin, Hb and CRP) screening programs in Ontario, Canada would be more cost-effective than no screening, based on willingness-to-pay thresholds of $50,000 and $100,000, per QALY [13]. Estimates of direct and indirect costs included laboratory costs (services, administration, specimen collection fees) and parent costs (salary loss while taking child for testing and travel expenses), which would be eliminated or reduced with point-of-care testing.
Among blood donors, female sex and intensity of screening are major risk factors for iron deficiency [23,24,25,26]. Ferritin screening of blood donors could help maintain adequacy of blood supply by reducing hemoglobin (Hb) deferrals that result in lower return rates and donation frequency [27]. In short, point-of-care testing could help reduce false negatives in screening and help maintain blood banks.

5. Conclusions

Ferritin measurements from cWB, vWB, and vSer using IronScan™ when ferritin concentrations are <150 ng/mL are linearly correlated with low misclassification of iron deficiency relative to using ‘approved’ venous blood samples (vSer) and a lab-based diagnostic device (Immulite 2000 Xpi). We conclude that (1) blood ferritin determinations below 150 ng/mL and the risk of a false iron deficiency diagnosis when ferritin < 30 ng/mL are similar between Immulite and IronScan™, and (2) IronScan™ is a reliable and accurate point-of-care diagnostic system with practical field or point-of-care applications in human subjects.

Supplementary Materials

The following supporting information can be downloaded at: https://www.mdpi.com/article/10.3390/nu15061305/s1, Table S1: Ferritin values used for sensitivity and specificity analyses.

Author Contributions

J.L.F.: Conceptualization & analytical design, Funding acquisition, Formal analysis, Writing—review and editing. M.I.M.: Writing—original draft, review and editing. J.D.H.: Conceptualization & analytical design, Funding acquisition, Formal analysis, Writing—review and editing. All authors have read and agreed to the published version of the manuscript.

Funding

This work was supported under the auspices of the Cornell University Center for Life Science Enterprise, a New York State Center for Advanced Technology supported by New York State and industrial partners (grant 20210860; JLF, JDH). Six calibrated lateral flow measuring devices and all ferritin cartridges were donated by VitaMe Technologies, Inc. (DBA VitaScan™), Ithaca, NY, USA.

Institutional Review Board Statement

The study was conducted according to the guidelines of the Declaration of Helsinki and approved by the Institutional Review Board (or Ethics Committee) of Cornell University (protocol code 1804007942, approved November 2021).

Informed Consent Statement

Informed consent was obtained from all subjects involved in the study.

Data Availability Statement

Data described in the manuscript are held with the Division of Nutritional Sciences at Cornell University and will be made available upon request pending approval by the corresponding author.

Acknowledgments

We acknowledge and thank Erica Bender from the Human Metabolic Research Unit and Vicky Simon from the Nutritional Chemistry Lab of the Division of Nutritional Sciences for their help with participants and Immulite ferritin analyses. We acknowledge and thank the Cornell Statistical Consulting Unit for their help with the statistical analyses for this manuscript. Additionally, we acknowledge and thank Brooke Kelly, Brooke Overholt, and Gabrielle Orie of Cornell University Division of Nutritional Sciences for assistance with the data collection.

Conflicts of Interest

J.L.F. and J.D.H. have no conflict of interest. M.I.M. has or has held consulting agreements in the past 3 years with the Council for Responsible Nutrition (Washington, DC, USA); Church & Dwight (Ewing, NJ, USA); DSM Nutritional Products (Parsippany, NJ, USA); International Life Sciences Institute, North America (Washington, DC, USA); McCormick (Hunt Valley, MD, USA); OmegaQuant Analytics (Sioux Falls, SD, USA); PepsiCo (Purchase, NY, USA); VitaMe Technologies, Inc. (Ithaca, NY, USA), and World Health Organization (Geneva, Switzerland).

References

  1. Haas, J.D.; Brownlie, T. Iron Deficiency and Reduced Work Capacity: A Critical Review of the Research to Determine a Causal Relationship. J. Nutr. 2001, 131, 676S–690S. [Google Scholar] [CrossRef] [Green Version]
  2. Pasricha, S.-R.; Low, M.; Thompson, J.; Farrell, A.; De-Regil, L.-M. Iron Supplementation Benefits Physical Performance in Women of Reproductive Age: A Systematic Review and Meta-Analysis. J. Nutr. 2014, 144, 906–914. [Google Scholar] [CrossRef] [Green Version]
  3. Johnson-Wimbley, T.D.; Graham, D.Y. Diagnosis and Management of Iron Deficiency Anemia in the 21st Century. Ther. Adv. Gastroenterol. 2011, 4, 177–184. [Google Scholar] [CrossRef] [Green Version]
  4. Abu-Ouf, N.M.; Jan, M.M. The Impact of Maternal Iron Deficiency and Iron Deficiency Anemia on Child’s Health. Saudi Med. J. 2015, 36, 146. [Google Scholar] [CrossRef] [PubMed]
  5. Georgieff, M.K. Iron Deficiency in Pregnancy. Am. J. Obstet. Gynecol. 2020, 223, 516–524. [Google Scholar] [CrossRef] [PubMed]
  6. Kassebaum, N.J.; Jasrasaria, R.; Naghavi, M.; Wulf, S.K.; Johns, N.; Lozano, R.; Regan, M.; Weatherall, D.; Chou, D.P.; Eisele, T.P.; et al. A Systematic Analysis of Global Anemia Burden from 1990 to 2010. Blood 2014, 123, 615–624. [Google Scholar] [CrossRef] [PubMed]
  7. James, S.L.; Abate, D.; Abate, K.H.; Abay, S.M.; Abbafati, C.; Abbasi, N.; Abbastabar, H.; Abd-Allah, F.; Abdela, J.; Abdelalim, A.; et al. Global, Regional, and National Incidence, Prevalence, and Years Lived with Disability for 354 Diseases and Injuries for 195 Countries and Territories, 1990–2017: A Systematic Analysis for the Global Burden of Disease Study 2017. Lancet 2018, 392, 1789–1858. [Google Scholar] [CrossRef] [Green Version]
  8. Peyrin-Biroulet, L.; Williet, N.; Cacoub, P. Guidelines on the Diagnosis and Treatment of Iron Deficiency across Indications: A Systematic Review. Am. J. Clin. Nutr. 2015, 102, 1585–1594. [Google Scholar] [CrossRef] [Green Version]
  9. World Health Organization. WHO Guideline on the Use of Ferritin Concentrations to Assess Iron Status in Individual Populations; World Health Organization: Geneva, Switzerland, 2020; p. 62. [Google Scholar]
  10. Goldman, M.; Uzicanin, S.; Osmond, L.; Yi, Q.-L.; Scalia, V.; O’Brien, S.F. Two-Year Follow-up of Donors in a Large National Study of Ferritin Testing: Ferritin Study Follow-Up. Transfusion 2018, 58, 2868–2873. [Google Scholar] [CrossRef]
  11. Teichman, J.; Nisenbaum, R.; Lausman, A.; Sholzberg, M. Suboptimal Iron Deficiency Screening in Pregnancy and the Impact of Socioeconomic Status in a High-Resource Setting. Blood Adv. 2021, 5, 4666–4673. [Google Scholar] [CrossRef]
  12. Oatley, H.; Borkhoff, C.M.; Chen, S.; Macarthur, C.; Persaud, N.; Birken, C.S.; Maguire, J.L.; Parkin, P.C.; TARGet Kids! Collaboration. Screening for Iron Deficiency in Early Childhood Using Serum Ferritin in the Primary Care Setting. Pediatrics 2018, 142, e20182095. [Google Scholar] [CrossRef] [PubMed] [Green Version]
  13. Carsley, S.; Fu, R.; Borkhoff, C.M.; Reid, N.; Baginska, E.; Birken, C.S.; Maguire, J.L.; Hancock-Howard, R.; Parkin, P.C.; Coyte, P.C. Iron Deficiency Screening for Children at 18 Months: A Cost-Utility Analysis. CMAJ Open 2019, 7, E689–E698. [Google Scholar] [CrossRef] [PubMed] [Green Version]
  14. Mawani, M.; Aziz Ali, S. Iron Deficiency Anemia among Women of Reproductive Age, an Important Public Health Problem: Situation Analysis. Reprod. Syst. Sex. Disord. 2016, 5, 1–6. [Google Scholar] [CrossRef]
  15. Srinivasan, B. IronPhone_ Mobile Device-Coupled Point-of-Care Diagnostics for Assessment of Iron Status by Quantification of Serum Ferritin. Biosens. Bioelectron. 2018, 99, 115–121. [Google Scholar] [CrossRef]
  16. Albrecht, K.; Lotz, J.; Frommer, L.; Lackner, K.J.; Kahaly, G.J. A Rapid Point-of-Care Assay Accurately Measures Vitamin D. J. Endocrinol. Investig. 2021, 44, 2485–2492. [Google Scholar] [CrossRef]
  17. U.S. Department of Health & Human Services. U.S. Centers for Disease Control and Prevention Notice of Specific List for Categorization of Laboratory Test Systems, Assays, and Examinations Complexity. Fed. Regist. 1999, 64, 55190–551564. [Google Scholar]
  18. Habicht, J.P.; Meyers, L.D.; Brownie, C. Indicators for Identifying and Counting the Improperly Nourished. Am. J. Clin. Nutr. 1982, 35, 1241–1254. [Google Scholar] [CrossRef]
  19. Haas, J.D.; Habicht, J.P. Growth and Growth Charts in the Assessment of Preschool Nutritional Status. Diet Dis. Tradit. Dev. Soc. 1990, 160–183. [Google Scholar]
  20. Pootrakul, P.; Skikne, B.S.; Cook, J.D. The Use of Capillary Blood for Measurements of Circulating Ferritin. Am. J. Clin. Nutr. 1983, 37, 307–310. [Google Scholar] [CrossRef]
  21. Quezada-Pinedo, H.G.; Cassel, F.; Duijts, L.; Muckenthaler, M.U.; Gassmann, M.; Jaddoe, V.W.V.; Reiss, I.K.M.; Vermeulen, M.J. Maternal Iron Status in Pregnancy and Child Health Outcomes after Birth: A Systematic Review and Meta-Analysis. Nutrients 2021, 13, 2221. [Google Scholar] [CrossRef]
  22. Tran, K.; McCormack, S. Screening and Treatment of Obstetric Anemia: A Review of Clinical Effectiveness, Cost-Effectiveness, and Guidelines; Canadian Agency for Drugs and Technology in Health: Ottawa, ON, Canada, 2019. [Google Scholar]
  23. Cable, R.G.; Glynn, S.A.; Kiss, J.E.; Mast, A.E.; Steele, W.R.; Murphy, E.L.; Wright, D.J.; Sacher, R.A.; Gottschall, J.L.; Tobler, L.H.; et al. Iron Deficiency in Blood Donors: The REDS-II Donor Iron Status Evaluation (RISE) Study. Transfusion 2012, 52, 702–711. [Google Scholar] [CrossRef] [PubMed] [Green Version]
  24. Baart, A.M.; van Noord, P.A.H.; Vergouwe, Y.; Moons, K.G.M.; Swinkels, D.W.; Wiegerinck, E.T.; de Kort, W.L.A.M.; Atsma, F. High Prevalence of Subclinical Iron Deficiency in Whole Blood Donors Not Deferred for Low Hemoglobin: Iron Deficiency among Blood Donors. Transfusion 2013, 53, 1670–1677. [Google Scholar] [CrossRef] [PubMed]
  25. Rigas, A.S.; Sørensen, C.J.; Pedersen, O.B.; Petersen, M.S.; Thørner, L.W.; Kotzé, S.; Sørensen, E.; Magnussen, K.; Rostgaard, K.; Erikstrup, C.; et al. Predictors of Iron Levels in 14,737 D Anish Blood Donors: Results from the D Anish Blood Donor Study. Transfusion 2014, 54, 789–796. [Google Scholar] [CrossRef] [Green Version]
  26. Salvin, H.E.; Pasricha, S.-R.; Marks, D.C.; Speedy, J. Iron Deficiency in Blood Donors a National Cross-sectional Study.Pdf. Transfusion 2014, 54, 2434–2444. [Google Scholar] [CrossRef] [PubMed]
  27. Goldman, M.; Uzicanin, S.; Osmond, L.; Scalia, V.; O’Brien, S.F. A Large National Study of Ferritin Testing in Canadian Blood Donors: A Large National Study of Ferritin Testing. Transfusion 2017, 57, 564–570. [Google Scholar] [CrossRef] [PubMed]
Figure 1. CONSORT diagram showing the inclusion and exclusion criteria and the resulting eligible participants, whose blood samples were further subdivided and analysed based on blood collection methods obtained during the data collection periods.
Nutrients 15 01305 g001
Figure 2. Comparison of ferritin (Fer) values from IronScan™ using capillary whole blood (cWB) versus Immulite 2000 Xpi using venous serum (vSer). (A). Regression analyses. (B). Bland–Altman plot. Dashed lines represent 95% confidence intervals around the slope (panel A) or the mean (panel B). Blue line represents the line of identity. Standard error of the estimate, SEE.
Nutrients 15 01305 g002
Figure 3. Comparison of ferritin (Fer) values from IronScan™ using venous whole blood (vWB) versus Immulite 2000 Xpi using venous serum (vSer). Dashed lines represent 95% confidence intervals around the slope. Blue line represents the line of identity. Standard error of the estimate, SEE.
Nutrients 15 01305 g003
Figure 4. Comparison of ferritin (Fer) values from venous serum (vSer) samples using IronScan™ versus Immulite 2000 Xpi. Dashed lines represent 95% confidence intervals around the slope. Blue line represents the line of identity. Standard error of the estimate, SEE.
Nutrients 15 01305 g004
Table 1. Subject characteristics (n = 44).
Mean ± SDRange
Age, year33.8 ± 11.019–61
Height, cm168.5 ± 7.8150–178
Weight, kg70.1 ± 15.352–106
BMI, kg/m224.7 ± 4.619–41
Table 2. Ferritin values and ranges across devices and blood sampling methods 1.
Mean ± SDRange
Ferritin from Immulite vSer, ng/mL41.1 ± 30.75.4–119.0
Ferritin from IronScan™ cWB, ng/mL40.7 ± 27.37.6–114.0
Ferritin from IronScan™ vWB, ng/mL56.3 ± 40.15.0–154.0
Ferritin from IronScan™ vSer, ng/mL46.1 ± 32.57.2–137.6
1 Blood samples were collected between 27–29 June 2022. vSer, venous serum; cWB, capillary whole blood; vWB, venous whole blood.
Table 3. Identification of iron deficiency (n = 44) 1.
Sensitivity (%)Specificity (%)
≤12 ng/mL (clinical)33100
≤30 ng/mL (WHO)8596
1 Sensitivity is the probability that the IronScan™ will diagnose iron deficiency among those with iron deficiency as measured by the Immulite 2000 Xpi (true positives). Specificity is the fraction of those without iron deficiency (true negatives as measured by the Immulite) that test as non-iron deficient on the IronScan™.
Disclaimer/Publisher’s Note: The statements, opinions and data contained in all publications are solely those of the individual author(s) and contributor(s) and not of MDPI and/or the editor(s). MDPI and/or the editor(s) disclaim responsibility for any injury to people or property resulting from any ideas, methods, instructions or products referred to in the content.

