
The Role of Globularia alypum Explored Ex Vivo In Vitro on Human Colon Biopsies from Ulcerative Colitis Patients

 , , , ,
  ,
,  and
and 
Abstract
:1. Introduction
2. Material and Methods
2.1. GA Collection and Extract Preparation
2.2. Patients and Biopsy Culture
2.2.1. Patients and Collection of Biopsies
2.2.2. Biopsy Culture and GAAE Treatments
2.3. Immunohistochemistry
2.4. Western Blot
2.5. Nitric Oxide Dosage
2.6. The SOD Activity
2.7. ELISA Test for IL-6 Assay
2.8. Statistical Analysis
3. Results
3.1. GAAE Pre-Treatment Effect in Normal Colon Biopsies upon EC-LPS Challenge
3.1.1. Effect on Inflammatory Markers
COX-2 and ICAM-1
Effect on NF-κB and p38 MAPK
Effect on IL-6 Production
3.1.2. Effect on Oxidative Stress Markers
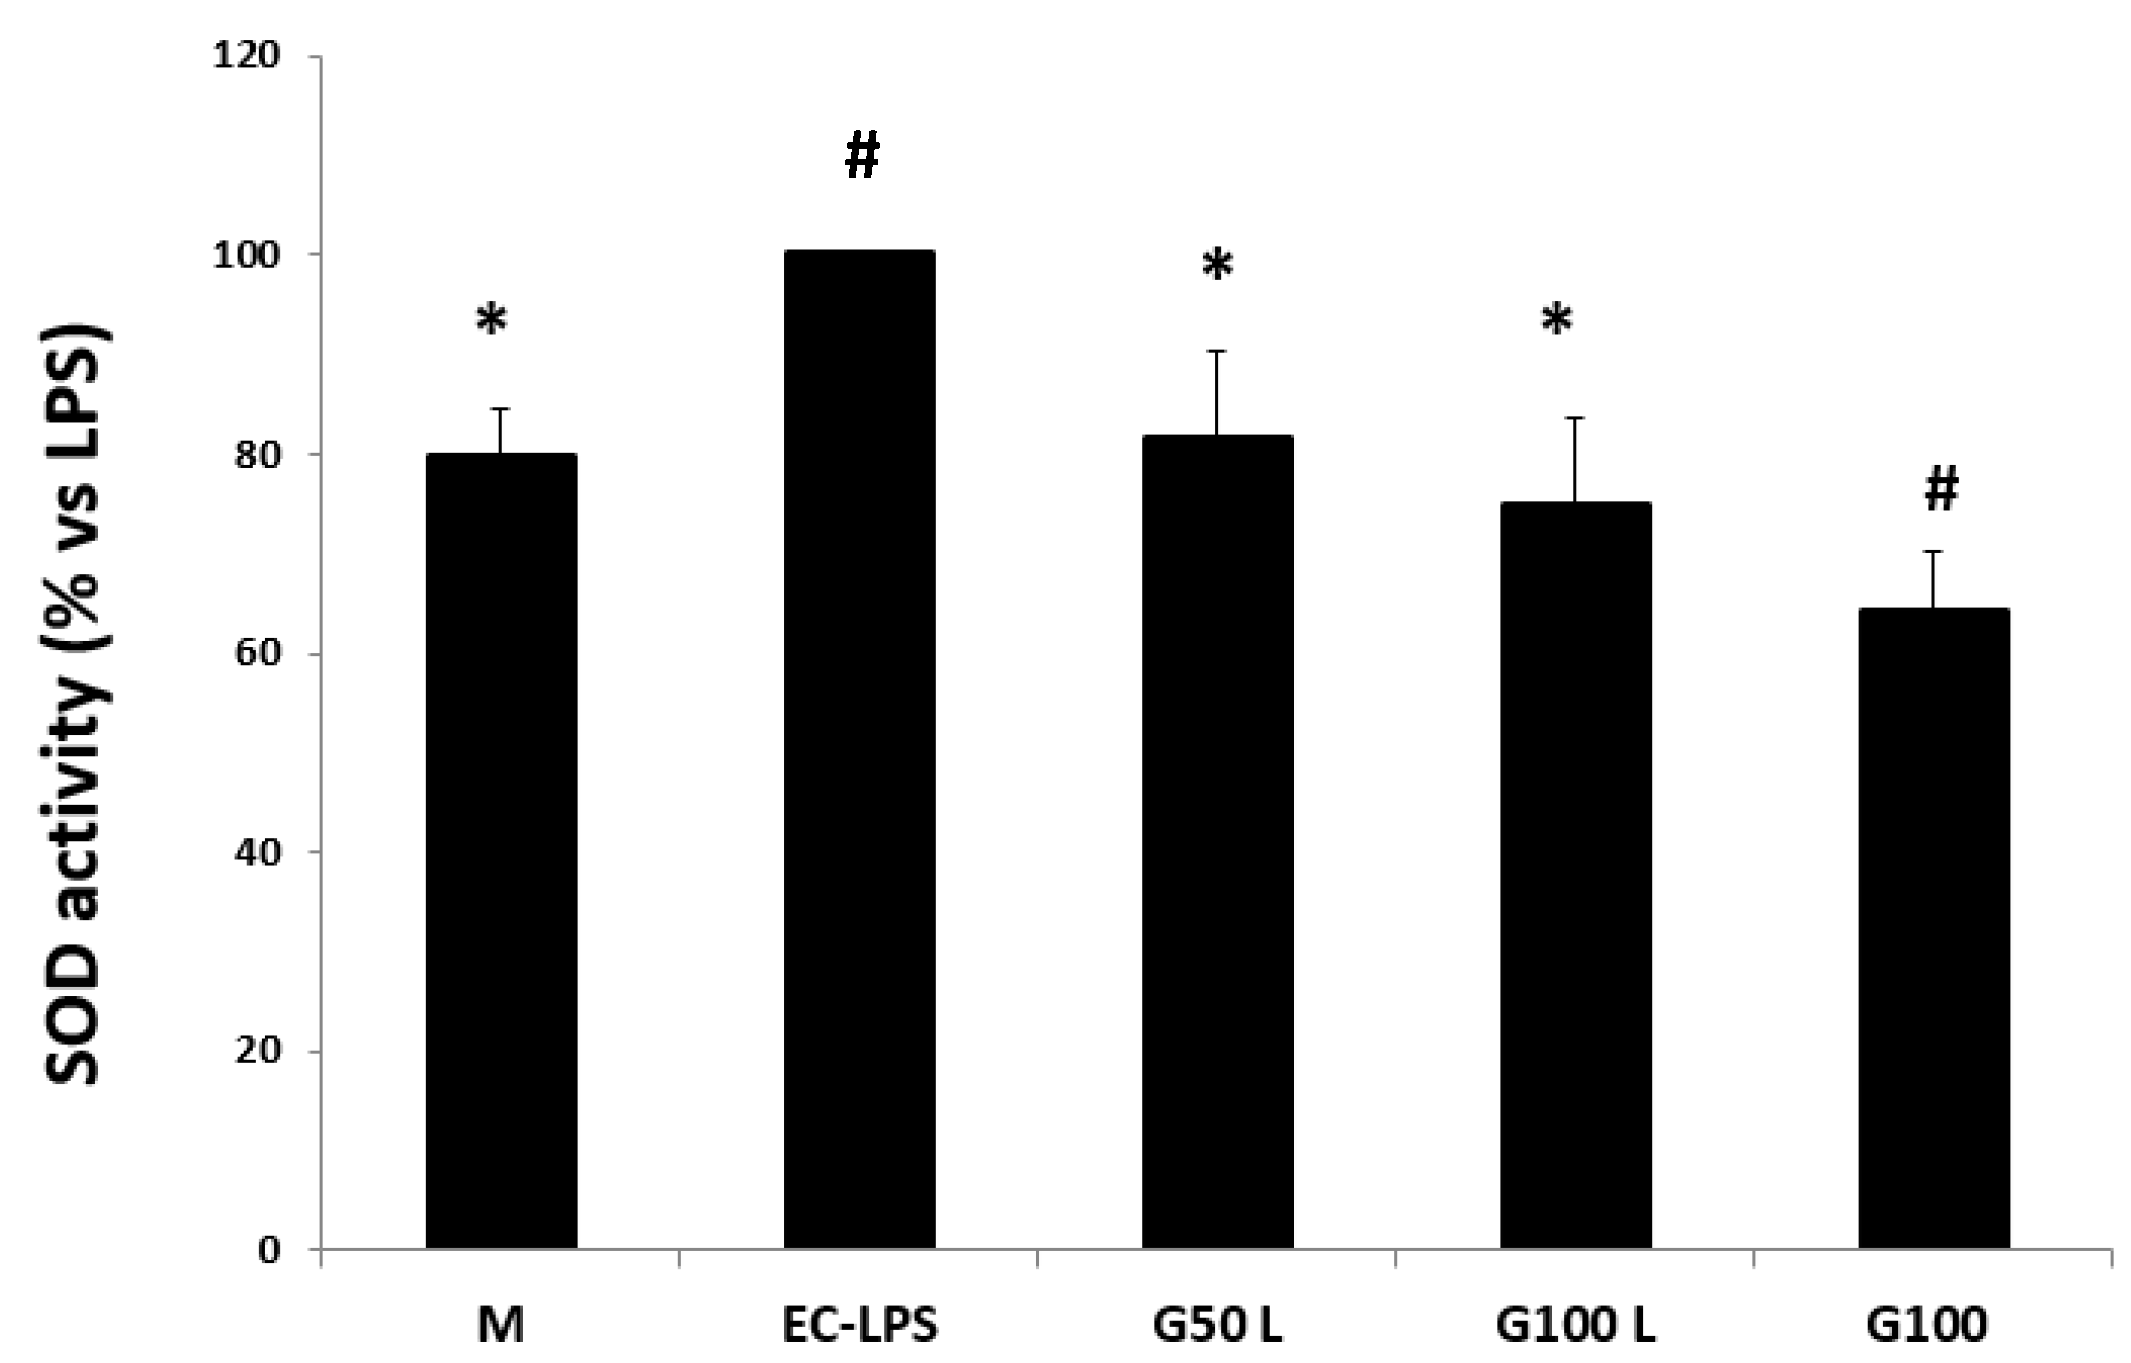
Effect on SOD Activity
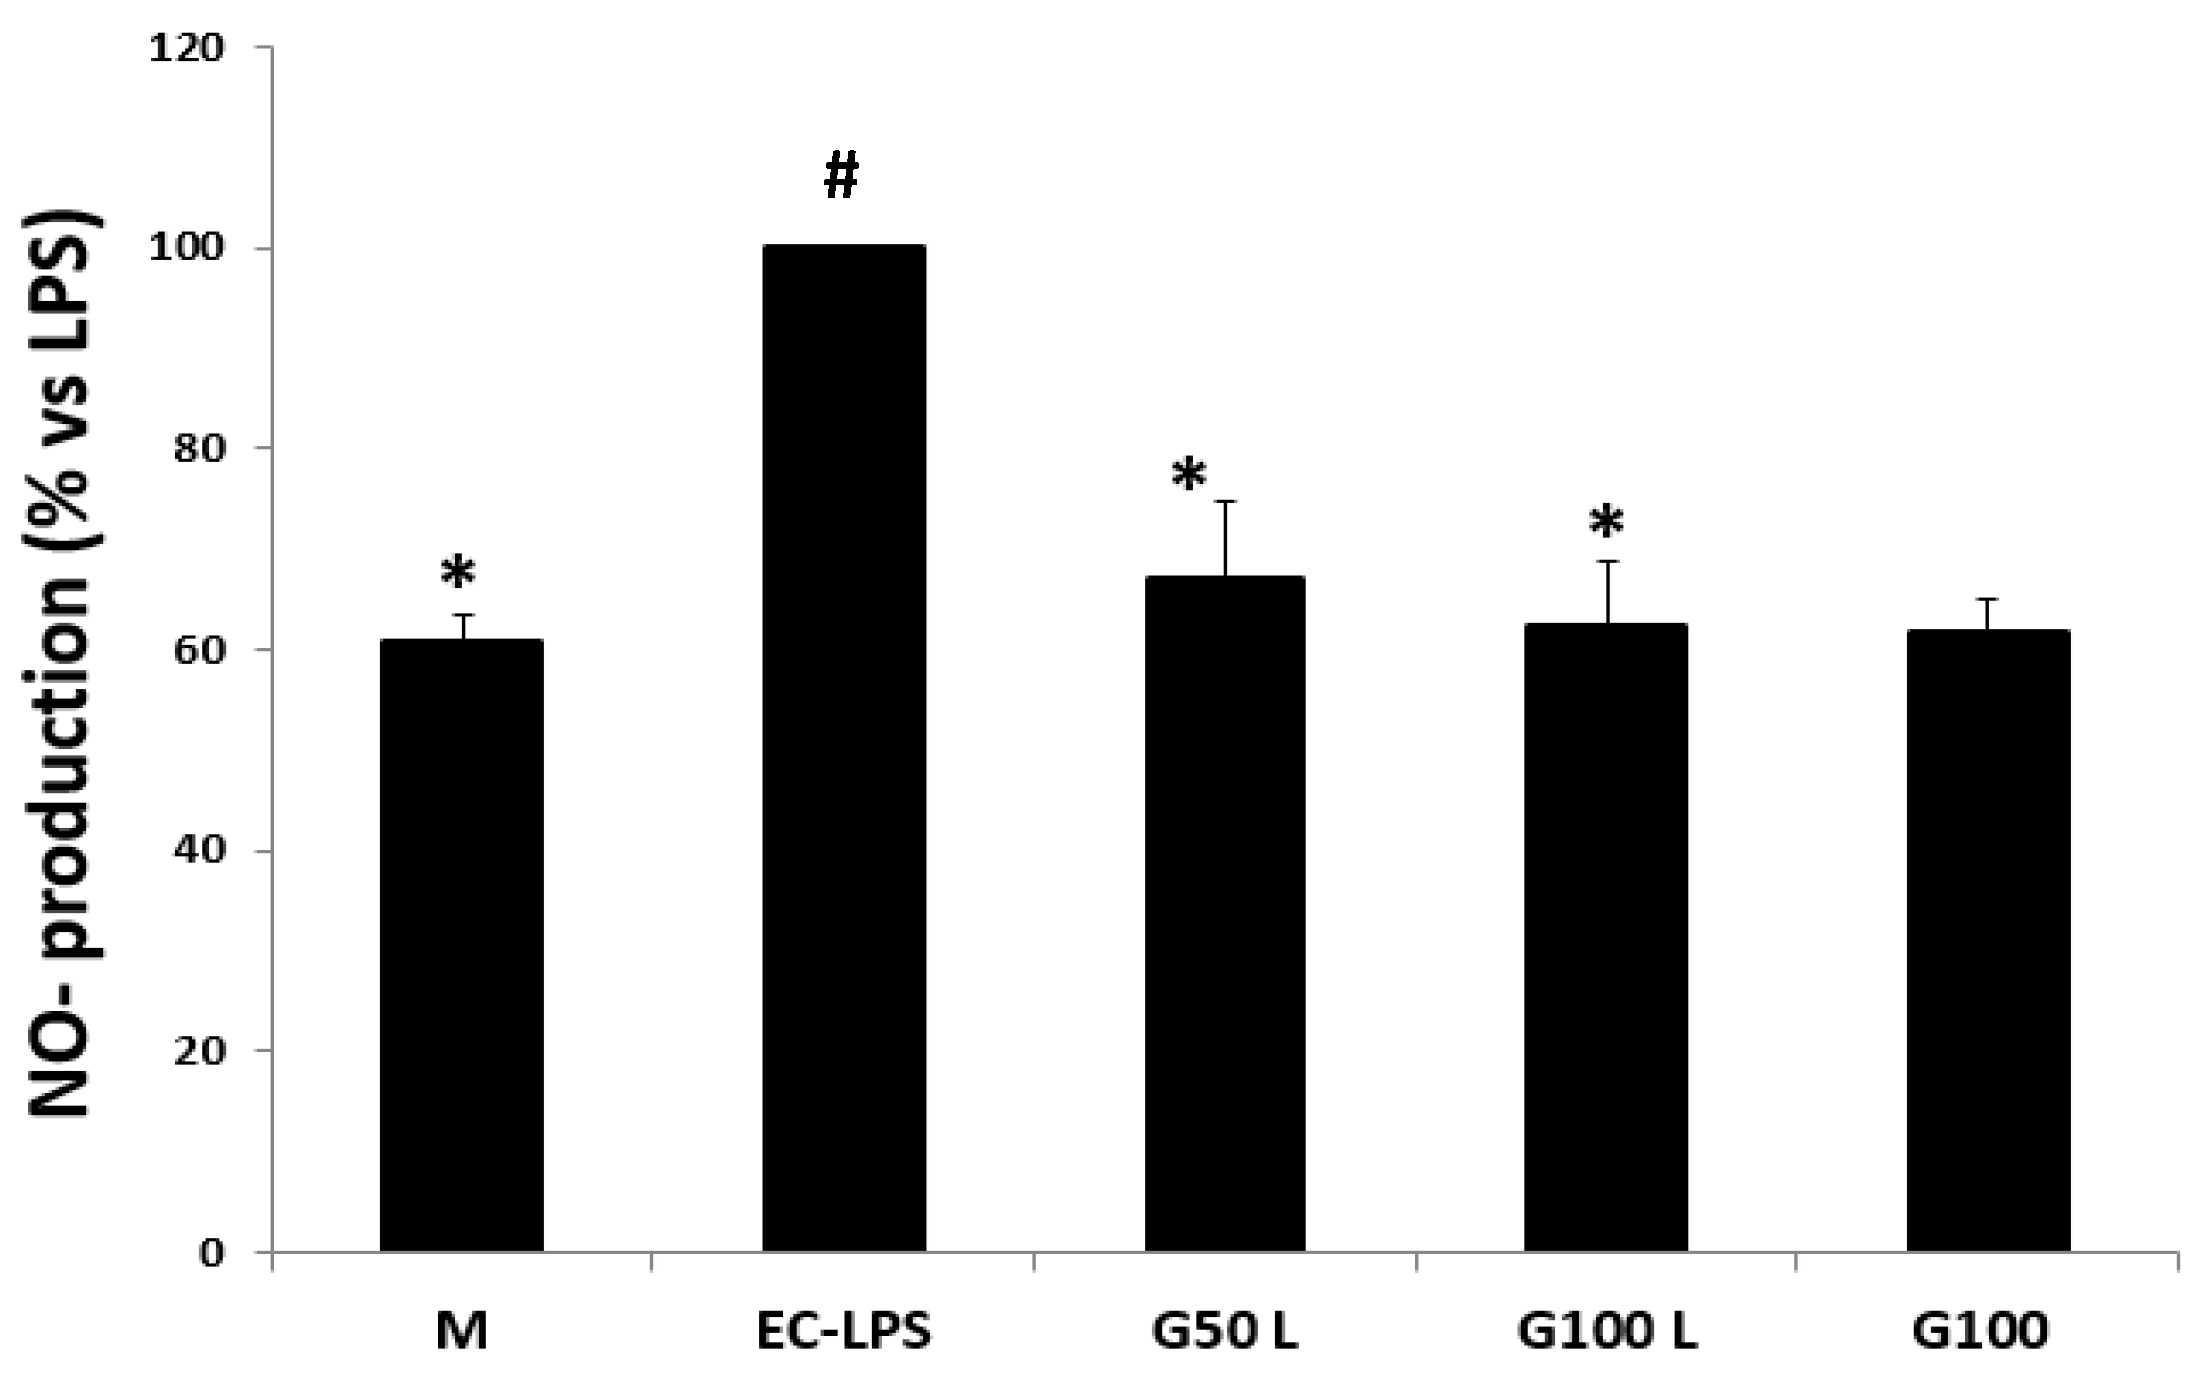
NO Production
3.2. GAAE Pre-Treatment Effect in Colon Biopsies from UC Patients upon EC-LPS Challenge
3.2.1. Effect on Inflammatory Markers
Effect on COX-2 and ICAM-1 Activity
Effect on NF-κB and p38 MAPK Expression
Effect on IL-6 Production
3.2.2. Effect on Oxidative Stress Markers
Effect on SOD Activity
Effect on NO Production
4. Discussion
Supplementary Materials
Author Contributions
Funding
Institutional Review Board Statement
Informed Consent Statement
Data Availability Statement
Acknowledgments
Conflicts of Interest
Abbreviations
References
- Ghlissi, Z.; Kallel, R.; Sila, A.; Harrabi, B.; Atheymen, R.; Zeghal, K.; Bougatef, A.; Sahnoun, Z. Globularia alypum methanolic extract improves burn wound healing process and inflammation in rats and possesses antibacterial and antioxidant activities. Biomed. Pharm. 2016, 84, 1488–1495. [Google Scholar] [CrossRef] [PubMed]
- Leclerc, H. Not Available. La Presse Med. 1948, 56, 513. [Google Scholar]
- Caldes, G.; Prescott, B.; King, J.R. A potential antileukemic substance present in Globularia alypum. Planta Med. 1975, 27, 72–76. [Google Scholar] [CrossRef]
- Ziyyat, A.; Legssyer, A.; Mekhfi, H.; Dassouli, A.; Serhrouchni, M.; Benjelloun, W. Phytotherapy of hypertension and diabetes in oriental Morocco. J. Ethnopharmacol. 1997, 58, 45–54. [Google Scholar] [CrossRef] [PubMed]
- Najla, H.; Sihem, B.; Nacim, Z.; Hisham, A.; Hichem, S.; Kamel, C. Molecular Docking Studies, Chemical Composition, Antioxidant, Cytotoxicity, Antibacterial and Antifungal Activities of Globularia alypum Extract. Curr. Bioact. Compd. 2021, 17, 51–64. [Google Scholar] [CrossRef]
- Bello, R.; Moreno, L.; Primo-Yufera, E.; Esplugues, J. Globularia alypum L. extracts reduced histamine and serotonin contraction in vitro. Phytother. Res. PTR 2002, 16, 389–392. [Google Scholar] [CrossRef]
- Khlifi, D.; Hamdi, M.; El Hayouni, A.; Cazaux, S.; Souchard, J.P.; Couderc, F.; Bouajila, J. Global chemical composition and antioxidant and anti-tuberculosis activities of various extracts of Globularia alypum L. (Globulariaceae) leaves. Molecules 2011, 16, 10592–10603. [Google Scholar] [CrossRef] [Green Version]
- Taleb-Dida, N.; Krouf, D.; Bouchenak, M. Globularia alypum aqueous extract decreases hypertriglyceridemia and ameliorates oxidative status of the muscle, kidney, and heart in rats fed a high-fructose diet. Nutr. Res. 2011, 31, 488–495. [Google Scholar] [CrossRef]
- Friscic, M.; Bucar, F.; Hazler Pilepic, K. LC-PDA-ESI-MS(n) analysis of phenolic and iridoid compounds from Globularia spp. J. Mass Spectrom. JMS 2016, 51, 1211–1236. [Google Scholar] [CrossRef]
- Amessis-Ouchemoukh, N.; Abu-Reidah, I.M.; Quirantes-Piné, R.; Rodríguez-Pérez, C.; Madani, K.; Fernández-Gutiérrez, A.; Segura-Carretero, A. Tentative characterisation of iridoids, phenylethanoid glycosides and flavonoid derivatives from Globularia alypum L.(Globulariaceae) leaves by LC-ESI-QTOF-MS. Phytochem. Anal. 2014, 25, 389–398. [Google Scholar] [CrossRef]
- Hajji, N.; Jabri, M.-A.; Tounsi, H.; Wanes, D.; Ali, I.B.E.H.; Boulila, A.; Marzouki, L.; Sebai, H. Phytochemical analysis by HPLC-PDA/ESI-MS of Globularia alypum aqueous extract and mechanism of its protective effect on experimental colitis induced by acetic acid in rat. J. Funct. Foods 2018, 47, 220–228. [Google Scholar] [CrossRef]
- Taghzouti, O.K.; Balouirib, M.; Ouedrhiric, W.; Chahadd, A.; Romanea, A. In vitro evaluation of the antioxidant and antimicrobial effects of Globularia alypum L. extracts. J. Mater. Environ. Sci. 2016, 7, 1988–1995. [Google Scholar]
- Fehri, B.; Aiache, J.M.; Ahmed, K.M. Active spermatogenesis induced by a reiterated administration of Globularia alypum L. aqueous leaf extract. Pharmacogn. Res. 2012, 4, 138–147. [Google Scholar] [CrossRef] [PubMed] [Green Version]
- Hajji, N.; Wannes, D.; Jabri, M.A.; Rtibi, K.; Tounsi, H.; Abdellaoui, A.; Sebai, H. Purgative/laxative actions of Globularia alypum aqueous extract on gastrointestinal-physiological function and against loperamide-induced constipation coupled to oxidative stress and inflammation in rats. Neurogastroenterol. Motil. 2020, 32, e13858. [Google Scholar] [CrossRef] [PubMed] [Green Version]
- Jouad, H.; Maghrani, M.; Eddouks, M. Hypoglycaemic effect of Rubus fructicosis L. and Globularia alypum L. in normal and streptozotocin-induced diabetic rats. J. Ethnopharmacol. 2002, 81, 351–356. [Google Scholar] [CrossRef] [PubMed]
- Russo, I.; Zeppa, P.; Iovino, P.; Del Giorno, C.; Zingone, F.; Bucci, C.; Puzziello, A.; Ciacci, C. The culture of gut explants: A model to study the mucosal response. J. Immunol. Methods 2016, 438, 1–10. [Google Scholar] [CrossRef]
- Angulo, S.; Morales, A.; Danese, S.; Llacuna, L.; Masamunt, M.C.; Pultz, N.; Cifone, M.G.; De Simone, C.; Delgado, S.; Vila, J. Probiotic sonicates selectively induce mucosal immune cells apoptosis through ceramide generation via neutral sphingomyelinase. PLoS ONE 2011, 6, e16953. [Google Scholar] [CrossRef] [Green Version]
- Schuppan, D.; Junker, Y.; Barisani, D. Celiac disease: From pathogenesis to novel therapies. Gastroenterology 2009, 137, 1912–1933. [Google Scholar] [CrossRef]
- Andreoli, T.; Benjamin, I.; Griggs, R.; Wing, E.; Fitz, J. Andreoli and carpenter’s cecil essentials of medicine. In Student Consult Online Access, 8th ed.; Saunders Company: Philadelphia, PA, USA, 2010. [Google Scholar]
- Fiocchi, C. Inflammatory bowel disease: Etiology and pathogenesis. Gastroenterology 1998, 115, 182–205. [Google Scholar] [CrossRef]
- Sanchez-Muñoz, F.; Dominguez-Lopez, A.; Yamamoto-Furusho, J.K. Role of cytokines in inflammatory bowel disease. World J. Gastroenterol. WJG 2008, 14, 4280. [Google Scholar] [CrossRef] [PubMed]
- Hollenbach, E.; Neumann, M.; Vieth, M.; Roessner, A.; Malfertheiner, P.; Naumann, M. Inhibition of p38 MAP kinase-and RICK/NF-κB-signaling suppresses inflammatory bowel disease. FASEB J. 2004, 18, 1550–1552. [Google Scholar] [CrossRef] [PubMed]
- Jabri, M.-A.; Rtibi, K.; Tounsi, H.; Hosni, K.; Souli, A.; El-Benna, J.; Marzouki, L.; Sakly, M.; Sebai, H. Myrtle berry seed aqueous extract inhibits human neutrophil myeloperoxidase in vitro and attenuates acetic acid-induced ulcerative colitis in rats. RSC Adv. 2015, 5, 64865–64877. [Google Scholar] [CrossRef]
- Ahmed, A.; Dunk, C.; Kniss, D.; Wilkes, M. Role of VEGF receptor-1 (Flt-1) in mediating calcium-dependent nitric oxide release and limiting DNA synthesis in human trophoblast cells. Lab. Investig. 1997, 76, 779–792. [Google Scholar] [PubMed]
- Misra, H.P.; Fridovich, I. The role of superoxide anion in the autoxidation of epinephrine and a simple assay for superoxide dismutase. J. Biol. Chem. 1972, 247, 3170–3175. [Google Scholar] [CrossRef]
- Algieri, F.; Rodriguez-Nogales, A.; Rodriguez-Cabezas, M.E.; Risco, S.; Ocete, M.; Galvez, J. Botanical drugs as an emerging strategy in inflammatory bowel disease: A review. Mediat. Inflamm. 2015, 2015, 179616. [Google Scholar] [CrossRef] [PubMed] [Green Version]
- Rosenbaum, C.; Schick, M.A.; Wollborn, J.; Heider, A.; Scholz, C.-J.; Cecil, A.; Niesler, B.; Hirrlinger, J.; Walles, H.; Metzger, M. Activation of myenteric glia during acute inflammation in vitro and in vivo. PLoS ONE 2016, 11, e0151335. [Google Scholar] [CrossRef]
- Brand, R.M.; Biswas, N.; Siegel, A.; Myerski, A.; Engstrom, J.; Metter, E.J.; Brand, R.E.; Cranston, R.D.; McGowan, I. Immunological responsiveness of intestinal tissue explants and mucosal mononuclear cells to ex vivo stimulation. J. Immunol. Methods 2018, 463, 39–46. [Google Scholar] [CrossRef] [PubMed]
- Karpurapu, M.; Wang, X.; Deng, J.; Park, H.; Xiao, L.; Sadikot, R.T.; Frey, R.S.; Maus, U.A.; Park, G.Y.; Scott, E.W. Functional PU. 1 in macrophages has a pivotal role in NF-κB activation and neutrophilic lung inflammation during endotoxemia. Blood J. Am. Soc. Hematol. 2011, 118, 5255–5266. [Google Scholar] [CrossRef] [Green Version]
- Piechota-Polanczyk, A.; Fichna, J. The role of oxidative stress in pathogenesis and treatment of inflammatory bowel diseases. Naunyn-Schmiedeberg’s Arch. Pharmacol. 2014, 387, 605–620. [Google Scholar] [CrossRef] [PubMed] [Green Version]
- World Health Organization. The Challenge of Obesity-Quick Statistics. Available online: http://www.euro.who.int/en/healthtopics/noncommunicablediseases/obesity/data-and-statistics (accessed on 5 April 2019).
- Grivennikov, S.I.; Karin, M. Inflammatory cytokines in cancer: Tumour necrosis factor and interleukin 6 take the stage. Ann. Rheum. Dis. 2011, 70, i104–i108. [Google Scholar] [CrossRef] [PubMed]
- Waldner, M.J.; Foersch, S.; Neurath, M.F. Interleukin-6-a key regulator of colorectal cancer development. Int. J. Biol. Sci. 2012, 8, 1248. [Google Scholar] [CrossRef]
- Waetzig, G.H.; Seegert, D.; Rosenstiel, P.; Nikolaus, S.; Schreiber, S. p38 mitogen-activated protein kinase is activated and linked to TNF-α signaling in inflammatory bowel disease. J. Immunol. 2002, 168, 5342–5351. [Google Scholar] [CrossRef] [Green Version]
- Rafa, H.; Saoula, H.; Belkhelfa, M.; Medjeber, O.; Soufli, I.; Toumi, R.; de Launoit, Y.; Morales, O.; Nakmouche, M.H.; Delhem, N. IL-23/IL-17A axis correlates with the nitric oxide pathway in inflammatory bowel disease: Immunomodulatory effect of retinoic acid. J. Interferon Cytokine Res. 2013, 33, 355–368. [Google Scholar] [CrossRef] [PubMed]
- Hori, M.; Nobe, H.; Horiguchi, K.; Ozaki, H. MCP-1 targeting inhibits muscularis macrophage recruitment and intestinal smooth muscle dysfunction in colonic inflammation. Am. J. Physiol. Cell Physiol. 2008, 294, C391–C401. [Google Scholar] [CrossRef] [PubMed]
- Krieglstein, C.F.; Anthoni, C.; Cerwinka, W.H.; Stokes, K.Y.; Russell, J.; Grisham, M.B.; Granger, D.N. Role of blood-and tissue-associated inducible nitric-oxide synthase in colonic inflammation. Am. J. Pathol. 2007, 170, 490–496. [Google Scholar] [CrossRef] [PubMed] [Green Version]
- Guan, G.; Lan, S. Implications of antioxidant systems in inflammatory bowel disease. BioMed Res. Int. 2018, 2018, 1290179. [Google Scholar] [CrossRef] [Green Version]


Disclaimer/Publisher’s Note: The statements, opinions and data contained in all publications are solely those of the individual author(s) and contributor(s) and not of MDPI and/or the editor(s). MDPI and/or the editor(s) disclaim responsibility for any injury to people or property resulting from any ideas, methods, instructions or products referred to in the content. |
© 2023 by the authors. Licensee MDPI, Basel, Switzerland. This article is an open access article distributed under the terms and conditions of the Creative Commons Attribution (CC BY) license (https://creativecommons.org/licenses/by/4.0/).
Share and Cite
Hajji, N.; Russo, I.; Bianco, J.; Piazza, O.; Iovino, P.; Santonicola, A.; Ciacci, C. The Role of Globularia alypum Explored Ex Vivo In Vitro on Human Colon Biopsies from Ulcerative Colitis Patients. Nutrients 2023, 15, 1457. https://doi.org/10.3390/nu15061457
Hajji N, Russo I, Bianco J, Piazza O, Iovino P, Santonicola A, Ciacci C. The Role of Globularia alypum Explored Ex Vivo In Vitro on Human Colon Biopsies from Ulcerative Colitis Patients. Nutrients. 2023; 15(6):1457. https://doi.org/10.3390/nu15061457
Chicago/Turabian StyleHajji, Najla, Ilaria Russo, Jessica Bianco, Ornella Piazza, Paola Iovino, Antonella Santonicola, and Carolina Ciacci. 2023. "The Role of Globularia alypum Explored Ex Vivo In Vitro on Human Colon Biopsies from Ulcerative Colitis Patients" Nutrients 15, no. 6: 1457. https://doi.org/10.3390/nu15061457