
Human Milk Calorie Guide: A Novel Color-Based Tool to Estimate the Calorie Content of Human Milk for Preterm Infants
 ,
,
Abstract
:1. Introduction
2. Materials and Methods
2.1. Study Design and Location
2.2. Participants
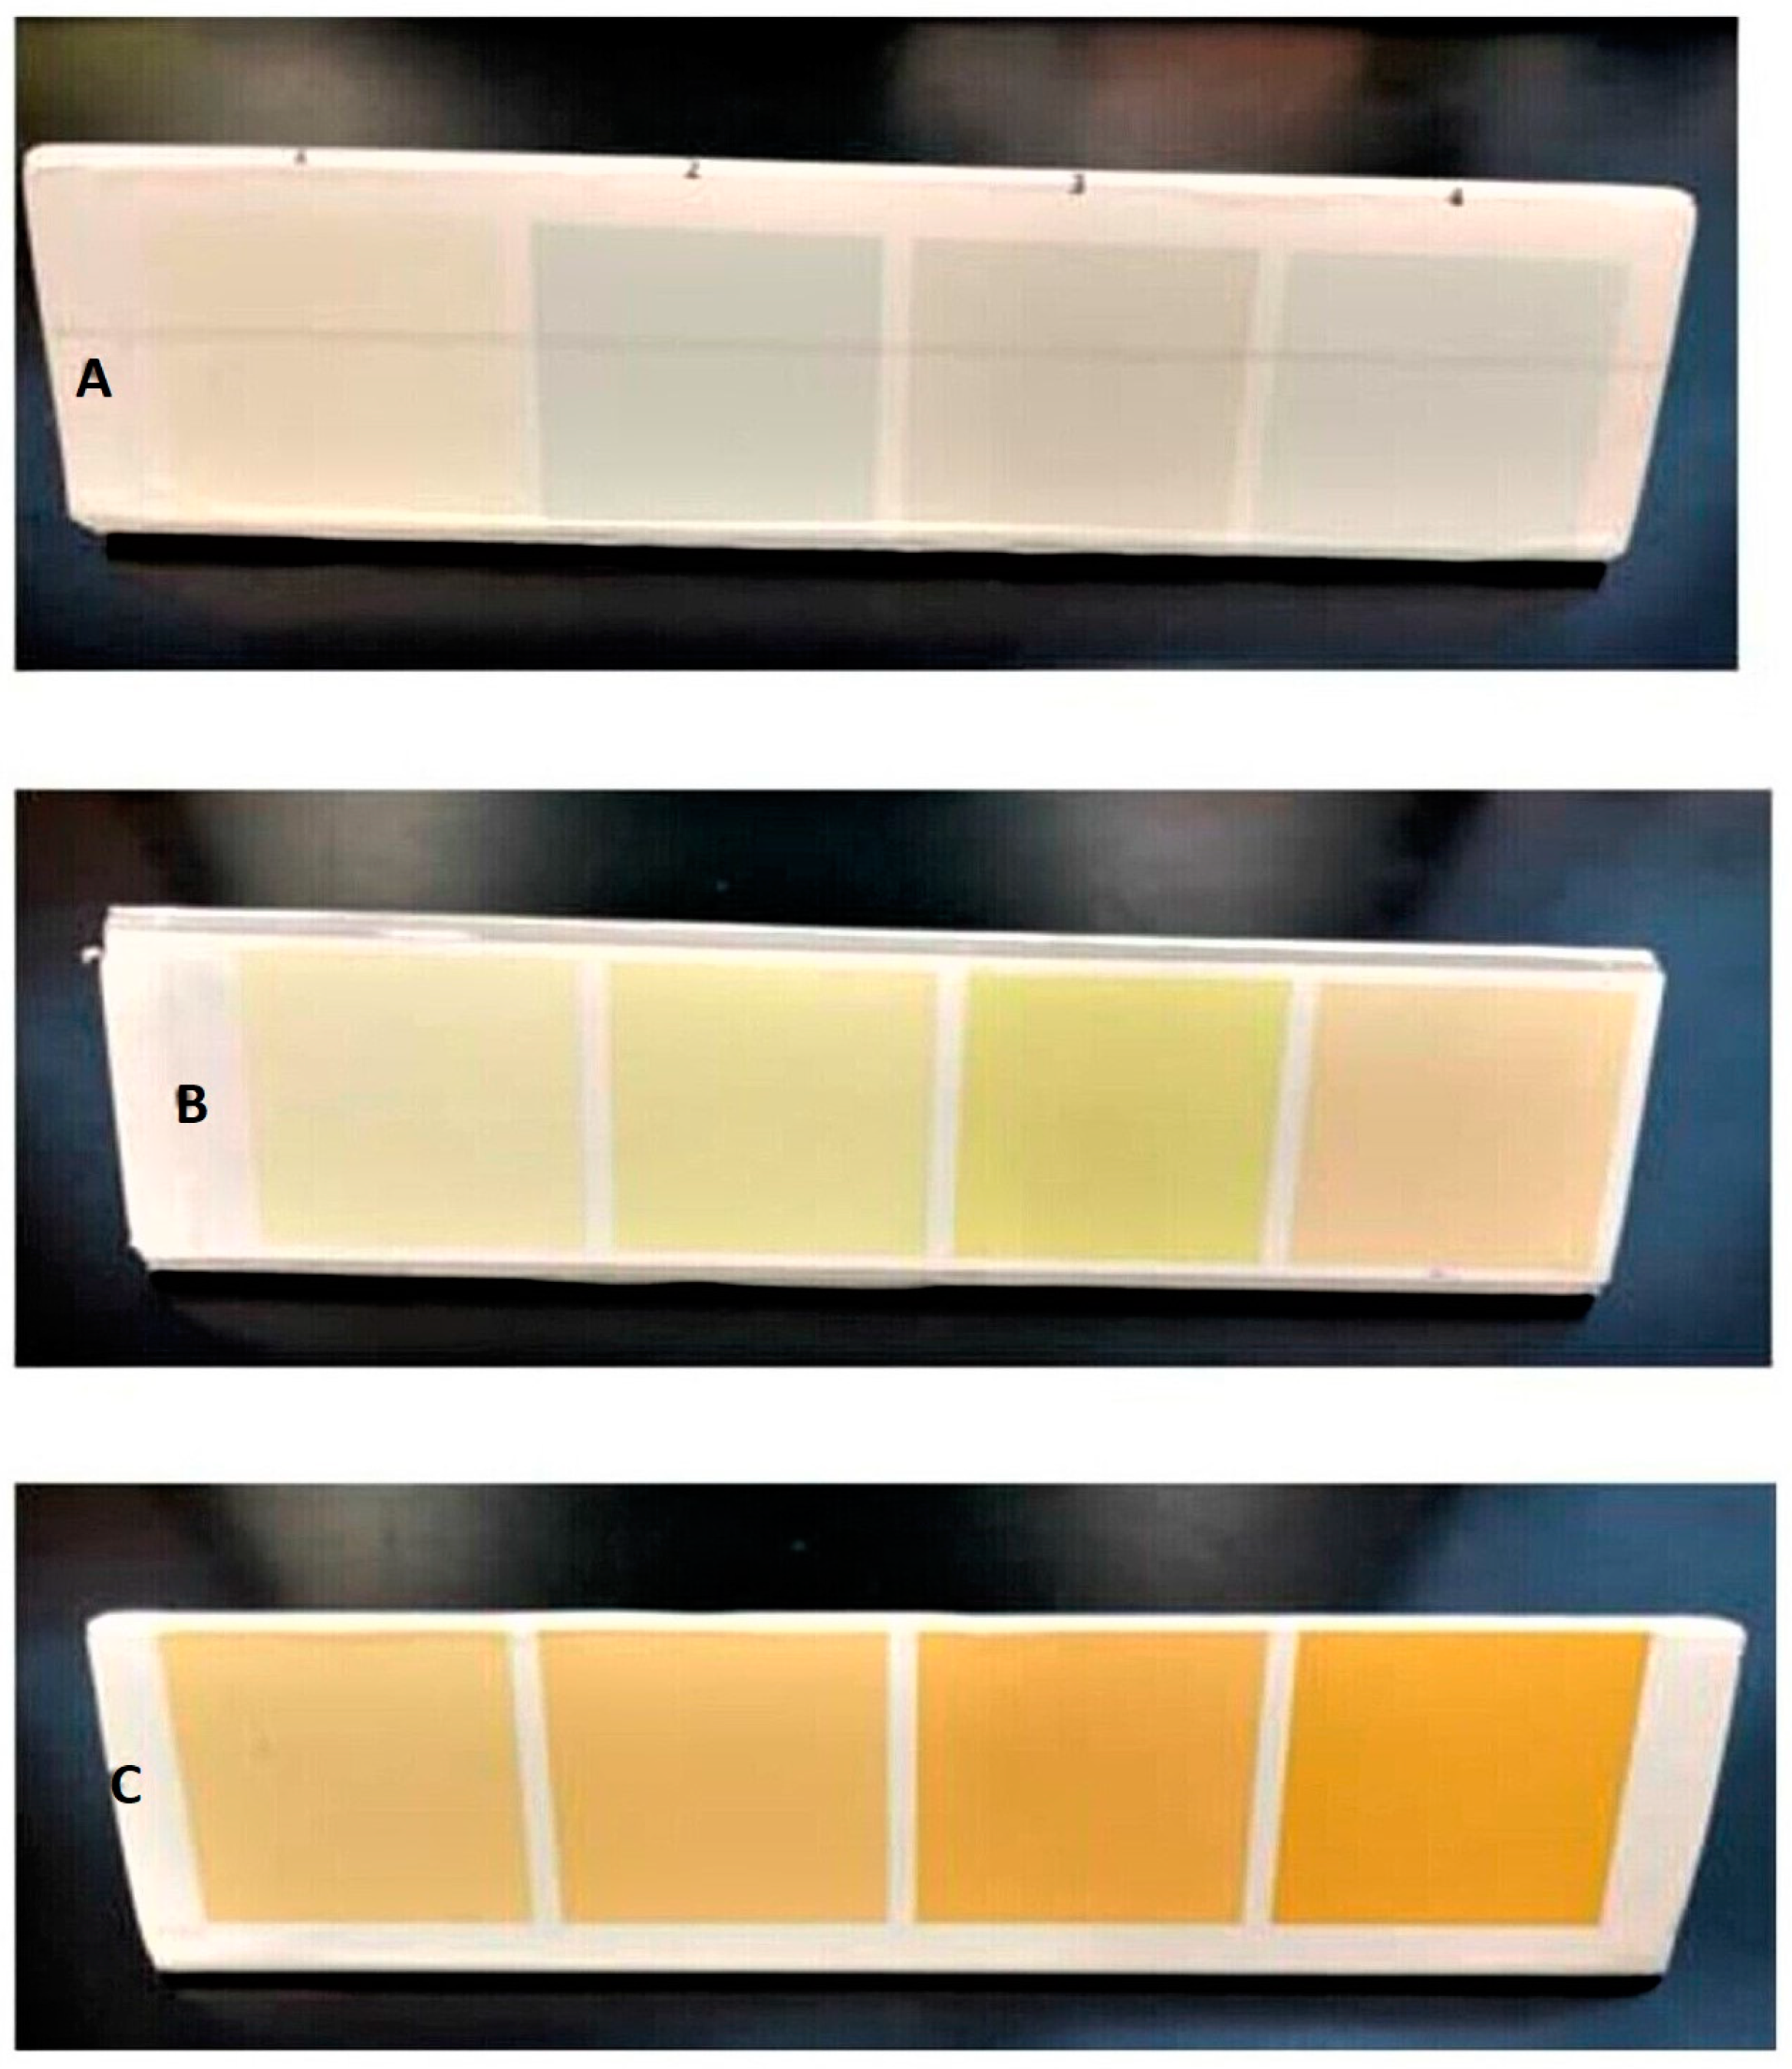
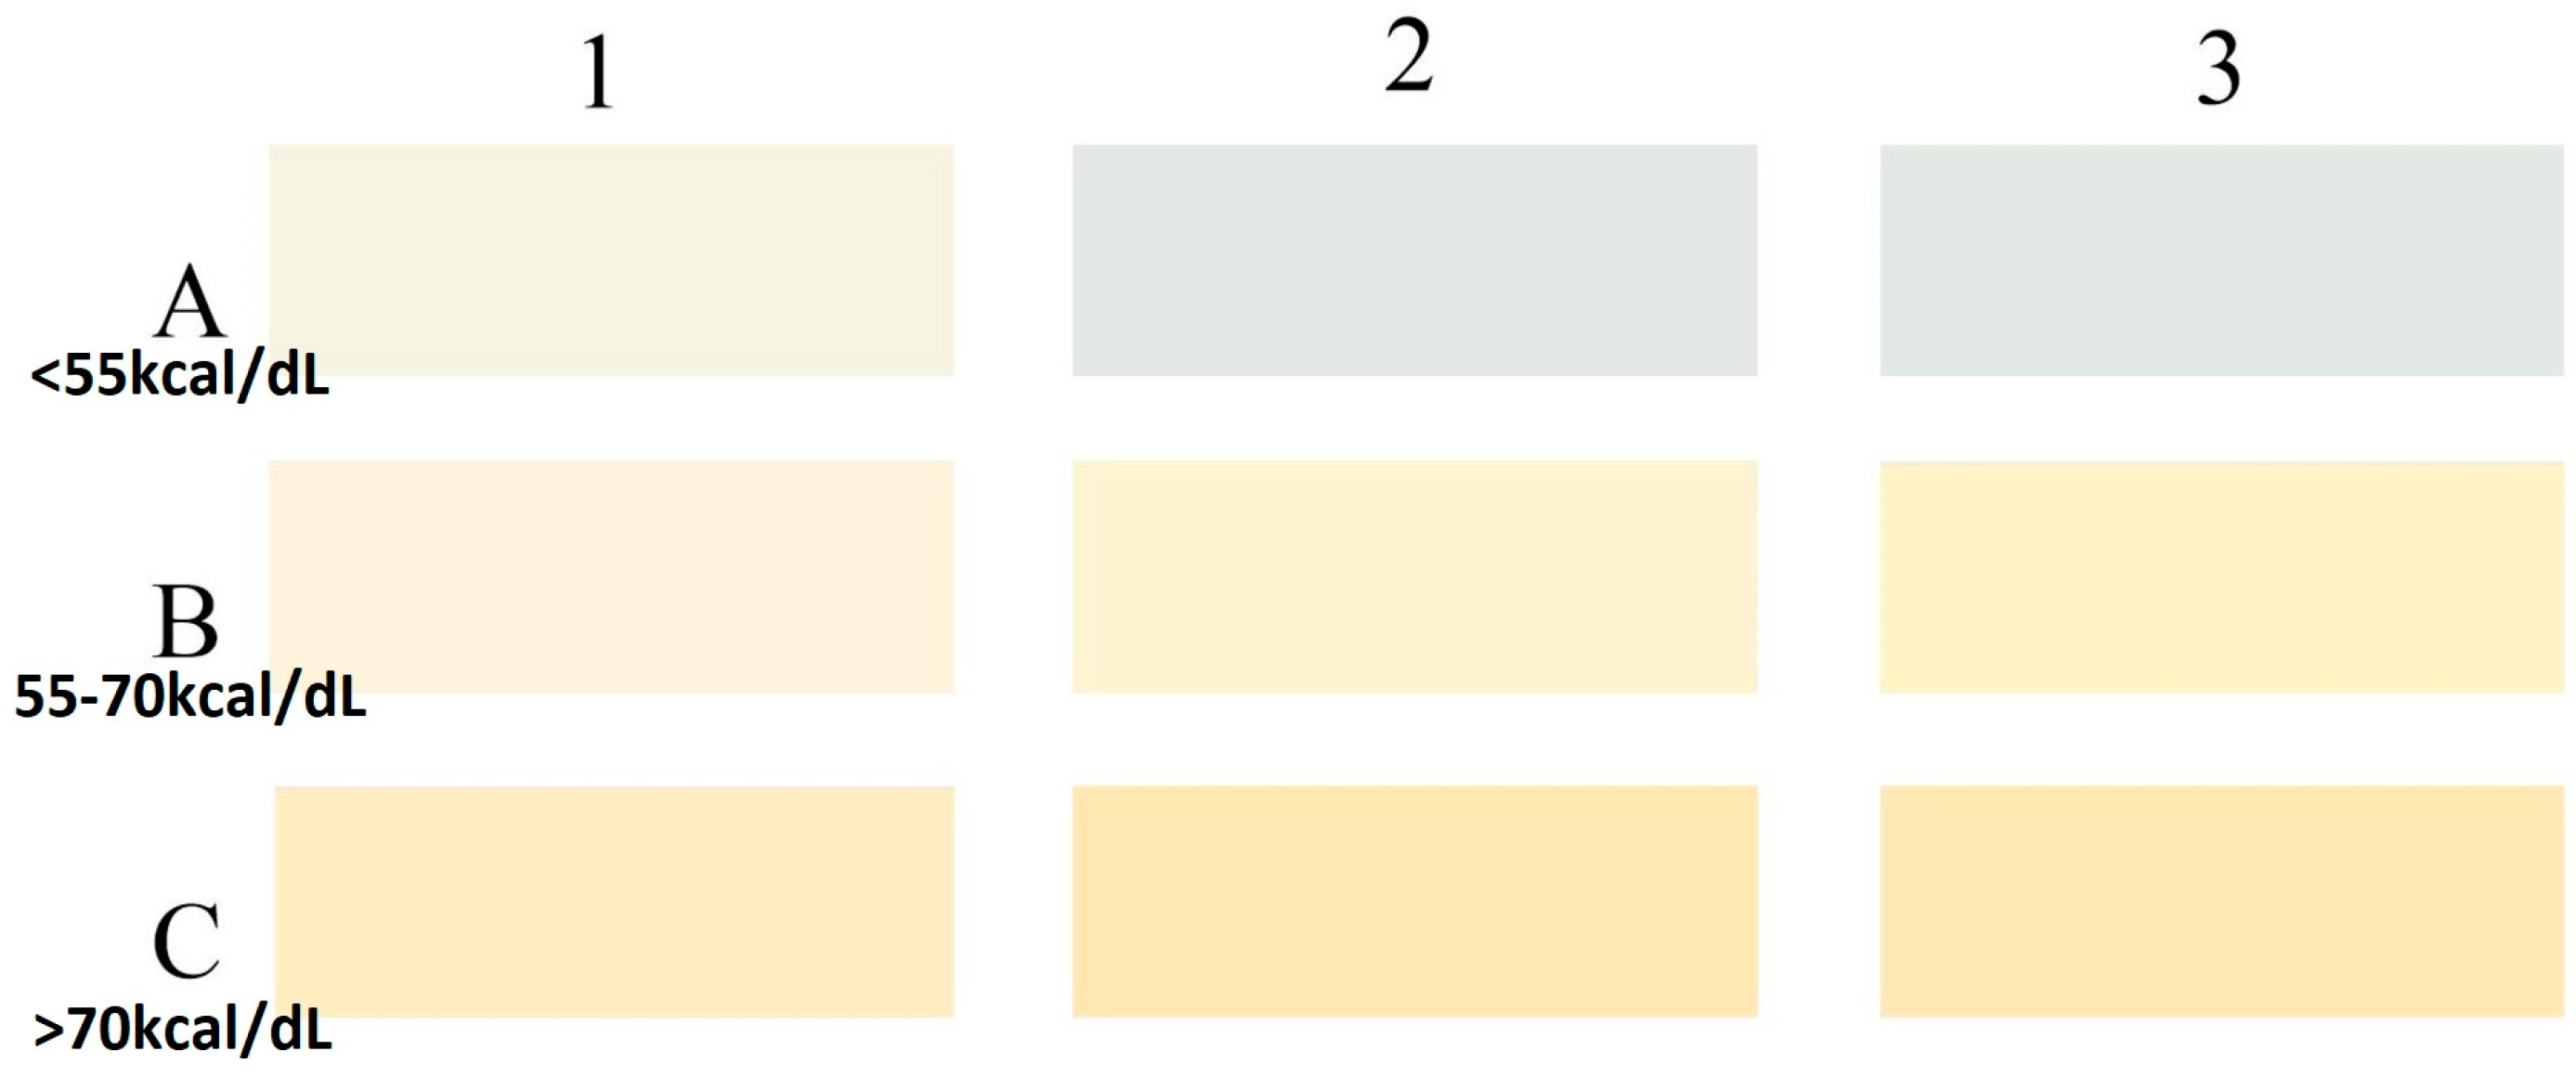
2.3. Development of HMCG Tool
2.4. Milk Collection and Color Coding
2.5. Milk Analysis
2.6. Sample Size and Statistical Analysis
3. Results
4. Discussion
5. Conclusions
Author Contributions
Funding
Institutional Review Board Statement
Informed Consent Statement
Data Availability Statement
Acknowledgments
Conflicts of Interest
References
- Victora, C.G.; Bahl, R.; Barros, A.J.D.; França, G.V.A.; Horton, S.; Krasevec, J.; Murch, S.; Sankar, M.J.; Walker, N.; Rollins, N.C. Breastfeeding in the 21st Century: Epidemiology, Mechanisms, and Lifelong Effect. Lancet 2016, 387, 475–490. [Google Scholar] [CrossRef] [Green Version]
- Sisk, P.M.; Lovelady, C.A.; Dillard, R.G.; Gruber, K.J.; O’Shea, T.M. Early Human Milk Feeding Is Associated with a Lower Risk of Necrotizing Enterocolitis in Very Low Birth Weight Infants. J. Perinatol. 2007, 27, 428–433. [Google Scholar] [CrossRef] [PubMed] [Green Version]
- Altobelli, E.; Angeletti, P.M.; Verrotti, A.; Petrocelli, R. The Impact of Human Milk on Necrotizing Enterocolitis: A Systematic Review and Meta-Analysis. Nutrients 2020, 12, 1322. [Google Scholar] [CrossRef]
- Vohr, B.R.; Poindexter, B.B.; Dusick, A.M.; McKinley, L.T.; Higgins, R.D.; Langer, J.C.; Poole, W.K. National Institute of Child Health and Human Development National Research Network Persistent Beneficial Effects of Breast Milk Ingested in the Neonatal Intensive Care Unit on Outcomes of Extremely Low Birth Weight Infants at 30 Months of Age. Pediatrics 2007, 120, e953–e959. [Google Scholar] [CrossRef] [Green Version]
- Vohr, B.R.; Poindexter, B.B.; Dusick, A.M.; McKinley, L.T.; Wright, L.L.; Langer, J.C.; Poole, W.K. NICHD Neonatal Research Network Beneficial Effects of Breast Milk in the Neonatal Intensive Care Unit on the Developmental Outcome of Extremely Low Birth Weight Infants at 18 Months of Age. Pediatrics 2006, 118, e115–e123. [Google Scholar] [CrossRef] [Green Version]
- Eidelman, A.I. Breastfeeding and the Use of Human Milk: An Analysis of the American Academy of Pediatrics 2012 Breastfeeding Policy Statement. Breastfeed Med. 2012, 7, 323–324. [Google Scholar] [CrossRef] [PubMed] [Green Version]
- Arslanoglu, S.; Moro, G.E.; Ziegler, E.E.; The Wapm Working Group On Nutrition. Optimization of Human Milk Fortification for Preterm Infants: New Concepts and Recommendations. J. Perinat. Med. 2010, 38, 233–238. [Google Scholar] [CrossRef]
- Brown, J.V.; Lin, L.; Embleton, N.D.; Harding, J.E.; McGuire, W. Multi-nutrient fortification of human milk for preterm infants. Cochrane Database Syst Rev. 2020, 6, CD000343. [Google Scholar] [CrossRef] [PubMed] [Green Version]
- Maggio, L.; Costa, S.; Gallini, F. Human Milk Fortifiers in Very Low Birth Weight Infants. Early Hum. Dev. 2009, 85, S59–S61. [Google Scholar] [CrossRef]
- Pillai, A.; Albersheim, S.G.; Berris, K.; Albert, A.Y.; Osiovich, H.; Elango, R. Corrected Fortification Approach Improves the Protein and Energy Content of Preterm Human Milk Compared with Standard Fixed-Dose Fortification. Arch. Dis. Child. Fetal Neonatal Ed. 2020, 106, 232–237. [Google Scholar] [CrossRef]
- Mimouni, F.B.; Lubetzky, R.; Yochpaz, S.; Mandel, D. Preterm Human Milk Macronutrient and Energy Composition: A Systematic Review and Meta-Analysis. Clin. Perinatol. 2017, 44, 165–172. [Google Scholar] [CrossRef]
- Maly, J.; Burianova, I.; Vitkova, V.; Ticha, E.; Navratilova, M.; Cermakova, E. Preterm Human Milk Macronutrient Concentration Is Independent of Gestational Age at Birth. Arch. Dis. Child. Fetal Neonatal Ed. 2019, 104, F50–F56. [Google Scholar] [CrossRef]
- Cooper, A.R.; Barnett, D.; Gentles, E.; Cairns, L.; Simpson, J.H. Macronutrient Content of Donor Human Breast Milk. Arch. Dis. Child. Fetal Neonatal Ed. 2013, 98, F539–F541. [Google Scholar] [CrossRef] [PubMed]
- Corvaglia, L.; Aceti, A.; Paoletti, V.; Mariani, E.; Patrono, D.; Ancora, G.; Capretti, M.G.; Faldella, G. Standard Fortification of Preterm Human Milk Fails to Meet Recommended Protein Intake: Bedside Evaluation by Near-Infrared-Reflectance-Analysis. Early Hum. Dev. 2010, 86, 237–240. [Google Scholar] [CrossRef] [PubMed]
- Ehrenkranz, R.A.; Dusick, A.M.; Vohr, B.R.; Wright, L.L.; Wrage, L.A.; Poole, W.K. Growth in the Neonatal Intensive Care Unit Influences Neurodevelopmental and Growth Outcomes of Extremely Low Birth Weight Infants. Pediatrics 2006, 117, 1253–1261. [Google Scholar] [CrossRef] [Green Version]
- Shah, P.S.; Wong, K.Y.; Merko, S.; Bishara, R.; Dunn, M.; Asztalos, E.; Darling, P.B. Postnatal Growth Failure in Preterm Infants: Ascertainment and Relation to Long-Term Outcome. J. Perinat. Med. 2006, 34, 484–489. [Google Scholar] [CrossRef] [PubMed]
- Barreault, S.; Bellanger, A.; Berneau, P.; de La Pintiere, A.; Lallemant, C.; Beuchee, A. Impact of Early Protein and Energy Intakes on Neurodevelopment at 2 Years of Corrected Age in Very Low Birth Weight Infants: A Single-Center Observational Study. PLoS ONE 2019, 14, e0218887. [Google Scholar] [CrossRef] [Green Version]
- Arslanoglu, S.; Moro, G.E.; Ziegler, E.E. Adjustable Fortification of Human Milk Fed to Preterm Infants: Does It Make a Difference? J. Perinatol. 2006, 26, 614–621. [Google Scholar] [CrossRef] [Green Version]
- Arslanoglu, S.; Bertino, E.; Coscia, A.; Tonetto, P.; Giuliani, F.; Moro, G.E. Update of Adjustable Fortification Regimen for Preterm Infants: A New Protocol. J. Biol. Regul. Homeost. Agents 2012, 26, 65–67. [Google Scholar]
- Rochow, N.; Fusch, G.; Choi, A.; Chessell, L.; Elliott, L.; McDonald, K.; Kuiper, E.; Purcha, M.; Turner, S.; Chan, E.; et al. Target Fortification of Breast Milk with Fat, Protein, and Carbohydrates for Preterm Infants. J. Pediatr. 2013, 163, 1001–1007. [Google Scholar] [CrossRef]
- Radmacher, P.G.; Lewis, S.L.; Adamkin, D.H. Individualizing Fortification of Human Milk Using Real Time Human Milk Analysis. J. Neonatal Perinatal Med. 2013, 6, 319–323. [Google Scholar] [CrossRef] [PubMed]
- Morlacchi, L.; Mallardi, D.; Giannì, M.L.; Roggero, P.; Amato, O.; Piemontese, P.; Consonni, D.; Mosca, F. Is Targeted Fortification of Human Breast Milk an Optimal Nutrition Strategy for Preterm Infants? An Interventional Study. J. Transl. Med. 2016, 14, 195. [Google Scholar] [CrossRef] [PubMed] [Green Version]
- Rochow, N.; Fusch, G.; Ali, A.; Bhatia, A.; So, H.Y.; Iskander, R.; Chessell, L.; el Helou, S.; Fusch, C. Individualized Target Fortification of Breast Milk with Protein, Carbohydrates, and Fat for Preterm Infants: A Double-Blind Randomized Controlled Trial. Clin. Nutr. 2021, 40, 54–63. [Google Scholar] [CrossRef]
- de Halleux, V.; Pieltain, C.; Senterre, T.; Studzinski, F.; Kessen, C.; Rigo, V.; Rigo, J. Growth Benefits of Own Mother’s Milk in Preterm Infants Fed Daily Individualized Fortified Human Milk. Nutrients 2019, 11, 772. [Google Scholar] [CrossRef] [Green Version]
- Ramey, S.R.; Merlino Barr, S.; Moore, K.A.; Groh-Wargo, S. Exploring Innovations in Human Milk Analysis in the Neonatal Intensive Care Unit: A Survey of the United States. Front. Nutr. 2021, 8, 692600. [Google Scholar] [CrossRef]
- Solah, V.A.; Staines, V.; Honda, S.; Limley, H.A. Measurement of Milk Color and Composition: Effect of Dietary Intervention on Western Australian Holstein-Friesian Cow’s Milk Quality. J. Food Sci. 2007, 72, S560–S566. [Google Scholar] [CrossRef]
- Wang, C.D.; Chu, P.S.; Mellen, B.G.; Shenai, J.P. Creamatocrit and the Nutrient Composition of Human Milk. J. Perinatol. 1999, 19, 343–346. [Google Scholar] [CrossRef] [PubMed] [Green Version]
- McDermott, A.; Visentin, G.; McParland, S.; Berry, D.P.; Fenelon, M.A.; De Marchi, M. Effectiveness of Mid-Infrared Spectroscopy to Predict the Color of Bovine Milk and the Relationship between Milk Color and Traditional Milk Quality Traits. J. Dairy Sci. 2016, 99, 3267–3273. [Google Scholar] [CrossRef] [PubMed] [Green Version]
- Kavouras, S.A.; Johnson, E.C.; Bougatsas, D.; Arnaoutis, G.; Panagiotakos, D.B.; Perrier, E.; Klein, A. Validation of a Urine Color Scale for Assessment of Urine Osmolality in Healthy Children. Eur. J. Nutr. 2016, 55, 907–915. [Google Scholar] [CrossRef] [Green Version]
- Hsiao, C.-H.; Chang, M.-H.; Chen, H.-L.; Lee, H.-C.; Wu, T.-C.; Lin, C.-C.; Yang, Y.-J.; Chen, A.-C.; Tiao, M.-M.; Lau, B.-H.; et al. Universal Screening for Biliary Atresia Using an Infant Stool Color Card in Taiwan. Hepatology 2008, 47, 1233–1240. [Google Scholar] [CrossRef]
- Schreiber, R.A.; Masucci, L.; Kaczorowski, J.; Collet, J.P.; Lutley, P.; Espinosa, V.; Bryan, S. Home-Based Screening for Biliary Atresia Using Infant Stool Colour Cards: A Large-Scale Prospective Cohort Study and Cost-Effectiveness Analysis. J. Med. Screen. 2014, 21, 126–132. [Google Scholar] [CrossRef] [PubMed] [Green Version]
- Ingram, C.F.; Lewis, S.M. Clinical Use of WHO Haemoglobin Colour Scale: Validation and Critique. J. Clin. Pathol. 2000, 53, 933–937. [Google Scholar] [CrossRef] [Green Version]
- Marn, H.; Critchley, J.A. Accuracy of the WHO Haemoglobin Colour Scale for the Diagnosis of Anaemia in Primary Health Care Settings in Low-Income Countries: A Systematic Review and Meta-Analysis. Lancet Glob. Health 2016, 4, e251–e265. [Google Scholar] [CrossRef] [PubMed] [Green Version]
- Explore Paint Colors for Your Home. Available online: https://www.behr.com/consumer/colors/paint-colors (accessed on 27 April 2022).
- Parat, S.; Groh-Wargo, S.; Merlino, S.; Wijers, C.; Super, D.M. Validation of Mid-Infrared Spectroscopy for Macronutrient Analysis of Human Milk. J. Perinatol. Off. J. Calif. Perinat. Assoc. 2017, 37, 822–826. [Google Scholar] [CrossRef]
- Casadio, Y.S.; Williams, T.M.; Lai, C.T.; Olsson, S.E.; Hepworth, A.R.; Hartmann, P.E. Evaluation of a Mid-Infrared Analyzer for the Determination of the Macronutrient Composition of Human Milk. J. Hum. Lact. 2010, 26, 376–383. [Google Scholar] [CrossRef]
- Fusch, G.; Rochow, N.; Choi, A.; Fusch, S.; Poeschl, S.; Ubah, A.O.; Lee, S.-Y.; Raja, P.; Fusch, C. Rapid Measurement of Macronutrients in Breast Milk: How Reliable Are Infrared Milk Analyzers? Clin. Nutr. 2015, 34, 465–476. [Google Scholar] [CrossRef] [Green Version]
- Bujang, M.A.; Adnan, T.H. Requirements for Minimum Sample Size for Sensitivity and Specificity Analysis. J. Clin. Diagn. Res. 2016, 10, YE01–YE06. [Google Scholar] [CrossRef]
- Zapf, A.; Castell, S.; Morawietz, L.; Karch, A. Measuring Inter-Rater Reliability for Nominal Data—Which Coefficients and Confidence Intervals Are Appropriate? BMC Med. Res. Methodol. 2016, 16, 93. [Google Scholar] [CrossRef] [Green Version]
- Kwan, C.; Fusch, G.; Rochow, N.; Fusch, C.; MAMAS Study collaborators. Milk Analysis Using Milk Analyzers in a Standardized Setting (MAMAS) Study: A Multicentre Quality Initiative. Clin. Nutr. 2020, 39, 2121–2128. [Google Scholar] [CrossRef]
- ESPGHAN Committee on Nutrition; Arslanoglu, S.; Corpeleijn, W.; Moro, G.; Braegger, C.; Campoy, C.; Colomb, V.; Decsi, T.; Domellöf, M.; Fewtrell, M.; et al. Donor Human Milk for Preterm Infants: Current Evidence and Research Directions. J. Pediatr. Gastroenterol. Nutr. 2013, 57, 535–542. [Google Scholar] [CrossRef] [PubMed]
- Klotz, D.; Jansen, S.; Glanzmann, R.; Haiden, N.; Fuchs, H.; Gebauer, C. Donor Human Milk Programs in German, Austrian and Swiss Neonatal Units—Findings from an International Survey. BMC Pediatr. 2020, 20, 235. [Google Scholar] [CrossRef]
- Piemontese, P.; Mallardi, D.; Liotto, N.; Tabasso, C.; Menis, C.; Perrone, M.; Roggero, P.; Mosca, F. Macronutrient Content of Pooled Donor Human Milk before and after Holder Pasteurization. BMC Pediatr. 2019, 19, 58. [Google Scholar] [CrossRef] [PubMed]
- Wojcik, K.Y.; Rechtman, D.J.; Lee, M.L.; Montoya, A.; Medo, E.T. Macronutrient Analysis of a Nationwide Sample of Donor Breast Milk. J. Am. Diet Assoc. 2009, 109, 137–140. [Google Scholar] [CrossRef]
- Fu, T.T.; Schroder, P.E.; Poindexter, B.B. Macronutrient Analysis of Target-Pooled Donor Breast Milk and Corresponding Growth in Very Low Birth Weight Infants. Nutrients 2019, 11, 1884. [Google Scholar] [CrossRef] [PubMed] [Green Version]
- Vieira, A.A.; Soares, F.V.M.; Pimenta, H.P.; Abranches, A.D.; Moreira, M.E.L. Analysis of the Influence of Pasteurization, Freezing/Thawing, and Offer Processes on Human Milk’s Macronutrient Concentrations. Early Hum. Dev. 2011, 87, 577–580. [Google Scholar] [CrossRef]
- Embleton, N.D.; Wood, C.L.; Pearce, M.S.; Brunskill, G.; Grahame, V. Early Diet in Preterm Infants and Later Cognition: 10-Year Follow-up of a Randomized Controlled Trial. Pediatr. Res. 2021, 89, 1442–1446. [Google Scholar] [CrossRef]
- Tongo, O.O.; Olwala, M.A.; Talbert, A.W.; Nabwera, H.M.; Akindolire, A.E.; Otieno, W.; Nalwa, G.M.; Andang’o, P.E.A.; Mwangome, M.K.; Abdulkadir, I.; et al. Enteral Feeding Practices for Very Preterm and Very Low Birth Weight Infants in Nigeria and Kenya. Front. Pediatr. 2022, 10, 892209. [Google Scholar] [CrossRef] [PubMed]
- Singh, A.; Murki, S.; Sharma, D.; Vardhelli, V.; Subramanian, S.; Mekarthi, A. Development and Evaluation of a Novel Method “Bilirubin Color Card” for Screening of Treatable Jaundice in Neonates: Prospective Comparative Diagnostic Study. J. Matern. Fetal Neonatal. Med. 2022, 35, 9830–9833. [Google Scholar] [CrossRef]
- Milovanovic, B.; Djekic, I.; Miocinovic, J.; Djordjevic, V.; Lorenzo, J.M.; Barba, F.J.; Mörlein, D.; Tomasevic, I. What Is the Color of Milk and Dairy Products and How Is It Measured? Foods 2020, 9, 1629. [Google Scholar] [CrossRef]
- Zaidi, Y.; Stroh, R.; Moran, N.E. Systematic Review of Carotenoid Concentrations in Human Milk and Infant Blood. Nutr. Rev. 2022, 80, nuac018. [Google Scholar] [CrossRef] [PubMed]
- Thajer, A.; Fusch, G.; Binder, C.; Berger, A.; Fusch, C. Human Milk Analyser Underestimated Protein Content of Unfortified and Fortified Samples Compared to Elemental Analysis. Acta Paediatr. 2019, 108, 2298–2300. [Google Scholar] [CrossRef] [PubMed] [Green Version]

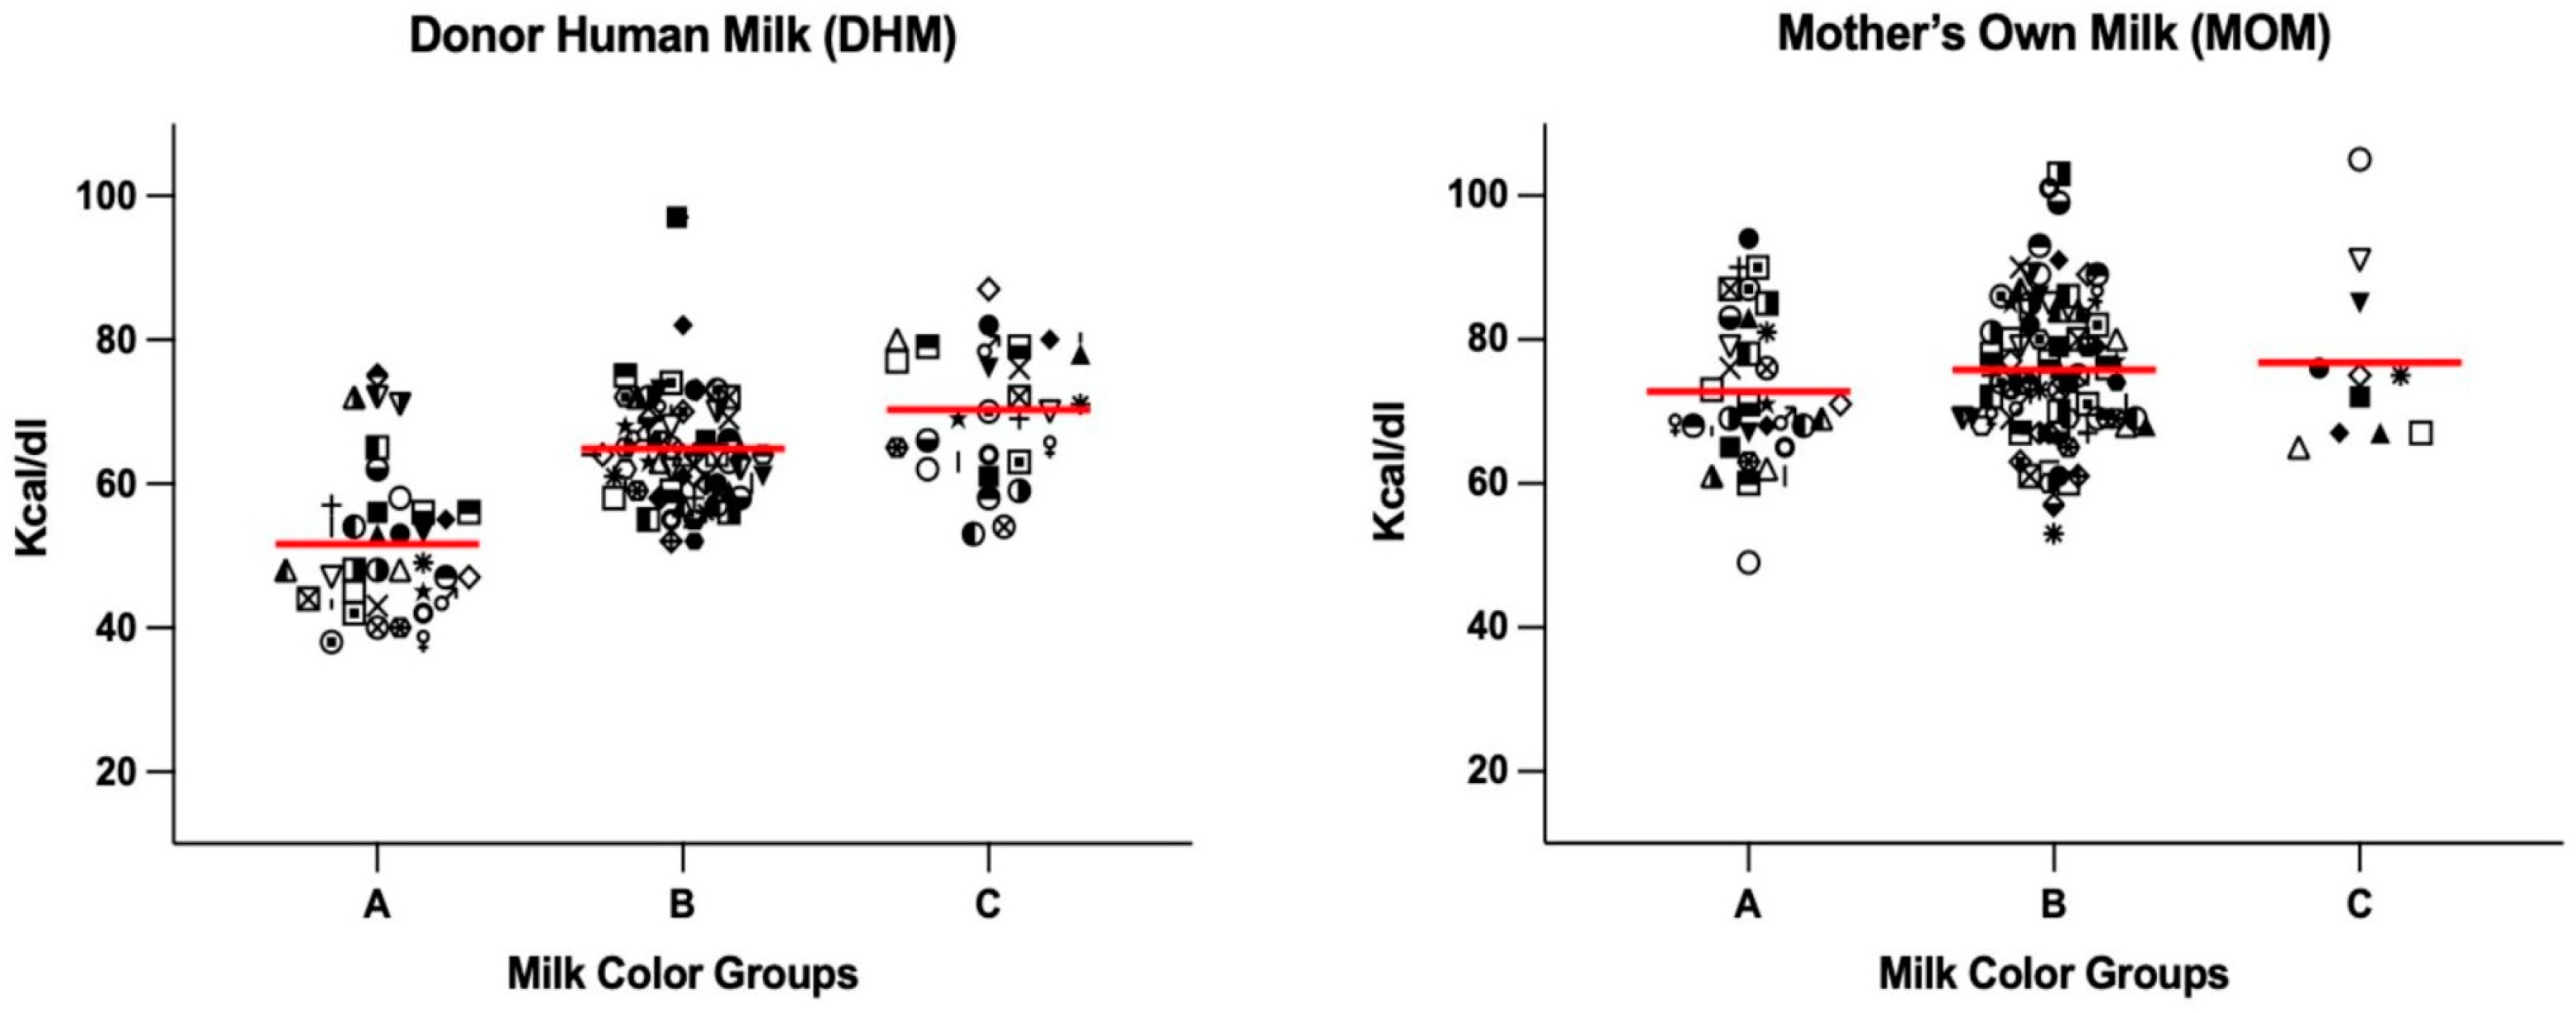
| Calorie Range (kcal/100 mL) | DHM (n = 136) | MOM (n = 131) |
|---|---|---|
| <55 (n, %) | 30 (22.1%) | 2 (1.5%) |
| 55–70 (n, %) | 72 (52.9%) | 49 (37.1%) |
| >70 (n, %) | 34 (25.0%) | 80 (60.6%) |
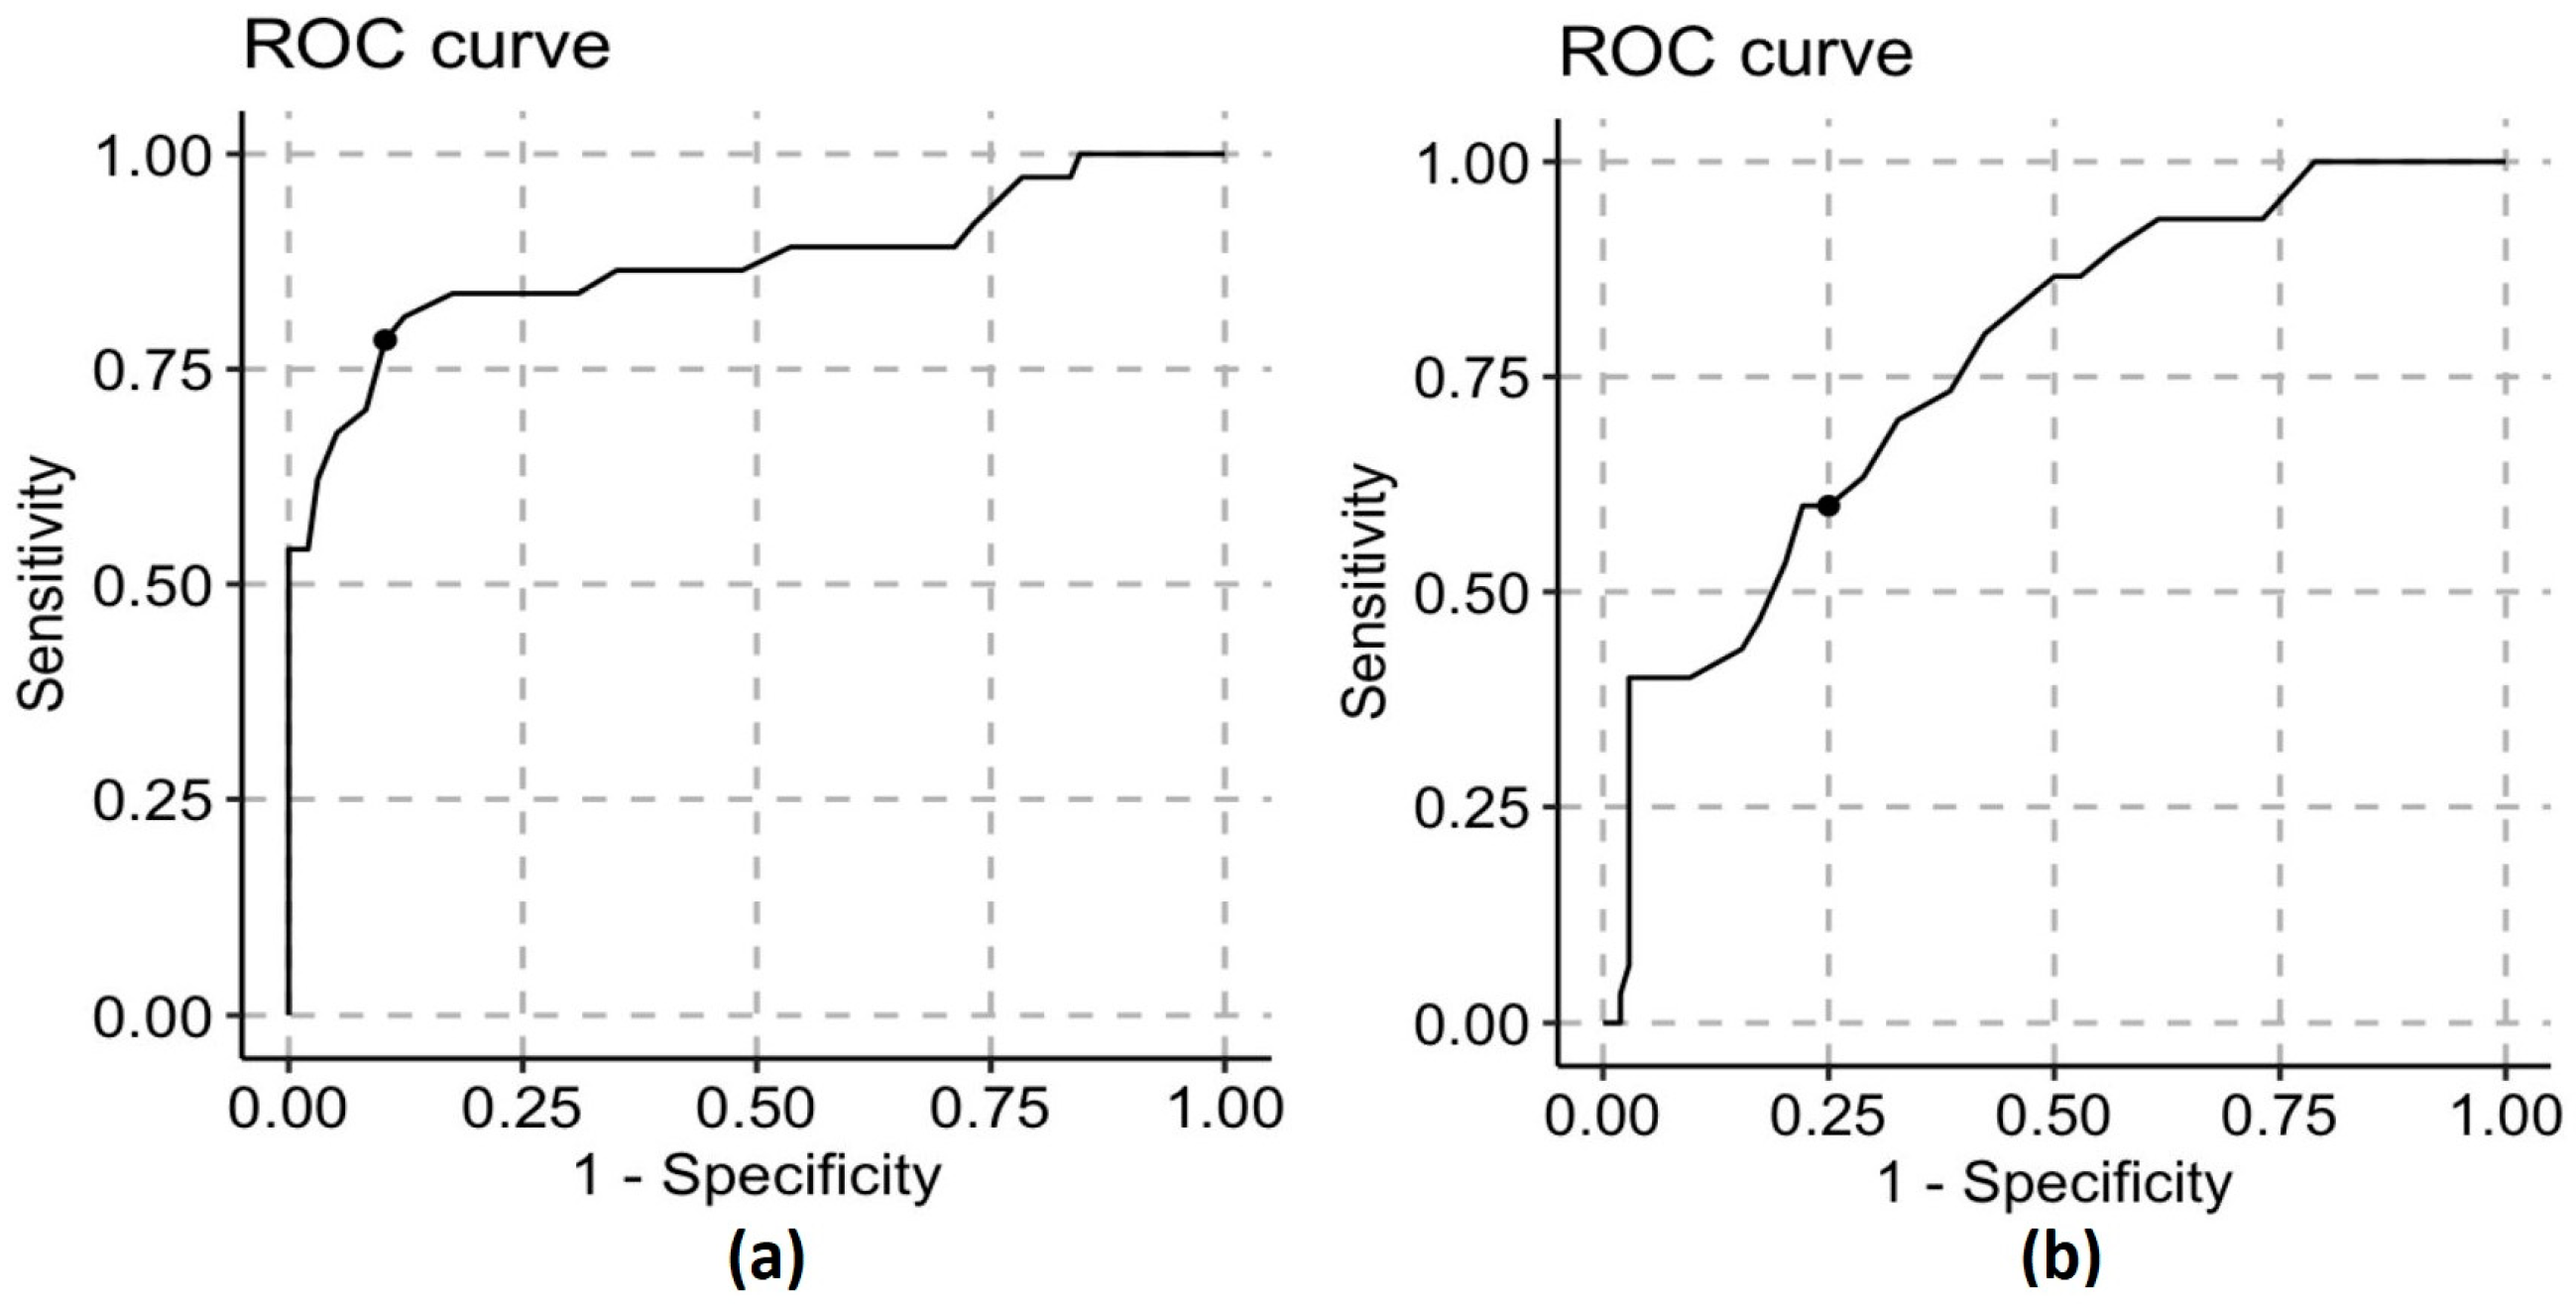
| DHM | A (<55 kcal/dL) | B (55–70 kcal/dL) | C (>70 kcal/dL) |
|---|---|---|---|
| Sensitivity | 0.83 | 0.69 | 0.44 |
| Specificity | 0.84 | 0.70 | 0.82 |
| PPV | 0.68 | 0.75 | 0.47 |
| NPV | 0.93 | 0.64 | 0.81 |
| MOM | A | B | C |
| Sensitivity | 0.50 | 0.59 | 0.09 |
| Specificity | 0.52 | 0.12 | 0.88 |
| PPV | 0.03 | 0.34 | 0.64 |
| NPV | 0.97 | 0.29 | 0.29 |
| DHM | A | B | C |
|---|---|---|---|
| <55 (kcal/100 mL) | 25 (67.6%) | 3 (4.4%) | 2 (6.4%) |
| 55–70 (kcal/100 mL) | 8 (21.6%) | 50 (73.5%) | 14 (45.1%) |
| >70 (kcal/100 mL) | 4 (10.8%) | 15 (22.0%) | 15 (48.3%) |
| MOM | A | B | C |
| <55 (kcal/100 mL) | 1 (2.9%) | 1 (1.1%) | 0 (0.0%) |
| 55–70 (kcal/100 mL) | 16 (47.1%) | 29 (33.3%) | 4 (36.4%) |
| >70 (kcal/100 mL) | 17 (50.0%) | 56 (64.4%) | 7 (63.6%) |
| DHM | A | B | C | p Value |
|---|---|---|---|---|
| Fat (g/100 mL) | 1.6 (0.8) a | 3.4 (1.0) b | 3.9 (1.0) c | <0.0001 |
| Protein (g/100 mL) | 1.1 (0.1) a | 1.1 (0.3) a | 1.4 (0.5) b | 0.0001 |
| Carbohydrate (g/100 mL) | 7.3 (0.3) a | 7.2 (0.4) a | 6.9 (0.4) b | 0.002 |
| MOM | A | B | C | |
| Fat (g/100 mL) | 4.2 (1.2) | 4.5 (1.1) | 4.6 (1.4) | 0.40 |
| Protein (g/100 mL) | 0.8 (0.1) | 0.9 (0.3) | 1.0 (0.2) | 0.20 |
| Carbohydrate (g/100 mL) | 7.2 (0.2) | 7.2 (0.2) | 7.1 (0.2) | 0.26 |
Disclaimer/Publisher’s Note: The statements, opinions and data contained in all publications are solely those of the individual author(s) and contributor(s) and not of MDPI and/or the editor(s). MDPI and/or the editor(s) disclaim responsibility for any injury to people or property resulting from any ideas, methods, instructions or products referred to in the content. |
© 2023 by the authors. Licensee MDPI, Basel, Switzerland. This article is an open access article distributed under the terms and conditions of the Creative Commons Attribution (CC BY) license (https://creativecommons.org/licenses/by/4.0/).
Share and Cite
Pillai, A.; Albersheim, S.; Niknafs, N.; Maugo, B.; Rasmussen, B.; Lam, M.; Grewal, G.; Albert, A.; Elango, R. Human Milk Calorie Guide: A Novel Color-Based Tool to Estimate the Calorie Content of Human Milk for Preterm Infants. Nutrients 2023, 15, 1866. https://doi.org/10.3390/nu15081866
Pillai A, Albersheim S, Niknafs N, Maugo B, Rasmussen B, Lam M, Grewal G, Albert A, Elango R. Human Milk Calorie Guide: A Novel Color-Based Tool to Estimate the Calorie Content of Human Milk for Preterm Infants. Nutrients. 2023; 15(8):1866. https://doi.org/10.3390/nu15081866
Chicago/Turabian StylePillai, Anish, Susan Albersheim, Nikoo Niknafs, Brian Maugo, Betina Rasmussen, Mei Lam, Gurpreet Grewal, Arianne Albert, and Rajavel Elango. 2023. "Human Milk Calorie Guide: A Novel Color-Based Tool to Estimate the Calorie Content of Human Milk for Preterm Infants" Nutrients 15, no. 8: 1866. https://doi.org/10.3390/nu15081866
APA StylePillai, A., Albersheim, S., Niknafs, N., Maugo, B., Rasmussen, B., Lam, M., Grewal, G., Albert, A., & Elango, R. (2023). Human Milk Calorie Guide: A Novel Color-Based Tool to Estimate the Calorie Content of Human Milk for Preterm Infants. Nutrients, 15(8), 1866. https://doi.org/10.3390/nu15081866