Article

Anti-cariogenic Properties of Lactobacillus plantarum in the Utilization of Galacto-Oligosaccharide

1
Eastman Institute for Oral Health, University of Rochester Medical Center, Rochester, NY 14642, USA
2
School of Stomatology, Henan University, Zhengzhou 450046, China
3
School of Arts and Science, University of Rochester, Rochester, NY 14627, USA
4
Department of Biostatistics and Computational Biology, University of Rochester Medical Center, Rochester, NY 14642, USA
*
Authors to whom correspondence should be addressed.
These authors contributed equally to this work.
Nutrients 2023, 15(9), 2017; https://doi.org/10.3390/nu15092017
Submission received: 30 March 2023 / Revised: 13 April 2023 / Accepted: 19 April 2023 / Published: 22 April 2023
(This article belongs to the Section Prebiotics and Probiotics)

Abstract

:
Ecological approaches can help to correct oral microbial dysbiosis and drive the advent and persistence of a symbiotic oral microbiome, which benefits long-term dental caries control. The aim of this study was to investigate the impact of the prebiotic Galacto-oligosaccharide (GOS) on the growth of probiotics L. plantarum 14,917 and its effect on the inhibitory ability of L. plantarum 14,917 against the growth of Streptococcus mutans and Candida albicans in an in vitro model. Single-species growth screenings were conducted in TSBYE broth with 1% glucose and 1–5% GOS. Interaction experiments were performed using duo- and multi-species models with inoculation of 105 CFU/mL S. mutans, 103 CFU/mL C. albicans, and 108 CFU/mL L. plantarum 14,917 under 1%, 5% GOS or 1% glucose. Viable cells and pH changes were measured. Real-time PCR was utilized to assess expression of C. albicans and S. mutans virulence genes. Six replicates were used for each group. Student’s t-test, one-way ANOVA, and Kruskal-Wallis were employed to compare the outcomes of different groups. GOS significantly inhibited the growth of C. albicans and S. mutans in terms of growth quantity and speed when the two strains were grown individually. However, GOS did not affect the growth of L. plantarum 14,917. Moreover, 1% and 5% GOS enhanced the anti-fungal performance of L. plantarum 14,917 in comparison to 1% glucose. GOS as the carbon source resulted in a less acidic environment in the C. albicans and S. mutans duo-species model and multispecies model where L. plantarum 14,917 was added. When GOS was utilized as the carbohydrate substrate, S. mutans and C. albicans had a significant reduction in the expression of the HWP1, ECE1, atpD, and eno genes (p < 0.05). To our knowledge, this is the first study that reported the ability of GOS to neutralize S. mutans-C. albicans high caries of medium pH and to disrupt virulence gene expression. Moreover, as a prebiotic, GOS augmented the inhibitory ability of L. plantarum against C. albicans in vitro. The current study revealed the anti-caries potential of prebiotics GOS and shed light on novel caries prevention strategies from the perspective of prebiotics and probiotics. These findings provide a rationale for future biofilm or clinical studies to elucidate the effect of GOS on modulating oral microbiota and caries control.

1. Introduction

Dental caries are transmissible and biofilm-dependent infectious diseases. They could cause acute/chronic pain and diminish the quality of life of those involved [1,2]. The imbalance of oral microbial as one of the caries etiologies has been well acknowledged [3]. Streptococcus mutans is a well known pathogenic microorganism for dental caries with strong acidogenic and aciduric capacities [4,5]. Moreover, S. mutans can adhere to the tooth surface through the production of extracellular glucans via glucosyltransferases [5]. Candida albicans is a fungus commonly found in oral cavities of children and root caries. Children with oral C. albicans have been found to have higher odds of experiencing early childhood caries (ECC) compared to children without C. albicans [6]. The toxicity of plaque-biofilms is amplified by symbiotic cross-kingdom interactions between S. mutans and C. albicans in multiple in vivo and in vitro studies [7,8,9]. Furthermore, this kind of interaction can potentially enhance biofilm resistance to human saliva [8] with glucosyltransferases B (GtfB), a bacterial exoenzyme from S. mutans, which unevenly, but stably, binds to mannoproteins on the C. albicans surface.
A healthy oral microbiome plays a crucial role in controlling oral diseases, such as dental caries and periodontal disease. Ecological approaches can help correct microbial dysbiosis and drive the advent and persistence of a symbiotic oral microbiome, which benefits long-term caries control [10]. As one of the probiotic Lactobacilli species, Lactobacillus plantarum had an inhibitory effect on the growth of C. albicans and S. mutans in planktonic and biofilm conditions and in animal models [11,12,13,14]. However, ideal conditions that facilitate and maximize the role of L. plantarum remain to be elucidated. Previous studies commonly used sucrose as the sugar resource to simulate and trigger high-risk conditions of dental caries. However, it is not known how the role of L. plantarum will be affected by using different sugary substrates.
Galacto-oligosaccharides (GOSs) are chains of galactose molecules with multiple health benefits. GOS is a type of prebiotic that is defined as “a substrate which is selectively utilized by the host gut microflora which confers health benefit” [15]. It can enhance the growth and activity of probiotics selectively [16]. GOS is presently one of the most favored prebiotics used in commercial infant formula to imitate the beneficial effects of the human milk oligosaccharides (HMOs) in breast milk [17]. Infants fed with GOS-enriched formula have a comparable development gut microbiome to those fed by breast milk [18,19]. Several studies have reported the beneficial effects of GOS on the intestinal system [20,21]. The benefits include acting as soluble decoy receptors to prevent the adhesion of pathogens to epithelial cells, stimulating tight junctions, and enhancing intestinal barrier function via modulation of goblet cells [20].
L. plantarum is capable of utilizing GOS as a source of energy. Previous research has shown that consuming GOS can help to increase the levels of beneficial bacteria in the gut, including L. plantarum; however, the utilization of prebiotics and the effect of prebiotics on the growth of L. plantarum differs by strains [22,23,24,25,26]. A recent study assessed the utilization of GOS by 21 L. plantarum strains. Additionally, all L. plantarum strains grew relatively well in media supplemented with GOS [23].
To our best knowledge, until now, no studies have reported whether GOS could enhance or reduce the inhibitory ability of L. plantarum on the growth of C. albicans and S. mutans. The exact impact of GOS on the inhibitory ability of L. plantarum may depend on various factors, such as the specific strain of L. plantarum, the concentration of GOS, and the growth conditions. The current study aimed to investigate the impact of prebiotics GOS on the growth of probiotics L. plantarum 14,917 and the GOS’s effect on the inhibitory ability of L. plantarum 14,917 against the growth of S. mutans and C. albicans in an in vitro model. This study may stimulate greater interest in the use of synbiotics, prebiotics, and probiotics in dentistry and justify additional research into the efficacy of GOS and L. plantarum 14,917 on caries prevention using a multi-species biofilm model in vitro and through clinical investigations.

2. Materials and Methods

2.1. Microorganisms and GOS

The microorganisms used in this study are lab strains, S. mutans UA159C. albicans 5314, and L. plantarum ATCC 14,917. We selected L. plantarum ATCC 14,917 because the effectiveness of this strain on inhibiting the growth of S. mutans and C. albicans in planktonic or multispecies biofilms models had been verified previously by us [14,27]. The GOS used in this study was purchased from BOS Science (New York, NY, USA).

2.2. Starter Preparation

YPD agar (BD Difco™, San Jose, CA, USA, 242,720), blood agar (TSA with sheep blood, Thermo Scientific™, Waltham, MA, USA, R01202), and MRS agar (BD Difco™, 288,210) were used to recover C. albicans, S. mutans, and L. plantarum from frozen stock, respectively. Following a 48-h incubation period, overnight incubation (5% CO2, 37 °C) was conducted by inoculating three to five colonies of each species into 10 mL of broth. YPD broth (BD Difco™, 242,820) was used to grow C. albicans; TSBYE broth (3% Tryptic Soy, 0.5% Yeast Extract Broth, BD Bacto™ 286,220 and Gibco™ 212,750) with 1% (w/v) glucose was used to grow S. mutans; and L. plantarum was cultivated in MRS broth (BD Difco™, 288,130). On the following day, 0.5 mL of the overnight starters were added to individual glass tubes containing fresh broth and incubated for 3–4 h to reach the mid-exponential phase with desirable optical density (OD). The morning starters were then prepared for the subsequent establishment of growth screening assays and planktonic models delineated below.

2.3. Screening for Microorganisms’ Growth in GOS

The culture medium was prepared with TSBYE broth and supplemented with 1–5% (w/v) GOS or 1% glucose as control groups. The morning starters (with desirable OD) of S. mutans, C. albicans, and L. plantarum were diluted with the culture medium prepared above to reach the desirable concentration, respectively (C. albicans of 105 CFU/mL, S. mutans, and L. plantarum of 108 CFU/mL). An amount of 200 µL of culture of each species with different culture medium were distributed in the 96-well plates (Corning, Inc., Corning, NY, USA) and incubated for 20 h at 37 °C in ten replicates. Non-inoculated wells were included as blank controls in triplicate. The OD at 600 nm (OD600) and pH value were measured every 1 h for the first 8 h and at 20 h. During the exponential phase, maximum specific growth rates (µmax) were calculated through linear regressions of the plots of ln (OD600) versus time [24].

2.4. Planktonic Model

The starting concentrations of S. mutans (105 CFU/mL) and C. albicans (103 CFU/mL) were selected to simulate a clinical setting with high-caries risk. The inoculation quantity of L. plantarum (108 CFU/mL) was chosen because it was the working concentration of L. plantarum 14,917 that demonstrated inhibitory effects on the growth of S. mutans and C. albicans based on the previous study [14]. Single-, duo-, and multi-species conditions of S. mutans, C. albicans, and L. plantarum were cultivated in 10 mL TSBYE broth with 1%, 5% GOS, or 1% glucose for 20 h (5% CO2, 37 °C). Microorganisms grown in TSBYE broth with 1% glucose were used as the control. The assessment of microbial growth was conducted at 0, 6, and 20 h through the utilization of blood agar. Concurrently, the pH values of the culture media were measured at 0, 2, 4, 6, and 20 h.

2.5. Assessment of Morphology of C. albicans

C. albicans morphological changes were evaluated by observing the planktonic culture medium at 20 h using a light microscope (Olympus BX43, 214, Tokyo, Japan) with a 100X oil objective (Olympus UPlanFL N 100X, Tokyo, Japan). A volume of 20 µL of the culture medium was deposited on a glass slide and observed without staining.

2.6. Quantitative Real-Time Polymerase Chain Reaction (qRT-PCR)

At 20 h, 4 mL culture suspensions from the above planktonic model were collected for RNA exaction. Complementary DNA was synthesized by using 0.2 µg of purified RNA as a template and the BioRad iScript cDNA synthesis kit (Bio-Rad Laboratories, Inc., Hercules, CA, USA). Applied BiosystemsTM PowerTrackTM SYBR Green Master Mix and a QuantStudioTM 3 Real-Time PCR System were utilized to amplify cDNA and negative control samples (Thermo Fisher Scientific, Wilmington, DE, USA). In each 20 µL reaction, cDNA, 10 µM of each primer, and a 2× SYBR-Green mix (SYBR-Green and Taq DNA Polymerase) were present. gyrA [28], ACT1, and rpob were used as internal reference genes for S. mutans, C. albicans, and L. plantarum, respectively. The comparative CT method was applied to the data analysis [29]. The genes and primers used are listed in Table S1.

2.7. Statistical Analysis

Statistical analyses were performed using SPSS Statistics, version 28 (SPSS Inc., Chicago, IL, USA). CFU values were converted to natural log values, and zero values remained unchanged. Shapiro–Wilk normality tests with a 95% confidence interval were used to examine if data sets were normally distributed. For data exhibiting normal distribution, the comparisons between two groups were conducted using a t-test, while one-way ANOVA, followed by a post hoc test, was used for comparisons involving more than two groups. For data exhibiting non-normal distribution, Mann-Whitney was employed for two groups comparison, and Kruskal-Wallis was used for comparisons of more than two groups. A p-value less than 0.05 was considered statistically significant.

3. Results

3.1. Impact of Prebiotics GOS on Individual Growth of S. mutans, C. albicans, and L. plantarum

By monitoring the optical density (OD) at 600 nm over the period of 20 h, the growth of S. mutans UA159, C. albicans 5314, and L. plantarum ATCC 14,917 strains in the presence of 1–5% GOS and 1% glucose was evaluated. Figure 1 displays the growth curves, µmax, and pH variations.
GOS significantly impeded the growth of C. albicans and S. mutans in terms of growth amount and growth speed. However, GOS did not impact the growth of L. plantarum 14,917. GOS, as the sole carbohydrate source of S. mutans, C. albicans, and L. plantarum 14,917, yielded a more neutral culture medium pH.
Notably, Figure 1B shows the very limited growth of C. albicans in GOS compared to that in glucose condition. The ODs at the end of the exponential phase of C. albicans growth in GOS (at 7 h) was around 0.25, and they only increased to 0.3 at the end time point (at 20 h). While in glucose condition, the OD was much higher. It was over 0.7 at the end of the exponential phase (at 8 h) and thereafter. The µmax of C. albicans in GOS were significantly reduced compared to that in glucose condition (p < 0.0001 for all the concentration of GOS) (Figure 1E).
S. mutans could grow in GOS (Figure 1A), and the ODs reached 0.5 at end of the exponential phase (at 7 h) and thereafter. However, its growth in GOS could not reach OD 0.8 as in the glucose condition. The maximum plateau OD of GOS-grown S. mutans was substantially lower than that of glucose-grown S. mutans. Particularly in the 1% GOS condition, S. mutans exhibited the least quantity of growth compared to that grew in 1% glucose (p < 0.0001). In addition, the µmax of GOS-grown S. mutans were lower than that of glucose-grown ones.
In contrast, when grown with 1–5% GOS, L. plantarum 14,917 generally grew as well as it did in glucose condition with comparable maximum plateau OD (Figure 1C) (p > 0.05), except 1% GOS, and comparable µmax (Figure 1F). Interestingly, the µmax of 3% GOS-grown L. plantarum 14,917 (0.377 ± 0.030 h−1) was significantly higher than glucose grown (0.282 ± 0.023 h−1) (p = 0.014).
Figure 1G–I shows the pH changes during the single species growth. In general, the medium pH for L. plantarum 14,917 (Figure 1I), S. mutans (Figure 1G), and C. albicans (Figure 1H) were significantly higher in GOS conditions than that in the glucose condition. There are dose-dependent effects of the medium pH for L. plantarum 14,917 and S. mutans at various GOS concentrations. 1% GOS yielded the highest pH, with the pH value of 4.5 and 5.4 for L. plantarum 14,917 and S. mutans, respectively, which are significantly higher than those (pH 3.8 and 4.1, respectively) in the 1% glucose condition.

3.2. The Impact of GOS on S. mutans-C. albicans Duo-Species Growth

The growth of S. mutans with 1% GOS and 5% GOS was inhibited by about 50% at 20 h compared to that with 1% glucose (p < 0.0001 for 1% GOS; p = 0.0015 for 5% GOS) (Figure 2A). Moreover, 1% and 5% GOS reduced the growth of C. albicans by about 30 and 50% at 20 h, respectively (p = 0.0048 for 1% GOS; p < 0.001 for 5% GOS). However, there is no statistically significant difference regarding the potency of the inhibitory effect on S. mutans or C. albicans between 1% and 5% GOS. For the first 6 h, the pH changes of the three different substrates’ culture media declined to a comparable degree. At 20 h, GOS as substrates created a higher medium pH than 1% glucose (p < 0.0001). The 1% GOS condition displayed the highest culture medium pH of 5.83 at 20 h.

3.3. The Impact of GOS on Inhibitory Capacity of L. plantarum against S. mutans-C. albicans Duo-Species Growth

The growth of S. mutans and C. albicans was significantly repressed by L. plantarum 14,917 in utilization of 1% and 5% GOS at 6 and 20 h (Figure 2A,B) compared to duo-species with GOS. GOS enhanced the anti-fungal performance of L. plantarum 14,917 on C. albicans at 6 and 20 h (p < 0.0001 for both 1% and 5% GOS). However, this enhanced effect was not influenced by the concentration of GOS (p > 0.05). GOS did not augment the anti-bacterial effect of L. plantarum 14,917 compared to glucose. However, L. plantarum 14,917 with 5% GOS was more effective against S. mutans than that with 1% GOS at 20 h (p < 0.0001) (Figure 2A). The inhibitory effect on S. mutans under 5% GOS condition and 1% glucose at 6 h were similar (p > 0.05) and higher than 1% GOS (p < 0.05).
In the L. plantarum 14,917 treated duo-species model, using GOS as the carbohydrate substrate led to a higher culture medium pH than 1% glucose. Particularly, 1% GOS led to the highest culture medium pH of 4.6 at 20 h (Figure 2D).

3.4. GOS Facilitated L. plantarum’s Inhibition of C. albicans Hyphae Formation

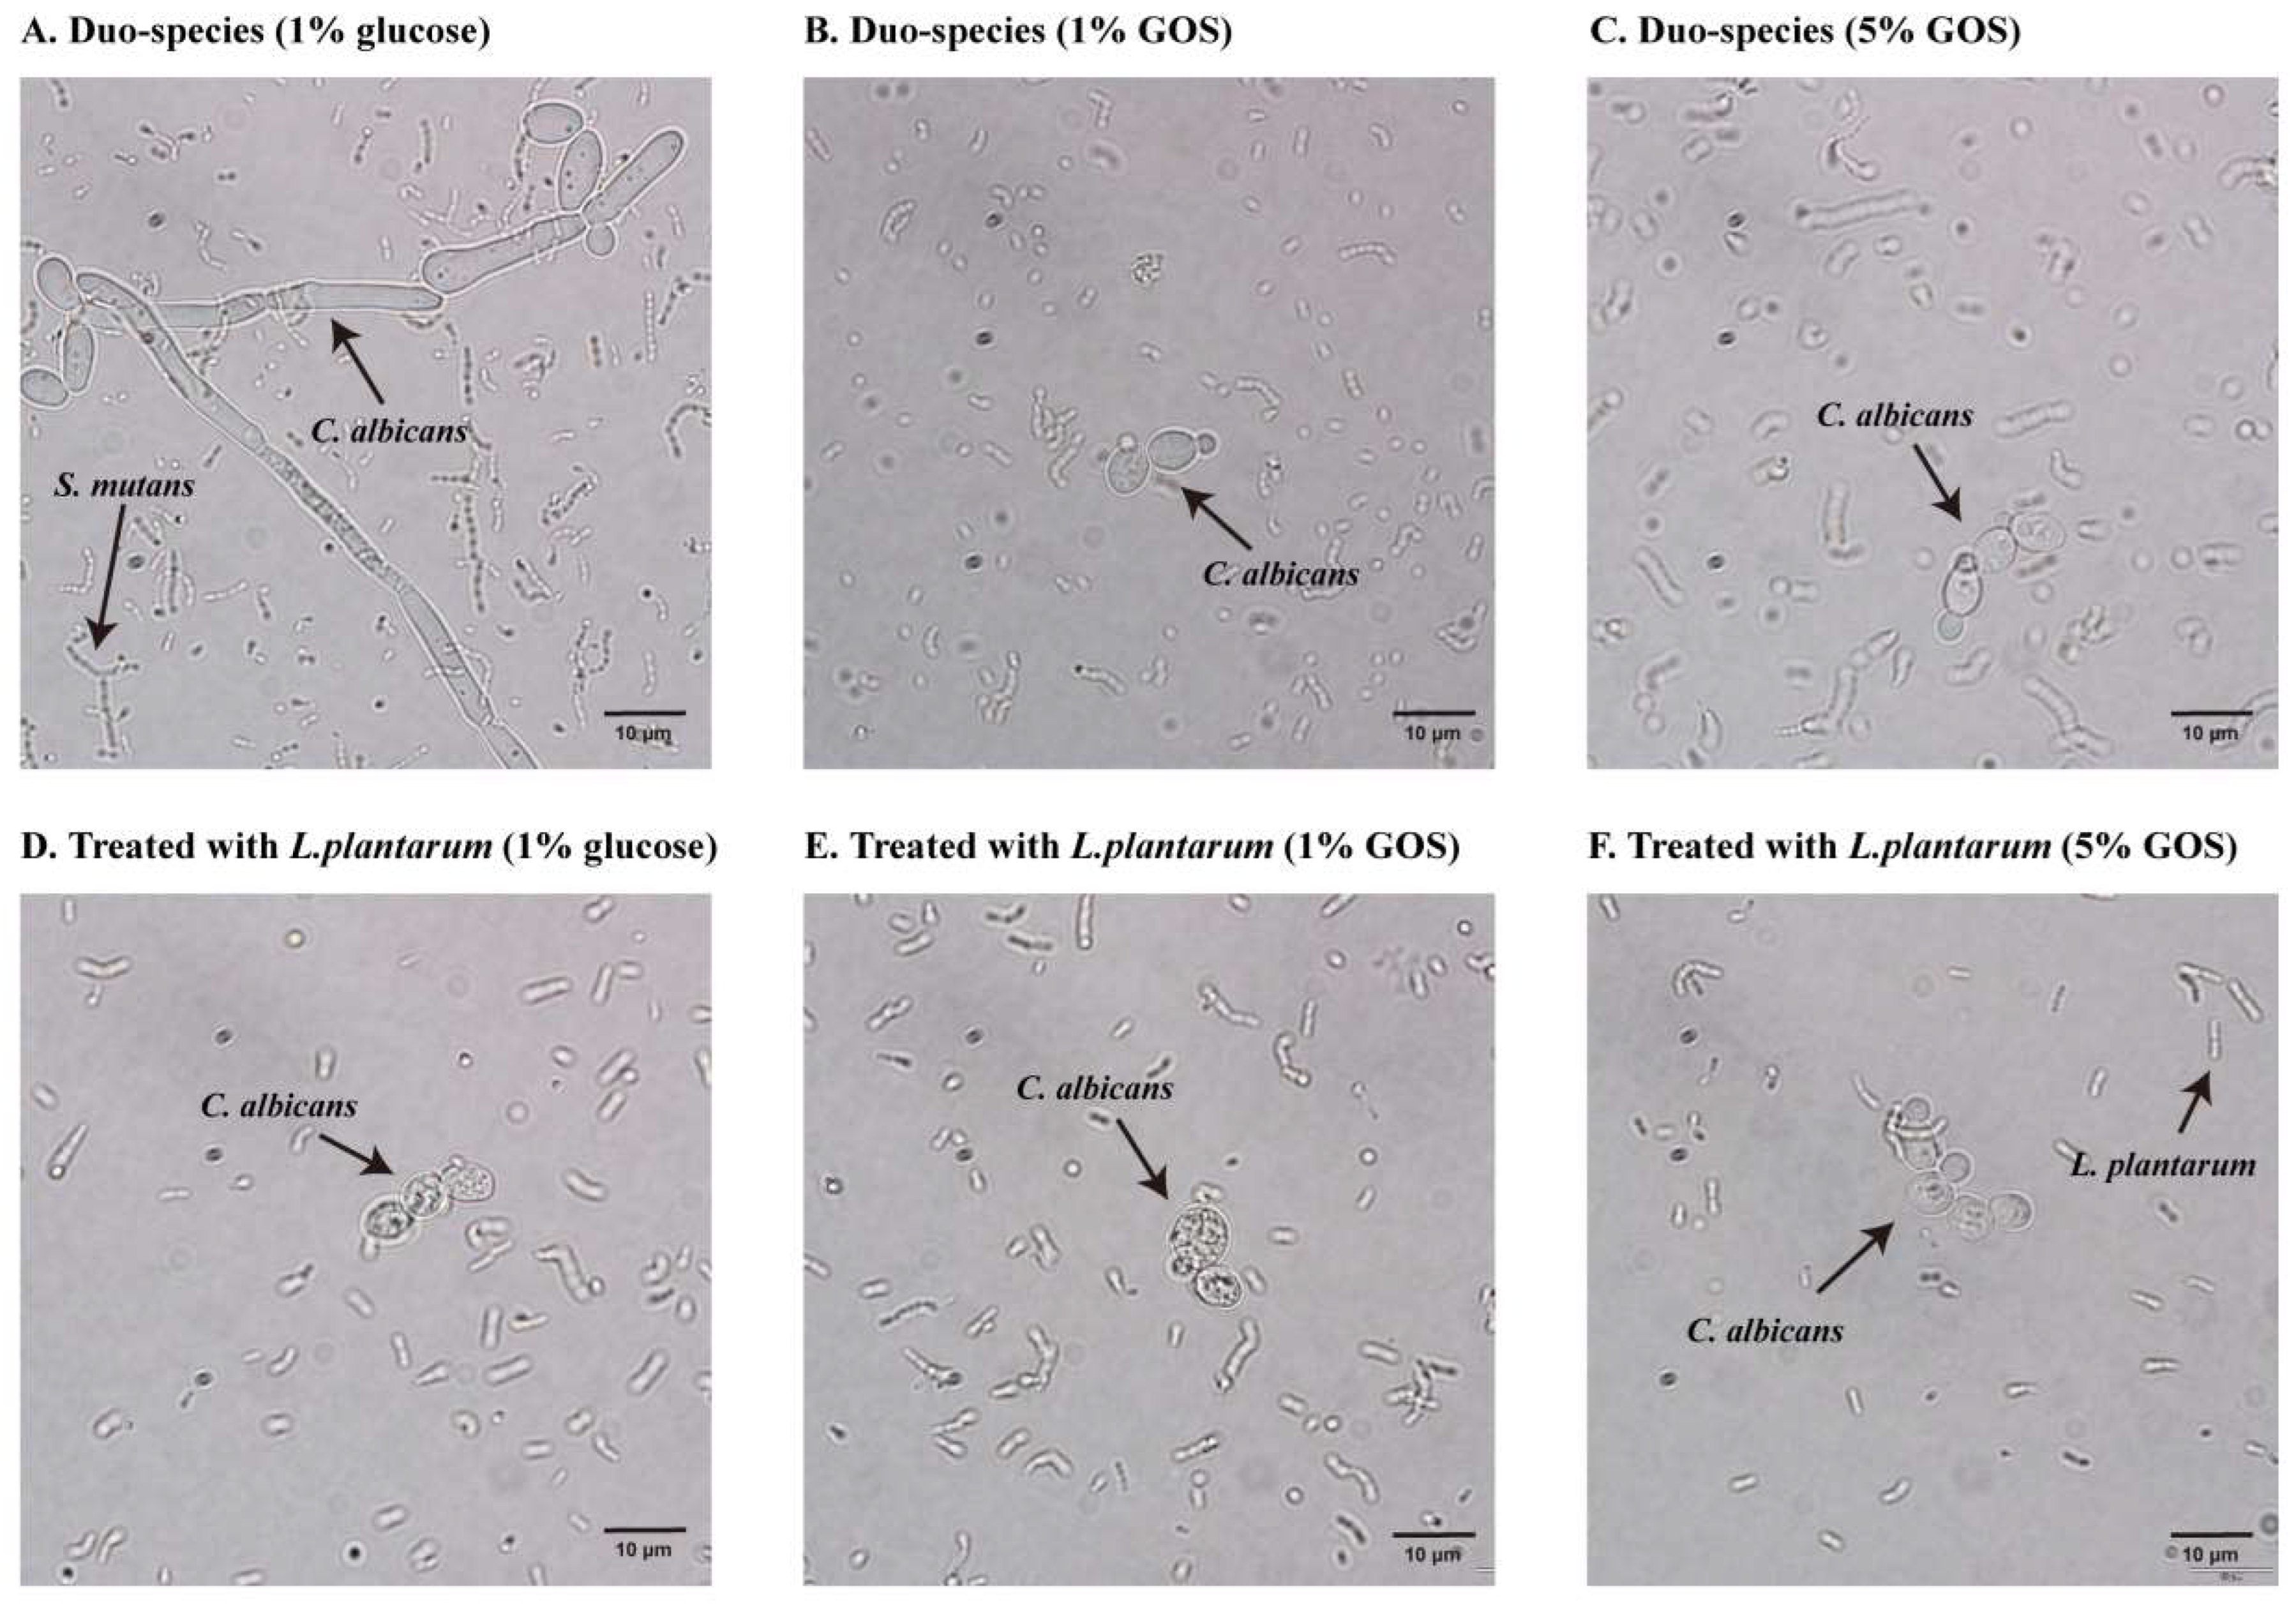
Figure 3 reveals that the transition from yeast to hyphal or pseudohyphal form of C. albicans was inhibited by GOS alone and the combination of L. plantarum 14,917 and GOS.

3.5. Expression of Genes of Interest in Mixed-Species Model

The impact of exposure to GOS and L. plantarum 14,917 on C. albicans and S. mutans was further assessed and compared using qRT-PCR.
Compared to 1% glucose, GOS alone reduced the expression of most C. albicans virulence genes in S. mutans-C. albicans duo-species model, shown in Figure 4A. HWP1 and ECE1, associated with hyphal growth and adhesion to host cells, were 6.2-fold and 16.3-fold down-regulated, respectively (p < 0.0001). Additionally, SOD3, a gene involved in oxidative stress response, was significantly up-regulated (p = 0.0377). However, CHT2, the gene involved in chitinase encoding, was slightly down-regulated (p > 0.05). Whereas, the expression of S. mutans genes, atpD (stress response gene related to ATPase complex and acid tolerance) and eno (associated with degradation of carbohydrates via glycolysis), were significantly reduced by 2.8 fold (p < 0.0001) and 1.1 fold (p = 0.0005), respectively, in GOS condition, compared to duo-species in glucose. Moreover, lacC and lacG, the genes involved in galactose metabolism, were significantly up-regulated (p < 0.05) compared to S. mutans grown in glucose (Figure 4B).
Compared to 1% GOS-grown single species, gene expression of C. albicans and S. mutans in duo-species in 1% GOS was exhibited (Figure 4C,D). Notably, in 1% GOS condition, with the presence of S. mutans, C. albicans genes HWP1 and ECE1 were significantly up-regulated (p < 0.05). In addition, CHT2 and ERG4 genes were down-regulated (p < 0.01) (Figure 4C). All the virulence genes of S. mutans were up-regulated when co-cultured with C. albicans, compared to S. mutans grew individually, despite no statistically significant difference (Figure 4D).
The gene expression of L. plantarum 14,917 grown alone with 1% GOS is shown in Figure 5. plnA, encoding plantaricin, was down-regulated (p < 0.0001), compared to L. plantarum 14,917 grown alone with glucose. However, plnD, another gene encoding plantaricin, was significantly up-regulated (p = 0.0402). In addition, there was an up-regulation of plnN gene, but the difference was not statistically significant.
We explored the gene expression in S. mutans and C. albicans duo-species treated with L. plantarum 14,917 in utilization of 1% GOS (Figure 6). In 1% GOS condition, compared to the S. mutans and C. albicans duo-species, the L. plantarum 14,917 treated group had significant down-regulations of C. albicans genes involved in hyphal growth (HWP1 and Ece1): HWP1 with 22.9-fold change (p = 0.0008), and ECE1 with 55.8-fold change (p = 0.0012). ERG4, and SOD3 genes were up-regulated (p < 0.05) (Figure 6A). The lacG gene of S. mutans was down-regulated in L. plantarum-GOS treated group compared to the none-treated duo-species model (Figure 6B). In addition, atpD and lacC genes were significantly up-regulated (p < 0.05).

4. Discussion

Given that few studies have evaluated the efficacy of L. plantarum 14,917 utilizing GOS on inhibiting C. albicans and S. mutans, our findings shed light on caries control from a novel ecological perspective that utilizes prebiotics and probiotics. The results of the present investigation indicate that GOS alone can contribute to a more neutral pH, that is higher than 5.5, even in a high-caries risk model, and utilizing GOS as the carbon source can enhance the anti-fungal activity of L. plantarum 14,917 against C. albicans.

4.1. Properties and Benefits of GOS

GOS is characterized by a mix of structures that exhibit variations in the degree of polymerization and glycosidic linkage between the galactose moieties or between galactose and glucose.
In addition to its prebiotic properties, GOS exhibited non-digestibility, good stability, a high capacity to hold moisture, high solubility, and a low glycemic index [30,31]. It has a sweetness of typically 0.3 to 0.6 times that of sucrose [30]. In addition, the safety of GOS has been acknowledged in various nations. In the United States, GOS is generally recognized as safe (GRAS), in the European Union as non-novel foods, and in Japan as foods for specific health use (FOSHU) [30]. Additionally, GOS was permitted in infant and follow-on formulas by the Food Standards of Australia and New Zealand (FSANZ) in 2008.
GOS can markedly promote the growth of Bifidobacteria and Lactobacilli in the colon and produce short-chain fatty acid (SCFA) from fermentation [31,32]. Hence, it is widely used as a low-calorie sweetener in fermented milk products, confections, bread, and beverages [30,31]. Extensive studies have been conducted regarding the systemic health advantages of GOS. Comparatively, few studies have examined the effectiveness of GOS on oral health.

4.2. GOS, a Potential Anti-Caries Agent

In the present study, GOS as the sole carbohydrate source resulted in a less acidic environment for the single-, duo- and multispecies planktonic models of C. albicans, S. mutans, and L. plantarum 14,917. A noteworthy finding is that the pH was 5.8 in C. albicans-S. mutans duo-species models in the utilization of 1% GOS, which is above the well known critical pH for enamel dissolution of 5.5. Moreover, hyphal formation genes (HWP1 and ECE1) of C. albicans and acid stress genes (atpD) of S. mutans in duo-species model, which mimicked high caries risk condition, with 1% GOS was significantly repressed compared to glucose. This finding indicates that GOS may act as a disincentive to hyphal formation and acid resistance of C. albicans-S. mutans duo-species medium. Hence, GOS has anti-caries potential, considering the ability to neutralize the environment pH and the ability to disturb the virulence genes expression of C. albicans-S. mutans duo-species medium.
Interestingly, single-species growth screening revealed that C. albicans and S. mutans could not grow as effectively in GOS as in 1% glucose. Of note is that, when we cocultured C. albicans and S. mutans, GOS alone did not appear to effectively inhibit the development of C. albicans and S. mutans in terms of CFU/mL. In addition, compared to single-species planktonic models, S. mutans genes involved in energy metabolism (atpD) and carbohydrate metabolism (eno, lacC and lacG) were up-regulated with the presence of C. albicans. The trend was similar with S. mutans and C. albicans in utilization of sucrose [33]. The metabolism of S. mutans may be fostered when grown together with C. albicans. Similarly, hyphal formation genes (HWP1 and ECE1) and SOD3, related to tolerance to oxidative stress, were induced when grown with S. mutans. Those findings indicate that the symbiotic relationship and cross-feeding effects between S. mutans and C. albicans exist when GOS is the sole carbohydrate.
LacA (encoding β-galactosidase), lacS (encoding permease LacS), and lacR (a divergently oriented regulator) genes were essential in the utilization of GOS [23,24] by Lactobacilli. We speculate that GOS metabolites produced by C. albicans can be efficiently utilized by S. mutans, which may lack the permease LacS to aid in transporting highly polymerized molecules, such as GOS. S. mutans may also feed back C. albicans through the breakdown of disaccharides into monosaccharides [34]. This may explain the significant up-regulation of lacC and lacG genes in duo-species with GOS compared to that with glucose. Further research is needed to better understand the synergistic relationship between the metabolites produced by S. mutans and C. albicans when metabolizing GOS, as no study has yet reported relevant information on this topic.

4.3. Synbiotics Effect of GOS and L. plantarum 14,917 on Caries Control

To determine whether utilizing GOS could impact the antibacterial and antifungal capacity of L. plantarum 14,917, we treated S. mutans and C. albicans duo-species with L. plantarum 14,917. Our finding exhibited that the combination of GOS and L. plantarum 14,917 significantly suppressed the growth of C. albicans by around 1 log compared to L. plantarum 14,917 with glucose at 20 h. L. plantarum 14,917 in utilization of GOS showed a significantly inhibitory ability on S. mutans growth in comparison to the control group, which co-cultured C. albicans and S. mutans. However, the performance of L. plantarum 14,917 with 1% glucose still showed the best inhibitory effect on S. mutans.
In the current study, a significant down-regulation of the pln A genes and a significant up-regulation of plnD gene, responsible for encoding antimicrobial peptide plantaricin were observed in L. plantarum 14,917 with GOS in comparison to glucose. As plantaricin production of L. plantarum is based on the complicated operons system [35,36,37], the impact of GOS on plantaricin production remains unclear. Future research aimed at measuring plantaricin production could aid in clarifying the GOS effects of L. plantarum.
Relative to 1% glucose, the culture medium with GOS maintained a more neutral pH by roughly one pH unit. This significant pH difference might explain the dissimilar potency of the inhibitory effect of L. plantarum 14,917 under GOS and glucose. S. mutans is acidogenic and aciduric. These capacities help S. mutans survive under acidic conditions and give it a significant competitive edge against other bacterial species inhabiting dental plaque in acidic conditions [38,39,40]. However, extreme pH could pose a risk to acid-sensitive molecules, such as DNA and the metabolic machinery. Previous studies indicated S. mutans could continue to grow in continuous cultures at pH values, ranging from 4.5 to 5.0 [39,41]. Conversely, a pH below 4 could impact the viability of S. mutans. The cell membranes of S. mutans GS-5 were damaged by acidification, and S. mutans were killed at a pH lower than 4 [40]. Boisen et al. observed that the viability of S. mutans UA159 at pH 3.5 was significantly decreased to roughly 5% in planktonic culture [41]. However, the pH threshold for a significant impact of viability on S. mutans was not conclusive. Glucose was found to be protective against acid killing of S. mutans [42]. For this current study, carbohydrate exhaustion at 20 h, combined with low pH value, might contribute to the dramatic decrease in viable cells of S. mutans in glucose.
With respect to L. plantarum, pH contributes to L. plantarum’s antimicrobial effect against S. mutans. Wasfin et al. revealed neutralization of culture supernatant of L. plantarum 14,917 to pH 6.5 significantly reduced the inhibitory effect on S. mutans isolated from caries dentin. This study indicated that acid contributes with other antimicrobial agents, such as hydrogen peroxide, bacteriocin, and biosurfactant, to inhibit growth [43].

5. Conclusions

GOS significantly inhibited the growth of C. albicans and S. mutans in terms of growth quantity and speed. Moreover, GOS enhanced the anti-fungal ability of L. plantarum 14,917 against C. albicans and helped to build a more neutral pH environment in high-risk carries’ planktonic conditions. Future studies are required to analyze the metabolism of GOS by S. mutans and C. albicans and the GOS effect using biofilm models.

Supplementary Materials

The following supporting information can be downloaded at: https://www.mdpi.com/article/10.3390/nu15092017/s1, Table S1. Primers used in RT-qPCR.

Author Contributions

Conceptualization, X.H., Y.R. and J.X.; Data curation, X.H., J.B. and Y.Z.; Formal analysis, X.H., J.B., Y.Z. and X.L.; Funding acquisition, J.X.; Investigation, X.H., J.B., Y.Z., T.T.W. and G.M.; Methodology, X.H., J.B., Y.Z. and J.X.; Project administration, Y.R. and J.X.; Resource, Y.R. and J.X.; Supervision, Y.R. and J.X.; Validation, X.H., J.B. and X.L.; Writing—original draft, X.H.; Writing—review and editing, X.H., Y.Z., Y.R. and J.X. All authors have read and agreed to the published version of the manuscript.

Funding

This research was funded by NIH/NIDCR K23DE027412 (PI: Jin Xiao) and R01DE031025 (PI: Jin Xiao). The funding agencies had no role in the study design, data collection, analyses, decision to publish, or preparation of the manuscript.

Institutional Review Board Statement

Not applicable.

Informed Consent Statement

Not applicable.

Data Availability Statement

All data generated or analyzed during this study are included in this article. Further enquiries can be directed to the corresponding author.

Conflicts of Interest

The authors declare no conflict of interest.

References

  1. Oral health in America: A report of the Surgeon General. J. Calif. Dent. Assoc. 2000, 28, 685–695. [CrossRef]
  2. Caufield, P.W.; Li, Y.; Dasanayake, A. Dental caries: An infectious and transmissible disease. Compend. Contin. Educ. Dent. 2005, 26, 10–16. [Google Scholar]
  3. Chen, X.; Daliri, E.B.; Kim, N.; Kim, J.R.; Yoo, D.; Oh, D.H. Microbial Etiology and Prevention of Dental Caries: Exploiting Natural Products to Inhibit Cariogenic Biofilms. Pathogens 2020, 9, 569. [Google Scholar] [CrossRef] [PubMed]
  4. Zeng, Y.; Nikitkova, A.; Abdelsalam, H.; Li, J.; Xiao, J. Activity of quercetin and kaemferol against Streptococcus mutans biofilm. Arch. Oral Biol. 2019, 98, 9–16. [Google Scholar] [CrossRef]
  5. Abranches, J.; Zeng, L.; Kajfasz, J.K.; Palmer, S.R.; Chakraborty, B.; Wen, Z.T.; Richards, V.P.; Brady, L.J.; Lemos, J.A. Biology of Oral Streptococci. Microbiol. Spectr. 2018, 6. [Google Scholar] [CrossRef] [PubMed]
  6. Xiao, J.; Huang, X.; Alkhers, N.; Alzamil, H.; Alzoubi, S.; Wu, T.T.; Castillo, D.A.; Campbell, F.; Davis, J.; Herzog, K.; et al. Candida albicans and Early Childhood Caries: A Systematic Review and Meta-Analysis. Caries Res. 2018, 52, 102–112. [Google Scholar] [CrossRef]
  7. Hwang, G.; Liu, Y.; Kim, D.; Li, Y.; Krysan, D.J.; Koo, H. Candida albicans mannans mediate Streptococcus mutans exoenzyme GtfB binding to modulate cross-kingdom biofilm development in vivo. PLoS Pathog. 2017, 13, e1006407. [Google Scholar] [CrossRef]
  8. Kim, H.E.; Liu, Y.; Dhall, A.; Bawazir, M.; Koo, H.; Hwang, G. Synergism of Streptococcus mutans and Candida albicans Reinforces Biofilm Maturation and Acidogenicity in Saliva: An In Vitro Study. Front. Cell. Infect. Microbiol. 2020, 10, 623980. [Google Scholar] [CrossRef]
  9. Hwang, G.; Marsh, G.; Gao, L.; Waugh, R.; Koo, H. Binding Force Dynamics of Streptococcus mutans-glucosyltransferase B to Candida albicans. J. Dent. Res. 2015, 94, 1310–1317. [Google Scholar] [CrossRef]
  10. Philip, N.; Suneja, B.; Walsh, L.J. Ecological Approaches to Dental Caries Prevention: Paradigm Shift or Shibboleth? Caries Res. 2018, 52, 153–165. [Google Scholar] [CrossRef]
  11. Srivastava, N.; Ellepola, K.; Venkiteswaran, N.; Chai, L.Y.A.; Ohshima, T.; Seneviratne, C.J. Lactobacillus Plantarum 108 Inhibits Streptococcus mutans and Candida albicans Mixed-Species Biofilm Formation. Antibiotics 2020, 9, 478. [Google Scholar] [CrossRef]
  12. Zhang, G.; Lu, M.; Liu, R.; Tian, Y.; Vu, V.H.; Li, Y.; Liu, B.; Kushmaro, A.; Li, Y.; Sun, Q. Inhibition of Biofilm Formation and Virulence by K41 Isolated From Traditional Sichuan Pickles. Front. Microbiol. 2020, 11, 774. [Google Scholar] [CrossRef] [PubMed]
  13. Zhang, Q.; Qin, S.; Xu, X.; Zhao, J.; Zhang, H.; Liu, Z.; Chen, W. Inhibitory Effect of CCFM8724 towards and Induced Caries in Rats. Oxid. Med. Cell. Longev. 2020, 2020, 4345804. [Google Scholar] [CrossRef]
  14. Zeng, Y.; Fadaak, A.; Alomeir, N.; Wu, T.T.; Rustchenko, E.; Qing, S.; Bao, J.; Gilbert, C.; Xiao, J. Lactobacillus plantarum Disrupts S. mutansC. albicans Cross-Kingdom Biofilms. Front. Cell. Infect. Microbiol. 2022, 12, 872012. [Google Scholar] [CrossRef]
  15. Gibson, G.R.; Hutkins, R.; Sanders, M.E.; Prescott, S.L.; Reimer, R.A.; Salminen, S.J.; Scott, K.; Stanton, C.; Swanson, K.S.; Cani, P.D.; et al. Expert consensus document: The International Scientific Association for Probiotics and Prebiotics (ISAPP) consensus statement on the definition and scope of prebiotics. Nat. Rev. Gastroenterol. Hepatol. 2017, 14, 491–502. [Google Scholar] [CrossRef] [PubMed]
  16. Pandey, K.R.; Naik, S.R.; Vakil, B.V. Probiotics, prebiotics and synbiotics—A review. J. Food Sci. Technol. 2015, 52, 7577–7587. [Google Scholar] [CrossRef]
  17. Vandenplas, Y.; Zakharova, I.; Dmitrieva, Y. Oligosaccharides in infant formula: More evidence to validate the role of prebiotics. Br. J. Nutr. 2015, 113, 1339–1344. [Google Scholar] [CrossRef] [PubMed]
  18. Sierra, C.; Bernal, M.-J.; Blasco, J.; Martínez, R.; Dalmau, J.; Ortuño, I.; Espín, B.; Vasallo, M.-I.; Gil, D.; Vidal, M.-L.; et al. Prebiotic effect during the first year of life in healthy infants fed formula containing GOS as the only prebiotic: A multicentre, randomised, double-blind and placebo-controlled trial. Eur. J. Nutr. 2015, 54, 89–99. [Google Scholar] [CrossRef]
  19. Vandenplas, Y.; De Greef, E.; Veereman, G. Prebiotics in infant formula. Gut Microbes 2014, 5, 681–687. [Google Scholar] [CrossRef]
  20. Bhatia, S.; Prabhu, P.N.; Benefiel, A.C.; Miller, M.J.; Chow, J.; Davis, S.R.; Gaskins, H.R. Galacto-oligosaccharides may directly enhance intestinal barrier function through the modulation of goblet cells. Mol. Nutr. Food Res. 2015, 59, 566–573. [Google Scholar] [CrossRef]
  21. Azcarate-Peril, M.A.; Ritter, A.J.; Savaiano, D.; Monteagudo-Mera, A.; Anderson, C.; Magness, S.T.; Klaenhammer, T.R. Impact of short-chain galactooligosaccharides on the gut microbiome of lactose-intolerant individuals. Proc. Natl. Acad. Sci. USA 2017, 114, E367–E375. [Google Scholar] [CrossRef]
  22. Fuhren, J.; Rösch, C.; Ten Napel, M.; Schols, H.A.; Kleerebezem, M. Synbiotic Matchmaking in Lactobacillus plantarum: Substrate Screening and Gene-Trait Matching To Characterize Strain-Specific Carbohydrate Utilization. Appl. Environ. Microbiol. 2020, 86, e01081-20. [Google Scholar] [CrossRef] [PubMed]
  23. Fuhren, J.; Schwalbe, M.; Peralta-Marzal, L.; Rösch, C.; Schols, H.A.; Kleerebezem, M. Phenotypic and genetic characterization of differential galacto-oligosaccharide utilization in Lactobacillus plantarum. Sci. Rep. 2020, 10, 21657. [Google Scholar] [CrossRef]
  24. Chen, C.; Wang, L.; Lu, Y.; Yu, H.; Tian, H. Comparative Transcriptional Analysis of and Its -Knockout Mutant Under Galactooligosaccharides and Glucose Conditions. Front. Microbiol. 2019, 10, 1584. [Google Scholar] [CrossRef]
  25. Devi, P.B.; Kavitake, D.; Jayamanohar, J.; Shetty, P.H. Preferential growth stimulation of probiotic bacteria by galactan exopolysaccharide from Weissella confusa KR780676. Food Res. Int. 2021, 143, 110333. [Google Scholar] [CrossRef] [PubMed]
  26. Panwar, D.; Kapoor, M. Transcriptional analysis of galactomannooligosaccharides utilization by Lactobacillus plantarum WCFS1. Food Microbiol. 2020, 86, 103336. [Google Scholar] [CrossRef]
  27. Zeng, Y.; Fadaak, A.; Alomeir, N.; Wu, Y.; Wu, T.T.; Qing, S.; Xiao, J. Effect of Probiotic Lactobacillus plantarum on Streptococcus mutans and Candida albicans Clinical Isolates from Children with Early Childhood Caries. Int. J. Mol. Sci. 2023, 24, 2991. [Google Scholar] [CrossRef]
  28. Zeng, L.; Burne, R.A. Comprehensive mutational analysis of sucrose-metabolizing pathways in Streptococcus mutans reveals novel roles for the sucrose phosphotransferase system permease. J. Bacteriol. 2013, 195, 833–843. [Google Scholar] [CrossRef] [PubMed]
  29. Livak, K.J.; Schmittgen, T.D. Analysis of relative gene expression data using real-time quantitative PCR and the 2(-Delta Delta C(T)) Method. Methods 2001, 25, 402–408. [Google Scholar] [CrossRef]
  30. Torres, D.P.M.; Gonçalves, M.; Teixeira, J.A.; Rodrigues, L.R. Galacto-Oligosaccharides: Production, Properties, Applications, and Significance as Prebiotics. Compr. Rev. Food Sci. Food Saf. 2010, 9, 438–454. [Google Scholar] [CrossRef]
  31. Sangwan, V.; Tomar, S.K.; Singh, R.R.; Singh, A.K.; Ali, B. Galactooligosaccharides: Novel components of designer foods. J. Food Sci. 2011, 76, R103–R111. [Google Scholar] [CrossRef] [PubMed]
  32. Wei, X.; Fu, X.; Xiao, M.; Liu, Z.; Zhang, L.; Mou, H. Dietary galactosyl and mannosyl carbohydrates: In-vitro assessment of prebiotic effects. Food Chem. 2020, 329, 127179. [Google Scholar] [CrossRef] [PubMed]
  33. Xiao, J.; Zeng, Y.; Rustchenko, E.; Huang, X.; Wu, T.T.; Falsetta, M.L. Dual transcriptome of Streptococcus mutans and Candida albicans interplay in biofilms. J. Oral Microbiol. 2023, 15, 2144047. [Google Scholar] [CrossRef] [PubMed]
  34. Ellepola, K.; Truong, T.; Liu, Y.; Lin, Q.; Lim, T.K.; Lee, Y.M.; Cao, T.; Koo, H.; Seneviratne, C.J. Multi-omics Analyses Reveal Synergistic Carbohydrate Metabolism in Streptococcus mutans-Candida albicans Mixed-Species Biofilms. Infect. Immun. 2019, 87, e00339-19. [Google Scholar] [CrossRef] [PubMed]
  35. Jabbar, Z.; Mukhtar, H.; Tayyeb, A.; Manzoor, A. Next-generation sequencing to elucidate adaptive stress response and plantaricin genes among Lactobacillus plantarum strains. Future Microbiol. 2020, 15, 333–348. [Google Scholar] [CrossRef]
  36. Diep, D.B.; Johnsborg, O.; Risøen, P.A.; Nes, I.F. Evidence for dual functionality of the operon plnABCD in the regulation of bacteriocin production in Lactobacillus plantarum. Mol. Microbiol. 2001, 41, 633–644. [Google Scholar] [CrossRef]
  37. Man, L.L.; Meng, X.C.; Zhao, R.H.; Xiang, D.J. The role of plNC8HK-plnD genes in bacteriocin production in Lactobacillus plantarum KLDS1.0391. Int. Dairy J. 2014, 34, 267–274. [Google Scholar] [CrossRef]
  38. Banas, J.A. Virulence properties of Streptococcus mutans. Front. Biosci. 2004, 9, 1267–1277. [Google Scholar] [CrossRef]
  39. Baker, J.L.; Faustoferri, R.C.; Quivey, R.G., Jr. Acid-adaptive mechanisms of Streptococcus mutans-the more we know, the more we don’t. Mol. Oral Microbiol. 2017, 32, 107–117. [Google Scholar] [CrossRef]
  40. Bender, G.R.; Sutton, S.V.; Marquis, R.E. Acid tolerance, proton permeabilities, and membrane ATPases of oral streptococci. Infect. Immun. 1986, 53, 331–338. [Google Scholar] [CrossRef]
  41. Boisen, G.; Davies, J.R.; Neilands, J. Acid tolerance in early colonizers of oral biofilms. BMC Microbiol. 2021, 21, 45. [Google Scholar] [CrossRef] [PubMed]
  42. Sheng, J.; Marquis, R.E. Enhanced acid resistance of oral streptococci at lethal pH values associated with acid-tolerant catabolism and with ATP synthase activity. FEMS Microbiol. Lett. 2006, 262, 93–98. [Google Scholar] [CrossRef] [PubMed]
  43. Wasfi, R.; Abd El-Rahman, O.A.; Zafer, M.M.; Ashour, H.M. Probiotic Lactobacillus sp. inhibit growth, biofilm formation and gene expression of caries-inducing Streptococcus mutans. J. Cell. Mol. Med. 2018, 22, 1972–1983. [Google Scholar] [CrossRef] [PubMed]
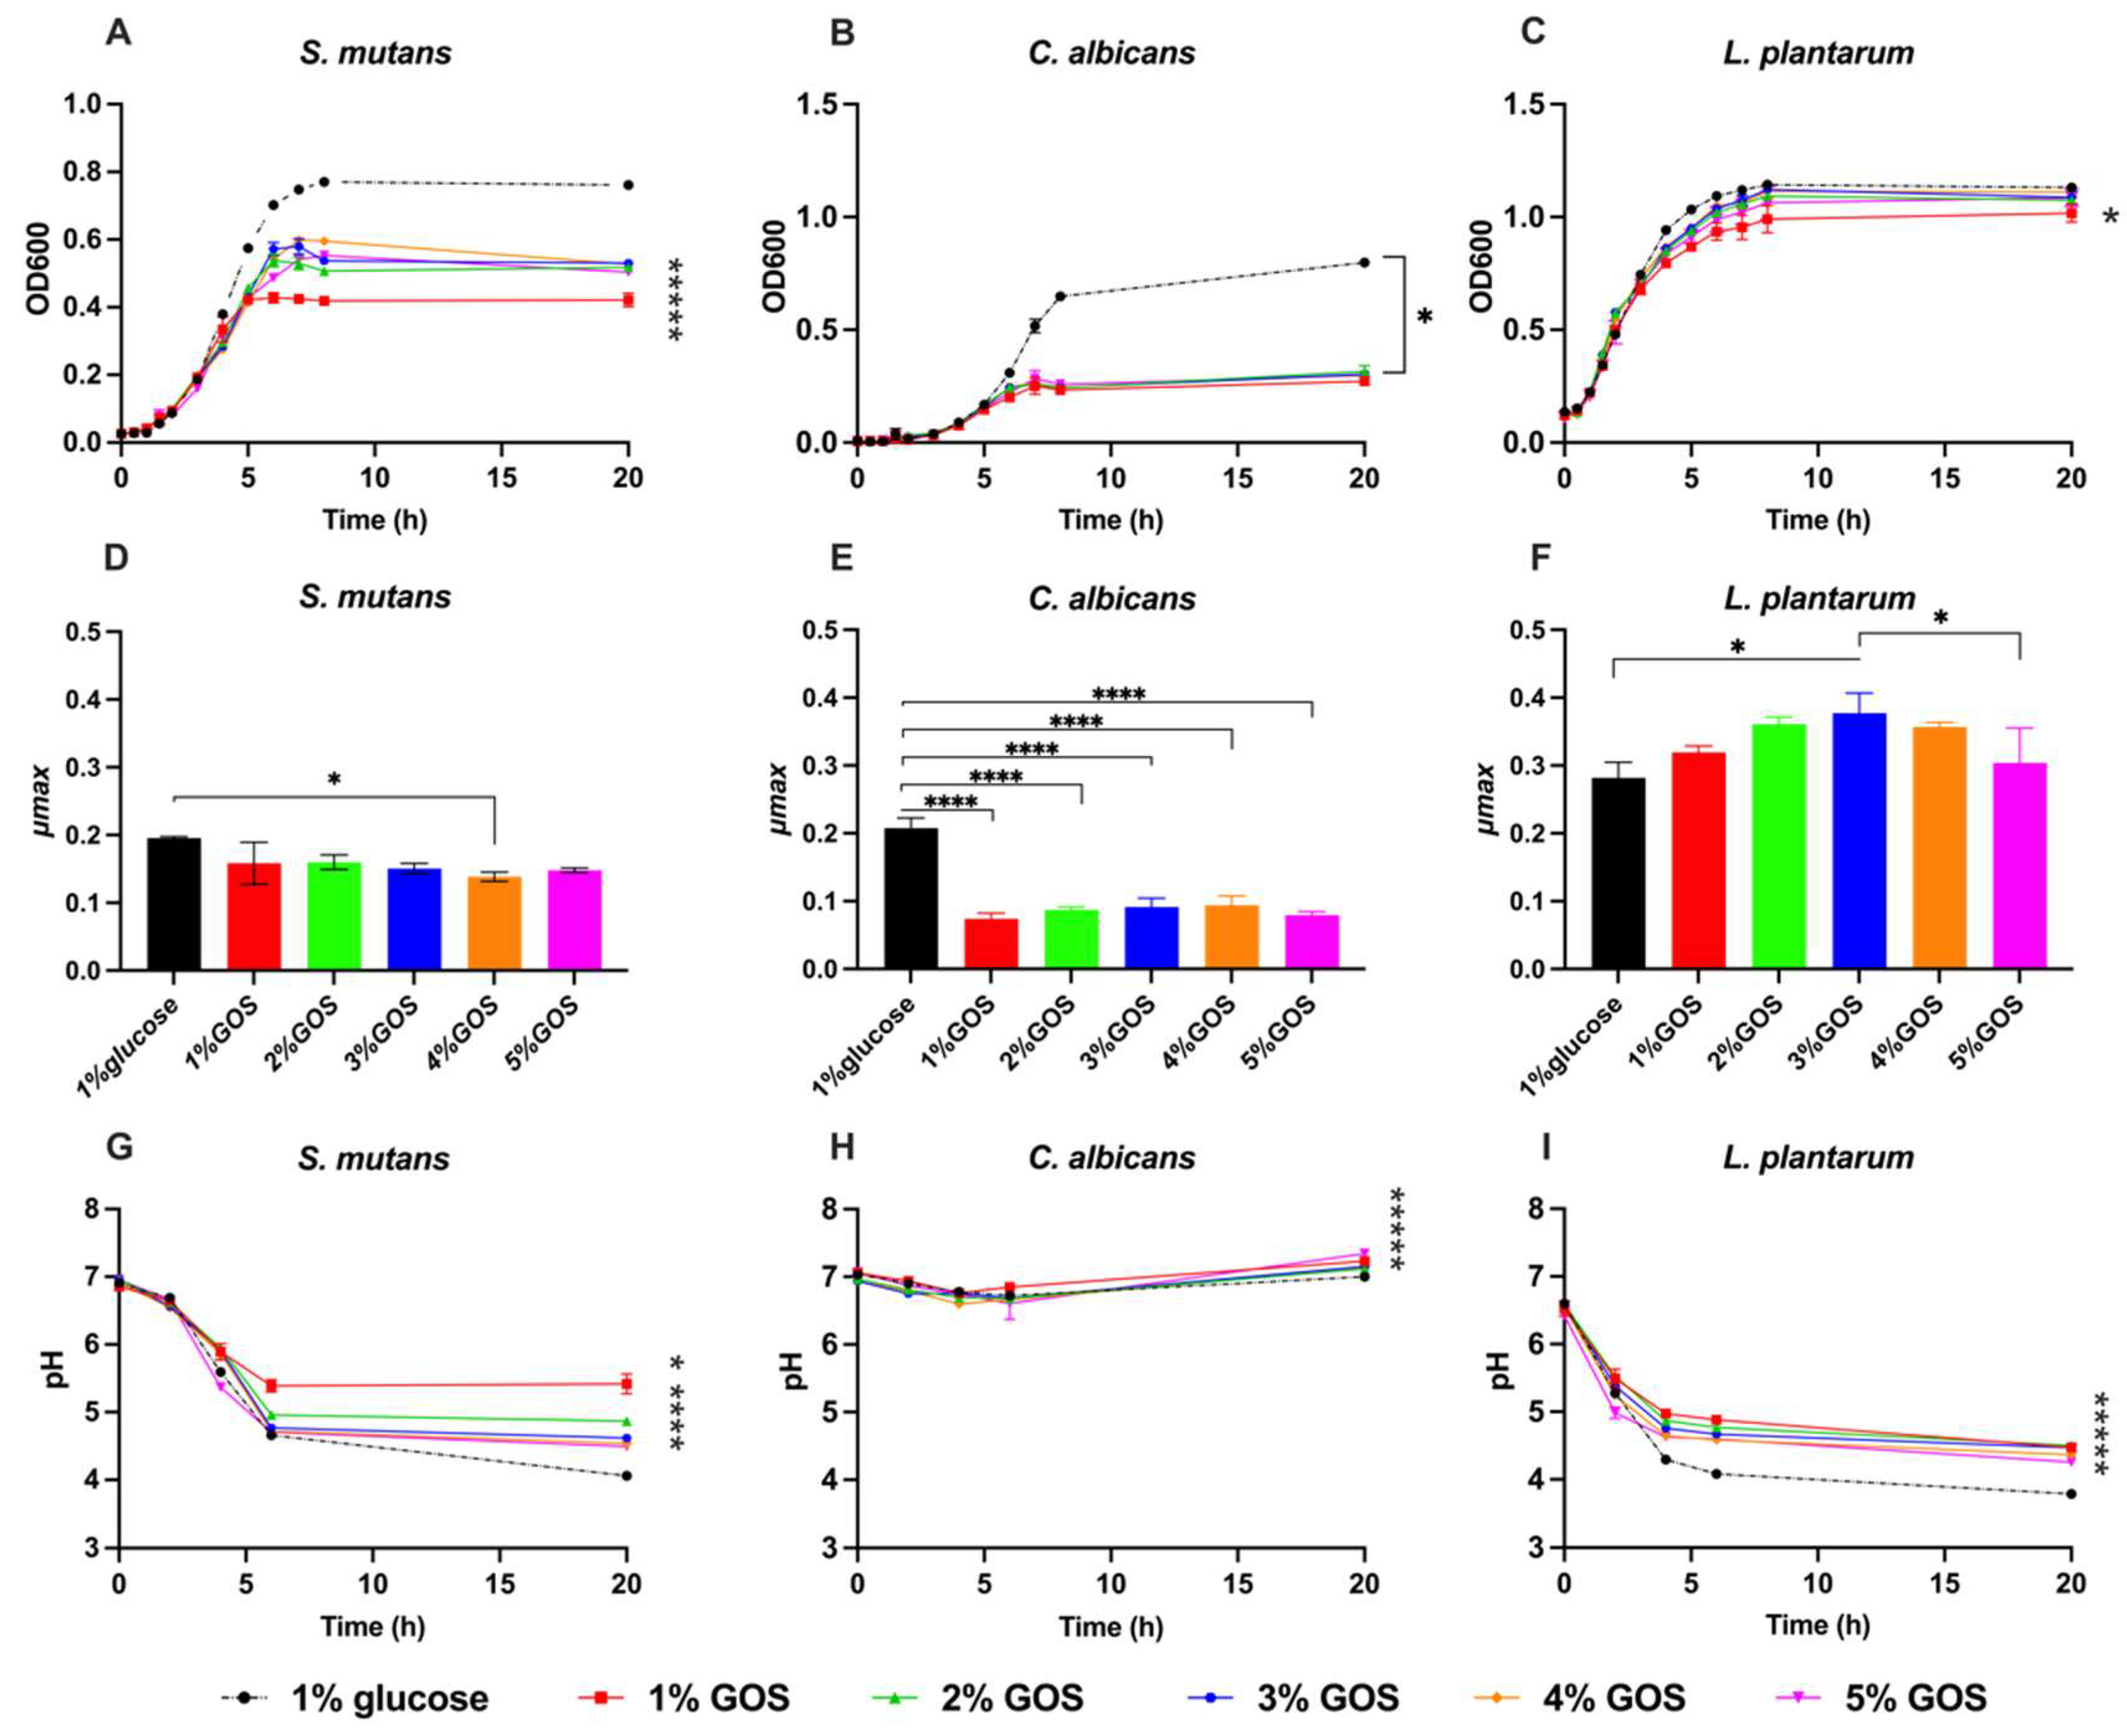
Figure 1. Single species growth with glucose or GOS sugar substrate. (AC) Growth curves for single species of Streptococcus mutans, Candida albicans, and Lactobacillus plantarum 14,917 in TSBYE with 1–5% GOS or 1% glucose. (DF) The maximal specific growth rate (µmax) for single species of S. mutans, C. albicans, and L. plantarum 14,917 in TSBYE with 1–5% GOS or 1% glucose. (GI) pH changes during the above growth progress. * Indicate that the maximum plateau OD, µmax, or pH at 20 h with GOS, were significantly different from that with 1% glucose (p < 0.05). **** p < 0.0001.
Nutrients 15 02017 g001
Figure 2. Interactions in duo-species (control) and L. plantarum treated groups in planktonic condition. (AC) The growth of S. mutans, C. albicans, and L. plantarum 14,917 in planktonic condition is plotted. (D) pH changes of duo-species and L. plantarum 14,917 treated groups in TSBYE with 1, 5% GOS or 1% glucose. ‘Ca + Sm’ referred to the cocultivation of C. albicans and S. mutans. ‘Ca + Sm + Lp’ referred to C. albicans and S. mutans duo-species treated with L. plantarum 14,917. Viable cells were measured to determine the inhibitory effects. * Indicate that p < 0.05 when comparing the two groups.
Nutrients 15 02017 g002
Figure 3. Form of C. albicans treated with GOS and L. plantarum 14,917. (A) S. mutans and C. albicans duo-species grown in 1% glucose at 20 h. (B) S. mutans and C. albicans duo-species grown in 1% GOS at 20 h. (C) S. mutans and C. albicans duo-species grown in 5% GOS. (D) S. mutans and C. albicans duo-species grown in 1% glucose with the addition of L. plantarum 14,917 at 20 h. (E) S. mutans and C. albicans duo-species grown in 1% GOS with the addition of L. plantarum 14,917 at 20 h. (F) S. mutans and C. albicans duo-species grown in 5% GOS with the addition of L. plantarum 14,917 at 20 h.
Nutrients 15 02017 g003
Figure 4. Expression of C. albicans and S. mutans genes in single and duo-species culture at 20 h. (A) C. albicans genes expression in duo-species with 1% GOS relative to that with 1% glucose. (B) S. mutans genes expression in duo-species with 1% GOS. (C) C. albicans genes expression in duo-species with 1% GOS relative to C. albicans grown solely with 1% GOS. (D) S. mutans genes expression in duo-species with 1% GOS relative to S. mutans grown solely with 1% GOS. * Indicate that the expression of genes in the duo-species with 1% GOS was significantly different from that in the duo-species with 1% glucose or single species with 1% GOS (p < 0.05).
Nutrients 15 02017 g004
Figure 5. Expression of L. plantarum genes in single-species model at 20 h. * Indicate that the expression of genes of L. plantarum 14,917 with 1% GOS was significantly different from that of L. plantarum 14,917 with 1% glucose (p < 0.05).
Nutrients 15 02017 g005
Figure 6. Genes expression in duo- and multi-species culture at 20 h. (A) C. albicans genes expression in duo-species treated with L. plantarum 14,917 in utilization of 1% GOS relative to duo-species with 1% GOS. (B) S. mutans genes expression in duo-species treated with L. plantarum 14,917 in utilization of 1% GOS relative to duo-species with 1% GOS. * Indicate that the expression of genes in the duo-species treated with L. plantarum 14,917 in 1% GOS was significantly different from duo-species in 1% GOS (p < 0.05).
Nutrients 15 02017 g006
Disclaimer/Publisher’s Note: The statements, opinions and data contained in all publications are solely those of the individual author(s) and contributor(s) and not of MDPI and/or the editor(s). MDPI and/or the editor(s) disclaim responsibility for any injury to people or property resulting from any ideas, methods, instructions or products referred to in the content.