How Does the Frequency of Eating-Alone among Older People in Korea Affect Their Health and Dietary Behavior?


Abstract
:1. Introduction
2. Materials and Methods
2.1. Research Data
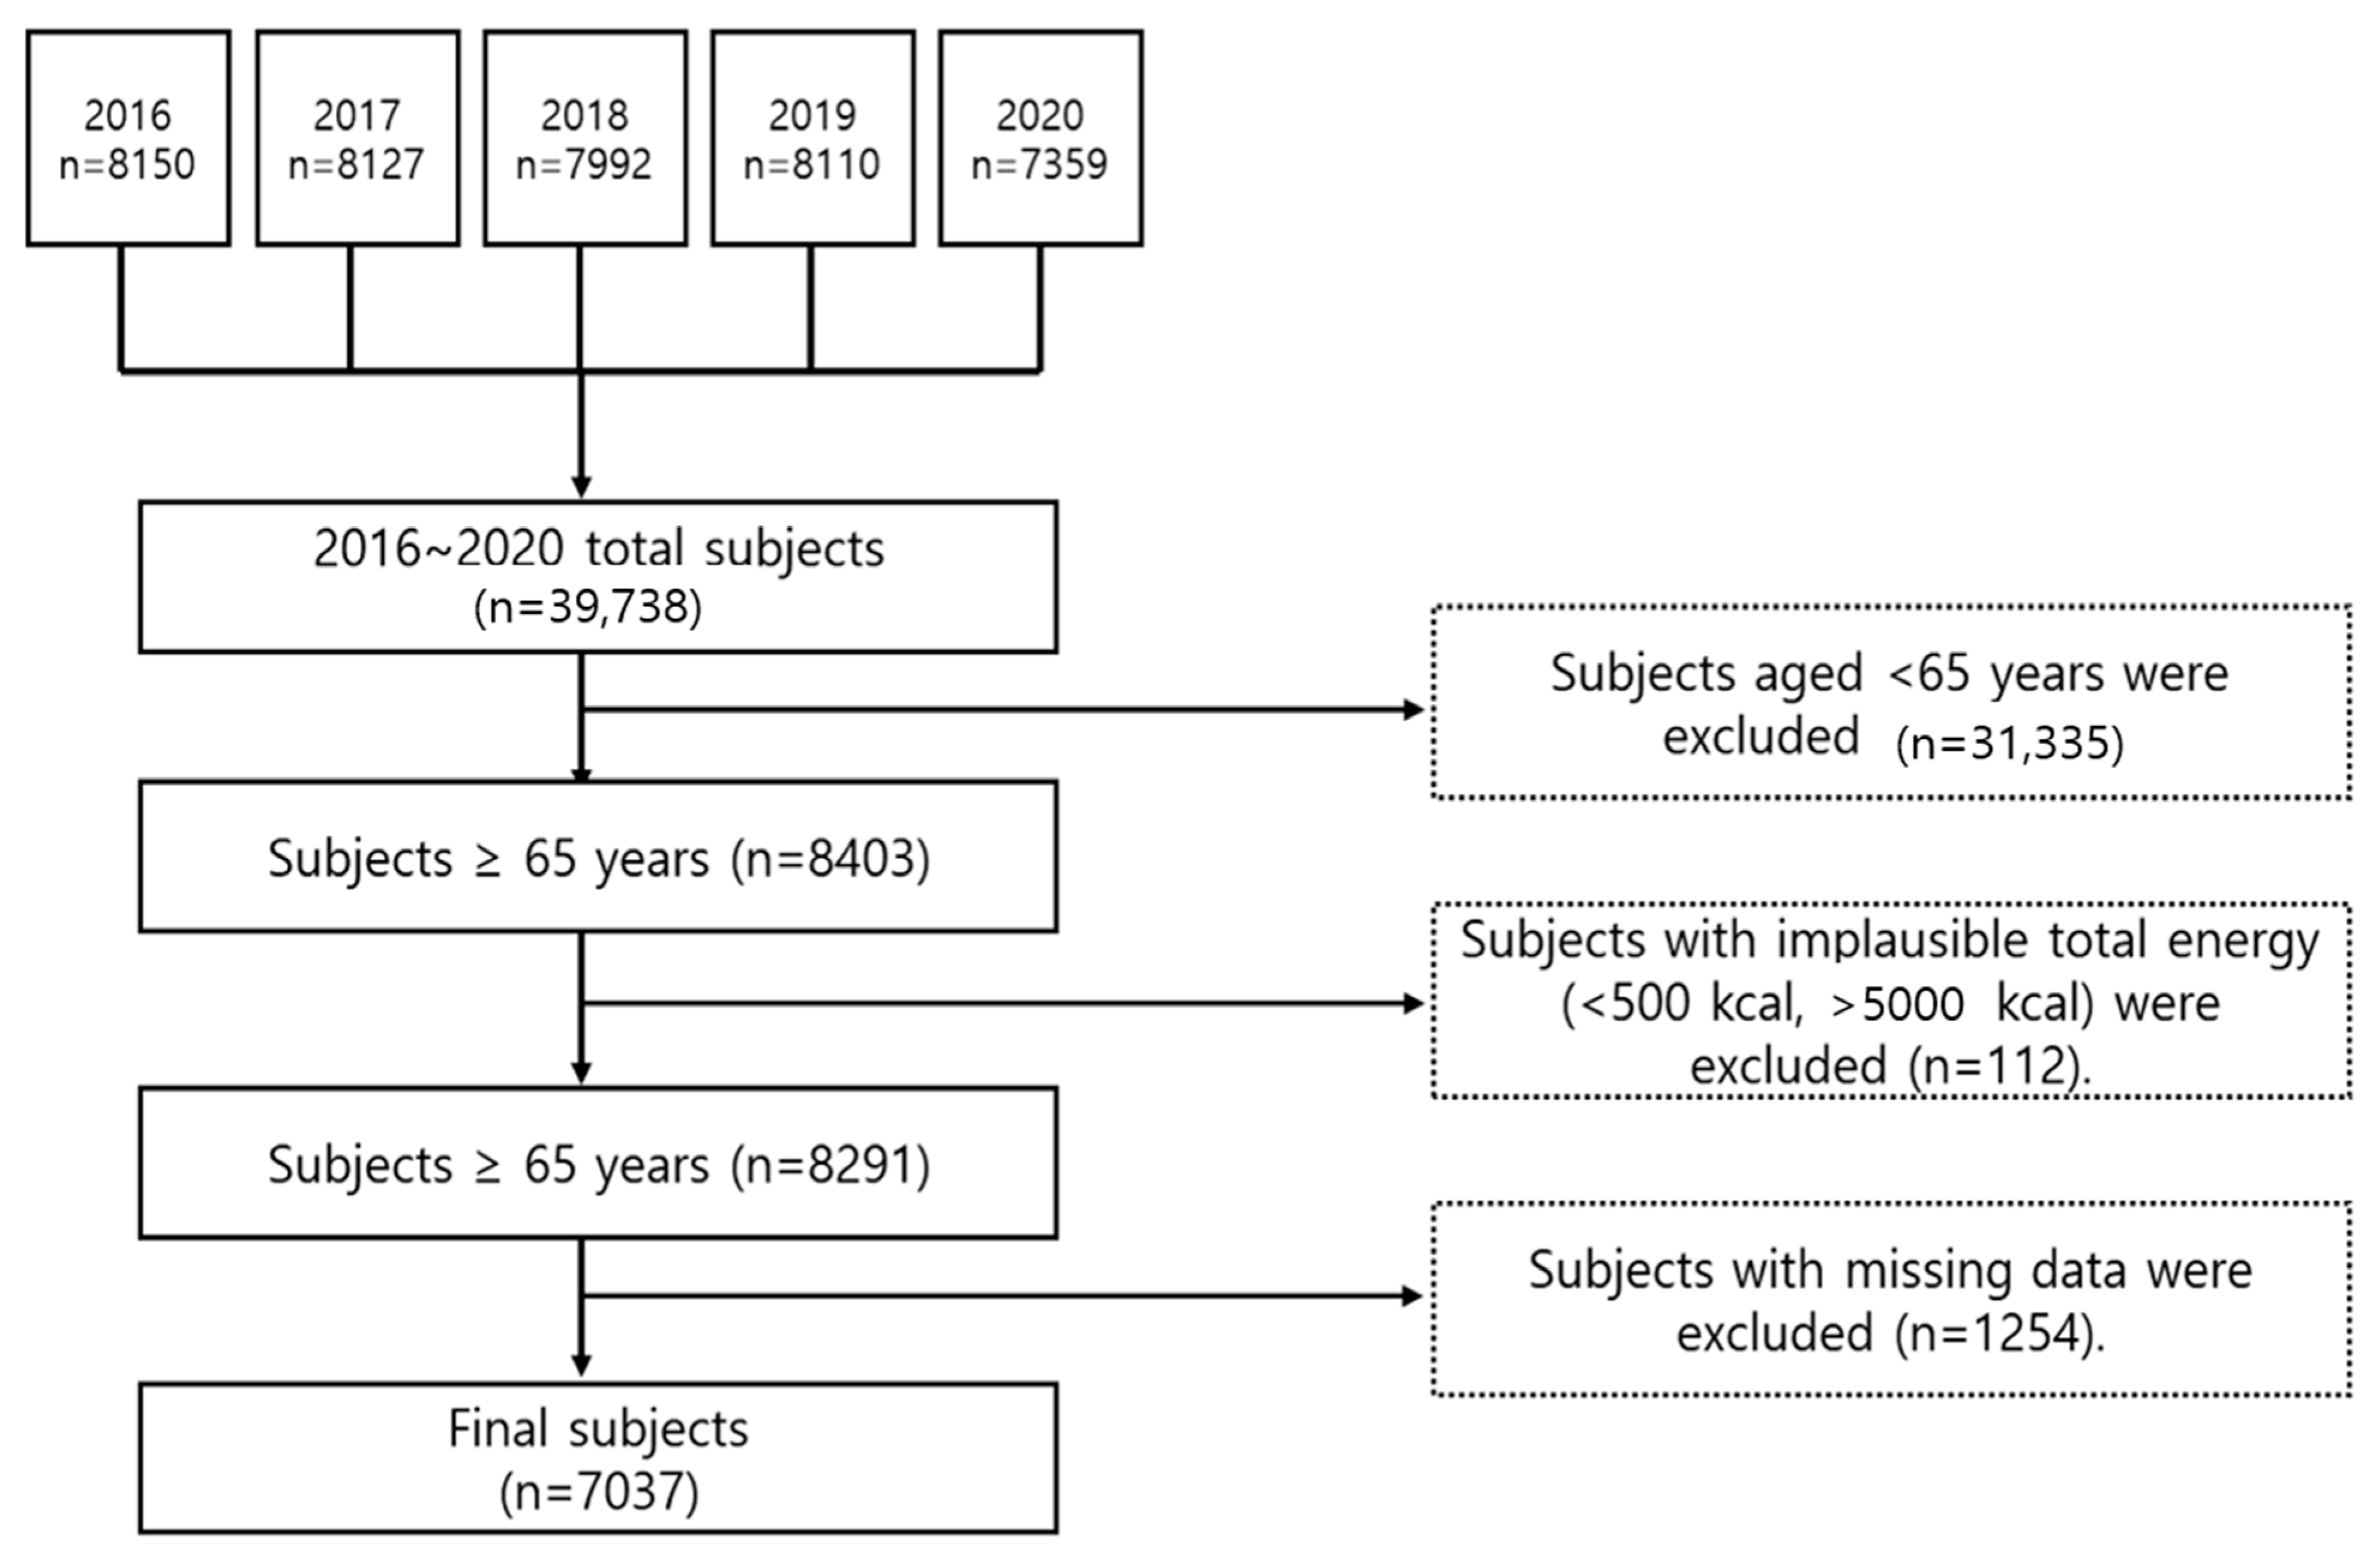
2.2. Subjects
2.3. Meal Pattern According to the Frequency of Eating Alone
2.4. General Characteristics
2.5. Health Related Characteristics
2.6. Dietary Behavior
2.7. Food and Nutrient Intake
2.8. PHQ-9
2.9. EQ-5D
2.10. Statistical Analysis
3. Results
3.1. General Characteristics
3.2. Meal Pattern According to the Frequency of Eating Alone
3.3. Health-Related Characteristics According to the Frequency of Eating Alone
3.4. Dietary Behavior According to the Frequency of Eating Alone
3.5. Food Intake in Their Meal According to Consumption Frequency of Eating Alone
3.6. Nutrient Intake Depending on the Consumption Frequency of Eating Alone
3.7. Depression-Related Survey Results
3.8. Association between the Prevalence of Depression and the Frequency of Eating Alone
3.9. Quality of Life Survey Results
3.10. Relationship between the Frequency of Eating Alone and Quality of Life
4. Discussion
5. Conclusions
Author Contributions
Funding
Institutional Review Board Statement
Informed Consent Statement
Data Availability Statement
Conflicts of Interest
References
- Lee, H.J.; Yoon, J.Y. The Effect of Eating with Others on Depression among Community-dwelling Older Adults by Family Arrangement. Korea Gerontol. Soc. 2019, 39, 415–427. [Google Scholar] [CrossRef]
- Jung, T.Y. Historical and Cultural Analyses of Collective Features of Korean Society. Korean J. Soc. Personal. Psychol. 2010, 24, 53–76. [Google Scholar]
- Nam, S.Y. Proposal of application service for ‘Honbab-jok’according to increasing single households focused on service design methodology. J. Commun. Des. 2016, 55, 114–125. [Google Scholar]
- Jo, M.; Choen, H. People who eat alone: Characteristics by types and their satisfaction. Consum. Policy Educ. Rev. 2018, 141, 127–148. [Google Scholar] [CrossRef]
- Lee, E.J.; Lee, K.R. Comparison of solo eating perception and dietary behaviors according to gender in the Seoul and Gyonggi-do regions. J. Korean Soc. Food Cult. 2018, 33, 531–542. [Google Scholar]
- Herman, C.P.; Polivy, J. Normative influences on food intake. Physiol Behav. 2005, 86, 762–772. [Google Scholar] [CrossRef] [PubMed]
- Park, J.N.; Cheon, H.J. Leisure-alone Folks: Their Experiences and Meaning. J. Leis. Stud. 2012, 10, 87–105. [Google Scholar]
- Park, M.; Ahn, B. Impacts of food consumption lifestyle on the expenditure for the processed food: Using cluster analysis and matching method. J Rural Dev. 2014, 37, 25–58. [Google Scholar]
- Statistics Korea. Available online: https://www.kostat.go.kr/portal/korea/kor_nw/1/1/index.board?bmode=read&aSeq=415446 (accessed on 29 January 2023).
- Jung, H. Y The Effects of Solo Diners’ Self-Determined Motivation for Solitude and Solo Dining Propensity on Solo Dining Satisfaction. Master’s Thesis, Sejong University, Seoul, Republic of Korea, 2017. [Google Scholar]
- Chae, W.; Ju, Y.J.; Shin, J.; Jang, S.I.; Park, E.C. Association between eating behaviour and diet quality: Eating alone vs. eating with others. Nutr J. 2018, 17, 117. [Google Scholar] [CrossRef]
- Lee, Y.; Oh, Y.J.; Cho, W.; Jo, P.K. Differences in solo eating perceptions and dietary behaviors of university students by gender. J. Korean Diet. Assoc. 2015, 21, 57–71. [Google Scholar] [CrossRef]
- Lee, S.H. The main choice menu for the eating-alone group. In ‘Food Safety Day’ Weekly Honbap Symposium; Ministry of Food and Drug Safety: Osong, Republic of Korea, 2017; pp. 13–33. [Google Scholar]
- Shin, G.; Kim, Y.; Kim, M. Nutritional evaluation of convenience meals in convenience stores near the universities. Korean J. Community Nutr. 2017, 22, 375–386. [Google Scholar] [CrossRef]
- Ford, E.S. Prevalence of the metabolic syndrome defined by the international diabetes federation among adults in the U.S. Diabetes Care 2005, 28, 2745–2749. [Google Scholar] [CrossRef] [PubMed]
- Kim, M.R.; Kim, H.J.; Kim, J.H.; Park, B. Sex difference in the relationship between evening meal-sharing and prevalence of metabolic syndrome: The 2013–2014 Korean National Health and Nutrition Examination Survey. Korean J. Fam. Pract. 2018, 8, 125–130. [Google Scholar] [CrossRef]
- Kimura, Y.; Wada, T.; Okumiya, K.; Ishimoto, Y.; Fukutomi, E.; Kasahara, Y.; Matsubayashi, K. Eating alone among community-dwelling Japanese elderly: Association with depression and food diversity. J. Nutr. Health Aging 2012, 16, 728–731. [Google Scholar] [CrossRef]
- Reicks, M.; Davey, C.; Anderson, A.K.; Banna, J.; Cluskey, M.; Gunther, C.; Jones, B.; Richards, R.; Topham, G.; Wong, S.S. Frequency of eating alone is associated with adolescent dietary intake, perceived food-related parenting practices and weight status: Cross-sectional Family Life, Activity, Sun, Health, and Eating (FLASHE) Study results. Public Health Nutr. 2019, 22, 1555–1566. [Google Scholar] [CrossRef]
- Ishikawa, M.; Takemi, Y.; Yokoyama, T.; Kusama, K.; Fukuda, Y.; Nakaya, T.; Nozue, M.; Yoshiike, N.; Yoshiba, K.; Hayashi, F.; et al. “Eating Together” Is Associated with Food Behaviors and Demographic Factors of Older Japanese People Who Live Alone. J. Nutr. Health Aging 2017, 21, 662–672. [Google Scholar] [CrossRef] [PubMed]
- Tanaka, I.; Kitamura, A.; Seino, S.; Nishi, M.; Tomine, Y.; Taniguchi, Y.; Yokoyama, Y.; Narita, M.; Shinkai, S. Relationship between eating alone and dietary variety among urban older Japanese adults. [Nihon Koshu Eisei Zasshi]. Jpn. J. Public Health 2018, 65, 744–754. [Google Scholar]
- Tani, Y.; Kondo, N.; Noma, H.; Miyaguni, Y.; Saito, M.; Kondo, K. Eating alone yet living with others is associated with mortality in older men: The JAGES cohort survey. J. Gerontol. B Psychol. Sci. Soc. Sci. 2018, 73, 1330–1334. [Google Scholar] [CrossRef]
- Huang, Y.C.; Cheng, H.L.; Wahlqvist, M.L.; Lo, Y.T.C.; Lee, M.S. Gender differences in longevity in free-living older adults who eat-with-others: A prospective study in Taiwan. BMJ Open 2017, 7, e016575. [Google Scholar] [CrossRef]
- Li, C.L.; Tung, H.J.; Yeh, M.C. Combined effect of eating alone and a poor nutritional status on cognitive decline among older adults in Taiwan. Asia Pac. J. Clin. Nutr. 2018, 27, 686–694. [Google Scholar]
- RYU, H.S.; Lee, M.A. Eating Alone and Depressive Symptoms of Korean Older Adults: Examining Differential Effects by Gender. Surv. Res. 2019, 20, 1–27. [Google Scholar] [CrossRef]
- Jung, S.H.; Kim, J.H. The Relationship Between Eating Breakfast with Someone and Depression: Based on Korean National Health and Nutrition Examination Survey. Health Soc. Welf. Rev. 2019, 39, 580–601. [Google Scholar] [CrossRef]
- Tani, Y.; Sasaki, Y.; Haseda, M.; Kondo, K.; Kondo, N. Eating alone and depression in older men and women by cohabitation status: The JAGES longitudinal survey. Age Ageing 2015, 44, 1019–1026. [Google Scholar] [CrossRef] [PubMed]
- Kuroda, A.; Tanaka, T.; Hirano, H.; Ohara, Y.; Kikutani, T.; Furuya, H.; Iijima, K. Eating alone as social disengagement is strongly associated with depressive symptoms in Japanese community-dwelling older adults. J. Am. Med. Dir. Assoc. 2015, 16, 578–585. [Google Scholar] [CrossRef]
- Yiengprugsawan, V.; Banwell, C.; Takeda, W.; Dixon, J.; Seubsman, S.A.; Sleigh, A.C. Health, happiness and eating together: What can a large Thai cohort study tell us? Glob. J. Health Sci. 2015, 7, 270–277. [Google Scholar] [CrossRef]
- Ford, E.S.; Li, C. Metabolic syndrome and health-related quality of life among US adults. Ann. Epidemiol. 2008, 18, 165–171. [Google Scholar] [CrossRef]
- Song, E.G.; Yoon, Y.S.; Yang, Y.J.; Lee, E.S.; Lee, J.H.; Lee, J.Y.; Park, S.Y. Factors associated with eating alone in Korean adults: Findings from the sixth Korea National Health and Nutrition Examination Survey, 2014. Korean J. Fam. Pract. 2017, 7, 698–706. [Google Scholar] [CrossRef]
- Eckel, R.H.; Barouch, W.W.; Ershow, A.G. Report of the national heart, lung, and blood institute-national institute of diabetes and digestive and kidney diseases working group on the pathophysiology of obesity-associated cardiovascular disease. Circulation 2002, 105, 2923–2928. [Google Scholar] [CrossRef]
- Kim, H.K.; Chung, J. Associations of the eating alone behavior with nutrient intake, obesity and metabolic syndrome in middle-aged adults based on the 2013~2017 korean national health and nutrition examination survey. J. Nutr. Health 2019, 52, 435–448. [Google Scholar] [CrossRef]
- Cha, S.; Lee, H. Analyzing adolescent family meal vs. alone meal: Focusing on adolescent time use and family characteristics. J. Fam. Relat. 2018, 22, 135–156. [Google Scholar] [CrossRef]
- Sung, S.; Kwon, S. Effect of eating with family or alone on the self-rated mental or physical health-the elementary school children in daejeon area. Korean J. Community Nutr. 2010, 15, 206–226. [Google Scholar]
- Cho, S.E.; Nam, B.; Seo, J.S. Impact of eating-alone on depression in korean female elderly: Findings from the sixth and seventh korea national health and nutrition examination survey, 2014 and 2016. Mood Emot. 2018, 16, 169. [Google Scholar]
- Yang, J.S.; Bae, E.J.; Hong, J.E.; Kang, J.; Jeon, W.J. Eating alone among korean elderly association with depressive symptoms: The korean national health and nutrition examination, 2013. Korean J. Fam. Pract. 2017, 7, 904–908. [Google Scholar] [CrossRef]
- Oh, K.; Lee, J.; Lee, B.; Kweon, S.; Lee, Y.; Kim, Y. Plan and Operation of the 4th Korea National Health and Nutrition Examination Survey (KNHANES IV). Korean J. Epidemiol. 2007, 29, 139–145. [Google Scholar]
- Korea Centers for Disease Control and Prevention. Guideline for Seventh Korea National Health and Nutrition Examination Survey (KNHANES Ⅶ); Korea Centers for Disease Control and Prevention: Osong, Republic of Korea, 2018; pp. 1–303. [Google Scholar]
- Shim, J.S.; Oh, K.W.; Nam, C.M. Association of Household Food Security with Dietary Intake; Based on the Third (2005) Korea National Health and Nutrition Examination Survey (KNHANES III). J. Nutr. Health 2008, 41, 174–183. [Google Scholar]
- Lee, S.J.; Lee, K.W.; Oh, J.E.; Cho, M.S. Nutritional and health consequences are associated with food insecurity among Korean elderly: Based on the fifth (2010) Korea National Health and Nutrition Examination Survey (KNHANES V-1). J. Nutr. Health 2015, 48, 519–529. [Google Scholar] [CrossRef]
- Kong, J.S.; Min, K.B.; Min, J.Y. Temporary Workers’ Skipping of Meals and Eating Alone in South Korea, The Korean National Health and Nutrition Examination Survey for 2013–2016. Int. J. Environ. Res. Public Health 2019, 16, 2319. [Google Scholar] [CrossRef]
- Rah, W.; So, J.; Park, E.C.; Lee, S.A.; Jang, S.I. Association between family dinner and BMI in adults: Data from the 2013 to 2015 Korean National Health and Nutrition Examination Survey. Public Health Nutr. 2019, 22, 681–688. [Google Scholar] [CrossRef]
- Son, H.; Kim, H. Influence of Living Arrangements and Eating Behavior on the Risk of Metabolic Syndrome: A National Cross-Sectional Study in South Korea. Int. J. Environ. Res. Public Health 2019, 16, 919. [Google Scholar] [CrossRef]
- Ahn, J.H.; Park, Y.K. Frequency of eating alone and health related outcomes in Korean adults: Based on the 2016 Korea National Health and Nutrition Examination Survey. J. Korean Diet. Assoc. 2020, 26, 85–100. [Google Scholar]
- Lee, K.W.; Shin, D. Association between Eating Alone Patterns and Mental Health Conditions by Region among Korean Adults. Korean J. Community Nutr. 2021, 26, 441–454. [Google Scholar] [CrossRef]
- Tani, Y.; Kondo, N.; Takagi, D.; Saito, M.; Hikichi, H.; Ojima, T.; Kondo, K. Combined effects of eating alone and living alone on unhealthy dietary behaviors, obesity and underweight in older Japanese adults: Results of the JAGES. Appetite 2015, 95, 1–8. [Google Scholar] [CrossRef] [PubMed]
- Kwon, Y.; Kim, S. How Much Does Plant Food (Fruits and Vegetables) Intake Affect the Prevention of Periodontal Disease in the Korean Elderly? Nutrients 2022, 14, 4589. [Google Scholar] [CrossRef] [PubMed]
- Donini, L.M.; Savina, C.; Cannella, C. Eating habits and appetite control in the elderly: The anorexia of aging. Int. Psychogeriatr. 2003, 15, 73–87. [Google Scholar] [CrossRef] [PubMed]
- Williams, K.L.; Galliher, R.V. Predicting depression and self–esteem from social connectedness, support, and competence. J. Soc. Clin. Psychol. 2006, 25, 855–874. [Google Scholar] [CrossRef]
- Mundel, E.; Chapman, G.E. A decolonizing approach to health promotion in Canada: The case of the Urban Aboriginal Community Kitchen Garden Project. Health Promot. Int. 2010, 25, 166–173. [Google Scholar] [CrossRef]

| Variables | Eating Together n = 3060 (42.37%) | Eating Alone | p-Value (2) | ||||||
|---|---|---|---|---|---|---|---|---|---|
| 1/Day n = 1574 (23.58%) | 2/Day n = 1394 (20.10%) | 3/Day (3) n = 1009 (13.95%) | |||||||
| n | % (1) | n | % | n | % (1) | n | % | ||
| Gender | <0.0001 | ||||||||
| Male | 1519 | 52.03 | 686 | 45.48 | 473 | 36.50 | 357 | 38.53 | |
| Female | 1541 | 47.97 | 888 | 54.52 | 921 | 63.50 | 652 | 61.47 | |
| Age | <0.0001 | ||||||||
| 65–74 | 1844 | 60.54 | 1006 | 64.92 | 757 | 56.30 | 476 | 49.70 | |
| ≥75 | 1216 | 39.46 | 568 | 35.07 | 637 | 43.69 | 533 | 50.30 | |
| Average (Mean, SE) | 72.82 a | 0.12 | 72.32 b | 0.16 | 73.28 a | 0.16 | 74.19 c | 0.18 | <0.0001 (3) |
| Region | <0.0001 | ||||||||
| Urban | 2075 | 73.51 | 1206 | 81.19 | 1046 | 80.90 | 740 | 78.75 | |
| Rural area | 985 | 26.49 | 368 | 18.81 | 348 | 19.10 | 269 | 21.25 | |
| Marital status | <0.0001 | ||||||||
| Married | 3035 | 99.80 | 1568 | 99.77 | 1373 | 98.46 | 995 | 98.78 | |
| Single | 5 | 0.2 | 6 | 0.23 | 21 | 1.54 | 14 | 1.22 | |
| Household number | <0.0001 | ||||||||
| 1 | 112 | 2.85 | 255 | 11.92 | 656 | 36.44 | 662 | 55.06 | |
| 2 | 2145 | 65.10 | 871 | 51.63 | 477 | 36.18 | 214 | 25.30 | |
| 3 | 476 | 18.26 | 251 | 20.08 | 150 | 16.12 | 73 | 11.22 | |
| 4 | 155 | 6.43 | 98 | 7.79 | 53 | 5.72 | 28 | 3.97 | |
| 5 | 103 | 4.16 | 62 | 5.95 | 40 | 3.93 | 22 | 3.47 | |
| ≥6 | 69 | 3.19 | 37 | 2.64 | 18 | 1.62 | 10 | 0.98 | |
| Education level | <0.0001 | ||||||||
| Middle school or less | 1925 | 64.60 | 953 | 63.23 | 917 | 69.45 | 702 | 75.93 | |
| High school or less | 561 | 20.98 | 289 | 21.71 | 216 | 18.92 | 136 | 16.88 | |
| College or more | 358 | 14.42 | 190 | 15.05 | 134 | 11.63 | 62 | 7.18 | |
| Household income | <0.0001 | ||||||||
| Low | 1306 | 40.99 | 603 | 36.79 | 744 | 50.58 | 665 | 60.10 | |
| Middle-low | 933 | 30.26 | 494 | 29.99 | 339 | 23.39 | 195 | 23.21 | |
| Middle-high | 492 | 17.11 | 280 | 19.26 | 180 | 15.69 | 100 | 11.32 | |
| High | 319 | 11.63 | 187 | 13.95 | 122 | 10.33 | 42 | 5.37 | |
| Job status | 0.0274 | ||||||||
| Employed | 1018 | 33.47 | 521 | 36.15 | 384 | 30.43 | 273 | 30.32 | |
| Unemployed | 1829 | 66.52 | 911 | 63.85 | 883 | 69.57 | 629 | 69.68 | |
| Variables | Eating Together n = 3060 | Eating Alone | ||||||
|---|---|---|---|---|---|---|---|---|
| 1/Day n = 1574 | 2/Day n = 1394 | 3/Day n = 1009 | ||||||
| n | % (1) | n | % | n | % | n | % | |
| Eating partner among daily meal | ||||||||
| Everything-alone | - | - | - | - | 349 | 24.92 | 1009 | 100.00 |
| Family | 2251 | 73.77 | - | - | - | - | - | - |
| Family + alone | - | - | 982 | 62.9 | 514 | 39.31 | - | - |
| Other people | 69 | 2.19 | - | - | - | - | - | - |
| Other people + alone | - | - | 289 | 17.7 | 531 | 35.77 | - | - |
| Family + other people | 740 | 24.0 | - | - | - | - | - | - |
| Family + other people + alone | - | - | 303 | 19.37 | - | - | - | - |
| Alone meal in daily meal | ||||||||
| Breakfast (2) | - | - | 628 | 40.28 | - | - | - | - |
| Lunch (3) | - | - | 611 | 38.99 | - | - | - | - |
| Dinner | - | - | 335 | 20.73 | - | - | - | - |
| B (3) + L (4) | - | - | - | - | 431 | 33.30 | - | - |
| B + D (4) | - | - | - | - | 628 | 47.23 | - | - |
| L + D | - | - | - | - | 262 | 19.47 | - | - |
| B + L + D | - | - | - | - | - | - | 1009 | 100.00 |
| Cooking place of solo meal | ||||||||
| Only home | - | - | 1190 | 74.30 | 979 | 69.06 | 690 | 65.82 |
| Only commercial | - | - | 374 | 25.18 | 85 | 5.98 | 23 | 2.01 |
| Only institution | - | - | 10 | 0.53 | 3 | 0.24 | 5 | 0.48 |
| H (5) + C (6) | - | - | - | - | 318 | 24.05 | 282 | 30.86 |
| H + I (7) | - | - | - | - | 6 | 0.34 | 3 | 0.23 |
| C + I | - | - | - | - | 3 | 0.33 | 3 | 0.30 |
| H + C + I | - | - | - | - | - | - | 3 | 0.29 |
| Variables | Eating Together n = 3060 | Eating Alone | p-Value (2) | ||||||
|---|---|---|---|---|---|---|---|---|---|
| 1/Day n = 1574 | 2/Day n = 1394 | 3/Day n = 1009 | |||||||
| n | % (1) | n | % | n | % | n | % | ||
| Smoking status | <0.0001 | ||||||||
| Current smoker | 253 | 9.2 | 135 | 9.1 | 150 | 11.8 | 80 | 8.2 | |
| Ex-smoker | 990 | 33.7 | 450 | 30.0 | 304 | 23.6 | 234 | 25.5 | |
| Non-smoker | 1777 | 57.2 | 960 | 61.0 | 910 | 64.6 | 673 | 66.3 | |
| Drinking status | 0.0005 | ||||||||
| <1/year | 1911 | 61.9 | 992 | 62.8 | 956 | 68.6 | 706 | 70.5 | |
| 1–4/month | 595 | 20.6 | 296 | 19.5 | 224 | 17.4 | 146 | 14.6 | |
| 2–3/week | 269 | 9.4 | 150 | 10.1 | 103 | 7.3 | 67 | 7.8 | |
| ≥4/week | 248 | 8.2 | 109 | 7.6 | 84 | 6.7 | 67 | 7.1 | |
| Stress status | <0.0001 | ||||||||
| Feel it very much | 99 | 2.9 | 48 | 2.3 | 62 | 4.2 | 42 | 4.8 | |
| Feel it somewhat | 406 | 13.1 | 219 | 13.3 | 208 | 15.6 | 169 | 17.9 | |
| Feel it a little | 1628 | 55.4 | 860 | 57.6 | 637 | 47.7 | 433 | 45.1 | |
| Feel it rarely | 882 | 28.6 | 420 | 26.8 | 453 | 32.5 | 338 | 32.2 | |
| Exercise | 0.5960 | ||||||||
| <1/week | 2310 | 79.3 | 1135 | 78.3 | 1058 | 81.5 | 751 | 81.3 | |
| 1–2/week | 104 | 3.9 | 52 | 3.7 | 39 | 3.5 | 30 | 3.8 | |
| 3–4/week | 145 | 5.4 | 74 | 5.4 | 58 | 4.6 | 46 | 5.8 | |
| ≥5/week | 291 | 11.4 | 175 | 12.6 | 113 | 10.4 | 76 | 9.1 | |
| Obesity status | 0.2358 | ||||||||
| Underweight (BMI < 18.5 kg/m2) | 75 | 2.5 | 54 | 3.6 | 47 | 3.4 | 30 | 3.7 | |
| Normal (18.5 kg/m2 ≤ BMI < 23.0 kg/m2) | 1058 | 36.1 | 508 | 31.9 | 459 | 33.7 | 350 | 36.3 | |
| Overweight (23.0 kg/m2 ≤ BMI < 25.0 kg/m2) | 794 | 25.7 | 403 | 27.4 | 348 | 25.5 | 247 | 26.3 | |
| Obesity (BMI ≥ 25.0 kg/m2) | 1092 | 35.7 | 590 | 37.1 | 516 | 37.3 | 354 | 33.7 | |
| Variables | Eating Together n = 3060 | Eating Alone | p-Value (2) | ||||||
|---|---|---|---|---|---|---|---|---|---|
| 1/Day n = 1574 | 2/Day n = 1394 | 3/Day n = 1009 | |||||||
| n | % (1) | n | % | n | % | n | % | ||
| Snack consumption | 0.0003 | ||||||||
| Yes | 2794 | 91.63 | 1443 | 91.98 | 1251 | 89.73 | 876 | 86.72 | |
| No | 266 | 8.36 | 131 | 8.02 | 143 | 10.27 | 133 | 13.28 | |
| Food security | <0.0001 | ||||||||
| Enough food—secure | 1628 | 53.34 | 784 | 50.63 | 594 | 44.39 | 412 | 43.74 | |
| Mildly food insecure | 1330 | 43.24 | 711 | 45.04 | 681 | 48.31 | 503 | 48.40 | |
| Moderately food insecure | 86 | 2.66 | 71 | 3.73 | 99 | 6.19 | 69 | 5.69 | |
| Severely food insecure | 15 | 0.75 | 8 | 0.60 | 18 | 1.12 | 21 | 2.17 | |
| Eating-out Frequency | <0.0001 | ||||||||
| ≥2/day | 32 | 1.02 | 24 | 1.46 | 13 | 1.11 | 10 | 1.09 | |
| 1/day | 94 | 3.68 | 74 | 5.43 | 40 | 3.05 | 18 | 1.93 | |
| 5–6/week | 188 | 6.32 | 129 | 8.22 | 106 | 7.79 | 27 | 2.62 | |
| 3–4/week | 232 | 7.79 | 144 | 9.23 | 97 | 7.25 | 44 | 4.33 | |
| 1–2/week | 765 | 25.53 | 416 | 26.08 | 352 | 25.39 | 239 | 23.43 | |
| <1/week | 1064 | 33.64 | 494 | 31.80 | 429 | 30.25 | 323 | 31.69 | |
| seldom | 685 | 22.02 | 293 | 17.79 | 357 | 25.17 | 347 | 34.90 | |
| g/Day | Eating Together n = 3060 | Eating Alone | Unadjusted p for Trend (1) | Adjusted p for Trend (2) | ||||||
|---|---|---|---|---|---|---|---|---|---|---|
| 1/Day n = 1574 | 2/Day n = 1394 | 3/Day n = 1009 | ||||||||
| Mean | SE | Mean | SE | Mean | SE | Mean | SE | |||
| Total food | 1315.7 | 17.8 | 1298.4 | 19.7 | 1160.2 | 20.7 | 1178.0 | 26.5 | <0.0001(−) | <0.0866(−) |
| Cereals and grain products | 158.9 | 5.5 | 161.0 | 6.0 | 142.7 | 4.9 | 156.1 | 6.7 | <0.0010(+) | 0.0987(+) |
| Potatoes and starches | 20.5 | 1.6 | 28.5 | 3.4 | 20.8 | 2.4 | 18.6 | 2.4 | 0.0967(−) | 0.0511(−) |
| Sugars and sweets | 3.4 | 0.2 | 3.4 | 0.4 | 2.7 | 0.2 | 2.9 | 0.3 | 0.0785(−) | 0.0847(+) |
| Legumes and their products | 22.4 | 1.3 | 28.5 | 2.7 | 22.1 | 1.7 | 30.0 | 3.2 | 0.0450(+) | 0.0994(+) |
| Seeds and nuts | 4.1 | 0.4 | 4.4 | 0.5 | 4.3 | 0.8 | 4.4 | 0.9 | 0.0724(+) | 0.0882(+) |
| Vegetables | 188.2 | 6.8 | 180.0 | 7.2 | 152.1 | 6.8 | 166.3 | 9.2 | 0.0620(−) | 0.0477(−) |
| Mushrooms | 2.8 | 0.3 | 2.4 | 0.4 | 1.2 | 0.2 | 1.5 | 0.4 | 0.0672(−) | 0.0994(−) |
| Fruit | 113.0 | 6.3 | 124.2 | 7.2 | 98.0 | 6.5 | 99.9 | 8.8 | 0.0315(−) | 0.0351(−) |
| Meat, poultry, and their products | 35.2 | 2.2 | 34.0 | 2.3 | 30.7 | 2.9 | 25.7 | 2.9 | 0.0129(−) | 0.0022(−) |
| Eggs | 10.8 | 0.7 | 11.0 | 0.9 | 8.8 | 0.8 | 9.2 | 1.0 | 0.01675(−) | 0.0884(−) |
| Fish and shellfish | 60.0 | 3.6 | 58.8 | 3.9 | 45.8 | 3.5 | 42.9 | 5.6 | 0.0453(−) | 0.0729(−) |
| Seaweed | 18.3 | 1.8 | 21.6 | 2.6 | 13.9 | 1.8 | 14.3 | 3.7 | 0.0675(−) | 0.0324(−) |
| Milks and dairy products | 30.7 | 2.0 | 34.0 | 2.9 | 38.3 | 3.4 | 39.2 | 3.9 | 0.0612(+) | 0.0667(+) |
| Oils and fats | 2.3 | 0.1 | 2.2 | 0.1 | 1.8 | 0.2 | 1.7 | 0.2 | 0.0887(−) | 0.2187(+) |
| Beverages | 62.1 | 4.3 | 72.5 | 5.8 | 52.1 | 5.2 | 35.3 | 4.9 | 0.0665(−) | 0.3664(−) |
| Seasonings | 16.6 | 0.7 | 15.7 | 0.7 | 12.9 | 0.6 | 12.9 | 0.9 | 0.0998(−) | 0.0111(−) |
| Other food | 3.1 | 0.5 | 3.8 | 0.8 | 3.8 | 0.8 | 5.0 | 1.3 | 0.0679(+) | 0.0775(−) |
| g/Day | Eating Together n = 3060 | Eating alone | Unadjusted p for Trend (1) | Adjusted p for Trend (2) | ||||||
|---|---|---|---|---|---|---|---|---|---|---|
| 1/Day n = 1574 | 2/Day n = 1394 | 3/Day n = 1009 | ||||||||
| Mean | SE | Mean | SE | Mean | SE | Mean | SE | |||
| Energy (kcal) | 1682.7 | 16.7 | 1653.9 | 21.5 | 1517.4 | 20.2 | 1576.5 | 22.5 | <0.0001(−) | 0.5353(+) |
| Carbohydrates (g) | 285.0 | 2.5 | 279.8 | 3.8 | 261.3 | 3.2 | 277.3 | 3.7 | <0.0001(−) | 0.0657(+) |
| Protein (g) | 58.0 | 0.8 | 56.0 | 0.9 | 50.3 | 0.9 | 51.3 | 1.0 | <0.0001(−) | <0.0001(−) |
| Fat (g) | 29.3 | 0.7 | 28.3 | 0.6 | 26.0 | 0.7 | 25.6 | 0.8 | <0.0001(−) | 0.2612(+) |
| Calcium (mg) | 464.8 | 7.8 | 457.8 | 9.5 | 426.8 | 9.4 | 434.5 | 10.7 | 0.0006(−) | 0.8470(+) |
| Phosphorus (mg) | 935.5 | 11.4 | 905.1 | 12.9 | 829.4 | 13.2 | 861.8 | 15.7 | <0.0001(−) | 0.1460(−) |
| Iron (mg) | 11.3 | 0.2 | 11.0 | 0.2 | 10.0 | 0.2 | 10.2 | 0.2 | <0.0001(−) | 0.0550(−) |
| Sodium (mg) | 3012.0 | 43.7 | 2815.0 | 51.0 | 2606.4 | 53.8 | 2678.5 | 74.1 | <0.0001(−) | 0.0316(−) |
| Potassium (mg) | 2729.3 | 35.5 | 2633.1 | 43.4 | 2409.1 | 42.9 | 2441.2 | 51.2 | <0.0001(−) | 0.0012(−) |
| Vitamin A (μg RE) | 350.2 | 15.0 | 293.5 | 7.2 | 286.6 | 9.8 | 265.1 | 10.1 | <0.0001(−) | 0.0003(−) |
| Carotene (μg) | 2914.8 | 81.6 | 2558.2 | 73.4 | 2434.9 | 93.9 | 2255.5 | 95.4 | <0.0001(−) | <0.0001(−) |
| Retinol (μg) | 1.2 | 0.0 | 1.1 | 0.0 | 1.1 | 0.0 | 1.1 | 0.0 | 0.0327(−) | 0.1363(−) |
| Thiamine (mg) | 107.2 | 12.4 | 80.2 | 3.5 | 83.6 | 5.0 | 77.1 | 5.0 | <0.0001(−) | 0.8884(−) |
| Riboflavin (mg) | 1.3 | 0.0 | 1.2 | 0.0 | 1.1 | 0.0 | 1.1 | 0.0 | <0.0001(−) | 0.1725(−) |
| Niacin (mg) | 10.8 | 0.2 | 10.4 | 0.2 | 9.4 | 0.2 | 9.5 | 0.2 | <0.0001(−) | 0.0032(−) |
| Vitamin C (mg) | 59.9 | 1.7 | 59.2 | 2.1 | 56.7 | 2.4 | 52.7 | 2.3 | 0.0158(−) | 0.3947(−) |
| Energy Contribution (%, SE) | ||||||||||
| Carbohydrates | 71.4 | 0.3 | 71.6 | 0.3 | 72.3 | 0.3 | 73.2 | 0.4 | <0.0001(+) | 0.0055(+) |
| Protein | 13.7 | 0.1 | 13.5 | 0.1 | 13.1 | 0.1 | 12.9 | 0.1 | <0.0001(−) | <0.0001(−) |
| Fat | 14.9 | 0.2 | 14.9 | 0.2 | 14.6 | 0.3 | 13.9 | 0.3 | 0.0100(−) | 0.0233(−) |
| Patient Health Questionnaire (1) | Eating Together n = 3060 | Eating Alone | ||||||
|---|---|---|---|---|---|---|---|---|
| 1/Day n = 1574 | 2/Day n = 1394 | 3/Day n = 1009 | ||||||
| Mean | SE | Mean | SE | Mean | SE | Mean | SE | |
| 0.24 | 0.02 | 0.19 | 0.02 | 0.27 | 0.03 | 0.32 | 0.04 |
| 0.18 | 0.02 | 0.24 | 0.03 | 0.29 | 0.03 | 0.35 | 0.05 |
| 0.55 | 0.03 | 0.58 | 0.04 | 0.67 | 0.05 | 0.71 | 0.06 |
| 0.52 | 0.03 | 0.51 | 0.04 | 0.57 | 0.05 | 0.62 | 0.05 |
| 0.20 | 0.02 | 0.19 | 0.03 | 0.29 | 0.03 | 0.33 | 0.04 |
| 0.12 | 0.01 | 0.14 | 0.02 | 0.21 | 0.03 | 0.25 | 0.04 |
| 0.11 | 0.01 | 0.13 | 0.02 | 0.14 | 0.02 | 0.16 | 0.03 |
| 0.09 | 0.01 | 0.10 | 0.02 | 0.10 | 0.02 | 0.11 | 0.02 |
| 0.12 | 0.02 | 0.09 | 0.02 | 0.19 | 0.03 | 0.20 | 0.03 |
| Total score | 1.56 | 0.09 | 1.80 | 0.14 | 2.06 | 0.15 | 2.40 | 0.23 |
| Prevalence of depression (n, weighted %) | ||||||||
| Non-depression (<10) (2) | 1726 | 97.30 | 867 | 96.65 | 755 | 96.11 | 568 | 93.84 |
| Depression (≥10) (3) | 64 | 2.70 | 30 | 3.35 | 38 | 3.89 | 40 | 6.16 |
| Eating Together | 1/Day | 2/Day | 3/Day | p for Trend | |
|---|---|---|---|---|---|
| Prevalence of depression | |||||
| Model 1 | 1 (1) | 1.410 (0.613–1.936) (2) | 1.437 (0.898–2.297) | 2.464 (1.527–3.975) | 0.0001 (+) |
| Model 2 | 1 | 1.093 (0.647–1.847) | 1.982 (0.742–1.882) | 2.152 (1.302–3.555) | 0.0010 (+) |
| Model 3 | 1 | 1.253 (0.716–2.193) | 0.942 (0.553–1.604) | 1.775 (1.012–3110) | 0.1286 (+) |
| Model 4 | 1 | 1.103 (0.613–1.985) | 0.938 (0.543–1.622) | 1.573 (0.871–2.838) | 0.4364 (+) |
| Variables | Eating Together n = 3060 | Eating Alone | p-Value | ||||||
|---|---|---|---|---|---|---|---|---|---|
| 1/Day n = 1574 | 2/Day n = 1394 | 3/Day n = 1009 | |||||||
| n | % | n | % | n | % | n | % | ||
| Mobility | <0.0001 | ||||||||
| M1. No problems | 1838 | 60.75 | 966 | 62.23 | 781 | 58.12 | 475 | 48.30 | |
| M2. Some/moderate problems | 986 | 30.23 | 461 | 27.87 | 467 | 31.22 | 409 | 39.80 | |
| M3. Extreme problems | 36 | 0.96 | 14 | 0.66 | 29 | 1.70 | 24 | 1.99 | |
| Non-respondence | 200 | 8.06 | 133 | 9.24 | 117 | 8.97 | 100 | 9.91 | |
| Self-management | 0.0413 | ||||||||
| SM1. No problems | 2583 | 83.68 | 1312 | 83.33 | 1124 | 81.05 | 791 | 79.21 | |
| SM2. Some/moderate problems | 251 | 7.52 | 117 | 6.52 | 145 | 9.52 | 110 | 10.32 | |
| SM3. Extreme problems | 26 | 0.74 | 11 | 0.84 | 9 | 0.52 | 7 | 0.56 | |
| Non-respondence | 200 | 8.06 | 134 | 9.31 | 116 | 8.91 | 100 | 9.91 | |
| Daily activities | 0.0002 | ||||||||
| DA1. No problems | 2332 | 76.21 | 1217 | 77.74 | 996 | 72.72 | 678 | 68.95 | |
| DA2. Some/moderate problems | 487 | 14.59 | 211 | 12.42 | 258 | 16.85 | 216 | 19.78 | |
| DA3. Extreme problems | 41 | 1.14 | 13 | 0.59 | 24 | 1.51 | 13 | 1.32 | |
| Non-respondence | 200 | 8.06 | 133 | 9.24 | 116 | 8.91 | 101 | 9.95 | |
| Pain/Inconvenience | 0.0392 | ||||||||
| PI1. No problems | 1849 | 61.09 | 956 | 60.84 | 780 | 57.93 | 535 | 53.70 | |
| PI2. Some/moderate problems | 874 | 26.58 | 412 | 25.73 | 407 | 27.75 | 308 | 30.28 | |
| PI3. Extreme problems | 133 | 4.13 | 72 | 4.12 | 91 | 5.41 | 63 | 5.95 | |
| Non-respondence | 204 | 8.20 | 134 | 9.31 | 116 | 8.91 | 102 | 10.06 | |
| Anxiety/Depression | 0.001 | ||||||||
| AD1. No problems | 2477 | 80.01 | 1260 | 80.21 | 1065 | 76.11 | 727 | 73.04 | |
| AD2. Some/moderate problems | 352 | 10.81 | 168 | 9.88 | 180 | 13.06 | 159 | 15.46 | |
| AD3. Extreme problems | 28 | 1.03 | 13 | 0.66 | 29 | 1.58 | 20 | 1.54 | |
| Non-respondence | 203 | 8.14 | 133 | 9.24 | 120 | 9.25 | 102 | 9.96 | |
| EQ-5D (1) index (2) (Mean, SE) | 0.82 a | 0.008 | 0.821 a | 0.011 | 0.800 ab | 0.010 | 0.773 b | 0.012 | <0.0001 |
| Eating Together | 1/Day | 2/Day | 3/Day | p for Trend | |
|---|---|---|---|---|---|
| Dependent Variable: Quality of Life | |||||
| Model 1 | 0 (1) | 0.0077 (−0.0019~0.0174) (2) | −0.0152 (−0.0269~−0.0037) | −0.0347 (−0.0482~−0.0211) | <0.0001 (−) |
| Model 2 | 0 | 0.0074 (−0.0019~0.0166) | −0.0030 (−010140~0.0079) | −0.0205 (−0.0333~−0.0077) | 0.0057 (−) |
| Model 3 | 0 | 0.0056 (−0.0034~0.0146) | −0.0024 (−0.0129~0.0080) | −0.0153 (−0.0271~−0.0034) | 0.0273 (−) |
| Model 4 | 0 | 0.0066 (−0.0025~0.0156) | 0.0047 (−0.0058~0.0152) | −0.0040 (−0.0173~0.0091) | 0.9571 (−) |
Disclaimer/Publisher’s Note: The statements, opinions and data contained in all publications are solely those of the individual author(s) and contributor(s) and not of MDPI and/or the editor(s). MDPI and/or the editor(s) disclaim responsibility for any injury to people or property resulting from any ideas, methods, instructions or products referred to in the content. |
© 2023 by the authors. Licensee MDPI, Basel, Switzerland. This article is an open access article distributed under the terms and conditions of the Creative Commons Attribution (CC BY) license (https://creativecommons.org/licenses/by/4.0/).
Share and Cite
Kwon, Y.; Hong, K.H.; Park, Y.-K.; Kim, S. How Does the Frequency of Eating-Alone among Older People in Korea Affect Their Health and Dietary Behavior? Nutrients 2023, 15, 2085. https://doi.org/10.3390/nu15092085
Kwon Y, Hong KH, Park Y-K, Kim S. How Does the Frequency of Eating-Alone among Older People in Korea Affect Their Health and Dietary Behavior? Nutrients. 2023; 15(9):2085. https://doi.org/10.3390/nu15092085
Chicago/Turabian StyleKwon, Yongseok, Kyung Hee Hong, Yoo-Kyung Park, and Sohye Kim. 2023. "How Does the Frequency of Eating-Alone among Older People in Korea Affect Their Health and Dietary Behavior?" Nutrients 15, no. 9: 2085. https://doi.org/10.3390/nu15092085