
The Association between Sarcopenic Obesity and DXA-Derived Visceral Adipose Tissue (VAT) in Adults

 ,
,  ,
,  ,
,  and
and 
Abstract
1. Introduction
2. Materials and Methods
2.1. Participants and Design of the Study
2.2. Body Weight and Height
2.3. Body Composition
2.4. Statistical Analysis
3. Results
4. Discussion
4.1. Findings and Concordance with Previous Studies
4.2. Study Strengths and Limitations
4.3. Clinical Implications and New Directions for Future Research
5. Conclusions
Author Contributions
Funding
Institutional Review Board Statement
Informed Consent Statement
Data Availability Statement
Conflicts of Interest
References
- Boutari, C.; Mantzoros, C. A 2022 update on the epidemiology of obesity and a call to action: As its twin COVID-19 pandemic appears to be receding, the obesity and dysmetabolism pandemic continues to rage on. Metabolism 2022, 133, 155217. [Google Scholar] [CrossRef] [PubMed]
- Bahat, G. Sarcopenic obesity: A hot yet under considered evolving concept. Eur. Geriatr. Med. 2022, 13, 1023–1024. [Google Scholar] [CrossRef]
- Kreidieh, D.; Itani, L.; El Masri, D.; Tannir, H.; Citarella, R.; El Ghoch, M. Association between Sarcopenic Obesity, Type 2 Diabetes, and Hypertension in Overweight and Obese Treatment-Seeking Adult Women. J. Cardiovasc. Dev. Dis. 2018, 5, 51. [Google Scholar] [CrossRef] [PubMed]
- El Ghoch, M.; Pellegrini, M. Why should sarcopenic obesity be included in a routine assessment during weight management programmes? Front. Endocrinol. 2022, 13, 962895. [Google Scholar] [CrossRef] [PubMed]
- Ji, T.; Li, Y.; Ma, L. Sarcopenic Obesity: An Emerging Public Health Problem. Aging Dis. 2022, 13, 379–388. [Google Scholar] [CrossRef] [PubMed]
- Itani, L.; Kreidieh, D.; El Masri, D.; Tannir, H.; El Ghoch, M. The Impact of Sarcopenic Obesity on Health-Related Quality of Life of Treatment-Seeking Patients with Obesity. Curr. Diabetes Rev. 2020, 16, 635–640. [Google Scholar] [CrossRef] [PubMed]
- Benz, E.; Pinel, A.; Guillet, C.; Capel, F.; Pereira, B.; De Antonio, M.; Pouget, M.; Cruz-Jentoft, A.J.; Eglseer, D.; Topinkova, E.; et al. Sarcopenia and Sarcopenic Obesity and Mortality Among Older People. JAMA Netw. Open 2024, 7, e243604. [Google Scholar] [CrossRef] [PubMed]
- Kreidieh, D.; Itani, L.; Tannir, H.; El Masri, D.; El Ghoch, M. Sarcopenic Obesity Predicts Early Attrition in Treatment-Seeking Patients with Obesity: A Longitudinal Pilot Study. J. Cardiovasc. Dev. Dis. 2020, 7, 5. [Google Scholar] [CrossRef]
- El Masri, D.; Itani, L.; Tannir, H.; Kreidieh, D.; El Ghoch, M. The Relationship between Sarcopenic Obesity, Weight-Loss and Maintenance Outcomes during Obesity Management: Are Additional Strategies Required? Clin. Pract. 2021, 11, 525–531. [Google Scholar] [CrossRef]
- Pinel, A.; Guillet, C.; Capel, F.; Pouget, M.; De Antonio, M.; Pereira, B.; Topinkova, E.; Eglseer, D.; Barazzoni, R.; Cruz-Jentoft, A.J.; et al. Identification of factors associated with sarcopenic obesity development: Literature review and expert panel voting. Clin. Nutr. 2024, 43, 1414–1424. [Google Scholar] [CrossRef]
- Shuster, A.; Patlas, M.; Pinthus, J.H.; Mourtzakis, M. The clinical importance of visceral adiposity: A critical review of methods for visceral adipose tissue analysis. Br. J. Radiol. 2012, 85, 1–10. [Google Scholar] [CrossRef] [PubMed]
- Fox, C.S.; Massaro, J.M.; Hoffmann, U.; Pou, K.M.; Maurovich-Horvat, P.; Liu, C.Y.; Vasan, R.S.; Murabito, J.M.; Meigs, J.B.; Cupples, L.A.; et al. Abdominal visceral and subcutaneous adipose tissue compartments: Association with metabolic risk factors in the Framingham Heart Study. Circulation 2007, 116, 39–48. [Google Scholar] [CrossRef] [PubMed]
- Nicklas, B.J.; Penninx, B.W.; Ryan, A.S.; Berman, D.M.; Lynch, N.A.; Dennis, K.E. Visceral adipose tissue cutoffs associated with metabolic risk factors for coronary heart disease in women. Diabetes Care 2003, 26, 1413–1420. [Google Scholar] [CrossRef] [PubMed]
- Poirier, P.; Despres, J.P. Waist circumference, visceral obesity, and cardiovascular risk. J. Cardiopulm. Rehabil. 2003, 23, 161–169. [Google Scholar] [CrossRef] [PubMed]
- Nguyen, T.T.; Hulme, J.; Vo, T.K.; Van Vo, G. The Potential Crosstalk Between the Brain and Visceral Adipose Tissue in Alzheimer’s Development. Neurochem. Res. 2022, 47, 1503–1512. [Google Scholar] [CrossRef] [PubMed]
- Kim, S.; Yi, H.A.; Won, K.S.; Lee, J.S.; Kim, H.W. Association between Visceral Adipose Tissue Metabolism and Alzheimer’s Disease Pathology. Metabolites 2022, 12, 258. [Google Scholar] [CrossRef] [PubMed]
- Cheng, Y.; Wang, Z.; Jia, X.; Zhou, R.; Wang, J. Association Between Abdominal Adipose Tissue Distribution and Risk of Endometrial Cancer: A Case-Control Study. Clin. Med. Insights Oncol. 2022, 16, 11795549221140776. [Google Scholar] [CrossRef] [PubMed]
- Cosan, A.S.; Schweiger, J.U.; Kahl, K.G.; Hamann, B.; Deuschle, M.; Schweiger, U.; Westermair, A.L. Fat compartments in patients with depression: A meta-analysis. Brain Behav. 2021, 11, e01912. [Google Scholar] [CrossRef] [PubMed]
- Kolb, H. Obese visceral fat tissue inflammation: From protective to detrimental? BMC Med. 2022, 20, 494. [Google Scholar] [CrossRef]
- Morawin, B.; Tylutka, A.; Bielewicz, F. AZ-L Diagnostics of inflammaging in relation to sarcopenia. Front. Public. Health 2023, 11, 1162385. [Google Scholar] [CrossRef]
- Chang, K.V.; Wu, W.T.; Chen, Y.H.; Chen, L.R.; Hsu, W.H.; Lin, Y.L.; Han, D. Enhanced serum levels of tumor necrosis factor-α, interleukin-1β, and -6 in sarcopenia: Alleviation through exercise and nutrition intervention. Aging 2023, 15, 13471–13485. [Google Scholar] [CrossRef] [PubMed]
- Li, C.W.; Yu, K.; Shyh-Chang, N.; Jiang, Z.; Liu, T.; Ma, S.; Luo, L.; Guang, L.; Liang, K.; Ma, W.; et al. Pathogenesis of sarcopenia and the relationship with fat mass: Descriptive review. J. Cachexia Sarcopenia Muscle 2022, 13, 781–794. [Google Scholar] [CrossRef] [PubMed]
- Pescatori, L.C.; Savarino, E.; Mauri, G.; Silvestri, E.; Cariati, M.; Sardanelli, F.; Sconfienza, L.M. Quantification of visceral adipose tissue by computed tomography and magnetic resonance imaging: Reproducibility and accuracy. Radiol. Bras. 2019, 52, 1–6. [Google Scholar] [CrossRef] [PubMed]
- Song, M.Y.; Ruts, E.; Kim, J.; Janumala, I.; Heymsfield, S.; Gallagher, D. Sarcopenia and increased adipose tissue infiltration of muscle in elderly African American women. Am. J. Clin. Nutr. 2004, 79, 874–880. [Google Scholar] [CrossRef] [PubMed]
- Casadei, K.; Kiel, J. Anthropometric Measurement. In StatPearls; StatPearls Publishing: Treasure Island, FL, USA, 2022. [Google Scholar]
- NCSS. Hintze JPASS 12; Kaysville LLC, Utah, USA. 2013. Available online: http://www.ncss.com (accessed on 23 April 2024).
- Di Daniele, N.; Petramala, L.; Di Renzo, L.; Sarlo, F.; Della Rocca, D.G.; Rizzo, M.; Fondacaro, V.; Iacopino, L.; Pepine, C.J. ADL Body composition changes and cardiometabolic benefits of a balanced Italian Mediterranean Diet in obese patients with metabolic syndrome. Acta Diabetol. 2013, 50, 409–416. [Google Scholar] [CrossRef] [PubMed]
- Janssen, I.; Heymsfield, S.B.; Ross, R. Low relative skeletal muscle mass (sarcopenia) in older persons is associated with functional impairment and physical disability. J. Am. Geriatr. Soc. 2002, 50, 889–896. [Google Scholar] [CrossRef] [PubMed]
- Lim, S.; Kim, J.H.; Yoon, J.W.; Kang, S.M.; Choi, S.H.; Park, Y.J.; Kim, K.W.; Lim, J.Y.; Park, K.S.; Jang, H. Sarcopenic obesity: Prevalence and association with metabolic syndrome in the Korean Longitudinal Study on Health and Aging (KLoSHA). Diabetes Care 2010, 33, 1652–1654. [Google Scholar] [CrossRef]
- Coin, A.; Sarti, S.; Ruggiero, E.; Giannini, S.; Pedrazzoni, M.; Minisola, S.; Rossini, M.; Del Puente, A.; Meral Inelmen, E.; Manzato, E.; et al. Prevalence of sarcopenia based on different diagnostic criteria using DEXA and appendicular skeletal muscle mass reference values in an Italian population aged 20 to 80. J. Am. Med. Dir. Assoc. 2013, 14, 507–512. [Google Scholar] [CrossRef]
- Poggiogalle, E.; Lubrano, C.; Sergi, G.; Coin, A.; Gnessi, L.; Mariani, S.; Lenzi, A.; Donini, L. Sarcopenic Obesity and Metabolic Syndrome in Adult Caucasian Subjects. J. Nutr. Health Aging 2016, 20, 958–963. [Google Scholar] [CrossRef]
- Di Renzo, L.; Gualtieri, P.; Zomparelli, S.; De Santis, G.L.; Seraceno, S.; Zuena, C.; Frank, G.; Cianci, R.; Centofanti, D.; De Lorenzo, A. Modified Mediterranean-Ketogenic Diet and Carboxytherapy as Personalized Therapeutic Strategies in Lipedema: A Pilot Study. Nutrients 2023, 15, 3654. [Google Scholar] [CrossRef]
- IBM Corp. IBM SPSS Statistics for Windows, Version 26.0; IBM Corp.: Armonk, NY, USA, 2019. [Google Scholar]
- Liu, C.; Cheng, K.Y.; Tong, X.; Cheung, W.H.; Chow, S.K.; Law, S.W.; Wong, R. The role of obesity in sarcopenia and the optimal body composition to prevent against sarcopenia and obesity. Front. Endocrinol. 2023, 14, 1077255. [Google Scholar] [CrossRef] [PubMed]
- Kim, T.N.; Park, M.S.; Ryu, J.Y.; Choi, H.Y.; Hong, H.C.; Yoo, H.J.; Kang, H.J.; Song, W.; Park, S.W.; Baik, S.H.; et al. Impact of visceral fat on skeletal muscle mass and vice versa in a prospective cohort study: The Korean Sarcopenic Obesity Study (KSOS). PLoS ONE 2014, 9, e115407. [Google Scholar] [CrossRef] [PubMed]
- Kawai, T.; Autieri, M.V.; Scalia, R. Adipose tissue inflammation and metabolic dysfunction in obesity. Am. J. Physiol. Cell Physiol. 2021, 320, C375–C391. [Google Scholar] [CrossRef] [PubMed]
- Kelly, A.S.; Kaizer, A.M.; Bosch, T.A.; Rudser, K.D.; Ryder, J.R.; Gross, A.C.; Chow, L.S.; Fox, C.K.; Dengel, D. Reaching the Tipping Point: Identification of Thresholds at which Visceral Adipose Tissue May Steeply Increase in Youth. Obesity 2020, 28, 139–145. [Google Scholar] [CrossRef] [PubMed]
- Xu, X.; Wen, Z. The mediating role of inflammaging between mitochondrial dysfunction and sarcopenia in aging: A review. Am. J. Clin. Exp. Immunol. 2023, 12, 109–126. [Google Scholar] [PubMed]
- Louis, T.A.; Robins, J.; Dockery, D.W.; Spiro, A.; Ware, J. Explaining discrepancies between longitudinal and cross-sectional models. J. Chronic Dis. 1987, 40, 368. [Google Scholar] [CrossRef] [PubMed]
- Bleeker, S.E.; Moll, H.A.; Steyerberg, E.W.; Donders, A.R.T.; Derksen-Lubsen, G.; Grobbee, D.E.; Moons, K.G.M. External validation is necessary in prediction research: A clinical example. J. Clin. Epidemiol. 2003, 56, 826–832. [Google Scholar] [CrossRef] [PubMed]
- Ashby-Thompson, M.; Heshka, S.; Rizkalla, B.; Zurlo, R.; Lemos, T.; Janumala, I.; Goodpaster, B.; DeLany, J.; Courcoulas, A.; Strain, G.; et al. Validity of dual-energy x-ray absorptiometry for estimation of visceral adipose tissue and visceral adipose tissue change after surgery-induced weight loss in women with severe obesity. Obesity 2022, 30, 1057–1065. [Google Scholar] [CrossRef] [PubMed]
- Donini, L.M.; Busetto, L.; Bischoff, S.C.; Cederholm, T.; Ballesteros-Pomar, M.D.; Batsis, J.A.; Bauer, J.M.; Boirie, Y.; Cruz-Jentoft, A.J.; Dicker, D.; et al. Definition and Diagnostic Criteria for Sarcopenic Obesity: ESPEN and EASO Consensus Statement. Obes. Facts 2022, 15, 321–335. [Google Scholar] [CrossRef]
- So, R.; Matsuo, T.; Saotome, K.; Tanaka, K. Equation to estimate visceral adipose tissue volume based on anthropometry for workplace health checkup in Japanese abdominally obese men. Ind. Health 2017, 55, 416–422. [Google Scholar] [CrossRef]
- Michel, S.; Linder, N.; Linder, A.; Eggebrecht, T.; Schaudinn, A.; Blüher, M.; Dietrich, A.; Denecke, T.; Busse, H. Anthropometric estimators of abdominal fat volume in adults with overweight and obesity. Int. J. Obes. 2023, 47, 306–312. [Google Scholar] [CrossRef] [PubMed]


| Total N = 256 | Non SO N = 173 | SO N = 83 | Significance ¥ | |
|---|---|---|---|---|
| Age (years) | 51.0 (47.0–54.0) | 50.0 (47.0–54.0) | 52.0 (48.0–55.0) | p = 0.186 |
| Sex | X2 = 0.059; p = 0.808 | |||
| Males | 195 (76.2) | 131 (75.7) | 64 (77.1) | |
| Females | 61 (23.8) | 42 (24.3) | 19 (31.1) | |
| Weight (kg) | 88.2 (80.5–100.8) | 85.9 (78.3–93.6) | 98.1 (86.9–111.4) | p < 0.0001 |
| Height (m2) | 174.0 (168.0–179.0) | 174.0 (168.0–179.7) | 174.0 (168.5–176.6) | p = 0.459 |
| BMI (kg/m2) | 29.3 (27.0–32.4) | 28.0 (26.7–30.2) | 32.9 (29.6–37.0) | p < 0.0001 |
| X2 = 49.1; p < 0.0001 | ||||
| Overweight | 146 (56.8) | 124 (71.7) | 21 (25.3) | |
| Obesity | 111 (43.2) | 49 (28.3) | 62 (74.7) | |
| ALM (kg) | 27.0 (22.8–29.4) | 27.7 (23.6–29.8) | 25.7 (21.3–28.8) | p = 0.004 |
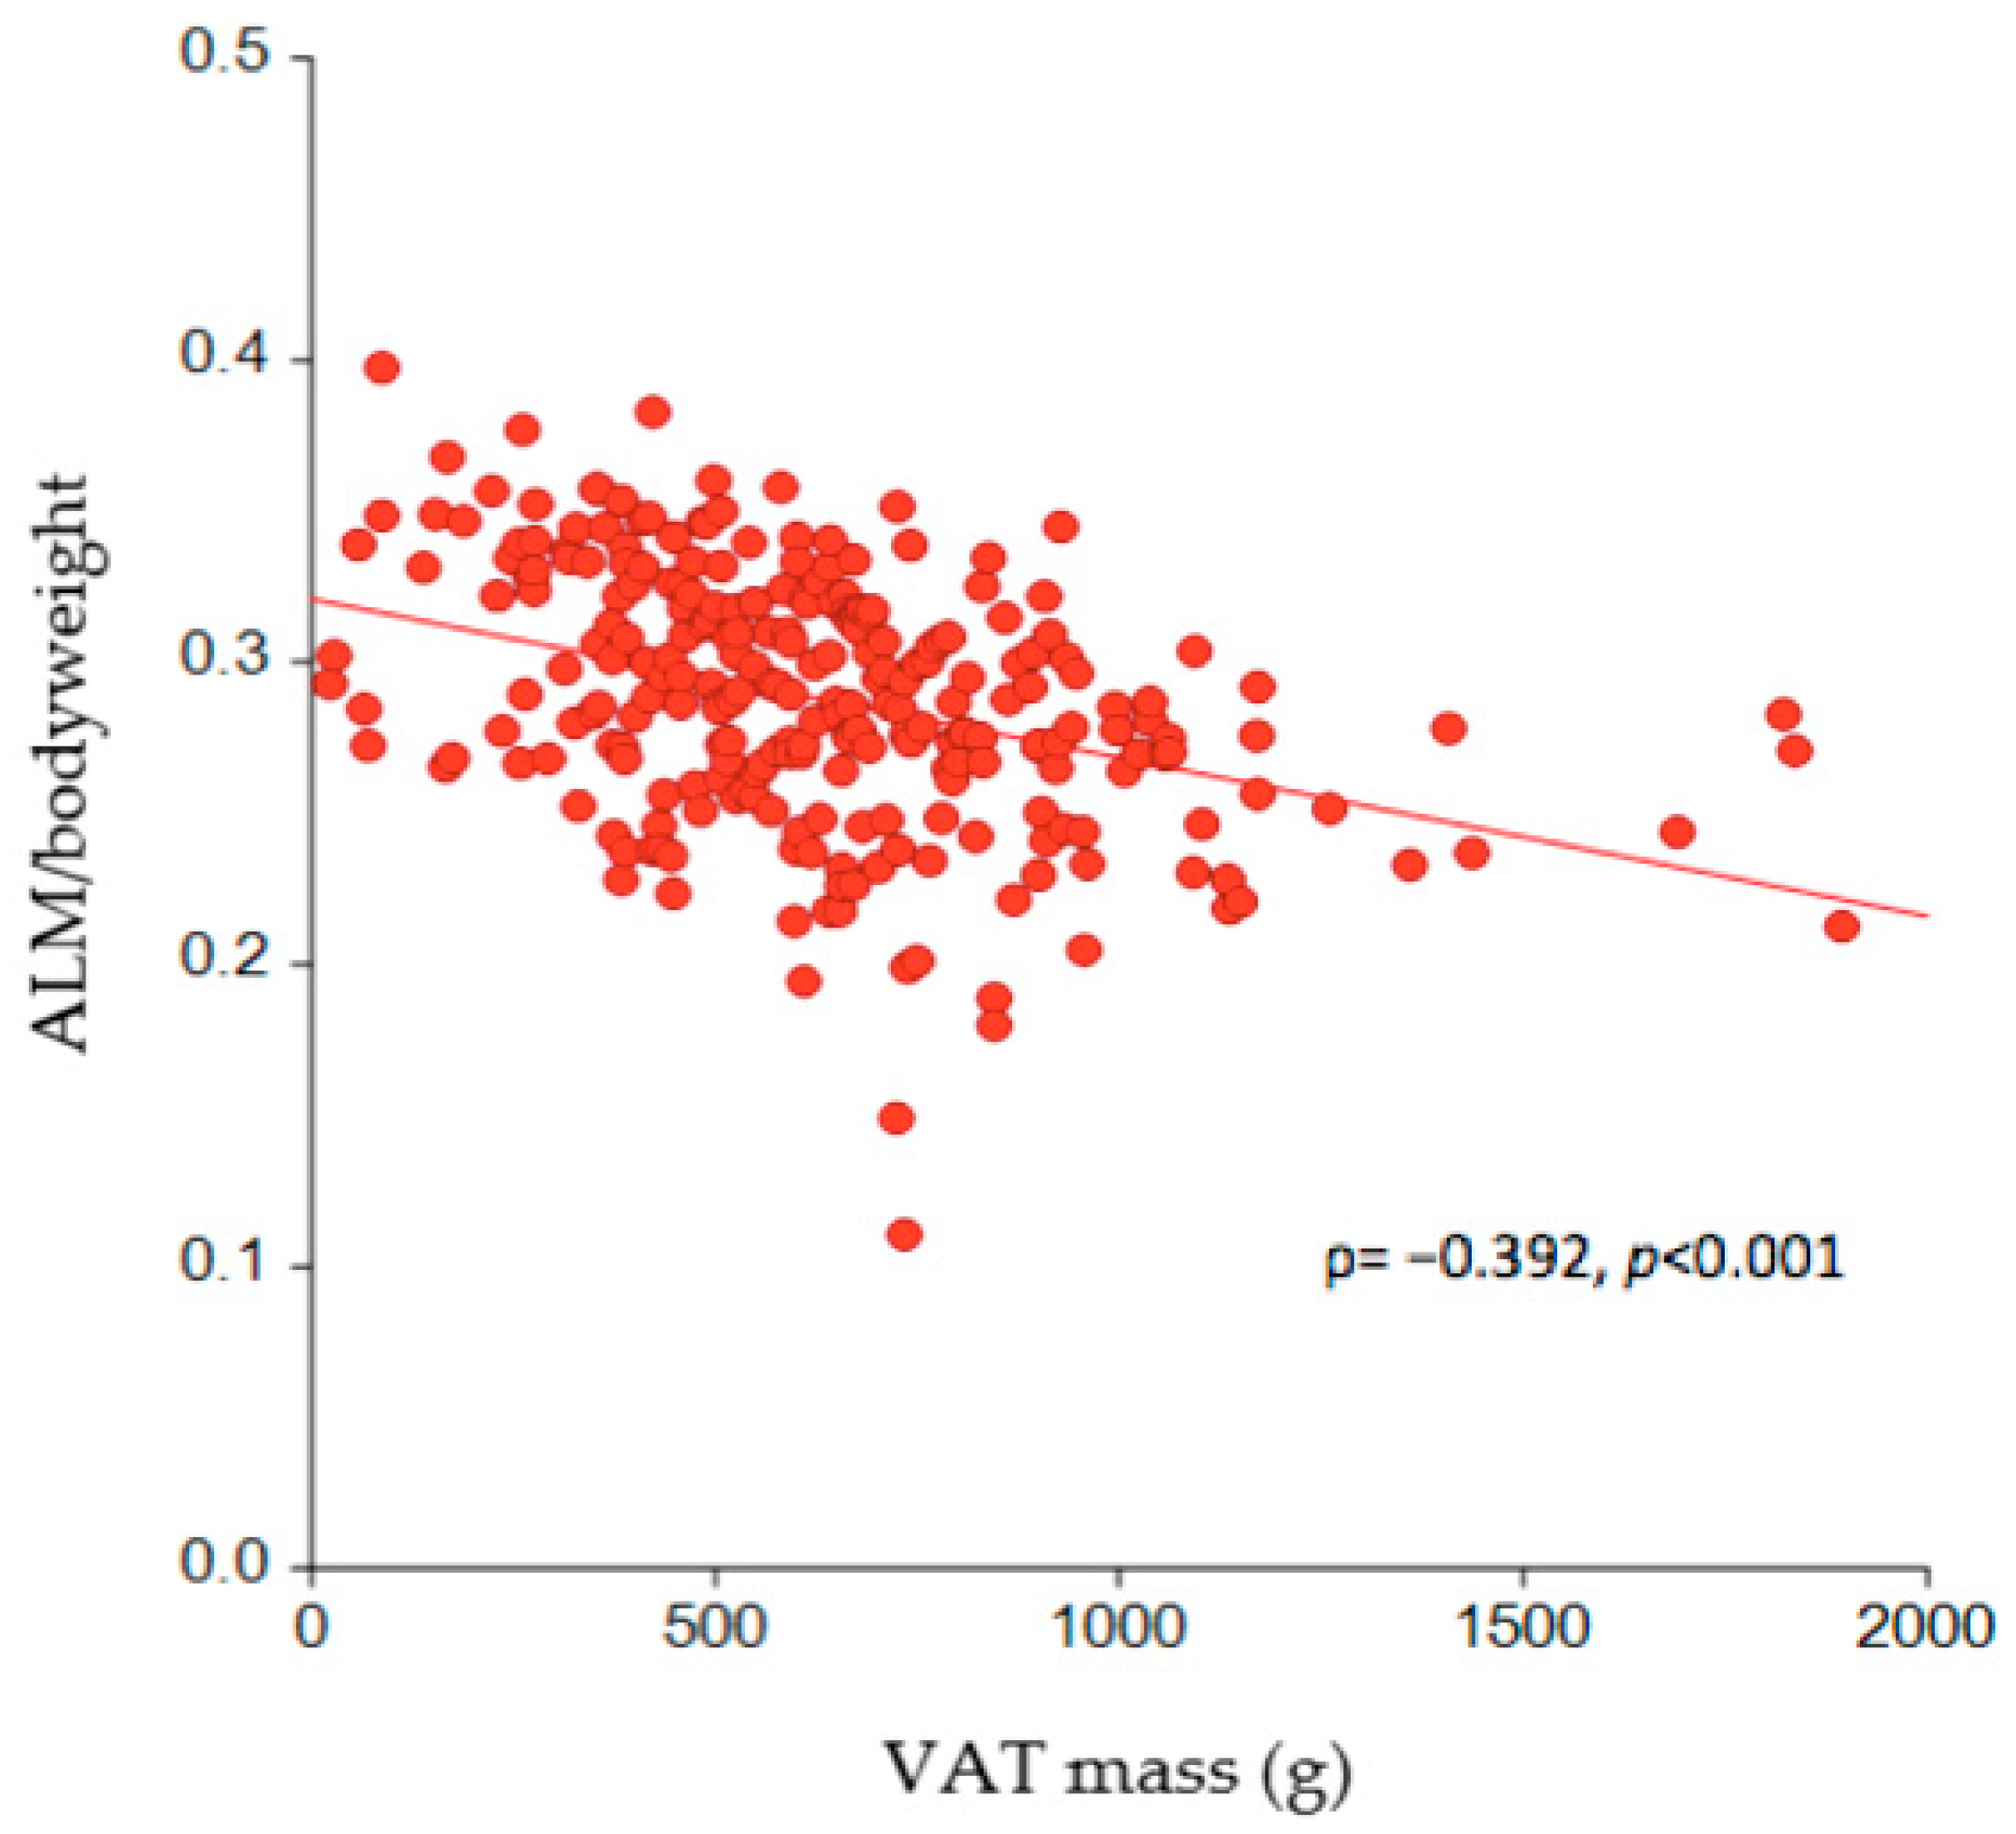
| ALM/body weight ratio | 0.29 (0.26–0.32) | 0.31 (0.29–0.33) | 0.26 (0.23–0.27) | p < 0.0001 |
| ALM (%) | 28.7 (26.4–31.9) | 30.8 (28.7–33.1) | 25.6 (23.0–27.3) | p < 0.0001 |
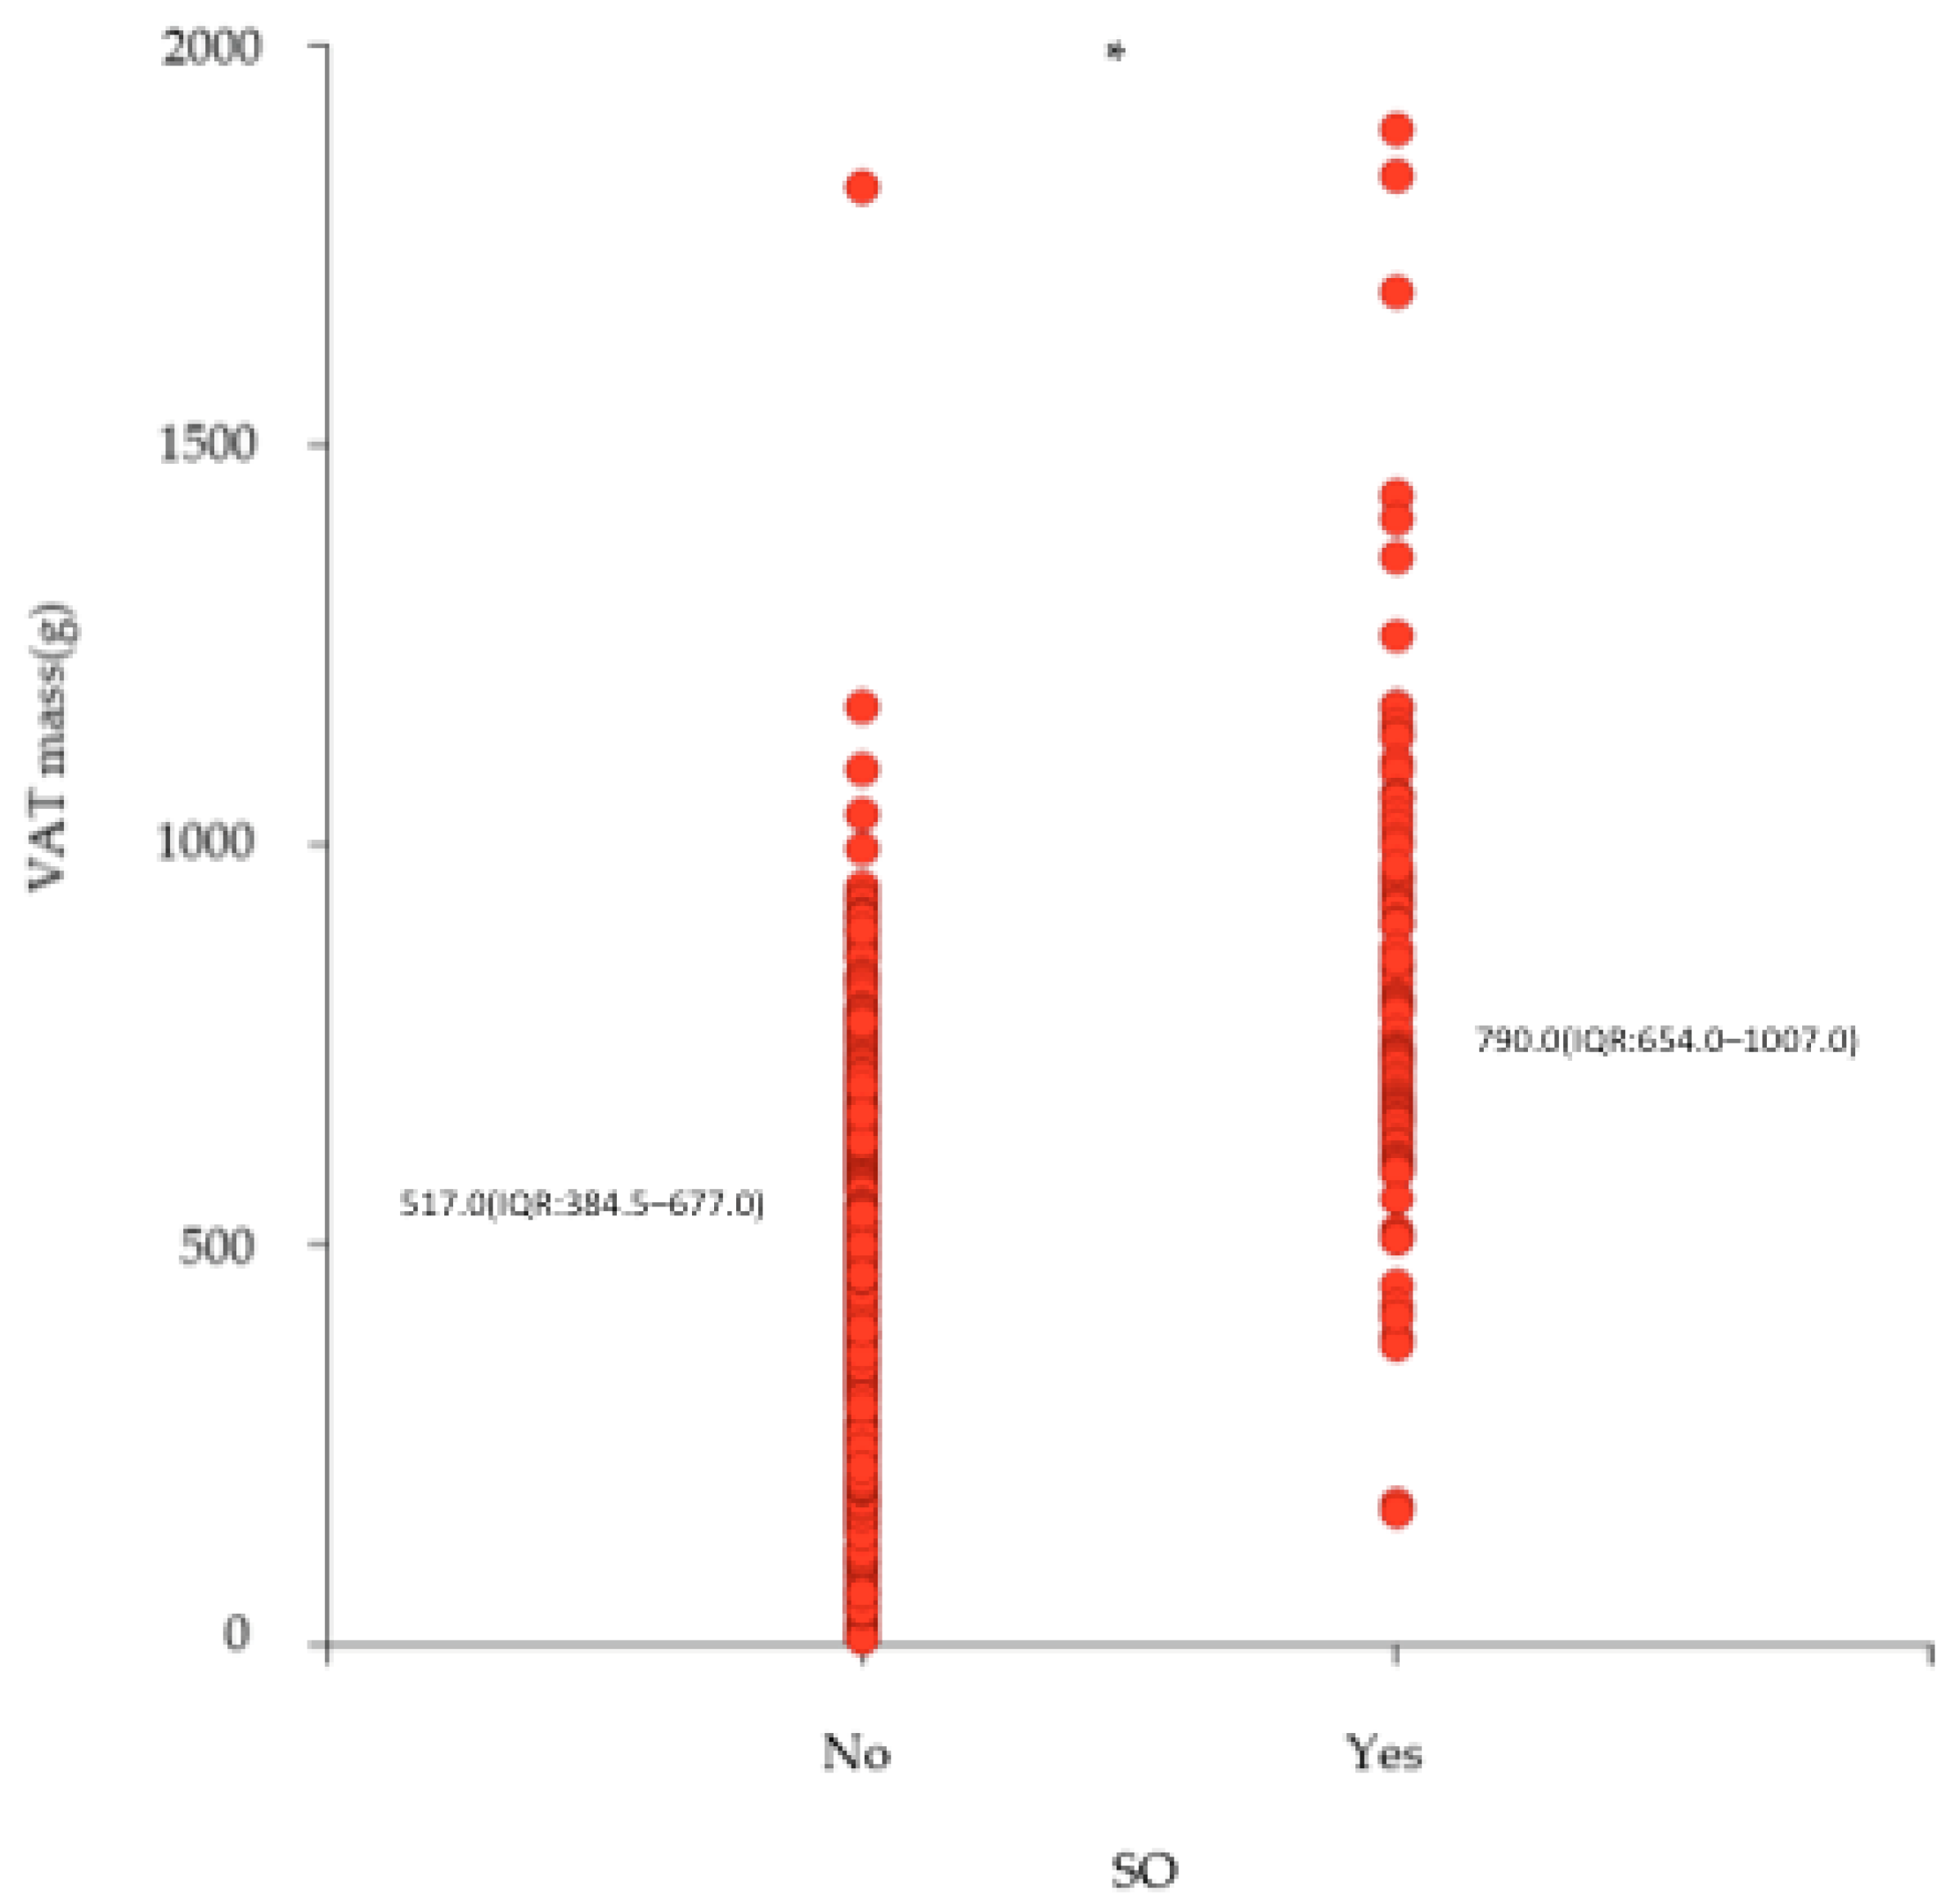
| VAT mass (g) | 608.0 (433.8–793.0) | 517.0 (384.5–677.0) | 790.0 (654.0–1007.0) | p < 0.0001 |
| X2 = 52.0; p < 0.0001 | ||||
| 1st tertile | 85 (33.2) | 79 (45.7) | 6 (7.2) | |
| 2nd tertile | 86 (33.6) | 59 (34.1) | 27 (32.5) | |
| 3rd tertile | 85 (33.2) | 35 (20.2) | 50 (60.2) |
| Simple Regression | Multivariate Regression | |
|---|---|---|
| OR (95%CI) | ||
| Age (years) | 1.002 (0.972–1.034) | 1.019 (0.980–1.059) |
| Sex | ||
| Males | 1.00 | 1.00 |
| Females | 0.926 (0.499–1.719) | 1.349 (0.625–2.911) |
| BMI (kg/m2) | 1.412 (1.283–1.554) | 1.308 (1.179–1.451) |
| VAT (g) | 1.004 (1.003–1.006) | 1.003 (1.001–1.004) |
| Simple Regression | Multivariate Regression | |
|---|---|---|
| OR (95%CI) | ||
| Age (years) | 1.002 (0.972–1.034) | 1.017 (0.977–1.058) |
| Sex | ||
| Males | 1.000 | 1.00 |
| Females | 0.926 (0.499–1.719) | 1.244 (0.571–2.712) |
| BMI (kg/m2) | 1.412 (1.283–1.554) | 1.354 (1.217–1.506) |
| VAT (g) | ||
| 1st tertile | 1.000 | 1.000 |
| 2nd tertile | 6.025 (2.338–15.529) | 5.319 (1.940–14.587) |
| 3rd tertile | 18.810 (7.380–47.943) | 7.365 (2.666–20.342) |
Disclaimer/Publisher’s Note: The statements, opinions and data contained in all publications are solely those of the individual author(s) and contributor(s) and not of MDPI and/or the editor(s). MDPI and/or the editor(s) disclaim responsibility for any injury to people or property resulting from any ideas, methods, instructions or products referred to in the content. |
© 2024 by the authors. Licensee MDPI, Basel, Switzerland. This article is an open access article distributed under the terms and conditions of the Creative Commons Attribution (CC BY) license (https://creativecommons.org/licenses/by/4.0/).
Share and Cite
De Lorenzo, A.; Itani, L.; El Ghoch, M.; Frank, G.; De Santis, G.L.; Gualtieri, P.; Di Renzo, L. The Association between Sarcopenic Obesity and DXA-Derived Visceral Adipose Tissue (VAT) in Adults. Nutrients 2024, 16, 1645. https://doi.org/10.3390/nu16111645
De Lorenzo A, Itani L, El Ghoch M, Frank G, De Santis GL, Gualtieri P, Di Renzo L. The Association between Sarcopenic Obesity and DXA-Derived Visceral Adipose Tissue (VAT) in Adults. Nutrients. 2024; 16(11):1645. https://doi.org/10.3390/nu16111645
Chicago/Turabian StyleDe Lorenzo, Antonino, Leila Itani, Marwan El Ghoch, Giulia Frank, Gemma Lou De Santis, Paola Gualtieri, and Laura Di Renzo. 2024. "The Association between Sarcopenic Obesity and DXA-Derived Visceral Adipose Tissue (VAT) in Adults" Nutrients 16, no. 11: 1645. https://doi.org/10.3390/nu16111645
APA StyleDe Lorenzo, A., Itani, L., El Ghoch, M., Frank, G., De Santis, G. L., Gualtieri, P., & Di Renzo, L. (2024). The Association between Sarcopenic Obesity and DXA-Derived Visceral Adipose Tissue (VAT) in Adults. Nutrients, 16(11), 1645. https://doi.org/10.3390/nu16111645