
The Effects of Breastfeeding on Childhood Behavioral and Emotional Development: A Prospective Cohort Study in China
 and
and
Abstract
:1. Introduction
2. Materials and Methods
2.1. Participants and Study Design
2.2. Exposure, Outcomes, and Covariates
2.3. Statistical Analyses
3. Results
3.1. Participant Characteristics
3.2. Feeding Patterns for the First 6 mo and Behavioral and Emotional Development
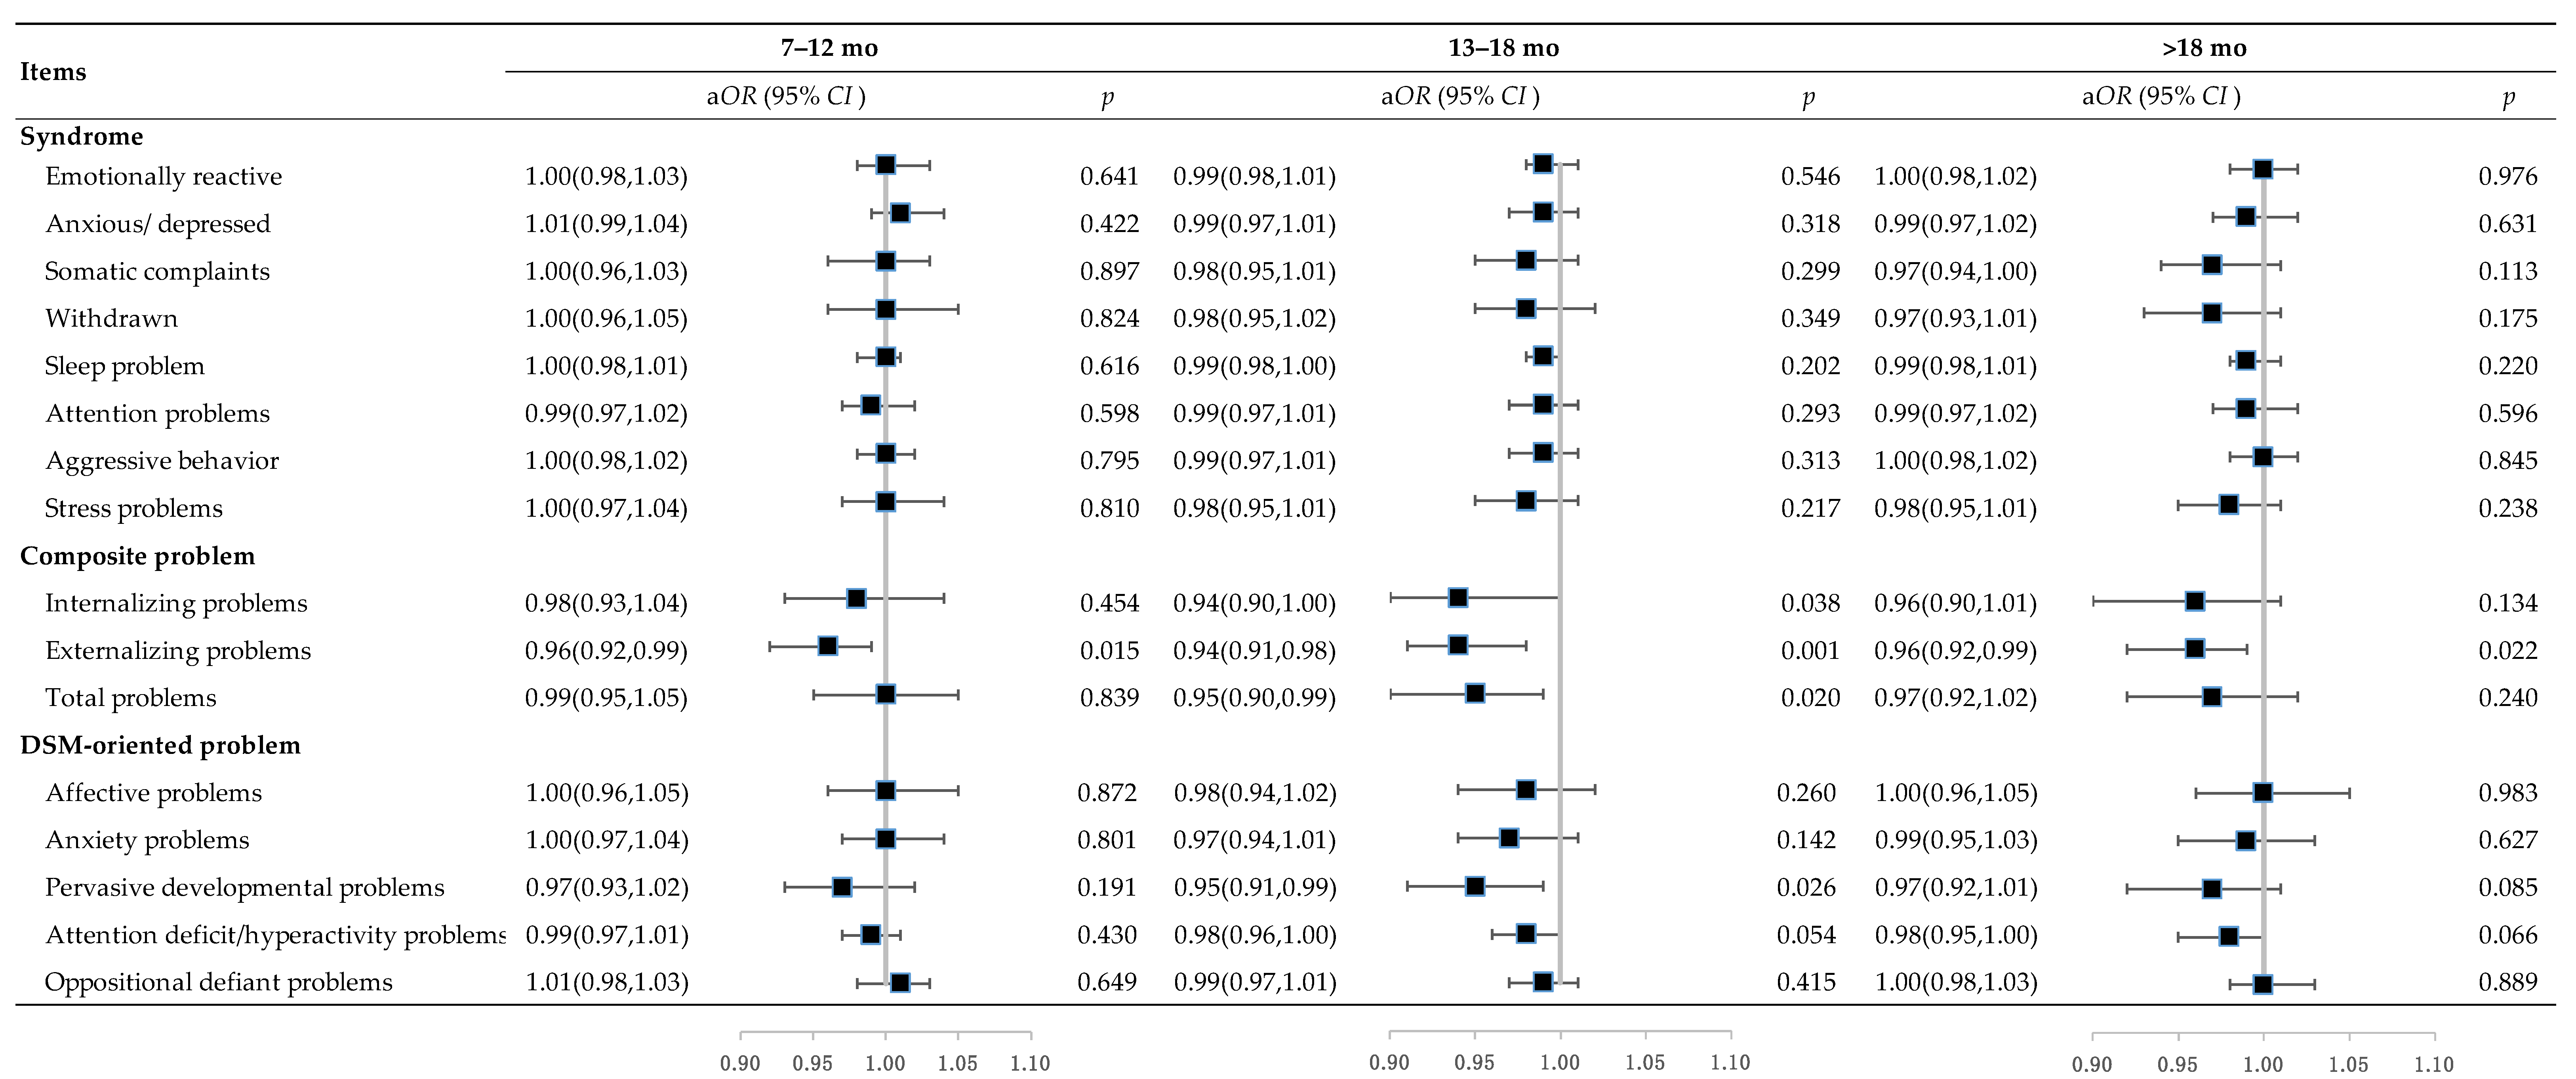
3.3. Duration of Breastfeeding and Behavioral and Emotional Development
3.4. Subgroup Analysis Based on Children’s Sex
4. Discussion
5. Conclusions
Author Contributions
Funding
Institutional Review Board Statement
Informed Consent Statement
Data Availability Statement
Acknowledgments
Conflicts of Interest
Appendix A

| Characteristics | Overall | Included | Excluded |
|---|---|---|---|
| (N = 17,613) | (N = 2489) | (N = 15,124) | |
| Maternal | |||
| Age, y, median (IQR) | 22.9 (3.20) | 22.7 (3.00) | 23.0 (3.20) |
| Gestational week, wk, mean (SD) | 39.6 (1.67) | 39.7 (1.57) | 39.6 (1.68) |
| Education, no. (%) | |||
| ≥High school | 3204 (18.2) | 397 (16.0) | 2807 (18.6) |
| Middle school | 14,130 (80.2) | 2066 (83.0) | 12,064 (79.8) |
| ≤Primary school | 279 (11.6) | 26 (1.0) | 253 (1.7) |
| Occupation, no. (%) | |||
| Farmer | 16,018 (90.9) | 2327 (93.5) | 13,691 (90.5) |
| Others | 1595 (9.1) | 162 (6.5) | 1433 (9.5) |
| BMI in early pregnancy, kg/m2, no. (%) | |||
| <18.5 | 1568 (8.9) | 207 (8.3) | 1361 (9.0) |
| 18.5–22.9 | 11,115 (63.1) | 1562 (62.8) | 9553 (63.2) |
| 23.0–27.4 | 4187 (23.8) | 612 (24.6) | 3575 (23.6) |
| ≥27.5 | 743 (4.2) | 108 (4.3) | 635 (4.2) |
| Anemia in mid-pregnancy, no. (%) | |||
| Yes | 16,402 (93.2) | 2329 (93.6) | 14,073 (93.1) |
| No | 1097 (6.2) | 149 (6.0) | 948 (6.3) |
| Missing | 114 (0.6) | 11 (0.4) | 103 (0.7) |
| Supplementation during pregnancy, no. (%) | |||
| Folic acid | 5861 (33.3) | 812 (32.6) | 5049 (33.4) |
| Iron–folic acid | 5882 (33.4) | 855 (34.4) | 5027 (33.2) |
| Multiple micronutrients | 5870 (33.3) | 822 (33.0) | 5048 (33.4) |
| Delivery mode, no. (%) | |||
| Vaginal delivery | 8995 (51.1) | 1300 (52.2) | 7695 (50.9) |
| Cesarean delivery | 8545 (48.5) | 1188 (47.7) | 7357 (48.6) |
| Missing | 73 (0.4) | 1 (0.0) | 72 (0.5) |
| Offspring | |||
| Age, mo, median (IQR) | 38.0 (1.00) | 39.0 (1.00) | 38.0 (1.00) |
| Sex, no. (%) | |||
| Male | 9240 (52.5) | 1290 (51.8) | 7950 (52.6) |
| Female | 8365 (47.5) | 1199 (48.2) | 7166 (47.4) |
| Missing | 8 (0.0) | 0 (0) | 8 (0.1) |
| Birthweight, g, mean (SD) | 3300 (386) | 3290 (377) | 3300 (388) |
| Feeding pattern for the first 6 mo, no. (%) | |||
| Exclusive breastfeeding | 12,342 (70.1) | 2085 (83.8) | 10,257 (67.2) |
| Non-exclusive breastfeeding | 2781 (15.8) | 404 (16.2) | 2377 (15.6) |
| Missing | 2625 (14.9) | 0 (0) | 2625 (17.2) |
| Duration of breastfeeding, mo, mean (SD) | 15.3 (5.26) | 15.5 (5.09) | 15.3 (5.30) |
| Main caregivers, no. (%) | |||
| Parents | 11,489 (65.2) | 1975 (79.3) | 9514 (62.9) |
| Grandparents | 3595 (20.4) | 510 (20.5) | 3085 (20.4) |
| Missing | 2529 (14.4) | 4 (0.2) | 2525 (16.7) |
| Kindergarten attendance, no. (%) | |||
| Yes | 8902 (50.5) | 1835 (73.7) | 7067 (46.7) |
| No | 6207 (35.2) | 650 (26.1) | 5557 (36.7) |
| Missing | 2504 (14.2) | 4 (0.2) | 2500 (16.5) |

| Items | ≤6 mo | 7–18 mo | >18 mo | |||
|---|---|---|---|---|---|---|
| βadj (95% CI) | p | βadj (95% CI) | p | βadj (95% CI) | p | |
| Syndrome | ||||||
| Emotionally reactive | 0.05 (−0.38, 0.49) | 0.813 | −0.14 (−0.23, −0.05) | 0.003 | 0.01 (−0.19, 0.21) | 0.927 |
| Anxious/depressed | 0.24 (−0.19, 0.66) | 0.274 | −0.16 (−0.25, −0.08) | <0.001 | 0.04 (−0.14, 0.21) | 0.664 |
| Somatic complaints | −0.08 (−0.56, 0.40) | 0.750 | −0.14 (−0.24, −0.04) | 0.005 | 0.14 (−0.05, 0.33) | 0.153 |
| Withdrawn behavior | 0.20 (−0.25, 0.64) | 0.390 | −0.19 (−0.30, −0.09) | <0.001 | 0.18 (−0.03, 0.39) | 0.099 |
| Sleep problems | 0.01 (−0.31, 0.33) | 0.957 | −0.04 (−0.10, 0.02) | 0.228 | −0.02 (−0.14, 0.10) | 0.718 |
| Attention problems | 0.02 (−0.36, 0.39) | 0.929 | −0.06 (−0.14, 0.02) | 0.122 | 0.04 (−0.13, 0.20) | 0.674 |
| Aggressive behavior | −0.15 (−0.56, 0.27) | 0.494 | −0.11 (−0.19, −0.04) | 0.002 | 0.12 (−0.03, 0.28) | 0.125 |
| Stress problems | −0.07 (−0.47, 0.33) | 0.728 | −0.13 (−0.22, −0.05) | 0.003 | 0.06 (−0.12, 0.24) | 0.532 |
| Composite problem | ||||||
| Internalizing problems | 0.41 (−0.40, 1.22) | 0.321 | −0.39 (−0.57, −0.21) | <0.001 | 0.19 (−0.17, 0.55) | 0.303 |
| Externalizing problems | 0.02 (−0.69, 0.72) | 0.960 | −0.27 (−0.42, −0.12) | <0.001 | 0.15 (−0.16, 0.47) | 0.333 |
| Total problems | 0.21 (−0.60, 1.03) | 0.610 | −0.33 (−0.50, −0.15) | <0.001 | 0.19 (−0.17, 0.54) | 0.302 |
| DSM-oriented problem | ||||||
| Affective problems | 0.23 (−0.28, 0.74) | 0.375 | −0.14 (−0.25, −0.04) | 0.007 | 0.14 (−0.08, 0.37) | 0.216 |
| Anxiety problems | −0.10 (−0.61, 0.41) | 0.713 | −0.17 (−0.27, −0.07) | 0.001 | 0.02 (−0.19, 0.23) | 0.866 |
| Pervasive developmental problems | 0.02 (−0.50, 0.54) | 0.948 | −0.13 (−0.24, −0.02) | 0.023 | 0.23 (0.01, 0.46) | 0.045 |
| Attention deficit/hyperactivity problems | −0.22 (−0.62, 0.18) | 0.279 | −0.03 (−0.11, 0.05) | 0.504 | −0.05 (−0.22, 0.11) | 0.529 |
| Oppositional defiant problems | −0.04 (−0.36, 0.28) | 0.824 | −0.15 (−0.21, −0.08) | <0.001 | 0.11 (−0.04, 0.27) | 0.146 |
| Items | Boys (n = 1290) | Girls (n = 1199) | p for Interaction | ||
|---|---|---|---|---|---|
| aMD (95% CI) | p | aMD (95% CI) | p | ||
| Syndrome | |||||
| Emotionally reactive | −1.01 (−1.81, −0.20) | 0.014 | 0.19 (−0.79, 1.16) | 0.707 | 0.093 |
| Anxious/depressed | −1.04 (−1.82, −0.26) | 0.009 | 0.25 (−0.68, 1.17) | 0.602 | 0.029 |
| Somatic complaints | −1.03 (−1.95, −0.11) | 0.028 | −1.53 (−2.52, −0.53) | 0.003 | 0.479 |
| Withdrawn behavior | −1.14 (−2.08, −0.20) | 0.018 | 0.70 (−0.42, 1.83) | 0.220 | 0.009 |
| Sleep problems | −0.25 (−0.78, 0.29) | 0.365 | 0.05 (−0.64, 0.74) | 0.884 | 0.458 |
| Attention problems | −0.85 (−1.56, −0.14) | 0.019 | 0.51 (−0.27, 1.28) | 0.198 | 0.011 |
| Aggressive behavior | −1.20 (−1.92, −0.47) | 0.001 | 0.24 (−0.48, 0.95) | 0.518 | 0.009 |
| Stress problems | −0.71 (−1.51, 0.09) | 0.083 | −0.15 (−1.08, 0.77) | 0.749 | 0.423 |
| Composite problem | |||||
| Internalizing problems | −2.12 (−3.75, −0.50) | 0.011 | −0.16 (−2.00, 1.67) | 0.862 | 0.115 |
| Externalizing problems | −1.87 (−3.29, −0.46) | 0.010 | 0.41 (−1.11, 1.93) | 0.599 | 0.048 |
| Total problems | −2.24 (−3.83, −0.65) | 0.006 | 0.11 (−1.66, 1.88) | 0.902 | 0.056 |
| DSM-oriented problem | |||||
| Affective problems | −0.97 (−1.91, −0.03) | 0.043 | 0.08 (−1.05, 1.20) | 0.894 | 0.080 |
| Anxiety problems | −1.24 (−2.13, −0.34) | 0.007 | −0.20 (−1.26, 0.86) | 0.711 | 0.149 |
| Pervasive developmental problems | −0.99 (−2.00, 0.01) | 0.053 | 0.40 (−0.78, 1.58) | 0.509 | 0.071 |
| Attention deficit/hyperactivity problems | −0.92 (−1.69, −0.15) | 0.019 | 0.15 (−0.64, 0.95) | 0.706 | 0.048 |
| Oppositional defiant problems | −0.72 (−1.36, −0.07) | 0.029 | 0.15 (−0.48, 0.79) | 0.636 | 0.071 |
| Items | Boys (n = 1290) | Girls (n = 1199) | ||
|---|---|---|---|---|
| aOR (95% CI) | p | aOR (95% CI) | p | |
| Syndrome | ||||
| Emotionally reactive | 0.67 (0.17, 2.58) | 0.558 | 1.26 (0.27, 5.86) | 0.772 |
| Anxious/depressed | 1.19 (0.33, 4.35) | 0.788 | 1.09 (0.31, 3.92) | 0.890 |
| Somatic complaints | 0.75 (0.37, 1.55) | 0.442 | 0.52 (0.22, 1.19) | 0.122 |
| Withdrawn behavior | 0.81 (0.42, 1.59) | 0.544 | 1.58 (0.70, 3.60) | 0.271 |
| Sleep problems | / | 0.997 | 0.72 (0.14, 3.66) | 0.695 |
| Attention problems | 0.53 (0.19, 1.44) | 0.210 | 2.02 (0.45, 9.08) | 0.361 |
| Aggressive behavior | 1.61 (0.35, 7.45) | 0.542 | 2.04 (0.17, 24.52) | 0.572 |
| Stress problems | 1.40 (0.52, 3.75) | 0.503 | 0.95 (0.38, 2.38) | 0.918 |
| Composite problem | ||||
| Internalizing problems | 0.62 (0.39, 0.97) | 0.037 | 0.98 (0.57, 1.70) | 0.956 |
| Externalizing problems | 0.40 (0.23, 0.71) | 0.002 | 1.07 (0.40, 2.87) | 0.895 |
| Total problems | 0.54 (0.33, 0.86) | 0.011 | 1.02 (0.53, 1.95) | 0.958 |
| DSM-oriented problem | ||||
| Affective problems | 0.67 (0.38, 1.20) | 0.180 | 0.98 (0.50, 1.94) | 0.951 |
| Anxiety problems | 0.60 (0.30, 1.19) | 0.145 | 0.82 (0.39, 1.75) | 0.610 |
| Pervasive developmental problems | 0.79 (0.44, 1.43) | 0.432 | 1.01 (0.51, 1.98) | 0.980 |
| Attention deficit/hyperactivity problems | 0.34 (0.14, 0.80) | 0.014 | 0.46 (0.14, 1.46) | 0.187 |
| Oppositional defiant problems | 1.44 (0.47, 4.42) | 0.525 | 2.50 (0.31, 19.90) | 0.388 |
| Items | Boys (n = 1290) | Girls (n = 1199) | ||||||||||
|---|---|---|---|---|---|---|---|---|---|---|---|---|
| 7–12 mo | p | 13–18 mo | p | >18 mo | p | 7–12 mo | p | 13–18 mo | p | >18 mo | p | |
| Syndrome | ||||||||||||
| Emotionally reactive | −0.58 (−1.97, 0.80) | 0.411 | −1.58 (−2.85, −0.31) | 0.015 | −0.88 (−2.27, 0.52) | 0.218 | −0.01 (−1.68, 1.66) | 0.990 | −0.70 (−2.27, 0.88) | 0.387 | −0.57 (−2.27, 1.14) | 0.515 |
| Anxious/depressed | −0.14 (−1.48, 1.20) | 0.838 | −1.75 (−2.97, −0.52) | 0.005 | −1.07 (−2.42, 0.27) | 0.119 | 0.93 (−0.65, 2.51) | 0.250 | 0.16 (−1.33, 1.65) | 0.832 | 0.24 (−1.37, 1.85) | 0.769 |
| Somatic complaints | 0.47 (−1.11, 2.06) | 0.558 | −1.38 (−2.83, 0.07) | 0.063 | −0.80 (−2.39, 0.80) | 0.326 | −0.12 (−1.83, 1.60) | 0.895 | −0.66 (−2.28, 0.96) | 0.424 | −0.82 (−2.57, 0.93) | 0.358 |
| Withdrawn behavior | −0.43 (−2.06, 1.20) | 0.607 | −1.67 (−3.16, −0.18) | 0.028 | −0.59 (−2.23, 1.05) | 0.484 | 1.09 (−0.84, 3.02) | 0.269 | 0.25 (−1.57, 2.06) | 0.791 | 0.22 (−1.75, 2.18) | 0.830 |
| Sleep problems | 0.23 (−0.69, 1.16) | 0.621 | −0.12 (−0.97, 0.73) | 0.785 | −0.04 (−0.97, 0.90) | 0.939 | 0.16 (−1.02, 1.34) | 0.789 | −0.08 (−1.19, 1.03) | 0.893 | 0.09 (−1.12, 1.29) | 0.889 |
| Attention problems | −0.48 (−1.71, 0.74) | 0.440 | −1.49 (−2.61, −0.36) | 0.010 | −1.13 (−2.36, 0.11) | 0.074 | −0.17 (−1.50, 1.16) | 0.801 | −0.35 (−1.61, 0.90) | 0.580 | −0.31 (−1.67, 1.05) | 0.655 |
| Aggressive behavior | −0.54 (−1.79, 0.71) | 0.397 | −1.89 (−3.03, −0.74) | 0.001 | −1.15 (−2.41, 0.11) | 0.074 | −0.51 (−1.73, 0.72) | 0.416 | −0.82 (−1.97, 0.34) | 0.165 | −0.89 (−2.14, 0.36) | 0.161 |
| Stress problems | 0.40 (−0.98, 1.78) | 0.573 | −1.02 (−2.28, 0.25) | 0.115 | −0.40 (−1.79, 0.99) | 0.574 | 0.37 (−1.22, 1.95) | 0.649 | −0.06 (−1.56, 1.43) | 0.934 | −0.46 (−2.07, 1.16) | 0.581 |
| Composite problem | ||||||||||||
| Internalizing problems | −0.43 (−3.23, 2.37) | 0.766 | −3.48 (−6.05, −0.92) | 0.008 | −1.31 (−4.13, 1.51) | 0.361 | 0.76 (−2.38, 3.91) | 0.636 | −1.04 (−4.01, 1.92) | 0.490 | −0.54 (−3.75, 2.67) | 0.742 |
| Externalizing problems | −0.76 (−3.20, 1.68) | 0.544 | −3.26 (−5.50, −1.03) | 0.004 | −1.63 (−4.09, 0.83) | 0.194 | −1.29 (−3.89, 1.32) | 0.334 | −2.09 (−4.54, 0.37) | 0.097 | −2.16 (−4.82, 0.50) | 0.112 |
| Total problems | −0.65 (−3.39, 2.09) | 0.642 | −3.57 (−6.08, −1.06) | 0.005 | −1.76 (−4.52, 1.00) | 0.212 | −0.67 (−3.70, 2.36) | 0.666 | −2.04 (−4.89, 0.82) | 0.162 | −1.67 (−4.76, 1.42) | 0.289 |
| DSM-oriented problem | ||||||||||||
| Affective problems | 0.07 (−1.56, 1.69) | 0.937 | −1.41 (−2.90, 0.08) | 0.063 | −0.26 (−1.89, 1.38) | 0.760 | 0.15 (−1.78, 2.08) | 0.882 | −0.33 (−2.15, 1.49) | 0.722 | −0.07 (−2.04, 1.90) | 0.944 |
| Anxiety problems | −0.86 (−2.41, 0.68) | 0.272 | −1.99 (−3.40, −0.58) | 0.006 | −1.12 (−2.67, 0.44) | 0.159 | 0.98 (−0.84, 2.80) | 0.291 | −0.08 (−1.79, 1.64) | 0.930 | 0.65 (−1.20, 2.51) | 0.490 |
| Pervasive developmental problems | −1.24 (−2.98, 0.51) | 0.180 | −2.02 (−3.61, −0.44) | 0.015 | −0.85 (−2.59, 0.90) | 0.417 | 0.31 (−1.69, 2.32) | 0.627 | −0.47 (−2.34, 1.41) | 0.779 | −0.19 (−2.24, 1.85) | 0.892 |
| Attention deficit/hyperactivity problems | −0.35 (−1.69, 0.98) | 0.604 | −1.44 (−2.67, −0.22) | 0.021 | −0.96 (−2.31, 0.38) | 0.160 | −1.03 (−2.39, 0.34) | 0.140 | −1.13 (−2.42, 0.16) | 0.086 | −0.82 (−2.22, 0.57) | 0.246 |
| Oppositional defiant problems | −0.11 (−1.22, 0.99) | 0.840 | −1.33 (−2.35, −0.32) | 0.010 | −0.52 (−1.64, 0.59) | 0.357 | 0.27 (−0.82, 1.36) | 0.626 | −0.47 (−1.49, 0.55) | 0.369 | −0.22 (−1.33, 0.89) | 0.700 |
| Items | Boys (n = 1290) | Girls (n = 1199) | ||||||||||
|---|---|---|---|---|---|---|---|---|---|---|---|---|
| 7–12 mo | p | 13–18 mo | p | >18 mo | p | 7–12 mo | p | 13–18 mo | p | >18 mo | p | |
| Syndrome | ||||||||||||
| Emotionally reactive | 1.01 (0.98, 1.04) | 0.439 | 0.99 (0.97, 1.01) | 0.419 | 1.01 (0.98, 1.03) | 0.530 | 1.00 (0.97, 1.04) | 0.940 | 1.00 (0.97, 1.03) | 0.998 | 0.99 (0.96, 1.03) | 0.693 |
| Anxious/depressed | 1.01 (0.98, 1.04) | 0.421 | 0.98 (0.95, 1.01) | 0.209 | 0.99 (0.96, 1.02) | 0.401 | 1.01 (0.97, 1.05) | 0.568 | 1.00 (0.96, 1.04) | 0.996 | 1.01 (0.97, 1.05) | 0.751 |
| Somatic complaints | 1.01 (0.96, 1.06) | 0.818 | 0.98 (0.94, 1.02) | 0.322 | 0.97 (0.93, 1.02) | 0.247 | 0.99 (0.94, 1.04) | 0.600 | 0.99 (0.94, 1.03) | 0.537 | 0.97 (0.93, 1.02) | 0.255 |
| Withdrawn behavior | 1.00 (0.95, 1.05) | 0.890 | 0.98 (0.94, 1.03) | 0.424 | 0.96 (0.91, 1.01) | 0.136 | 1.01 (0.95, 1.08) | 0.691 | 0.98 (0.93, 1.05) | 0.621 | 0.99 (0.92, 1.05) | 0.677 |
| Sleep problems | 1.01 (0.99, 1.02) | 0.264 | 1.01 (0.99, 1.02) | 0.448 | 1.00 (0.99, 1.02) | 0.676 | 0.98 (0.95, 1.01) | 0.158 | 0.97 (0.95, 1.00) | 0.034 | 0.98 (0.95, 1.00) | 0.077 |
| Attention problems | 1.00 (0.96, 1.03) | 0.833 | 0.99 (0.96, 1.02) | 0.454 | 0.99 (0.96, 1.03) | 0.708 | 0.99 (0.95, 1.03) | 0.626 | 0.99 (0.96, 1.03) | 0.584 | 0.99 (0.96, 1.03) | 0.741 |
| Aggressive behavior | 1.02 (0.99, 1.05) | 0.207 | 0.99 (0.96, 1.01) | 0.391 | 1.01 (0.98, 1.04) | 0.405 | 0.99 (0.96, 1.01) | 0.281 | 0.99 (0.97, 1.02) | 0.569 | 0.99 (0.97, 1.02) | 0.476 |
| Stress problems | 1.03 (0.98, 1.07) | 0.233 | 0.99 (0.96, 1.03) | 0.724 | 1.00 (0.96, 1.04) | 0.992 | 0.98 (0.93, 1.03) | 0.476 | 0.97 (0.92, 1.02) | 0.202 | 0.96 (0.91, 1.01) | 0.137 |
| Composite problem | ||||||||||||
| Internalizing problems | 0.97 (0.90, 1.04) | 0.374 | 0.93 (0.87, 1.00) | 0.039 | 0.94 (0.88, 1.02) | 0.134 | 0.99 (0.91, 1.08) | 0.829 | 0.96 (0.89, 1.04) | 0.368 | 0.97 (0.89, 1.06) | 0.542 |
| Externalizing problems | 0.94 (0.89, 1.00) | 0.035 | 0.91 (0.87, 0.96) | <0.001 | 0.94 (0.89, 0.99) | 0.031 | 0.97 (0.93, 1.02) | 0.285 | 0.99 (0.94, 1.03) | 0.519 | 0.98 (0.93, 1.03) | 0.457 |
| Total problems | 1.00 (0.93, 1.07) | 0.937 | 0.94 (0.88, 1.00) | 0.038 | 0.96 (0.89, 1.03) | 0.209 | 0.99 (0.92, 1.06) | 0.786 | 0.96 (0.90, 1.03) | 0.230 | 0.98 (0.91, 1.06) | 0.678 |
| DSM-oriented problem | ||||||||||||
| Affective problems | 1.02 (0.96, 1.08) | 0.497 | 0.98 (0.93, 1.03) | 0.383 | 1.00 (0.94, 1.06) | 0.974 | 0.98 (0.92, 1.05) | 0.603 | 0.97 (0.91, 1.04) | 0.399 | 1.00 (0.93, 1.07) | 0.926 |
| Anxiety problems | 1.00 (0.95, 1.05) | 0.959 | 0.96 (0.92, 1.01) | 0.087 | 0.99 (0.94, 1.04) | 0.575 | 1.02 (0.96, 1.08) | 0.611 | 0.99 (0.94, 1.05) | 0.793 | 1.00 (0.94, 1.06) | 0.984 |
| Pervasive developmental problems | 0.98 (0.92, 1.04) | 0.433 | 0.96 (0.91, 1.01) | 0.148 | 0.98 (0.92, 1.04) | 0.499 | 0.96 (0.89, 1.03) | 0.214 | 0.94 (0.88, 1.00) | 0.070 | 0.94 (0.87, 1.00) | 0.067 |
| Attention deficit/hyperactivity problems | 1.02 (0.98, 1.05) | 0.389 | 1.00 (0.97, 1.04) | 0.799 | 1.00 (0.97, 1.04) | 0.830 | 0.96 (0.93, 0.99) | 0.007 | 0.95 (0.92, 0.97) | <0.001 | 0.94 (0.91, 0.97) | <0.001 |
| Oppositional defiant problems | 1.00 (0.97, 1.04) | 0.872 | 0.97 (0.94, 1.00) | 0.057 | 0.99 (0.95, 1.02) | 0.498 | 1.01 (0.98, 1.05) | 0.489 | 1.01 (0.98, 1.05) | 0.348 | 1.02 (0.99, 1.05) | 0.237 |
References
- Belfer, M.L. Child and adolescent mental disorders: The magnitude of the problem across the globe. J. Child Psychol. Psychiatry 2008, 49, 226–236. [Google Scholar] [CrossRef] [PubMed]
- Orri, M.; Galera, C.; Turecki, G.; Forte, A.; Renaud, J.; Boivin, M.; Tremblay, R.E.; Côté, S.M.; Geoffroy, M.-C. Association of Childhood Irritability and Depressive/Anxious Mood Profiles With Adolescent Suicidal Ideation and Attempts. JAMA Psychiatry 2018, 75, 465–473. [Google Scholar] [CrossRef] [PubMed]
- Bevilacqua, L.; Hale, D.; Barker, E.D.; Viner, R. Conduct Problems Trajectories and Psychosocial Outcomes: A Systematic Review and Meta-Analysis. Eur. Child Adolesc. Psychiatry 2018, 27, 1239–1260. [Google Scholar] [CrossRef] [PubMed]
- Rescorla, L.A.; Jordan, P.; Zhang, S.; Baelen-King, G.; Althoff, R.R.; Ivanova, M.Y.; International Aseba Consortium. Latent Class Analysis of the CBCL Dysregulation Profile for 6- to 16-Year-Olds in 29 Societies. J. Clin. Child Adolesc. Psychol. 2021, 50, 551–564. [Google Scholar] [CrossRef] [PubMed]
- Egger, H.L.; Angold, A. Common emotional and behavioral disorders in preschool children: Presentation, nosology, and epidemiology. J. Child Psychol. Psychiatry 2006, 47, 313–337. [Google Scholar] [CrossRef] [PubMed]
- Cui, Y.; Li, F.; Leckman, J.F.; Guo, L.; Ke, X.; Liu, J.; Zheng, Y.; Li, Y. The prevalence of behavioral and emotional problems among Chinese school children and adolescents aged 6-16: A national survey. Eur. Child Adolesc. Psychiatry 2021, 30, 233–241. [Google Scholar] [CrossRef] [PubMed]
- Rodríguez-Barranco, M.; Lacasaña, M.; Aguilar-Garduño, C.; Alguacil, J.; Gil, F.; González-Alzaga, B.; Rojas-García, A. Association of arsenic, cadmium and manganese exposure with neurodevelopment and behavioural disorders in children: A systematic review and meta-analysis. Sci. Total Environ. 2013, 454–455, 562–577. [Google Scholar] [CrossRef] [PubMed]
- Hosokawa, R.; Katsura, T. Effect of socioeconomic status on behavioral problems from preschool to early elementary school—A Japanese longitudinal study. PLoS ONE 2018, 13, e0197961. [Google Scholar] [CrossRef] [PubMed]
- Cimino, S.; Cerniglia, L.; Ballarotto, G.; Marzilli, E.; Pascale, E.; D’Addario, C.; Adriani, W.; Maremmani, A.G.I.; Tambelli, R. Children’s DAT1 Polymorphism Moderates the Relationship Between Parents’ Psychological Profiles, Children’s DAT Methylation, and Their Emotional/Behavioral Functioning in a Normative Sample. Int. J. Environ. Res. Public Health 2019, 16, 2567. [Google Scholar] [CrossRef]
- World Health Organization; United Nations Children’s Fund (UNICEF). Global Strategy for Infant and Young Child Feeding; World Health Organization: Geneva, Switzerland, 2003. [Google Scholar]
- Koletzko, B.; Lien, E.; Agostoni, C.; Böhles, H.; Campoy, C.; Cetin, I.; Decsi, T.; Dudenhausen, J.W.; Dupont, C.; Forsyth, S.; et al. The roles of long-chain polyunsaturated fatty acids in pregnancy, lactation and infancy: Review of current knowledge and consensus recommendations. J. Perinat. Med. 2008, 36, 5–14. [Google Scholar] [CrossRef]
- Fergusson, D.M.; Woodward, L.J. Breast feeding and later psychosocial adjustment. Paediatr. Perinat. Epidemiol. 1999, 13, 144–157. [Google Scholar] [CrossRef] [PubMed]
- Meek, J.Y.; Noble, L. Section on Breastfeeding Policy Statement: Breastfeeding and the Use of Human Milk. Pediatrics 2022, 150, e2022057988. [Google Scholar] [CrossRef] [PubMed]
- Ip, S.; Chung, M.; Raman, G.; Chew, P.; Magula, N.; DeVine, D.; Trikalinos, T.; Lau, J. Breastfeeding and Maternal and Infant Health Outcomes in Developed Countries; Evidence Reports/Technology Assessments; Agency for Healthcare Research and Quality (US): Rockville, MD, USA, 2007; pp. 1–186. [Google Scholar]
- Horta, B.L.; Loret de Mola, C.; Victora, C.G. Breastfeeding and intelligence: A systematic review and meta-analysis. Acta Paediatr. 2015, 104, 14–19. [Google Scholar] [CrossRef] [PubMed]
- Lind, J.N.; Li, R.; Perrine, C.G.; Schieve, L.A. Breastfeeding and later psychosocial development of children at 6 years of age. Pediatrics 2014, 134 (Suppl. S1), S36–S41. [Google Scholar] [CrossRef] [PubMed]
- Liu, J.; Leung, P.; Yang, A. Breastfeeding and active bonding protects against children’s internalizing behavior problems. Nutrients 2013, 6, 76–89. [Google Scholar] [CrossRef] [PubMed]
- Julvez, J.; Ribas-Fitó, N.; Forns, M.; Garcia-Esteban, R.; Torrent, M.; Sunyer, J. Attention behaviour and hyperactivity at age 4 and duration of breast-feeding. Acta Paediatr. 2007, 96, 842–847. [Google Scholar] [CrossRef] [PubMed]
- Heikkilä, K.; Sacker, A.; Kelly, Y.; Renfrew, M.J.; Quigley, M.A. Breast feeding and child behaviour in the Millennium Cohort Study. Arch. Dis. Child. 2011, 96, 635–642. [Google Scholar] [CrossRef] [PubMed]
- Speyer, L.G.; Hall, H.A.; Ushakova, A.; Murray, A.L.; Luciano, M.; Auyeung, B. Longitudinal effects of breast feeding on parent-reported child behaviour. Arch. Dis. Child. 2021, 106, 355–360. [Google Scholar] [CrossRef] [PubMed]
- Oddy, W.H.; Kendall, G.E.; Li, J.; Jacoby, P.; Robinson, M.; de Klerk, N.H.; Silburn, S.R.; Zubrick, S.R.; Landau, L.I.; Stanley, F.J. The long-term effects of breastfeeding on child and adolescent mental health: A pregnancy cohort study followed for 14 years. J. Pediatr. 2010, 156, 568–574. [Google Scholar] [CrossRef]
- Girard, L.-C.; Farkas, C. Breastfeeding and behavioural problems: Propensity score matching with a national cohort of infants in Chile. BMJ Open 2019, 9, e025058. [Google Scholar] [CrossRef]
- Belfort, M.B.; Rifas-Shiman, S.L.; Kleinman, K.P.; Bellinger, D.C.; Harris, M.H.; Taveras, E.M.; Gillman, M.W.; Oken, E. Infant Breastfeeding Duration and Mid-Childhood Executive Function, Behavior, and Social-Emotional Development. J. Dev. Behav. Pediatr. 2016, 37, 43–52. [Google Scholar] [CrossRef] [PubMed]
- Huang, T.; Yue, Y.; Wang, H.; Zheng, J.; Chen, Z.; Chen, T.; Zhang, M.; Wang, S. Infant Breastfeeding and Behavioral Disorders in School-Age Children. Breastfeed. Med. Off. J. Acad. Breastfeed. Med. 2019, 14, 115–120. [Google Scholar] [CrossRef] [PubMed]
- Liu, F.; Ma, L.-J.; Yi, M.-J. Association of breastfeeding with behavioral problems and temperament development in children aged 4–5 years. Zhongguo Dang Dai Er Ke Za Zhi/Chin. J. Contemp. Pediatr. 2006, 8, 334–337. [Google Scholar]
- Liu, J.; Mei, Z.; Ye, R.; Serdula, M.K.; Ren, A.; Cogswell, M.E. Micronutrient supplementation and pregnancy outcomes: Double-blind randomized controlled trial in China. JAMA Intern. Med. 2013, 173, 276–282. [Google Scholar] [CrossRef] [PubMed]
- World Health Organization. Indicators for Assessing Breast-Feeding Practices; World Health Organization: Geneva, Switzerland, 2007. [Google Scholar]
- Rescorla, L.A.; Achenbach, T. Manual for the ASEBA Preschool Forms & Profiles; Research Center for Children, Youth, & Families, University of Vermont: Burlington, NJ, USA, 2000. [Google Scholar]
- World Health Organization. Haemoglobin Concentrations for the Diagnosis of Anaemia and Assessment of Severity; World Health Organization: Geneva, Switzerland, 2011. [Google Scholar]
- WHO Expert Consultation. Appropriate body-mass index for Asian populations and its implications for policy and intervention strategies. Lancet 2004, 363, 157–163. [Google Scholar] [CrossRef] [PubMed]
- Hofheimer, J.A.; McGrath, M.; Musci, R.; Wu, G.; Polk, S.; Blackwell, C.K.; Stroustrup, A.; Annett, R.D.; Aschner, J.; Carter, B.S.; et al. Assessment of Psychosocial and Neonatal Risk Factors for Trajectories of Behavioral Dysregulation Among Young Children from 18 to 72 Months of Age. JAMA Netw. Open 2023, 6, e2310059. [Google Scholar] [CrossRef] [PubMed]
- Bellinger, D.C. What is an adverse effect? A possible resolution of clinical and epidemiological perspectives on neurobehavioral toxicity. Environ. Res. 2004, 95, 394–405. [Google Scholar] [CrossRef]
- Girard, L.-C.; Doyle, O.; Tremblay, R.E. Breastfeeding, Cognitive and Noncognitive Development in Early Childhood: A Population Study. Pediatrics 2017, 139, e20161848. [Google Scholar] [CrossRef] [PubMed]
- Makrides, M.; Uauy, R. LCPUFAs as conditionally essential nutrients for very low birth weight and low birth weight infants: Metabolic, functional, and clinical outcomes-how much is enough? Clin. Perinatol. 2014, 41, 451–461. [Google Scholar] [CrossRef]
- Brink, L.R.; Lönnerdal, B. Milk fat globule membrane: The role of its various components in infant health and development. J. Nutr. Biochem. 2020, 85, 108465. [Google Scholar] [CrossRef]
- Lis-Kuberka, J.; Orczyk-Pawiłowicz, M. Sialylated Oligosaccharides and Glycoconjugates of Human Milk. The Impact on Infant and Newborn Protection, Development and Well-Being. Nutrients 2019, 11, 306. [Google Scholar] [CrossRef] [PubMed]
- Fleming, S.A.; Mudd, A.T.; Hauser, J.; Yan, J.; Metairon, S.; Steiner, P.; Donovan, S.M.; Dilger, R.N. Human and Bovine Milk Oligosaccharides Elicit Improved Recognition Memory Concurrent with Alterations in Regional Brain Volumes and Hippocampal mRNA Expression. Front. Neurosci. 2020, 14, 770. [Google Scholar] [CrossRef] [PubMed]
- Belsky, J.; Bakermans-Kranenburg, M.J.; Van IJzendoorn, M.H. For better and for worse differential susceptibility to environmental influences. Curr. Dir. Psychol. Sci. 2007, 16, 300–304. [Google Scholar] [CrossRef]
- Rochat, T.J.; Houle, B.; Stein, A.; Coovadia, H.; Coutsoudis, A.; Desmond, C.; Newell, M.-L.; Bland, R.M. Exclusive Breastfeeding and Cognition, Executive Function, and Behavioural Disorders in Primary School-Aged Children in Rural South Africa: A Cohort Analysis. PLoS Med. 2016, 13, e1002044. [Google Scholar] [CrossRef]
- Li, Q.; Tian, J.; Xu, F.; Binns, C. Breastfeeding in China: A Review of Changes in the Past Decade. Int. J. Environ. Res. Public Health 2020, 17, 8234. [Google Scholar] [CrossRef]

| Characteristics | Overall | Non-EBF | EBF | p |
|---|---|---|---|---|
| (N = 2489) | (N = 404) | (N = 2085) | ||
| Maternal | ||||
| Age at delivery, y, median (IQR) | 22.7 (3.0) | 22.6 (2.9) | 22.7 (3.1) | 0.081 |
| Gestational age, wk, mean (SD) | 39.7 (1.6) | 39.6 (1.7) | 39.7 (1.5) | 0.165 |
| Ethnicity, no. (%) | 0.624 | |||
| Han | 2458 (98.8) | 398 (98.5) | 2060 (98.8) | |
| Other | 31 (1.2) | 6 (1.5) | 25 (1.2) | |
| Education, no. (%) | 0.116 | |||
| ≥High school | 397 (16.0) | 78 (19.3) | 319 (15.3) | |
| Middle school | 2066 (83.0) | 321 (79.5) | 1745 (83.7) | |
| ≤Primary school | 26 (1.0) | 5 (1.2) | 21 (1.0) | |
| Occupation, no. (%) | <0.001 | |||
| Farmer | 2327 (93.5) | 358 (88.6) | 1969 (94.4) | |
| Other | 162 (6.5) | 46 (11.4) | 116 (5.6) | |
| BMI in early pregnancy, kg/m2, no. (%) | 0.014 | |||
| <18.5 | 207 (8.3) | 49 (12.1) | 158 (7.6) | |
| 18.5–22.9 | 1562 (62.8) | 237 (58.7) | 1325 (63.5) | |
| 23.0–27.4 | 612 (24.6) | 97 (24.0) | 515 (24.7) | |
| ≥27.5 | 108 (4.3) | 21 (5.2) | 87 (4.2) | |
| Anemia in mid-pregnancy, no. (%) | 0.359 | |||
| No | 2329 (93.6) | 372 (92.1) | 1957 (93.9) | |
| Yes | 149 (6.0) | 28 (6.9) | 121 (5.8) | |
| Missing | 11(0.4) | 4(1.0) | 7(0.3) | |
| Supplementation during pregnancy, no. (%) | 0.937 | |||
| Folic acid | 812 (32.6) | 129 (31.9) | 683 (32.8) | |
| Iron–folic acid | 855 (34.4) | 139 (34.4) | 716 (34.3) | |
| Multiple micronutrients | 822 (33.0) | 136 (33.7) | 686 (32.9) | |
| Delivery mode, no. (%) | 0.624 | |||
| Vaginal delivery | 1300 (52.2) | 216 (53.5) | 1084 (52.0) | |
| Cesarean delivery | 1188 (47.7) | 188 (46.5) | 1000 (48.0) | |
| Missing | 1(0.0) | 0(0) | 1(0.0) | |
| Children | ||||
| Sex, no. (%) | 0.014 | |||
| Male | 1290 (51.8) | 232 (57.4) | 1058 (50.7) | |
| Female | 1199 (48.2) | 172 (42.6) | 1027 (49.3) | |
| Birthweight, no. (%) | 0.354 | |||
| <2500 | 43 (1.7) | 9 (2.2) | 34 (1.6) | |
| 2500–3999 | 2337 (93.9) | 373 (92.3) | 1964 (94.2) | |
| ≥4000 | 109 (4.4) | 22 (5.4) | 87 (4.2) | |
| Age at follow-up, mo, median (IQR) | 32.0 (17.0) | 31.0 (14.1) | 32.0 (17.0) | 0.172 |
| Age at follow-up, mo, no. (%) | 0.051 | |||
| 18–29 | 1102 (44.3) | 178 (44.1) | 924 (44.3) | |
| 30–35 | 437 (17.6) | 90 (22.3) | 347 (16.6) | |
| 36–41 | 280 (11.2) | 44 (10.9) | 236 (11.3) | |
| 42–47 | 400 (16.1) | 53 (13.1) | 347 (16.6) | |
| 48–60 | 270 (10.8) | 39 (9.7) | 231 (11.1) | |
| Main caregivers, no. (%) | <0.001 | |||
| Parents | 1975 (79.3) | 265 (65.6) | 1710 (82.0) | |
| Grandparents | 510 (20.5) | 139 (34.4) | 371 (17.8) | |
| Missing | 4 (0.2) | 0 (0) | 4 (0.2) | |
| Kindergarten attendance, no. (%) | 0.035 | |||
| Yes | 1835 (73.7) | 281 (69.6) | 1554 (74.5) | |
| No | 650 (26.1) | 123 (30.4) | 527 (25.3) | |
| Missing | 4 (0.2) | 0 (0) | 4 (0.2) |
| Items | Non-EBF (n = 404) | EBF (n = 2085) | cMD (95% CI) | p | aMD (95% CI) * | p |
|---|---|---|---|---|---|---|
| Syndrome | ||||||
| Emotionally reactive | 54.4 (5.78) | 53.9 (5.71) | −0.48 (−1.09, 0.13) | 0.124 | −0.49 (−1.11, 0.14) | 0.126 |
| Anxious/depressed | 53.6 (5.35) | 53.3 (5.49) | −0.35 (−0.93, 0.23) | 0.241 | −0.46 (−1.06, 0.13) | 0.126 |
| Somatic complaints | 55.2 (6.67) | 53.9 (6.07) | −1.25 (−1.91, −0.60) | <0.001 | −1.26 (−1.93, −0.59) | <0.001 |
| Withdrawn behavior | 55.7 (6.47) | 55.2 (6.69) | −0.50 (−1.21, 0.21) | 0.166 | −0.37 (−1.09, 0.36) | 0.320 |
| Sleep problems | 52.3 (3.94) | 52.2 (3.92) | −0.13 (−0.55, 0.29) | 0.536 | −0.14 (−0.57, 0.28) | 0.511 |
| Attention problems | 53.8 (5.19) | 53.2 (4.79) | −0.53 (−1.05, −0.01) | 0.045 | −0.26 (−0.79, 0.26) | 0.324 |
| Aggressive behavior | 53.0 (5.17) | 52.3 (4.63) | −0.74 (−1.24, −0.23) | 0.004 | −0.57 (−1.08, −0.06) | 0.030 |
| Stress problems | 53.8 (5.64) | 53.3 (5.53) | −0.47 (−1.06, 0.12) | 0.121 | −0.48 (−1.08, 0.13) | 0.122 |
| Composite problem | ||||||
| Internalizing problems | 50.1 (11.4) | 48.7 (11.2) | −1.39 (−2.59, −0.20) | 0.022 | −1.31 (−2.53, −0.10) | 0.034 |
| Externalizing problems | 47.6 (10.1) | 46.3 (9.56) | −1.33 (−2.36, −0.30) | 0.011 | −0.88 (−1.92, 0.15) | 0.094 |
| Total problems | 48.6 (11.5) | 47.0 (10.9) | −1.54 (−2.71, −0.37) | 0.010 | −1.26 (−2.44, −0.08) | 0.037 |
| DSM-oriented problem | ||||||
| Affective problems | 55.6 (6.96) | 55.1 (6.60) | −0.53 (−1.24, 0.18) | 0.140 | −0.54 (−1.26, 0.18) | 0.142 |
| Anxiety problems | 54.9 (6.85) | 54.2 (6.17) | −0.66 (−1.33, 0.01) | 0.053 | −0.79 (−1.47, −0.10) | 0.024 |
| Pervasive developmental problems | 55.6 (6.92) | 55.1 (7.07) | −0.49 (−1.24, 0.26) | 0.204 | −0.38 (−1.14, 0.39) | 0.336 |
| Attention deficit/hyperactivity problems | 54.1 (5.63) | 53.4 (5.03) | −0.69 (−1.23, −0.14) | 0.014 | −0.45 (−1.00, 0.11) | 0.114 |
| Oppositional defiant problems | 52.4 (4.35) | 52.0 (4.12) | −0.46 (−0.90, −0.02) | 0.042 | −0.34 (−0.79, 0.11) | 0.141 |
| Items | Non-EBF (n = 404) | EBF (n = 2085) | ||||
|---|---|---|---|---|---|---|
| Events (%) | Events (%) | cOR (95% CI) | p | aOR (95% CI) * | p | |
| Syndrome | ||||||
| Emotionally reactive | 5 (1.2) | 25 (1.2) | 0.97 (0.37, 2.54) | 0.948 | 0.87 (0.32, 2.34) | 0.785 |
| Anxious/depressed | 6 (1.5) | 37 (1.8) | 1.20 (0.50, 2.86) | 0.683 | 1.12 (0.46, 2.72) | 0.802 |
| Somatic complaints | 19 (4.7) | 66 (3.2) | 0.66 (0.39, 1.12) | 0.122 | 0.67 (0.39, 1.15) | 0.144 |
| Withdrawn behavior | 20 (5.0) | 103 (4.9) | 1.00 (0.61, 1.63) | 0.993 | 1.04 (0.63, 1.72) | 0.889 |
| Sleep problems | 2 (0.5) | 14 (0.7) | 1.36 (0.31, 6.00) | 0.686 | 1.29 (0.28, 5.90) | 0.741 |
| Attention problems | 8 (2.0) | 35 (1.7) | 0.85 (0.39, 1.84) | 0.671 | 0.95 (0.43, 2.10) | 0.891 |
| Aggressive behavior | 3 (0.7) | 21 (1.0) | 1.36 (0.40, 4.58) | 0.620 | 1.51 (0.43, 5.28) | 0.521 |
| Stress problems | 11 (2.7) | 63 (3.0) | 1.11 (0.58, 2.13) | 0.746 | 1.11 (0.57, 2.16) | 0.752 |
| Composite problem | ||||||
| Internalizing problems | 49 (12.1) | 200 (9.6) | 0.77 (0.55, 1.07) | 0.121 | 0.75 (0.54, 1.06) | 0.106 |
| Externalizing problems | 27 (6.7) | 72 (3.5) | 0.50 (0.32, 0.79) | 0.003 | 0.54 (0.34, 0.87) | 0.011 |
| Total problems | 41 (10.1) | 147 (7.1) | 0.67 (0.47, 0.97) | 0.032 | 0.69 (0.47, 1.01) | 0.056 |
| DSM-oriented problem | ||||||
| Affective problems | 29 (7.2) | 122 (5.9) | 0.80 (0.53, 1.22) | 0.307 | 0.77 (0.50, 1.18) | 0.230 |
| Anxiety problems | 21 (5.2) | 83 (4.0) | 0.76 (0.46, 1.24) | 0.265 | 0.70 (0.42, 1.16) | 0.164 |
| Pervasive developmental problems | 27 (6.7) | 129 (6.2) | 0.92 (0.60, 1.41) | 0.707 | 0.89 (0.58, 1.39) | 0.620 |
| Attention deficit/hyperactivity problems | 15 (3.7) | 26 (1.2) | 0.33 (0.17, 0.62) | 0.001 | 0.35 (0.18, 0.69) | 0.002 |
| Oppositional defiant problems | 5 (1.2) | 36 (1.7) | 1.40 (0.55, 3.59) | 0.482 | 1.64 (0.62, 4.30) | 0.317 |
| Items | 7–12 mo (n = 489) | 13–18 mo (n = 1408) | >18 mo (n = 450) | |||||||||
|---|---|---|---|---|---|---|---|---|---|---|---|---|
| cMD (95% CI) | p | aMD (95% CI) * | p | cMD (95% CI) | p | aMD (95% CI) * | p | cMD (95% CI) | p | aMD (95% CI) * | p | |
| Syndrome | ||||||||||||
| Emotionally reactive | −0.47 (−1.54, 0.59) | 0.385 | −0.33 (−1.40, 0.74) | 0.550 | −1.29 (−2.28, −0.31) | 0.010 | −1.22 (−2.22, −0.23) | 0.016 | −0.82 (−1.89, 0.26) | 0.138 | −0.79 (−1.88, 0.29) | 0.152 |
| Anxious/depressed | 0.24 (−0.78, 1.25) | 0.650 | 0.32 (−0.70, 1.34) | 0.537 | −0.84 (−1.78, 0.10) | 0.079 | −0.92 (−1.87, 0.03) | 0.058 | −0.44 (−1.47, 0.59) | 0.398 | −0.53 (−1.57, 0.51) | 0.317 |
| Somatic complaints | 0.07 (−1.08, 1.22) | 0.907 | 0.13 (−1.03, 1.28) | 0.832 | −1.05 (−2.12, 0.01) | 0.053 | −1.08 (−2.16, −0.01) | 0.048 | −0.84 (−2.01, 0.32) | 0.157 | −0.88 (−2.05, 0.30) | 0.144 |
| Withdrawn behavior | 0.11 (−1.13, 1.35) | 0.861 | 0.24 (−1.00, 1.49) | 0.703 | −1.05 (−2.20, 0.10) | 0.073 | −0.88 (−2.03, 0.28) | 0.138 | −0.42 (−1.67, 0.84) | 0.515 | −0.27 (−1.53, 0.99) | 0.674 |
| Sleep problems | 0.08 (−0.65, 0.82) | 0.821 | 0.18 (−0.55, 0.92) | 0.629 | −0.15 (−0.83, 0.52) | 0.658 | −0.12 (−0.80, 0.56) | 0.726 | −0.03 (−0.77, 0.71) | 0.943 | −0.01 (−0.76, 0.73) | 0.976 |
| Attention problems | −0.53 (−1.44, 0.37) | 0.249 | −0.37 (−1.27, 0.53) | 0.423 | −1.27 (−2.11, −0.44) | 0.003 | −1.01 (−1.85, −0.18) | 0.017 | −0.97 (−1.88, −0.05) | 0.038 | −0.78 (−1.69, 0.13) | 0.095 |
| Aggressive behavior | −0.71 (−1.59, 0.17) | 0.113 | −0.53 (−1.41, 0.35) | 0.238 | −1.60 (−2.41, −0.79) | <0.001 | −1.42 (−2.23, −0.60) | 0.001 | −1.19 (−2.08, −0.30) | 0.009 | −1.05 (−1.94, −0.16) | 0.021 |
| Stress problems | 0.30 (−0.74, 1.33) | 0.573 | 0.34 (−0.70, 1.38) | 0.523 | −0.62 (−1.57, 0.34) | 0.205 | −0.62 (−1.58, 0.35) | 0.210 | −0.42 (−1.47, 0.62) | 0.426 | −0.48 (−1.53, 0.58) | 0.377 |
| Composite problem | ||||||||||||
| Internalizing problems | −0.29 (−2.38, 1.80) | 0.788 | 0.04 (−2.05, 2.13) | 0.971 | −2.68 (−4.61, −0.75) | 0.007 | −2.50 (−4.43, −0.56) | 0.012 | −1.15 (−3.26, 0.96) | 0.285 | −1.07 (−3.19, 1.04) | 0.320 |
| Externalizing problems | −1.47 (−3.27, 0.33) | 0.110 | −1.02 (−2.79, 0.76) | 0.262 | −3.28 (−4.94, −1.61) | <0.001 | −2.75 (−4.40, −1.10) | 0.001 | −2.28 (−4.09, −0.46) | 0.014 | −1.88 (−3.68, −0.08) | 0.041 |
| Total problems | −1.16 (−3.20, 0.89) | 0.268 | −0.72 (−2.74, 1.31) | 0.488 | −3.32 (−5.21, −1.44) | 0.001 | −2.96 (−4.84, −1.07) | 0.002 | −2.01 (−4.08, 0.05) | 0.056 | −1.78 (−3.84, 0.28) | 0.090 |
| DSM-oriented problem | ||||||||||||
| Affective problems | −0.03 (−1.28, 1.21) | 0.957 | 0.06 (−1.18, 1.30) | 0.926 | −0.96 (−2.11, 0.18) | 0.100 | −0.97 (−2.12, 0.19) | 0.102 | −0.20 (−1.46, 1.05) | 0.751 | −0.25 (−1.51, 1.02) | 0.701 |
| Anxiety problems | −0.04 (−1.22, 1.13) | 0.816 | −0.04 (−1.22, 1.13) | 0.941 | −1.19 (−2.29, −0.10) | 0.039 | −1.19 (−2.29, −0.10) | 0.032 | −0.36 (−1.56, 0.83) | 0.631 | −0.36 (−1.56, 0.83) | 0.551 |
| Pervasive developmental problems | −0.38 (−1.70, 0.93) | 0.409 | −0.55 (−1.87, 0.76) | 0.569 | −1.24 (−2.46, −0.02) | 0.030 | −1.34 (−2.56, −0.13) | 0.047 | −0.49 (−1.83, 0.84) | 0.381 | −0.59 (−1.92, 0.73) | 0.469 |
| Attention deficit/hyperactivity problems | −0.82 (−1.78, 0.14) | 0.093 | −0.66 (−1.61, 0.29) | 0.175 | −1.55 (−2.43, −0.66) | 0.001 | −1.29 (−2.17, −0.41) | 0.004 | −1.05 (−2.02, −0.09) | 0.033 | −0.88 (−1.85, 0.08) | 0.074 |
| Oppositional defiant problems | −0.01 (−0.79, 0.76) | 0.97 | 0.07 (−0.71, 0.84) | 0.863 | −1.05 (−1.76, −0.33) | 0.004 | −0.93 (−1.65, −0.21) | 0.011 | −0.49 (−1.27, 0.29) | 0.222 | −0.39 (−1.18, 0.40) | 0.333 |
Disclaimer/Publisher’s Note: The statements, opinions and data contained in all publications are solely those of the individual author(s) and contributor(s) and not of MDPI and/or the editor(s). MDPI and/or the editor(s) disclaim responsibility for any injury to people or property resulting from any ideas, methods, instructions or products referred to in the content. |
© 2024 by the authors. Licensee MDPI, Basel, Switzerland. This article is an open access article distributed under the terms and conditions of the Creative Commons Attribution (CC BY) license (https://creativecommons.org/licenses/by/4.0/).
Share and Cite
Meng, Y.; Yu, H.; Zhang, M.; Li, H.; Zhou, Y.; Liu, J. The Effects of Breastfeeding on Childhood Behavioral and Emotional Development: A Prospective Cohort Study in China. Nutrients 2024, 16, 1743. https://doi.org/10.3390/nu16111743
Meng Y, Yu H, Zhang M, Li H, Zhou Y, Liu J. The Effects of Breastfeeding on Childhood Behavioral and Emotional Development: A Prospective Cohort Study in China. Nutrients. 2024; 16(11):1743. https://doi.org/10.3390/nu16111743
Chicago/Turabian StyleMeng, Ying, Hongzhao Yu, Mingxuan Zhang, Hongtian Li, Yubo Zhou, and Jianmeng Liu. 2024. "The Effects of Breastfeeding on Childhood Behavioral and Emotional Development: A Prospective Cohort Study in China" Nutrients 16, no. 11: 1743. https://doi.org/10.3390/nu16111743