
Feasibility and Cardiometabolic Effects of Time-Restricted Eating in Patients with Metabolic Syndrome

 ,
,  , , ,
, , ,  , , ,
, , ,  ,
,  and
and
Abstract
1. Introduction
2. Materials and Methods
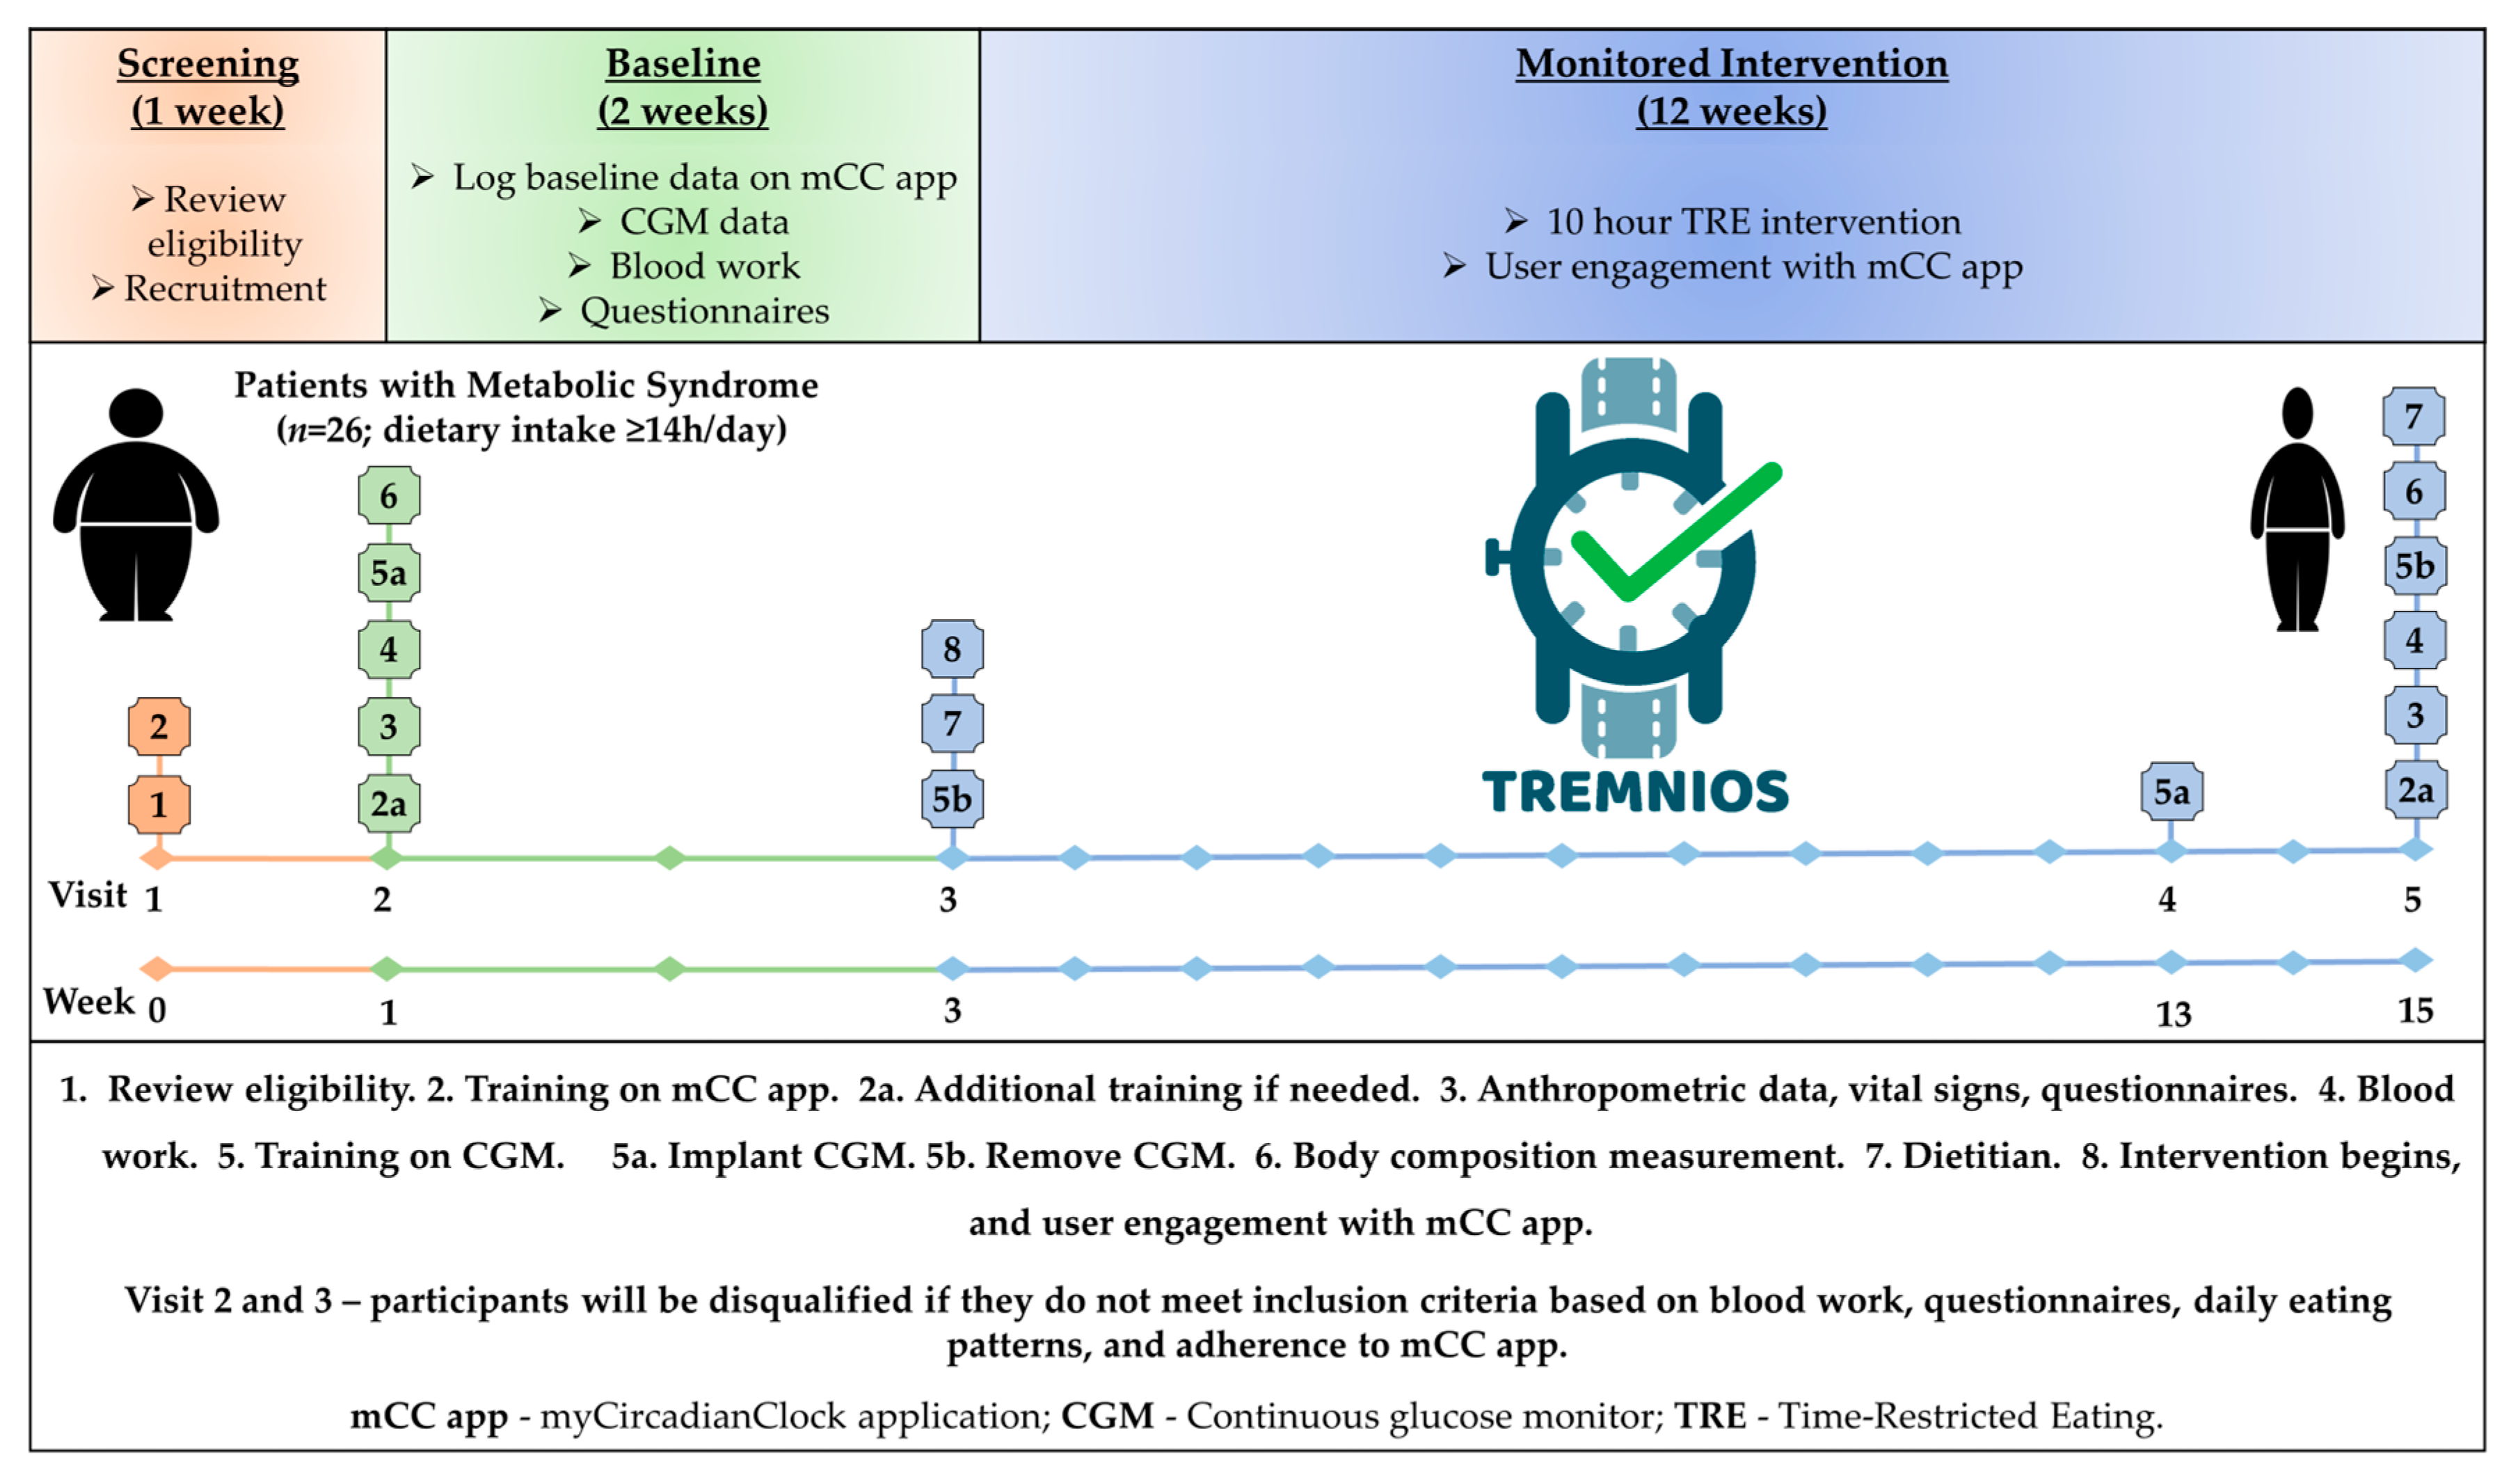
2.1. Study Design and Participants
2.2. TRE Intervention
2.3. myCircadianClock Application
2.4. Continuous Glucose Monitor
2.5. Anthropometry, Body Composition, Cardiovascular Parameters, Questionnaires, and Blood Samples
2.6. Dietetic Analysis
2.7. Primary and Secondary Outcomes Measures
2.8. Statistical Analysis
3. Results
3.1. Baseline Demographic and Clinical Characteristics
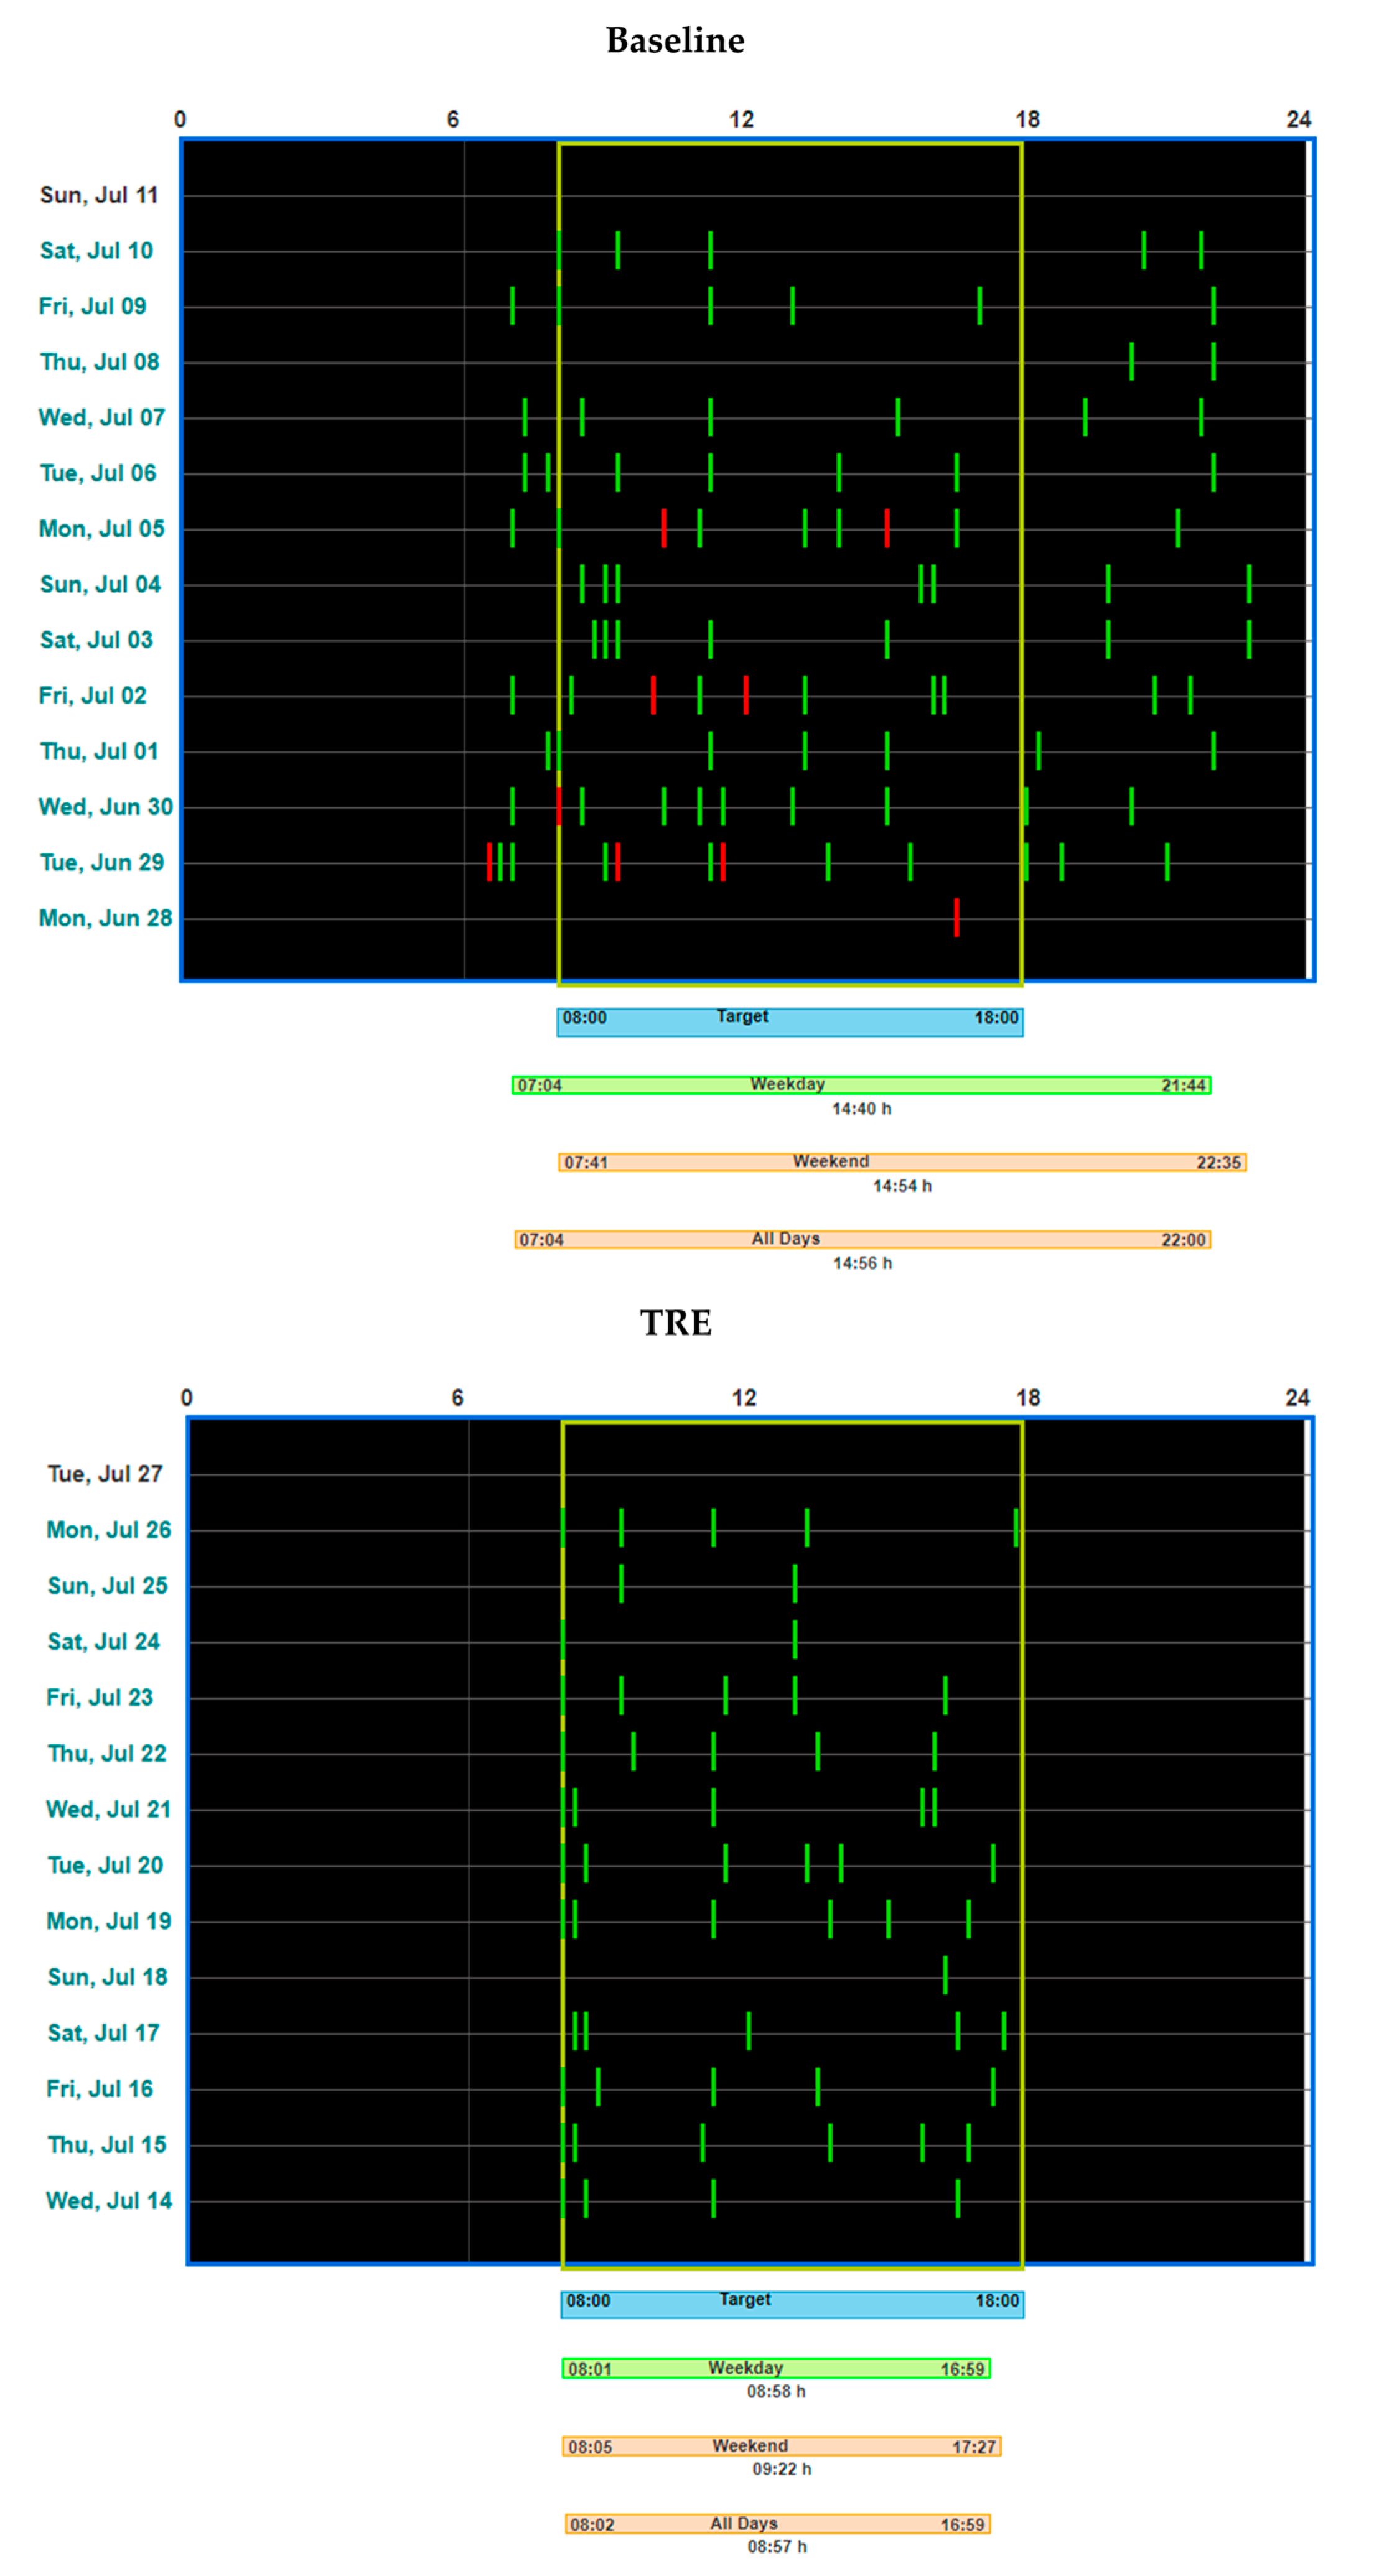
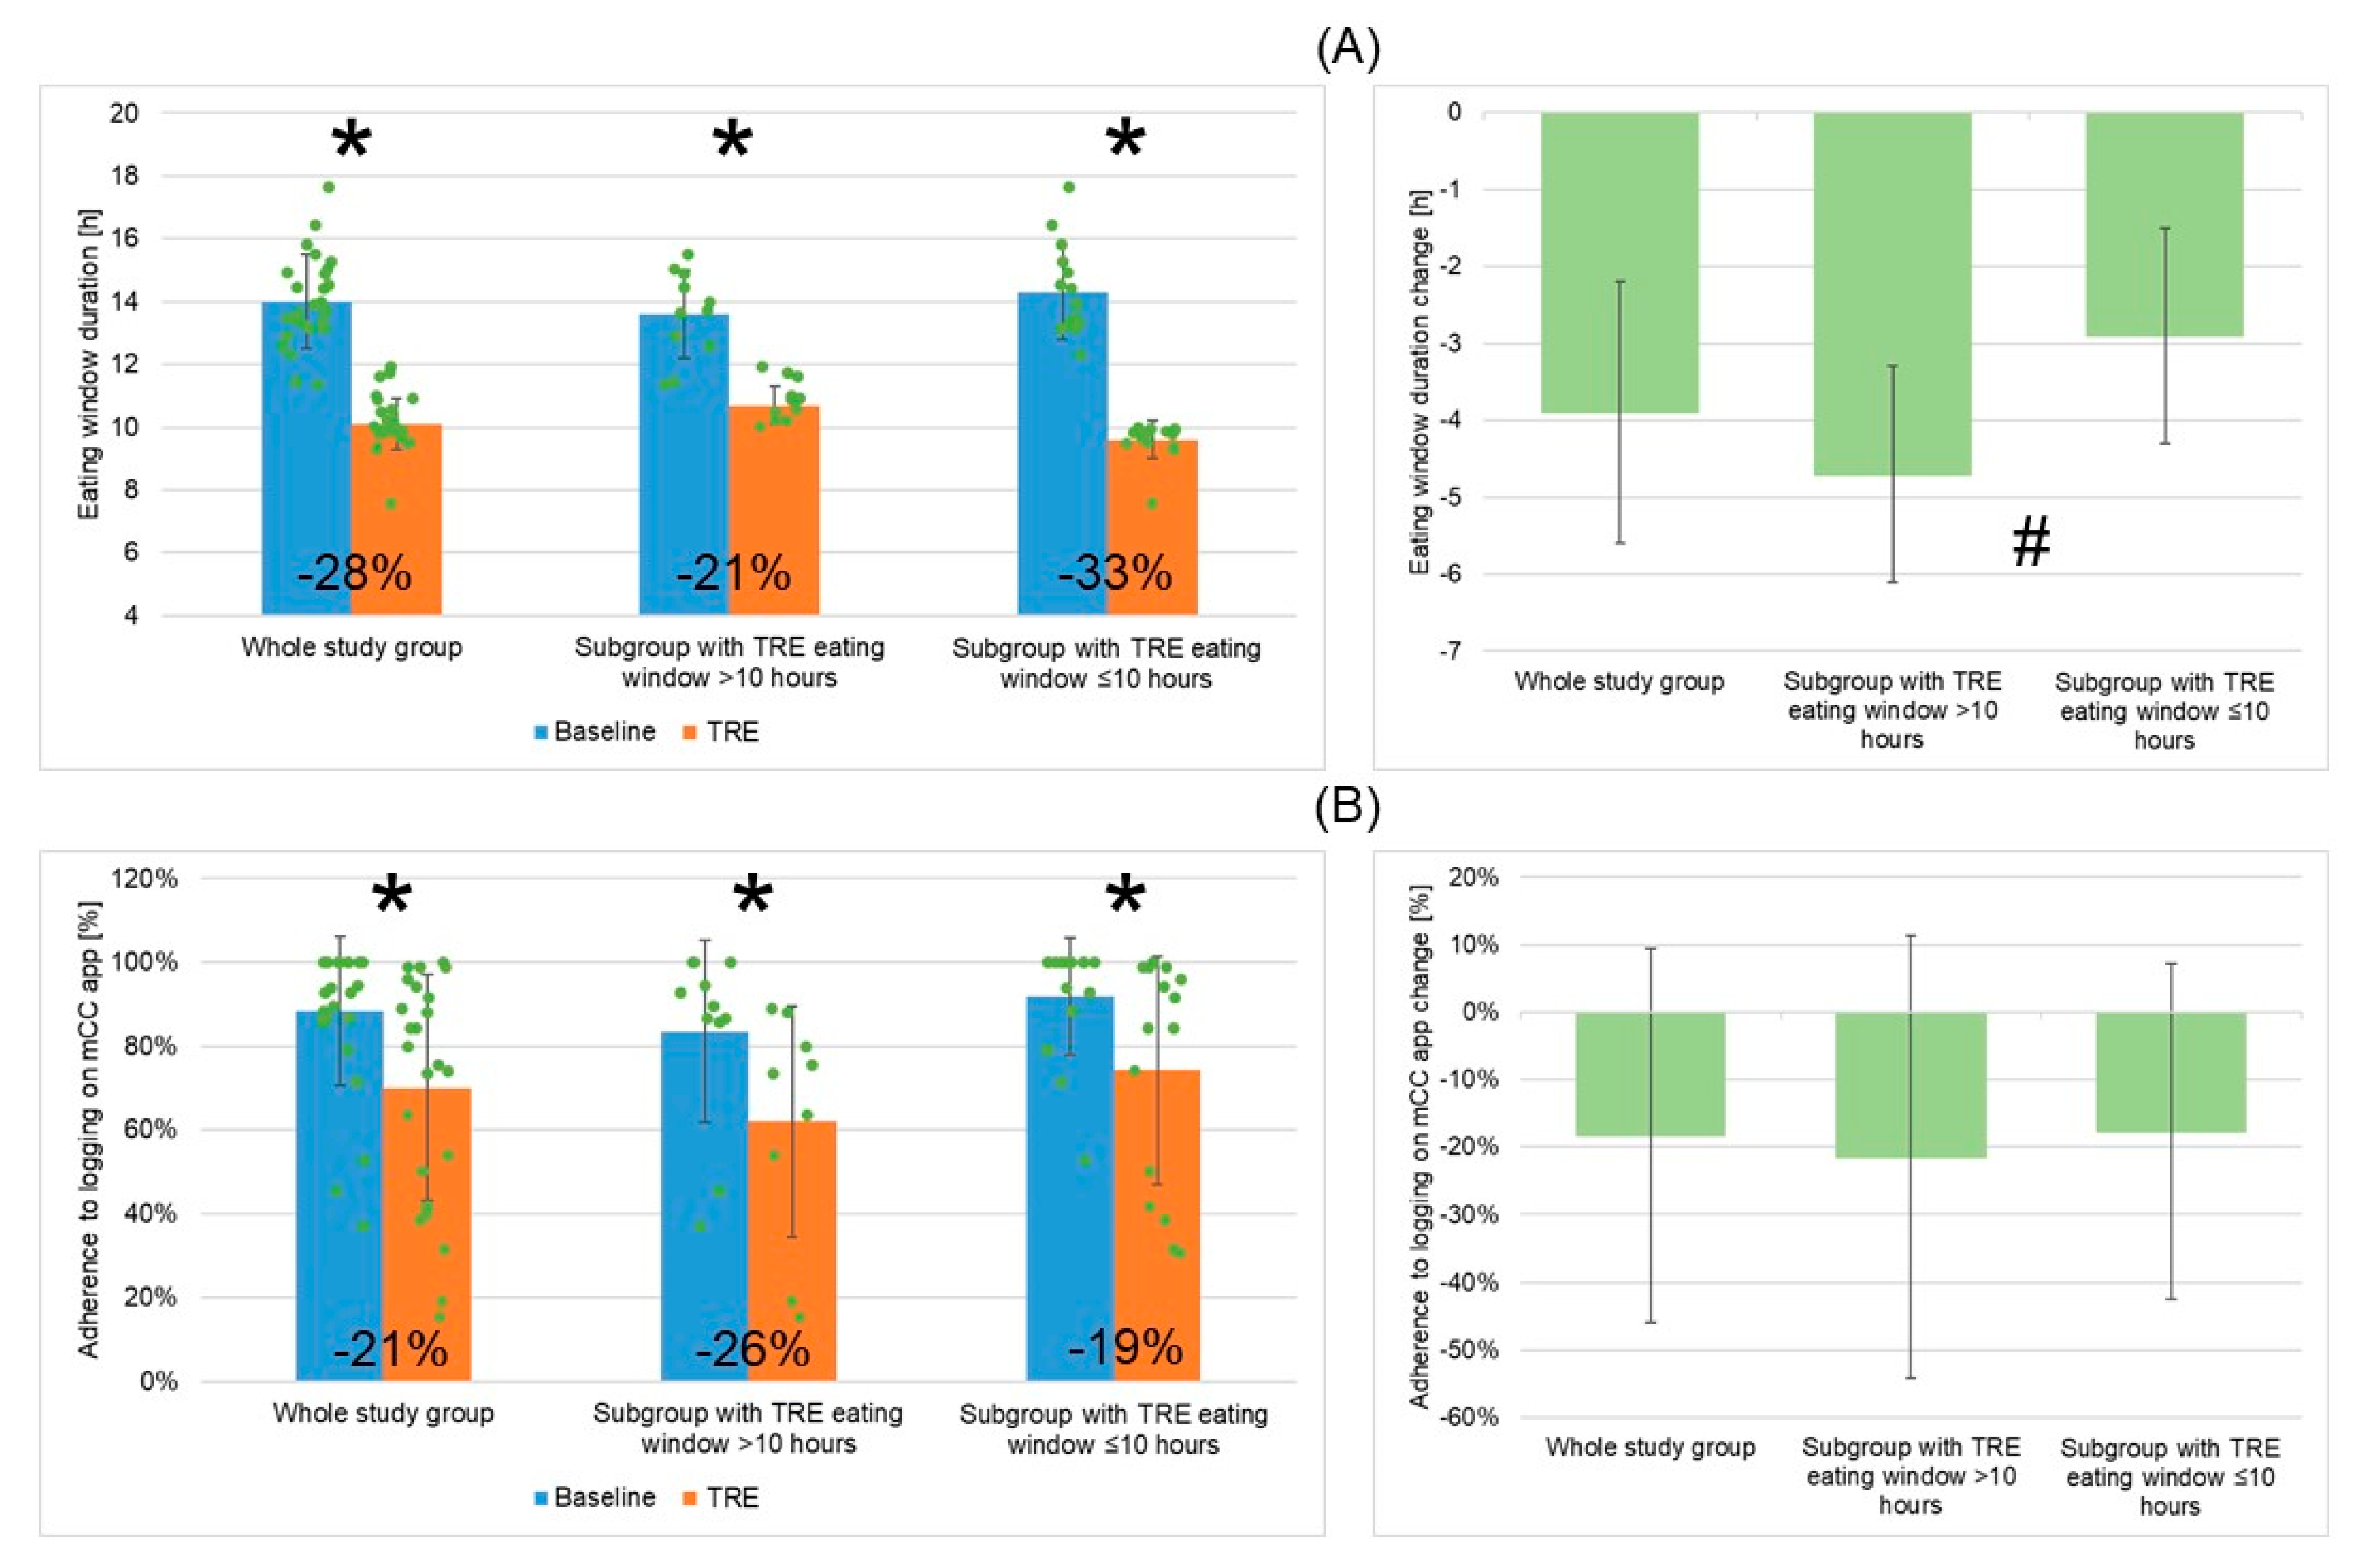
3.2. TRE Intervention: Duration, Adherence to TRE, and Adherence to Logging on mCC App
3.3. TRE Intervention: Changes in Eating Window Duration, Adherence to Logging on the mCC App, Cardiometabolic Outcomes, and Wellbeing Outcomes
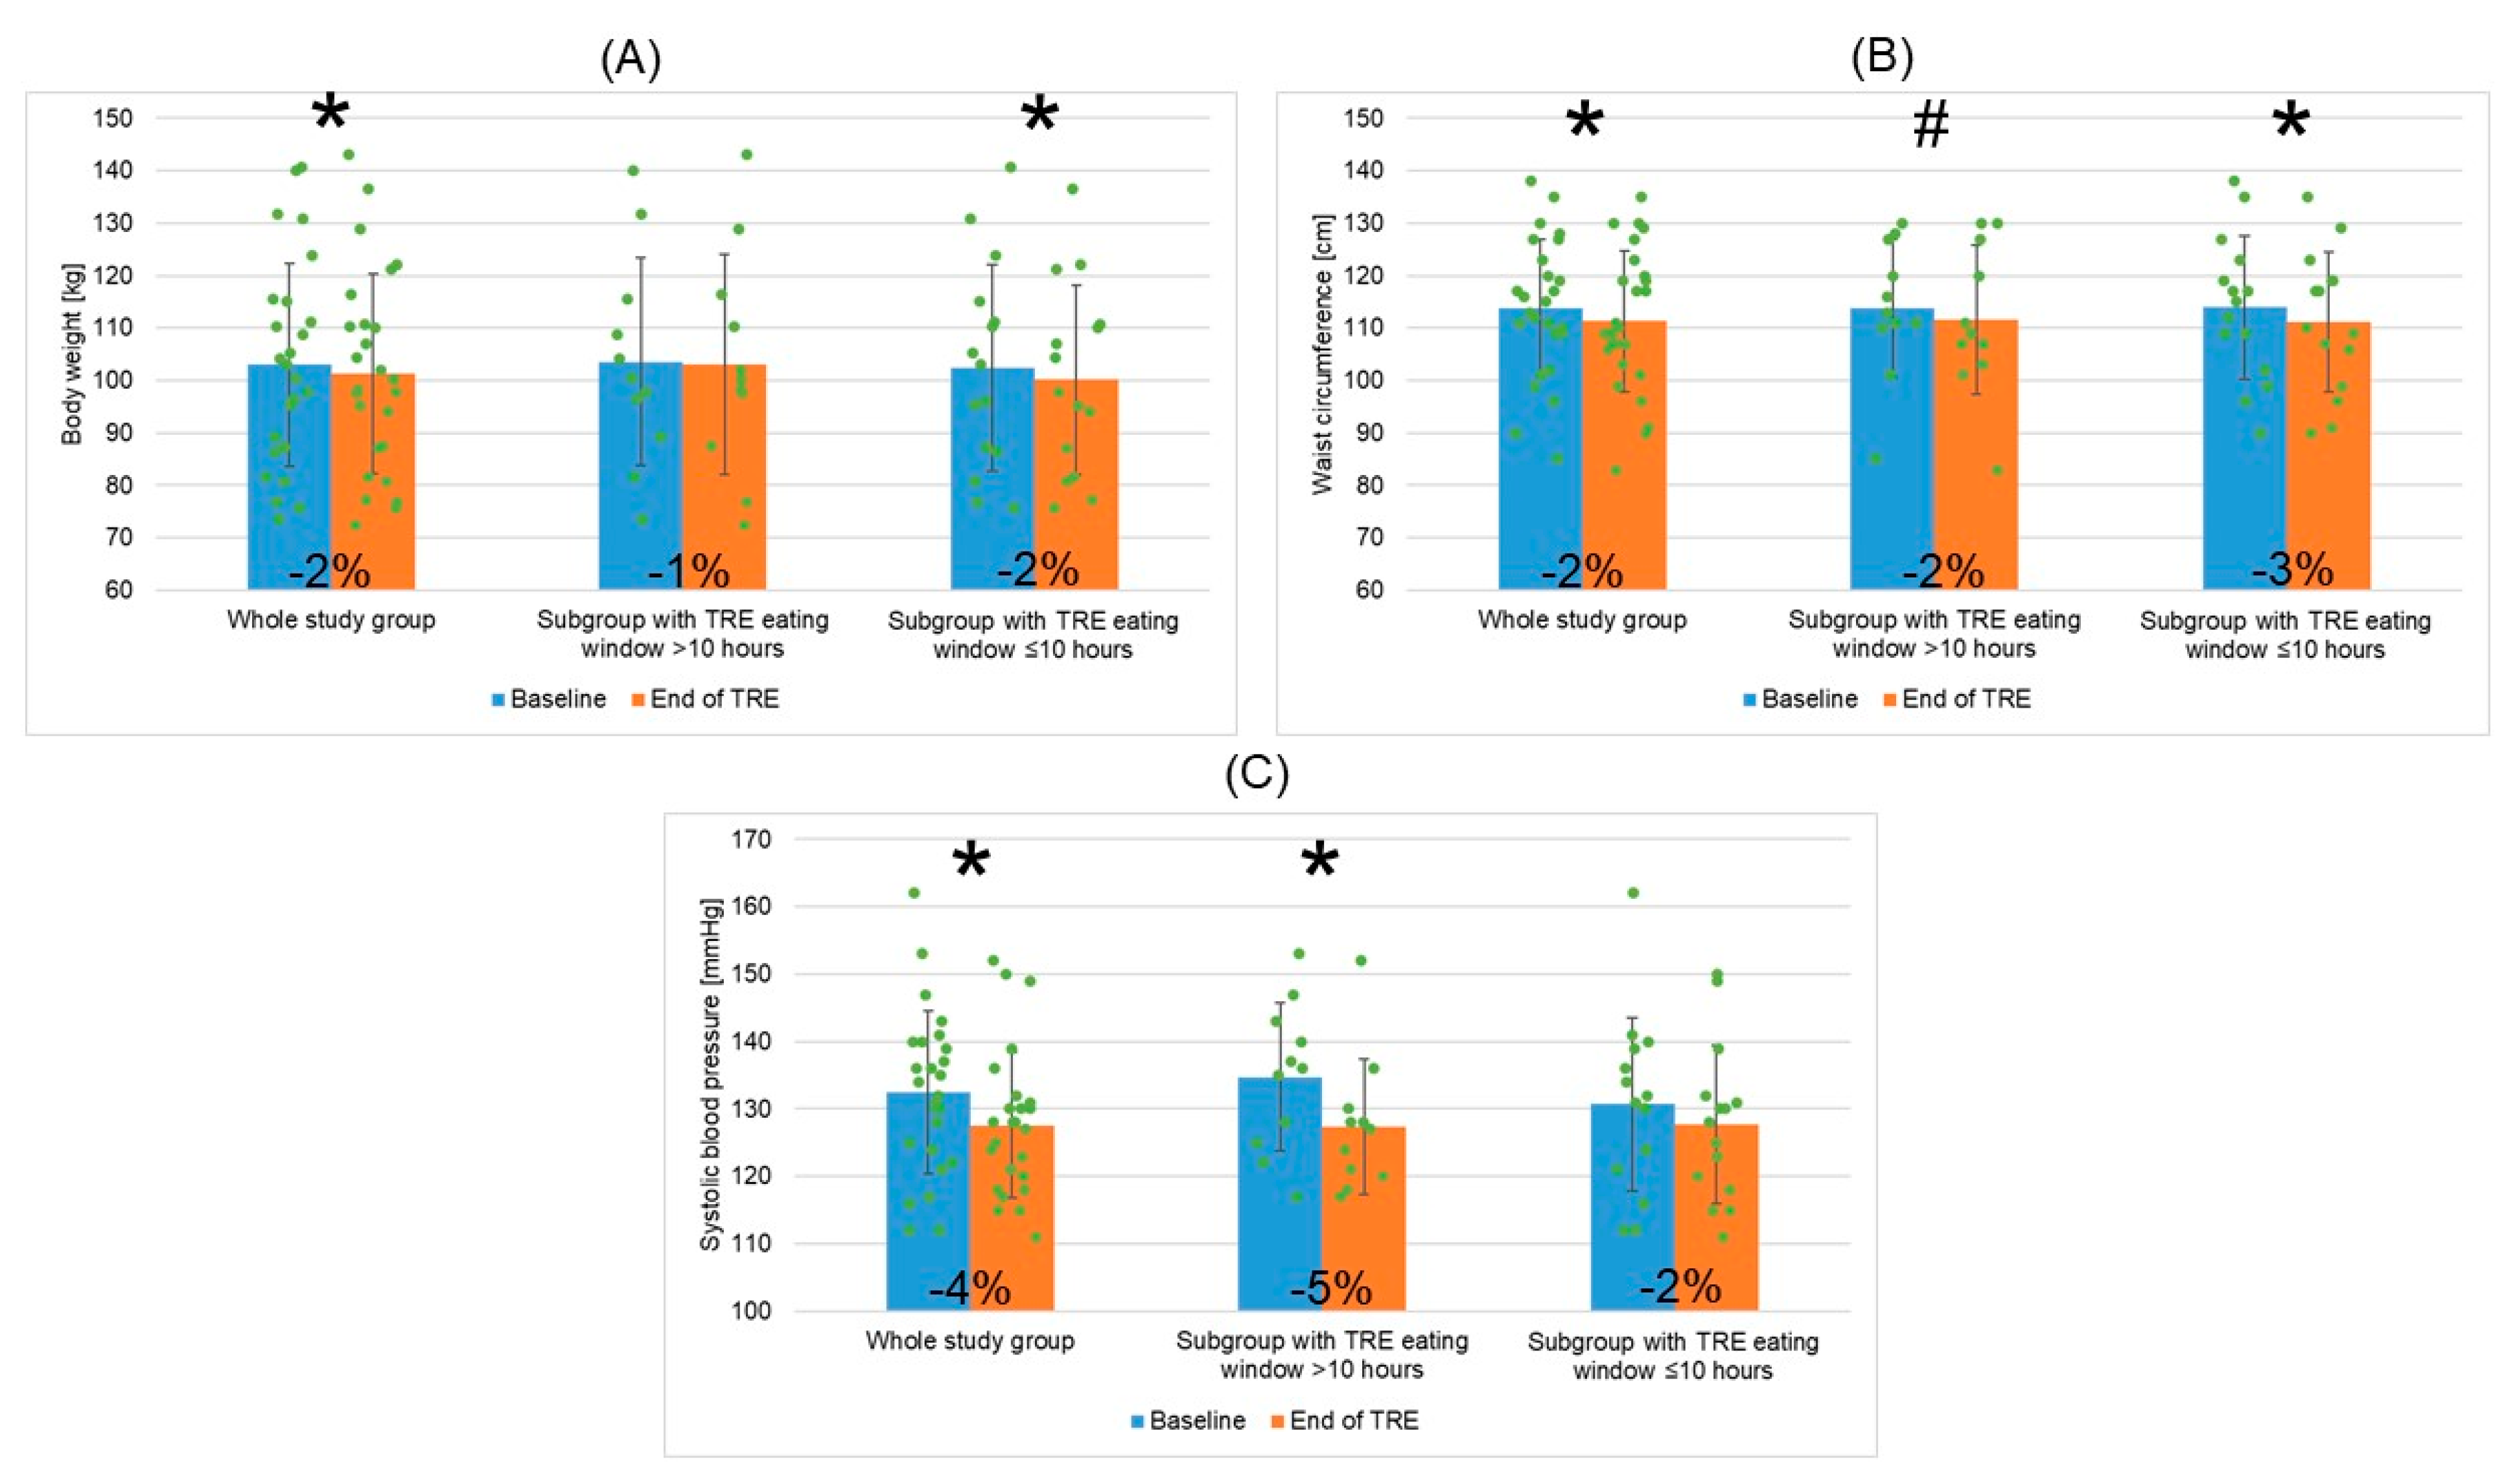
3.3.1. TRE Intervention: Changes in EW Duration, Adherence to Logging on the mCC App, Cardiometabolic Outcomes, and Wellbeing Outcomes for the Whole Study Group
3.3.2. Adherence to TRE Intervention and Changes in EW Duration, Adherence to Logging on mCC App, Cardiometabolic Outcomes, and Wellbeing Outcomes for Two Patient Subgroups Depending on Mean TRE Daily EW Duration (>10 h or ≤10 h)
3.4. Primary and Main Exploratory Study Outcomes
4. Discussion
5. Conclusions
Author Contributions
Funding
Institutional Review Board Statement
Informed Consent Statement
Data Availability Statement
Acknowledgments
Conflicts of Interest
References
- Vos, T.; Lim, S.S.; Abbafati, C.; Abbas, K.M.; Abbasi, M.; Abbasifard, M.; Abbasi-Kangevari, M.; Abbastabar, H.; Abd-Allah, F.; Abdelalim, A.; et al. Global Burden of 369 Diseases and Injuries in 204 Countries and Territories, 1990–2019: A Systematic Analysis for the Global Burden of Disease Study 2019. Lancet 2020, 396, 1204–1222. [Google Scholar] [CrossRef] [PubMed]
- Virani, S.S.; Alonso, A.; Benjamin, E.J.; Bittencourt, M.S.; Callaway, C.W.; Carson, A.P.; Chamberlain, A.M.; Chang, A.R.; Cheng, S.; Delling, F.N.; et al. Heart Disease and Stroke Statistics—2020 Update: A Report From the American Heart Association. Circulation 2020, 141, e139–e596. [Google Scholar] [CrossRef] [PubMed]
- Alberti, K.G.M.M.; Eckel, R.H.; Grundy, S.M.; Zimmet, P.Z.; Cleeman, J.I.; Donato, K.A.; Fruchart, J.-C.; James, W.P.T.; Loria, C.M.; Smith, S.C. Harmonizing the Metabolic Syndrome. Circulation 2009, 120, 1640–1645. [Google Scholar] [CrossRef] [PubMed]
- International Diabetes Federation. Consensus Worldwide Defnition of the Metabolic Syndrome. Available online: https://idf.org/media/uploads/2023/05/attachments-30.pdf (accessed on 10 February 2023).
- Ervin, R.B. Prevalence of Metabolic Syndrome among Adults 20 Years of Age and over, by Sex, Age, Race and Ethnicity, and Body Mass Index: United States, 2003–2006. Natl. Health Stat. Rep. 2009, 13, 1–7. [Google Scholar]
- Beltrán-Sánchez, H.; Harhay, M.O.; Harhay, M.M.; McElligott, S. Prevalence and Trends of Metabolic Syndrome in the Adult U.S. Population, 1999–2010. J. Am. Coll. Cardiol. 2013, 62, 697–703. [Google Scholar] [CrossRef] [PubMed]
- Moore, J.X.; Chaudhary, N.; Akinyemiju, T. Metabolic Syndrome Prevalence by Race/Ethnicity and Sex in the United States, National Health and Nutrition Examination Survey, 1988–2012. Prev. Chronic Dis. 2017, 14, 160287. [Google Scholar] [CrossRef] [PubMed]
- Scuteri, A.; Laurent, S.; Cucca, F.; Cockcroft, J.; Cunha, P.G.; Mañas, L.R.; Raso, F.U.M.; Muiesan, M.L.; Ryliškytė, L.; Rietzschel, E.; et al. Metabolic Syndrome across Europe: Different Clusters of Risk Factors. Eur. J. Prev. Cardiol. 2015, 22, 486–491. [Google Scholar] [CrossRef]
- Sygnowska, E.; Piwońska, A.; Waśkiewicz, A.; Broda, G. Socioeconomic Factors and the Risk of Metabolic Syndrome in the Adult Polish Population: The WOBASZ Study. Kardiol. Pol. 2012, 70, 718–727. [Google Scholar] [PubMed]
- Martin, S.S.; Aday, A.W.; Almarzooq, Z.I.; Anderson, C.A.M.; Arora, P.; Avery, C.L.; Baker-Smith, C.M.; Barone Gibbs, B.; Beaton, A.Z.; Boehme, A.K.; et al. 2024 Heart Disease and Stroke Statistics: A Report of US and Global Data From the American Heart Association. Circulation 2024, 149, e347–e913. [Google Scholar] [CrossRef]
- Mottillo, S.; Filion, K.B.; Genest, J.; Joseph, L.; Pilote, L.; Poirier, P.; Rinfret, S.; Schiffrin, E.L.; Eisenberg, M.J. The Metabolic Syndrome and Cardiovascular Risk. J. Am. Coll. Cardiol. 2010, 56, 1113–1132. [Google Scholar] [CrossRef]
- Hirode, G.; Wong, R.J. Trends in the Prevalence of Metabolic Syndrome in the United States, 2011-2016. JAMA 2020, 323, 2526. [Google Scholar] [CrossRef] [PubMed]
- Saklayen, M.G. The Global Epidemic of the Metabolic Syndrome. Curr. Hypertens. Rep. 2018, 20, 12. [Google Scholar] [CrossRef]
- Yusuf, S.; Hawken, S.; Ôunpuu, S.; Dans, T.; Avezum, A.; Lanas, F.; McQueen, M.; Budaj, A.; Pais, P.; Varigos, J.; et al. Effect of Potentially Modifiable Risk Factors Associated with Myocardial Infarction in 52 Countries (the INTERHEART Study): Case-Control Study. Lancet 2004, 364, 937–952. [Google Scholar] [CrossRef] [PubMed]
- Murray, C.J.L.; Aravkin, A.Y.; Zheng, P.; Abbafati, C.; Abbas, K.M.; Abbasi-Kangevari, M.; Abd-Allah, F.; Abdelalim, A.; Abdollahi, M.; Abdollahpour, I.; et al. Global Burden of 87 Risk Factors in 204 Countries and Territories, 1990–2019: A Systematic Analysis for the Global Burden of Disease Study 2019. Lancet 2020, 396, 1223–1249. [Google Scholar] [CrossRef]
- Phelps, N.H.; Singleton, R.K.; Zhou, B.; Heap, R.A.; Mishra, A.; Bennett, J.E.; Paciorek, C.J.; Lhoste, V.P.; Carrillo-Larco, R.M.; Stevens, G.A.; et al. Worldwide Trends in Underweight and Obesity from 1990 to 2022: A Pooled Analysis of 3663 Population-Representative Studies with 222 Million Children, Adolescents, and Adults. Lancet 2024, 403, 1027–1050. [Google Scholar] [CrossRef] [PubMed]
- Eckel, R.H.; Alberti, K.; Grundy, S.M.; Zimmet, P.Z. The Metabolic Syndrome. Lancet 2010, 375, 181–183. [Google Scholar] [CrossRef]
- Sperling, L.S.; Mechanick, J.I.; Neeland, I.J.; Herrick, C.J.; Després, J.-P.; Ndumele, C.E.; Vijayaraghavan, K.; Handelsman, Y.; Puckrein, G.A.; Araneta, M.R.G.; et al. The CardioMetabolic Health Alliance. J. Am. Coll. Cardiol. 2015, 66, 1050–1067. [Google Scholar] [CrossRef] [PubMed]
- Castro-Barquero, S.; Ruiz-León, A.M.; Sierra-Pérez, M.; Estruch, R.; Casas, R. Dietary Strategies for Metabolic Syndrome: A Comprehensive Review. Nutrients 2020, 12, 2983. [Google Scholar] [CrossRef] [PubMed]
- Rochlani, Y.; Pothineni, N.V.; Kovelamudi, S.; Mehta, J.L. Metabolic Syndrome: Pathophysiology, Management, and Modulation by Natural Compounds. Ther. Adv. Cardiovasc. Dis. 2017, 11, 215–225. [Google Scholar] [CrossRef]
- Pérez-Martínez, P.; Mikhailidis, D.P.; Athyros, V.G.; Bullo, M.; Couture, P.; Covas, M.I.; de Koning, L.; Delgado-Lista, J.; Díaz-López, A.; Drevon, C.A.; et al. Lifestyle Recommendations for the Prevention and Management of Metabolic Syndrome: An International Panel Recommendation. Nutr. Rev. 2017, 75, 307–326. [Google Scholar] [CrossRef]
- Feinman, R.D.; Pogozelski, W.K.; Astrup, A.; Bernstein, R.K.; Fine, E.J.; Westman, E.C.; Accurso, A.; Frassetto, L.; Gower, B.A.; McFarlane, S.I.; et al. Dietary Carbohydrate Restriction as the First Approach in Diabetes Management: Critical Review and Evidence Base. Nutrition 2015, 31, 1–13. [Google Scholar] [CrossRef] [PubMed]
- Visseren, F.L.J.; Mach, F.; Smulders, Y.M.; Carballo, D.; Koskinas, K.C.; Bäck, M.; Benetos, A.; Biffi, A.; Boavida, J.-M.; Capodanno, D.; et al. 2021 ESC Guidelines on Cardiovascular Disease Prevention in Clinical Practice. Eur. J. Prev. Cardiol. 2022, 29, 5–115. [Google Scholar] [CrossRef] [PubMed]
- Panda, S. Circadian Physiology of Metabolism. Science 2016, 354, 1008–1015. [Google Scholar] [CrossRef] [PubMed]
- Świątkiewicz, I.; Woźniak, A.; Taub, P.R. Time-Restricted Eating and Metabolic Syndrome: Current Status and Future Perspectives. Nutrients 2021, 13, 221. [Google Scholar] [CrossRef] [PubMed]
- Chaix, A.; Manoogian, E.N.C.; Melkani, G.C.; Panda, S. Time-Restricted Eating to Prevent and Manage Chronic Metabolic Diseases. Annu. Rev. Nutr. 2019, 39, 291–315. [Google Scholar] [CrossRef] [PubMed]
- Suliga, E.; Kozieł, D.; Cieśla, E.; Rębak, D.; Głuszek, S. Dietary Patterns in Relation to Metabolic Syndrome among Adults in Poland: A Cross-Sectional Study. Nutrients 2017, 9, 1366. [Google Scholar] [CrossRef] [PubMed]
- Zarrinpar, A.; Chaix, A.; Panda, S. Daily Eating Patterns and Their Impact on Health and Disease. Trends Endocrinol. Metab. 2016, 27, 69–83. [Google Scholar] [CrossRef]
- Cahill, L.E.; Chiuve, S.E.; Mekary, R.A.; Jensen, M.K.; Flint, A.J.; Hu, F.B.; Rimm, E.B. Prospective Study of Breakfast Eating and Incident Coronary Heart Disease in a Cohort of Male US Health Professionals. Circulation 2013, 128, 337–343. [Google Scholar] [CrossRef] [PubMed]
- Pot, G.K.; Almoosawi, S.; Stephen, A.M. Meal Irregularity and Cardiometabolic Consequences: Results from Observational and Intervention Studies. Proc. Nutr. Soc. 2016, 75, 475–486. [Google Scholar] [CrossRef]
- Ha, K.; Song, Y. Associations of Meal Timing and Frequency with Obesity and Metabolic Syndrome among Korean Adults. Nutrients 2019, 11, 2437. [Google Scholar] [CrossRef]
- Mason, I.C.; Qian, J.; Adler, G.K.; Scheer, F.A.J.L. Impact of Circadian Disruption on Glucose Metabolism: Implications for Type 2 Diabetes. Diabetologia 2020, 63, 462–472. [Google Scholar] [CrossRef] [PubMed]
- Stenvers, D.J.; Scheer, F.A.J.L.; Schrauwen, P.; la Fleur, S.E.; Kalsbeek, A. Circadian Clocks and Insulin Resistance. Nat. Rev. Endocrinol. 2019, 15, 75–89. [Google Scholar] [CrossRef] [PubMed]
- Chellappa, S.L.; Vujovic, N.; Williams, J.S.; Scheer, F.A.J.L. Impact of Circadian Disruption on Cardiovascular Function and Disease. Trends Endocrinol. Metab. 2019, 30, 767–779. [Google Scholar] [CrossRef] [PubMed]
- Kant, A.K.; Graubard, B.I. 40-Year Trends in Meal and Snack Eating Behaviors of American Adults. J. Acad. Nutr. Diet. 2015, 115, 50–63. [Google Scholar] [CrossRef] [PubMed]
- Gupta, N.J.; Kumar, V.; Panda, S. A Camera-Phone Based Study Reveals Erratic Eating Pattern and Disrupted Daily Eating-Fasting Cycle among Adults in India. PLoS ONE 2017, 12, e0172852. [Google Scholar] [CrossRef] [PubMed]
- Gill, S.; Panda, S. A Smartphone App Reveals Erratic Diurnal Eating Patterns in Humans That Can Be Modulated for Health Benefits. Cell Metab. 2015, 22, 789–798. [Google Scholar] [CrossRef] [PubMed]
- Wilkinson, M.J.; Manoogian, E.N.C.; Zadourian, A.; Lo, H.; Fakhouri, S.; Shoghi, A.; Wang, X.; Fleischer, J.G.; Navlakha, S.; Panda, S.; et al. Ten-Hour Time-Restricted Eating Reduces Weight, Blood Pressure, and Atherogenic Lipids in Patients with Metabolic Syndrome. Cell Metab. 2020, 31, 92–104.e5. [Google Scholar] [CrossRef]
- de Cabo, R.; Mattson, M.P. Effects of Intermittent Fasting on Health, Aging, and Disease. N. Engl. J. Med. 2019, 381, 2541–2551. [Google Scholar] [CrossRef] [PubMed]
- Phillips, N.; Mareschal, J.; Schwab, N.; Manoogian, E.; Borloz, S.; Ostinelli, G.; Gauthier-Jaques, A.; Umwali, S.; Gonzalez Rodriguez, E.; Aeberli, D.; et al. The Effects of Time-Restricted Eating versus Standard Dietary Advice on Weight, Metabolic Health and the Consumption of Processed Food: A Pragmatic Randomised Controlled Trial in Community-Based Adults. Nutrients 2021, 13, 1042. [Google Scholar] [CrossRef]
- Peeke, P.M.; Greenway, F.L.; Billes, S.K.; Zhang, D.; Fujioka, K. Effect of Time Restricted Eating on Body Weight and Fasting Glucose in Participants with Obesity: Results of a Randomized, Controlled, Virtual Clinical Trial. Nutr. Diabetes 2021, 11, 6. [Google Scholar] [CrossRef]
- Parr, E.B.; Devlin, B.L.; Radford, B.E.; Hawley, J.A. A Delayed Morning and Earlier Evening Time-Restricted Feeding Protocol for Improving Glycemic Control and Dietary Adherence in Men with Overweight/Obesity: A Randomized Controlled Trial. Nutrients 2020, 12, 505. [Google Scholar] [CrossRef]
- Chow, L.S.; Manoogian, E.N.C.; Alvear, A.; Fleischer, J.G.; Thor, H.; Dietsche, K.; Wang, Q.; Hodges, J.S.; Esch, N.; Malaeb, S.; et al. Time-Restricted Eating Effects on Body Composition and Metabolic Measures in Humans Who Are Overweight: A Feasibility Study. Obesity 2020, 28, 860–869. [Google Scholar] [CrossRef]
- Cienfuegos, S.; Gabel, K.; Kalam, F.; Ezpeleta, M.; Wiseman, E.; Pavlou, V.; Lin, S.; Oliveira, M.L.; Varady, K.A. Effects of 4- and 6-h Time-Restricted Feeding on Weight and Cardiometabolic Health: A Randomized Controlled Trial in Adults with Obesity. Cell Metab. 2020, 32, 366–378.e3. [Google Scholar] [CrossRef] [PubMed]
- Gabel, K.; Hoddy, K.K.; Haggerty, N.; Song, J.; Kroeger, C.M.; Trepanowski, J.F.; Panda, S.; Varady, K.A. Effects of 8-Hour Time Restricted Feeding on Body Weight and Metabolic Disease Risk Factors in Obese Adults: A Pilot Study. Nutr. Healthy Aging 2018, 4, 345–353. [Google Scholar] [CrossRef]
- Hutchison, A.T.; Regmi, P.; Manoogian, E.N.C.; Fleischer, J.G.; Wittert, G.A.; Panda, S.; Heilbronn, L.K. Time-Restricted Feeding Improves Glucose Tolerance in Men at Risk for Type 2 Diabetes: A Randomized Crossover Trial. Obesity 2019, 27, 724–732. [Google Scholar] [CrossRef] [PubMed]
- Anton, S.D.; Lee, S.A.; Donahoo, W.T.; McLaren, C.; Manini, T.; Leeuwenburgh, C.; Pahor, M. The Effects of Time Restricted Feeding on Overweight, Older Adults: A Pilot Study. Nutrients 2019, 11, 1500. [Google Scholar] [CrossRef] [PubMed]
- Jamshed, H.; Steger, F.L.; Bryan, D.R.; Richman, J.S.; Warriner, A.H.; Hanick, C.J.; Martin, C.K.; Salvy, S.-J.; Peterson, C.M. Effectiveness of Early Time-Restricted Eating for Weight Loss, Fat Loss, and Cardiometabolic Health in Adults With Obesity. JAMA Intern. Med. 2022, 182, 953. [Google Scholar] [CrossRef]
- Ravussin, E.; Beyl, R.A.; Poggiogalle, E.; Hsia, D.S.; Peterson, C.M. Early Time-Restricted Feeding Reduces Appetite and Increases Fat Oxidation But Does Not Affect Energy Expenditure in Humans. Obesity 2019, 27, 1244–1254. [Google Scholar] [CrossRef]
- Kesztyüs, D.; Cermak, P.; Gulich, M.; Kesztyüs, T. Adherence to Time-Restricted Feeding and Impact on Abdominal Obesity in Primary Care Patients: Results of a Pilot Study in a Pre–Post Design. Nutrients 2019, 11, 2854. [Google Scholar] [CrossRef]
- Jamshed, H.; Beyl, R.; Della Manna, D.; Yang, E.; Ravussin, E.; Peterson, C. Early Time-Restricted Feeding Improves 24-Hour Glucose Levels and Affects Markers of the Circadian Clock, Aging, and Autophagy in Humans. Nutrients 2019, 11, 1234. [Google Scholar] [CrossRef]
- Prasad, M.; Fine, K.; Gee, A.; Nair, N.; Popp, C.J.; Cheng, B.; Manoogian, E.N.C.; Panda, S.; Laferrère, B. A Smartphone Intervention to Promote Time Restricted Eating Reduces Body Weight and Blood Pressure in Adults with Overweight and Obesity: A Pilot Study. Nutrients 2021, 13, 2148. [Google Scholar] [CrossRef] [PubMed]
- Steger, F.L.; Jamshed, H.; Bryan, D.R.; Richman, J.S.; Warriner, A.H.; Hanick, C.J.; Martin, C.K.; Salvy, S.; Peterson, C.M. Early Time-restricted Eating Affects Weight, Metabolic Health, Mood, and Sleep in Adherent Completers: A Secondary Analysis. Obesity 2023, 31, 96–107. [Google Scholar] [CrossRef] [PubMed]
- Sutton, E.F.; Beyl, R.; Early, K.S.; Cefalu, W.T.; Ravussin, E.; Peterson, C.M. Early Time-Restricted Feeding Improves Insulin Sensitivity, Blood Pressure, and Oxidative Stress Even without Weight Loss in Men with Prediabetes. Cell Metab. 2018, 27, 1212–1221.e3. [Google Scholar] [CrossRef]
- Świątkiewicz, I.; Mila-Kierzenkowska, C.; Woźniak, A.; Szewczyk-Golec, K.; Nuszkiewicz, J.; Wróblewska, J.; Rajewski, P.; Eussen, S.J.P.M.; Færch, K.; Manoogian, E.N.C.; et al. Pilot Clinical Trial of Time-Restricted Eating in Patients with Metabolic Syndrome. Nutrients 2021, 13, 346. [Google Scholar] [CrossRef] [PubMed]
- Borushek, A. CalorieKing Calorie, Fat and Carbohydrate 2022. Available online: https://www.calorieking.com/us/en/ (accessed on 9 May 2024).
- Świątkiewicz, I.; Wróblewski, M.; Nuszkiewicz, J.; Sutkowy, P.; Wróblewska, J.; Woźniak, A. The Role of Oxidative Stress Enhanced by Adiposity in Cardiometabolic Diseases. Int. J. Mol. Sci. 2023, 24, 6382. [Google Scholar] [CrossRef] [PubMed]
- Lowe, D.A.; Wu, N.; Rohdin-Bibby, L.; Moore, A.H.; Kelly, N.; Liu, Y.E.; Philip, E.; Vittinghoff, E.; Heymsfield, S.B.; Olgin, J.E.; et al. Effects of Time-Restricted Eating on Weight Loss and Other Metabolic Parameters in Women and Men With Overweight and Obesity. JAMA Intern. Med. 2020, 180, 1491. [Google Scholar] [CrossRef] [PubMed]
- Katula, J.A.; Vitolins, M.Z.; Morgan, T.M.; Lawlor, M.S.; Blackwell, C.S.; Isom, S.P.; Pedley, C.F.; Goff, D.C. The Healthy Living Partnerships to Prevent Diabetes Study. Am. J. Prev. Med. 2013, 44, S324–S332. [Google Scholar] [CrossRef] [PubMed]
- Ackermann, R.T.; Liss, D.T.; Finch, E.A.; Schmidt, K.K.; Hays, L.M.; Marrero, D.G.; Saha, C. A Randomized Comparative Effectiveness Trial for Preventing Type 2 Diabetes. Am. J. Public Health 2015, 105, 2328–2334. [Google Scholar] [CrossRef] [PubMed]
- Świątkiewicz, I.; Di Somma, S.; De Fazio, L.; Mazzilli, V.; Taub, P.R. Effectiveness of Intensive Cardiac Rehabilitation in High-Risk Patients with Cardiovascular Disease in Real-World Practice. Nutrients 2021, 13, 3883. [Google Scholar] [CrossRef]
- Antoni, R.; Robertson, T.M.; Robertson, M.D.; Johnston, J.D. A Pilot Feasibility Study Exploring the Effects of a Moderate Time-Restricted Feeding Intervention on Energy Intake, Adiposity and Metabolic Physiology in Free-Living Human Subjects. J. Nutr. Sci. 2018, 7, e22. [Google Scholar] [CrossRef]
- Zomer, E.; Gurusamy, K.; Leach, R.; Trimmer, C.; Lobstein, T.; Morris, S.; James, W.P.T.; Finer, N. Interventions That Cause Weight Loss and the Impact on Cardiovascular Risk Factors: A Systematic Review and Meta-analysis. Obes. Rev. 2016, 17, 1001–1011. [Google Scholar] [CrossRef] [PubMed]
- Cederroth, C.R.; Albrecht, U.; Bass, J.; Brown, S.A.; Dyhrfjeld-Johnsen, J.; Gachon, F.; Green, C.B.; Hastings, M.H.; Helfrich-Förster, C.; Hogenesch, J.B.; et al. Medicine in the Fourth Dimension. Cell Metab. 2019, 30, 238–250. [Google Scholar] [CrossRef] [PubMed]
- Fontana, L. Interventions to Promote Cardiometabolic Health and Slow Cardiovascular Ageing. Nat. Rev. Cardiol. 2018, 15, 566–577. [Google Scholar] [CrossRef] [PubMed]


| Inclusion Criteria |
|---|
|
| Exclusion Criteria |
|
| Variable | Whole Study Group (n = 26) | Subgroup with TRE Eating Window > 10 h (n = 11) | Subgroup with TRE Eating Window ≤ 10 h (n = 15) | p-Value between Subgroups with TRE Eating Window of >10 h or ≤10 h |
|---|---|---|---|---|
| Age (years) | 45.4 (±12.6) | 43.3 (±13.6) | 47.0 (±12.0) | 0.466 |
| Gender (male/female) n (%) | 10/16 (38.5/61.5) | 5/6 (45.5/54.5) | 5/10 (33.3/66.7) | 0.689 |
| White race n (%) | 26 (100.0) | 11 (100.0) | 15 (100.0) | 1.000 |
| Body weight (kg) | 103.0 (±19.4) | 103.6 (±19.9) | 102.5 (±19.7) | 0.894 |
| BMI (kg/m2) | 34.5 (±5.1) | 34.1 (±5.3) | 34.8 (±5.2) | 0.740 |
| BMI ≥ 30/≥25–30 kg/m2 n (%) | 20 (76.9)/6 (23.1) | 9 (81.8)/2 (18.2) | 11 (73.3/4 (26.7) | 1.000 |
| Waist circumference (cm) | 113.8 (±13.2) | 113.8 (±13.1) | 113.9 (±13.7) | 0.993 |
| Hip circumference (cm) | 120.2 (±11.1) | 119.0 (±12.5) | 121.1 (±10.3) | 0.643 |
| Systolic BP (mmHg) | 132.4 (±12.1) | 134.8 (±11.0) | 130.7 (±12.9) | 0.408 |
| Diastolic BP (mmHg) | 85.1 (±9.1) | 83.5 (±7.9) | 86.3 (±10.0) | 0.446 |
| Mean daily EW (h) a | 14.0 (±1.5) | 13.6 (±1.4) | 14.3 (±1.5) | 0.204 |
| Mean baseline adherence to logging on mCC app [%] b | 88.3 (±17.8) | 83.5 (±21.7) | 91.9 (±14.0) | 0.816 |
| MetS criteria (n/patient) | 3.3 (±0.5) | 3.2 (±0.6) | 3.4 (±0.5) | 1.000 |
| Elevated FPG n (%) | 20 (76.9) | 8 (72.7) | 12 (80.0) | 1.000 |
| Elevated waist circumference n %) | 25 (96.1) | 10 (90.9) | 15 (100.0) | 0.423 |
| Elevated fasting plasma TG n (%) | 14 (53.8) | 8 (72.7) | 6 (40.0) | 0.130 |
| Reduced HDL-C n (%) | 9 (34.6) | 2 (18.2) | 7 (46.7) | 0.394 |
| Elevated systolic and/or diastolic BP n (%) | 18 (69.2) | 7 (63.6) | 11 (73.3) | 1.000 |
| Family history of premature ASCVD n (%) | 12 (46.1) | 4 (36.4) | 8 (53.3) | 0.453 |
| Regular aerobic exercise n (%) | 12 (46.1) | 5 (45.4) | 7 (46.7) | 1.000 |
| Civil status: single/married n (%) | 3 (11.5)/23 (88.5) | 2 (18.2)/9(81.8) | 1 (6.7)/14 (93.3) | 0.556 |
| Education: high school/higher education n (%) | 10 (38.5)/16 (61.5) | 6 (54.5)/5 (45.5) | 4 (26.7)/11(73.3) | 0.228 |
| Employment: unemployed/employed/retired n (%) | 2 (7.7)/21 (80.8)/3 (11.5) | 1 (9.1)/9(81.8)/1 (9.1) | 1 (6.7)/12 (80.0)/2 (13.3) | 0.928 |
| Domicile: village/city n (%) | 4 (15.4)/22 (84.6) | 1 (9.1)/10 (90.9) | 3 (20.0)/12 (80.0) | 1.000 |
| Hemoglobin (g/dL) | 14.4 (±1.5) | 14.3 (±1.8) | 14.5 (±1.2) | 0.855 |
| Leukocyte count (103/µL) | 6.7 (±1.9) | 7.0 (±2.2) | 6.4 (±1.5) | 0.464 |
| Creatinine (mg/dL) | 0.80 (±0.14) | 0.76 (±0.15) | 0.83 (±0.13) | 0.242 |
| Uric acid (mg/dL) | 5.9 (±1.2) | 5.9 (±0.7) | 5.9 (±1.5) | 0.393 |
| FPG (mg/dL) | 102.0 (±8.6) | 101.2 (±8.8) | 102.7 (±8.7) | 0.673 |
| Glycated hemoglobin (%) | 5.6 (±0.4) | 5.7 (±0.5) | 5.6 (±0.4) | 0.723 |
| Mean fasting blood glucose (mg/dL) c | 91.6 (±11.3) | 94.4 (±9.3) | 89.6 (±12.5) | 0.294 |
| Mean 24-h blood glucose (mg/dL) c | 96.4 (±9.6) | 100.4 (±7.4) | 93.5 (±10.2) | 0.070 |
| ALT (U/L) | 37.3 (±19.9) | 44.5 (±29.0) | 33.7 (±13.8) | 0.851 |
| AST (U/L) | 28.4 (±15.8) | 32.4 (±22.3) | 25.7 (±9.8) | 1.000 |
| TSH (mIU/L) | 2.1 (±0.7) | 2.0 (±0.8) | 2.2 (±0.6) | 0.433 |
| TC (mg/dL) | 200.3 (±36.5) | 200.2 (±37.3) | 200.4 (±37.2) | 0.989 |
| Non-HDL-C (mg/dL) | 147.3 (±38.2) | 147.8 (±39.5) | 146.9 (±38.6) | 0.953 |
| HDL-C (mg/dL) | 53.0 (±14.8) | 52.4 (±7.5) | 53.3 (±18.4) | 0.874 |
| LDL-C (mg/dL) | 116.7 (±34.3) | 115.9 (±39.0) | 117.4 (±31.8) | 0.916 |
| TG (mg/dL) | 153.5 (±50.7) | 152.9 (±30.3) | 153.9 (±63.6) | 0.962 |
| SCORE2 (%) | 4.7 (±4.5) | 4.2 (3.8) | 5.1 (5.1) | 0.597 |
| Variable | Whole Study Group (n = 26) | Subgroup with TRE Eating Window > 10 h (n = 11) | Subgroup with TRE Eating Window ≤ 10 h (n = 15) | p-Value between Subgroups with TRE Eating Window of >10 h or ≤10 h |
|---|---|---|---|---|
| Duration of TRE intervention (days) | 81.6 (±12.6) | 80.5 (±17.9) | 82.4 (±7.4) | 0.896 |
| Mean adherence to logging on mCC app during TRE intervention (%) a | 70.0 (±27.0) | 62.0 (±27.6) | 74.2 (±27.4) | 0.152 |
| Adherence to TRE intervention (%) b | 87.0 (±13.2) | 77.3 (±14.2) | 94.2 (±6.2) | 0.003 |
| Parameter | Baseline (Mean (SD)) | Post-TRE Intervention (Mean (SD)) | Change between Baseline and TRE (Mean (SD)) | Change between Baseline and TRE (%) | p-Value between Baseline and TRE |
|---|---|---|---|---|---|
| Eating window | |||||
| Mean daily EW (h) | 14.0 (±1.5) a | 10.1 (±0.8) b | −3.9 (1.7) | −27.9% | 0.0000009 |
| Mean adherence to logging on mCC app (%) | 88.3 (±17.8) a | 70.0 (±27.0) b | −18.3 (27.7) | −20.7% | 0.0002 |
| Body weight and composition | |||||
| Body weight (kg) | 103.0 (±19.4) | 101.3 (±19.1) | −1.7 (3.6) | −1.6% | 0.026 |
| BMI (kg/m2) | 34.5 (±5.1) | 34.0 (±5.1) | −0.5 (1.2) | −1.4% | 0.027 |
| Waist circumference (cm) | 113.8 (±13.2) | 111.3 (±13.5) | −2.5 (3.9) | −2.2% | 0.003 |
| Hip circumference (cm) | 120.2 (±11.1) | 118.1 (±11.2) | −2.1 (3.4) | −1.7% | 0.006 |
| Body fat (%) | 37.1 (±8.8) | 37.3 (±9.3) | +0.2 (2.5) | +0.5% | 1.000 |
| Visceral fat rating | 12.2 (±4.5) | 12.3 (±4.2) | +0.1 (2.2) | +0.8% | 0.861 |
| Muscle mass (kg) | 61.6 (±13.4) | 60.5 (±13.5) | −1.1 (3.7) | −1.8% | 0.211 |
| Cardiovascular parameters | |||||
| Systolic BP (mmHg) | 132.4 (±12.1) | 127.6 (±10.8) | −4.8 (9.0) | −3.6% | 0.012 |
| Diastolic BP (mmHg) | 85.1 (±9.1) | 84.1 (±8.2) | −1.0 (9.8) | −1.2% | 0.620 |
| Heart rate (bpm) | 72.6 (±9.3) | 75.0 (±11.4) | +2.4 (8.7) | +3.3% | 0.540 |
| SCORE2 (%) | 4.7 (±4.5) | 4.2 (3.9) | −0.5 (5.1) | −10.6% | 0.027 |
| Glycemic parameters | |||||
| FPG (mg/dL) | 102.0 (±8.6) | 98.2 (±8.7) | −3.8 (6.9) | −3.7% | 0.037 |
| Glycated hemoglobin (%) | 5.6 (±0.4) | 5.4 (±0.4) | −0.2 (0.4) | −3.6% | 0.011 |
| Mean fasting blood glucose (mg/dL) | 91.6 (±11.3) c | 87.6 (±9.7) d | −4.0 (6.1) | −4.4% | 0.002 |
| Mean 24 h blood glucose (mg/dL) | 96.4 (±9.6) c | 94.6 (±10.8) d | −1.8 (8.8) | −1.9% | 0.313 |
| Lipids | |||||
| TC (mg/dL) | 200.3 (±36.5) | 196.6 (±34.6) | −3.7 (28.4) | −1.8% | 0.654 |
| TG (mg/dL) | 153.5 (±50.7) | 140.8 (±37.0) | −12.7 (44.6) | −8.3% | 0.166 |
| HDL-C (mg/dL) | 53.0 (±14.8) | 52.5 (±15.3) | −0.5 (10.7) | −0.9% | 0.689 |
| Non-HDL-C (mg/dL) | 147.3 (±38.2) | 143.4 (±30.6) | −3.9% (28.2) | −2.6% | 0.601 |
| LDL-C (mg/dL) | 116.7 (±34.3) | 118.2 (±34.2) | +1.5 (26.5) | +1.3% | 0.779 |
| Biochemical parameters | |||||
| Creatinine (mg/dL) | 0.80 (±0.14) | 0.80 (±0.13) | 0.00 (0.08) | 0.0% | 0.443 |
| Uric acid (mg/dL) | 5.9 (±1.2) | 5.9 (±1.2) | 0.0 (0.7) | 0.0% | 0.672 |
| ALT (U/L) | 37.3 (±19.9) | 30.0 (±10.2) | −7.3 (26.2) | −19.6% | 0.386 |
| AST (U/L) | 28.4 (±15.8) | 22.8 (±9.7) | −5.6 (9.4) | −19.7% | 0.034 |
| Hemoglobin (g/dL) | 14.4 (±1.5) | 14.5 (±1.3) | +0.1 (0.6) | +0.7% | 0.647 |
| Hematocrit (%) | 42.8 (±3.8) | 43.1 (±3.5) | +0.3 (10.7) | +0.7% | 0.312 |
| Platelet count (103/ µL) | 287.9 (±66.2) | 285.8 (±61.2) | −2.1 (30.7) | −0.7% | 0.833 |
| Leukocyte count (103/ µL) | 6.7 (±1.9) | 6.4 (±1.8) | −0.2 (1.2) | −3.0% | 0.233 |
| Red blood cell count (mln/µL) | 4.9 (±0.4) | 4.9 (±0.4) | 0.0 (0.2) | 0.0% | 0.771 |
| Sleep and questionnaires | |||||
| Mean sleep duration (h) | 7.6 (±0.7) a | 7.7 (±0.8) b | +0.1 (0.8) | +1.3% | 0.327 |
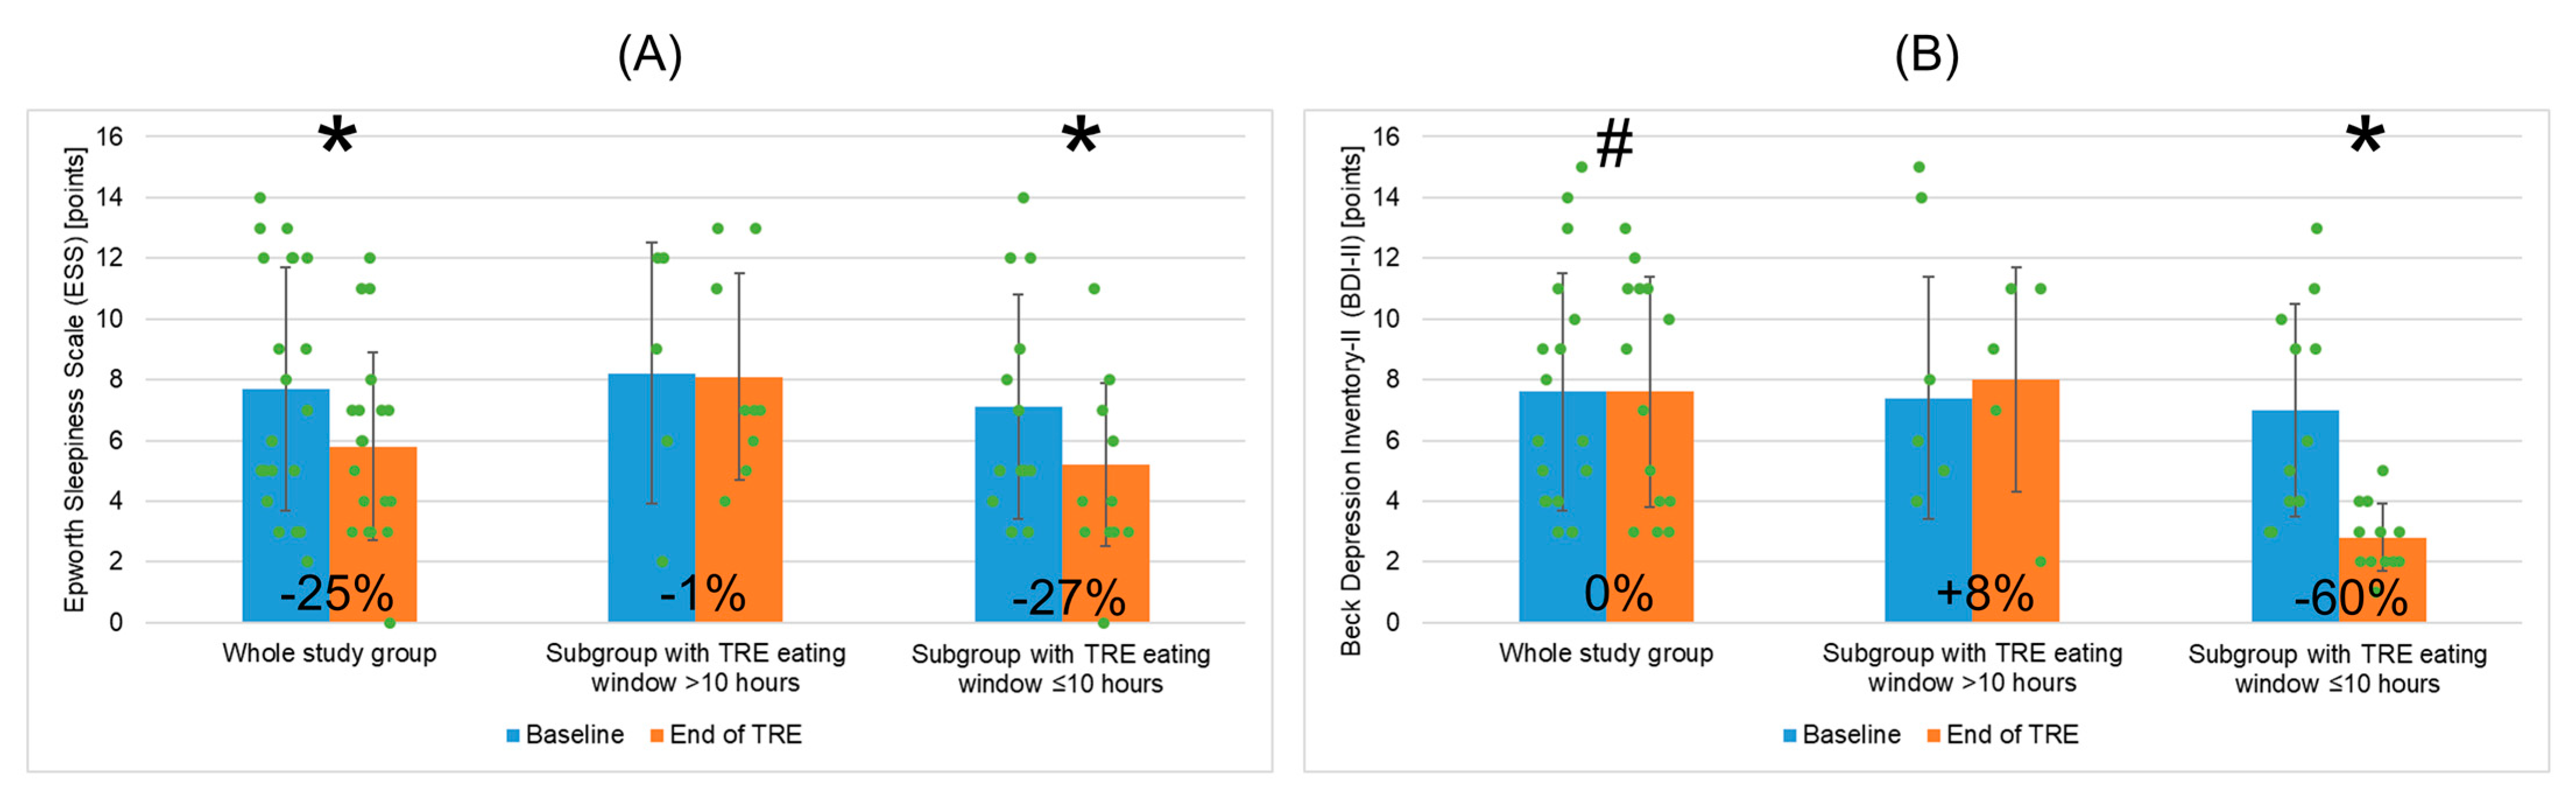
| ESS (points) | 7.7 (±4.0) | 5.8 (±3.1) | −1.9 (3.2) | −24.7% | 0.043 |
| BDI-II (points) | 7.6 (±3.9) | 7.6 (±3.8) | 0.0 (2.6) | 0.0% | 0.075 |
| Dietetic analysis | |||||
| Mean daily caloric intake (cal) | 1764.4 (±463.0) | 1480.1 (±507.8) | −284.3 (395.8) | −16.1% | 0.002 |
| Mean number of eating occasions (n/day) | 6.3 (±1.5) | 5.7 (±1.7) | −0.6 (2.1) | −9.5% | 0.069 |
| Variable | Subgroup with TRE Eating Window >10 h (n = 11) | Subgroup with TRE Eating Window ≤10 h (n = 15) | p-Value between Subgroups | ||||
|---|---|---|---|---|---|---|---|
| Baseline | TRE | p-Value | Baseline | TRE | p-Value | ||
| Eating window | |||||||
| Mean EW (h) | 13.6 (±1.4) a | 10.7 (±0.6) b | 0.00004 | 14.3 (±1.5) a | 9.6 (±0.6) b | 0.0003 | 0.204/0.00002 |
| Mean adherence to logging on mCC app (%) | 83.5 (±21.7) a | 62.0 (±27.6) b | 0.045 | 91.9 (±14.0) a | 74.2 (±27.4) b | 0.003 | 0.140/0.152 |
| Body weight and composition | |||||||
| Body weight (kg) | 103.6 (±19.9) | 103.0 (±21.0) | 0.413 | 102.5 (±19.7) | 100.1 (±18.1) | 0.041 | 0.894/0.705 |
| BMI (kg/m2) | 34.1 (±5.3) | 33.9 (±5.5) | 0.370 | 34.8 (±5.2) | 34.0 (±5.0) | 0.045 | 0.740/0.950 |
| Waist circumference (cm) | 113.8 (±13.1) | 111.6 (±14.3) | 0.072 | 113.9 (±13.7) | 111.1 (±13.4) | 0.023 | 0.993/0.927 |
| Hip circumference (cm) | 119.0 (±12.5) | 117.0 (±12.9) | 0.016 | 121.1 (±10.3) | 119.0 (±10.1) | 0.078 | 0.642/0.667 |
| Body fat (%) | 35.9 (±10.3) | 36.0 (±10.6) | 0.855 | 38.0 (±7.8) | 38.2 (±8.5) | 1.000 | 0.553/0.604 |
| Visceral fat rating | 11.9 (±4.6) | 12.6 (±3.8) | 0.468 | 12.4 (±4.5) | 12.0 (±4.7) | 0.138 | 0.788/0.714 |
| Muscle mass (kg) | 62.9 (±14.6) | 63.3 (±15.3) | 1.000 | 60.6 (±12.9) | 58.4 (±12.2) | 0.149 | 0.640/0.350 |
| Cardiovascular parameters | |||||||
| Systolic BP (mmHg) | 134.7 (±11.0) | 127.4 (±10.0) | 0.017 | 130.7 (±12.9) | 127.7 (±11.7) | 0.239 | 0.408/0.933 |
| Diastolic BP (mmHg) | 83.5 (±7.9) | 83.7 (±9.6) | 0.904 | 86.3 (±10.0) | 84.4 (±7.4) | 0.536 | 0.446/0.841 |
| Heart rate (bpm) | 74.2 (±10.9) | 77.1 (±12.6) | 0.305 | 71.4 (±8.1) | 73.4 (±10.7) | 0.789 | 0.658/0.426 |
| SCORE2 (%) | 4.2 (±3.8) | 3.6 (±3.7) | 0.221 | 5.1 (±5.1) | 4.6 (±4.1) | 0.134 | 0.597/0.475 |
| Glycemic parameters | |||||||
| FPG (mg/dL) | 101.2 (±8.8) | 97.1 (±8.8) | 0.076 | 102.7 (±8.7) | 99.0 (±8.9) | 0.068 | 0.673/0.594 |
| Glycated hemoglobin (%) | 5.7 (±0.5) | 5.5 (±0.4) | 0.090 | 5.6 (±0.4) | 5.3 (±0.4) | 0.061 | 0.723/0.280 |
| Mean fasting blood glucose (CGM) (mg/dL) | 94.4 (±9.3) c | 91.9 (±5.5) d | 0.231 | 89.6 (±12.5) c | 84.4 (±11.0) d | 0.003 | 0.294/0.051 |
| Mean 24 h blood glucose (CGM) (mg/dL) | 100.4 (±7.4) c | 101.5 (±6.8) d | 0.693 | 93.5 (±10.2) c | 89.5 (±10.4) d | 0.066 | 0.070/0.003 |
| Lipids | |||||||
| TC (mg/dL) | 200.2 (±37.3) | 180.1 (±29.8) | 0.032 | 200.4 (±37.2) | 208.6 (±33.8) | 0.253 | 0.989/0.035 |
| TG (mg/dL) | 152.9 (±30.3) | 143.4 (±28.3) | 0.518 | 153.9 (±63.6) | 138.7 (±43.6) | 0.218 | 0.962/0.762 |
| HDL-C (mg/dL) | 52.4 (±7.5) | 51.1 (±10.7) | 0.730 | 53.3 (±18.4) | 53.5 (±18.3) | 0.302 | 0.874/0.755 |
| Non-HDL-C (mg/dL) | 147.8 (±39.5) | 129.8 (±27.7) | 0.079 | 146.9 (±38.6) | 153.3 (±29.5) | 0.345 | 0.953/0.051 |
| LDL-C (mg/dL) | 115.9 (±39.0) | 103.7 (±33.0) | 0.058 | 117.4 (±31.8) | 128.9 (±32.1) | 0.126 | 0.916/0.062 |
| Selected biochemical parameters | |||||||
| ALT (U/L) | 44.5 (±29.0) | 35.3 (±12.9) | 0.617 | 33.7 (±13.8) | 28.4 (±9.3) | 0.077 | 0.851/0.250 |
| AST (U/L) | 32.4 (±22.3) | 25.7 (±14.1) | 1.000 | 25.7 (±9.8) | 20.9 (±4.8) | 0.016 | 1.000/1.000 |
| Sleep and questionnaires | |||||||
| Mean sleep duration (h) | 7.7 (±0.6) a | 8.1 (±0.6) b | 0.164 | 7.5 (±0.7) a | 7.5 (±0.8) b | 0.961 | 0.535/0.053 |
| ESS (points) | 8.2 (±4.3) | 8.1 (±3.4) | 0.935 | 7.1 (±3.7) | 5.2 (±2.7) | 0.041 | 0.583/0.047 |
| BDI-II (points) | 7.4 (±4.0) | 8.0 (±3.7) | 0.450 | 7.0 (±3.5) | 2.8 (±1.1) | 0.023 | 0.842/0.023 |
| Dietetic analysis | |||||||
| Mean daily caloric intake (cal) | 1744.5 (±563.5) | 1352.7 (±446.7) | 0.023 | 1777.1 (±408.5) | 1562.0 (±543.3) | 0.054 | 0.873/0.347 |
| Mean number of eating occasions (n/day) | 5.9 (±1.7) | 6.0 (±2.5) | 0.779 | 6.5 (±1.4) | 5.6 (±1.4) | 0.045 | 0.265/0.598 |
Disclaimer/Publisher’s Note: The statements, opinions and data contained in all publications are solely those of the individual author(s) and contributor(s) and not of MDPI and/or the editor(s). MDPI and/or the editor(s) disclaim responsibility for any injury to people or property resulting from any ideas, methods, instructions or products referred to in the content. |
© 2024 by the authors. Licensee MDPI, Basel, Switzerland. This article is an open access article distributed under the terms and conditions of the Creative Commons Attribution (CC BY) license (https://creativecommons.org/licenses/by/4.0/).
Share and Cite
Świątkiewicz, I.; Nuszkiewicz, J.; Wróblewska, J.; Nartowicz, M.; Sokołowski, K.; Sutkowy, P.; Rajewski, P.; Buczkowski, K.; Chudzińska, M.; Manoogian, E.N.C.; et al. Feasibility and Cardiometabolic Effects of Time-Restricted Eating in Patients with Metabolic Syndrome. Nutrients 2024, 16, 1802. https://doi.org/10.3390/nu16121802
Świątkiewicz I, Nuszkiewicz J, Wróblewska J, Nartowicz M, Sokołowski K, Sutkowy P, Rajewski P, Buczkowski K, Chudzińska M, Manoogian ENC, et al. Feasibility and Cardiometabolic Effects of Time-Restricted Eating in Patients with Metabolic Syndrome. Nutrients. 2024; 16(12):1802. https://doi.org/10.3390/nu16121802
Chicago/Turabian StyleŚwiątkiewicz, Iwona, Jarosław Nuszkiewicz, Joanna Wróblewska, Małgorzata Nartowicz, Kamil Sokołowski, Paweł Sutkowy, Paweł Rajewski, Krzysztof Buczkowski, Małgorzata Chudzińska, Emily N. C. Manoogian, and et al. 2024. "Feasibility and Cardiometabolic Effects of Time-Restricted Eating in Patients with Metabolic Syndrome" Nutrients 16, no. 12: 1802. https://doi.org/10.3390/nu16121802
APA StyleŚwiątkiewicz, I., Nuszkiewicz, J., Wróblewska, J., Nartowicz, M., Sokołowski, K., Sutkowy, P., Rajewski, P., Buczkowski, K., Chudzińska, M., Manoogian, E. N. C., Taub, P. R., & Woźniak, A. (2024). Feasibility and Cardiometabolic Effects of Time-Restricted Eating in Patients with Metabolic Syndrome. Nutrients, 16(12), 1802. https://doi.org/10.3390/nu16121802