Article

Maternal Body Mass Index Associates with Prenatal Characteristics and Fecal Microbial Communities

by
Nikita H. Nel
1,
Eliot N. Haddad
1,
Jean M. Kerver
2,3,
Andrea E. Cassidy-Bushrow
3,4 and
Sarah S. Comstock
1,*
1
Department of Food Science and Human Nutrition, Michigan State University, East Lansing, MI 48824, USA
2
Department of Epidemiology and Biostatistics, Michigan State University, East Lansing, MI 48824, USA
3
Department of Pediatrics and Human Development, College of Human Medicine, Michigan State University, East Lansing, MI 48824, USA
4
Department of Public Health Sciences, Henry Ford Health, Detroit, MI 48202, USA
*
Author to whom correspondence should be addressed.
Nutrients 2024, 16(12), 1881; https://doi.org/10.3390/nu16121881
Submission received: 15 May 2024 / Revised: 5 June 2024 / Accepted: 8 June 2024 / Published: 14 June 2024
(This article belongs to the Section Nutrition and Obesity)

Abstract

:
The maternal microbiome plays a vital role in shaping pregnancy outcomes, but there remains a substantial gap in understanding its precise relationships to maternal health, particularly in relation to potential effects of body mass index (BMI) on gut microbial diversity. The aim of this observational study was to assess maternal characteristics in association with pre-pregnancy BMI and to further assess microbial diversity in association with specific maternal characteristics. Eighty-four pregnant women were recruited during their third trimester of pregnancy from various prenatal clinics across the state of Michigan. The participants completed an enrollment questionnaire including self-reported pre-pregnancy BMI; stool samples were collected to assess the fecal microbial community composition. Pre-pregnancy obesity (BMI 30+) was associated (univariably) with antibiotic use before pregnancy, ever smoked, lower education level, and being unmarried. The gut microbiota alpha diversity was significantly different for pregnant women by pre-pregnancy BMI category (normal, overweight, obese). The beta diversity was unique for the gut microbiotas of pregnant women within each BMI category, by education level, and by marital status. Multivariable models revealed that pre-pregnancy BMI, maternal education, marital status, and maternal age were associated with the microbial diversity of the gut microbiota during pregnancy. These results give new insight into the relationship between a woman’s microbiome during pregnancy and their prenatal health, along with an understanding of the relationships between socioeconomic factors and microbial diversity.

Graphical Abstract

1. Introduction

The maternal microbiome has become an increasingly important measure of maternal health and infant health outcomes. As the number of women with pre-pregnancy obesity has risen to almost a third (29%) of the United States’ population, it has become vital for healthcare providers to understand the mechanisms and effects pre-pregnancy obesity has on pregnancy and infant health [1]. The gut microbiota is responsible for digesting carbohydrates and other dietary components to produce vitamins, peptides, and short-chain fatty acids—factors essential for healthy fetal development [2,3]. The gut microbiome plays a critical role during pregnancy to help regulate a woman’s metabolism and immune system [4]. During birth, the infant gut microbiome undergoes bacterial colonization, which is shaped by the mother’s microbiome [5]. Thus, the direct vertical transfer of microbes from mother to infant has been identified as a potentially important factor in determining the health of the infant [6].
A growing body of evidence supports the hypothesis that a mother’s pre-pregnancy BMI and nutrition impacts the epigenetic profile of their offspring. Epigenetics characterizes the changes in gene expression and activity through DNA histone modifications such as methylation and acetylation [7]. During fetal development, maternal nutritional exposures play a vital role in establishing an infant’s epigenetic profile and future phenotypic changes, which impact their risk of disease [8]. The previous literature has identified numerous correlations between maternal pre-pregnancy BMI and methylation in newborn blood DNA [9]. While the mechanisms behind these associations are not well understood, some postulate that low levels of protein and fiber can alter one-carbon metabolism [10,11,12]. One-carbon metabolism involves various pathways that contribute to epigenetic expression such as the folate cycle and methionine cycle [13]. Through measuring changes in the gut microbiota, we may be able to further elucidate the complex interactions between maternal pre-pregnancy BMI and neonatal development.
Specifically, regarding prenatal BMI, there is contradictory evidence regarding its association with the gut microbiota during the latter third of pregnancy. Some studies have observed that gut bacterial diversity differs according to a person’s BMI status during this time in pregnancy [14,15,16]. For example, there is evidence that the gut microbiotas of women with obesity tend to have lower alpha diversity and higher levels of specific taxa like Prevotella [17]. Additionally, the ratio of gut Firmicutes to Bacteroidetes has been associated with BMI during pregnancy. Some studies have shown that the abundance of Firmicutes increases while the abundance of Bacteroidetes decreases in the gut with increasing BMI [18,19]. In contrast, other studies have observed that the pregnancy microbiota is similar regardless of BMI category [20]. While evidence suggests some connection between the pregnancy gut microbiome and BMI, more research is needed to understand (1) whether specific microbes have a direct association with BMI or other pre-pregnancy/pregnancy characteristics [14,16] as well as (2) the relationship between BMI and other pre-pregnancy/pregnancy characteristics.
The rise in the prevalence of obesity has been paralleled by an increase in neurodevelopmental and psychiatric disorders across the lifespan [21]. Many hypothesize that understanding microbial changes and detailing the nuanced microbial and molecular pathways in the gut–brain axis can reveal not only the underlying biological mechanisms behind these disorders but also potential targets for prevention and/or therapy [22,23]. The gut–brain axis is a bidirectional communication system that links the gastrointestinal tract and the central nervous system. This axis is regulated by neuronal, hormonal, and immunological signals [24]. Obesity is one of the many lifestyle factors that may mediate signaling within the gut–brain axis [23]. Children of women with obesity may have an increased risk of developing an intellectual disability or attention deficit hyperactivity disorder (ADHD) [25,26]. Research suggests that obesity increases the oxidative stress levels in the placenta while reducing blood flow, which can lead to restricted nutrient transfer to the developing fetus [27,28]. The detection of these important associations of obesity prior to and/or during pregnancy with child development have placed increased urgency on the need to understand the exposures that can alter the gut–brain axis and potentially prevent or treat such negative neurological health outcomes.
Using fecal samples and questionnaires collected from pregnant women during their third trimester of pregnancy, we aimed to address two main objectives. The first was to understand whether specific prenatal characteristics are associated with pre-pregnancy BMI. The second was to determine whether microbial diversity is associated with maternal pre-pregnancy BMI or other prenatal/pregnancy characteristics. Characterizing the pre-pregnancy/prenatal characteristics directly associated with the gut microbiome may help dietitians and clinicians identify risk factors, which could be targeted to ensure positive perinatal outcomes as well as positive health outcomes for infants.

2. Materials and Methods

2.1. Study Participants

The participants were recruited from the Michigan Archive for Research on Child Health (MARCH) prospective pregnancy cohort [29,30]. The MARCH study enrolled pregnant women from 21 prenatal clinics serving 11 birthing hospitals in the lower peninsula of the state of Michigan. The survey data and biological specimens were collected from pregnant women and their infants. The MARCH cohort is part of a nationwide collaboration, the Environmental Influences on Child Health Outcomes (ECHO) [31], and participating MARCH families are currently being followed for longitudinal data collection. The analysis described herein included a subset of pregnant women from the MARCH cohort who gave written informed consent for providing fecal samples and health survey/medical record data (n = 84). This study was approved by the human subjects’ research protection program at Michigan State University.

2.2. Data Collection

An enrollment questionnaire was administered to the pregnant women at their first prenatal study visit. The questionnaire captured each participant’s demographic information, pre-pregnancy health status, and health-related background information including medication usage, smoking status, etc.
Participants collected their own fecal sample using a fecal sample collection kit provided to them, for which the protocol has been previously described [14,32]. Briefly, collection kits were mailed to participants and included instructions for collecting a fecal sample, a Para Pak tube (Meridian Bioscience Inc., Cincinnati, OH, USA) for collection, and return postage for participants to return the sample. The samples were mailed, and upon sample arrival at the lab, they were aliquotted and stored at −80 °C.

2.3. Maternal Pre-Pregnancy Body Mass Index Classification

The participants pre-pregnancy BMI (kg/m2) was calculated using self-reported height and weight values. The participants were then classified into the BMI categories, normal (17 ≤ BMI < 25), overweight (25 ≤ BMI < 30), and obese (BMI ≥ 30) based on the Centers for Disease Control and Prevention BMI categories [33]. All of the participants had a BMI greater than 17, so the BMI category of underweight was excluded from our analysis.

2.4. DNA Extraction and Amplification

The protocol as described in Sugino et al., 2019 [14] was followed for DNA extraction and amplification of the V4 region of the 16S rRNA gene and sequencing. Following the mothur wet lab documentation, barcoded primers were used to amplify the V4 region of the 16S rRNA gene by PCR [34]. The successfully amplified triplicates were pooled and purified using Agencourt AMPure XP beads (Beckman Coulter, Brea, CA, USA). The Michigan State University Research Technology Support Facility Genomics Core sequenced the 16S rRNA libraries using paired-end, 250 base-pair sequencing on an Illumina MiSeq instrument using V2 chemistry (Illumina, San Diego, CA, USA).
The sequence reads were processed in mothur, on the high-performance computing cluster at Michigan State University, using the Illumina MiSeq SOP [34]. The sample reads were rarefied to 15,000 sequencing reads per sample and adequate community coverage was confirmed using rarefaction curves. Operational taxonomic unit (OTU) taxonomies were assigned by phylotype in mothur using the SILVA reference taxonomy (release V132) [35].

2.5. Statistical Analysis

The participant’s pre-pregnancy characteristics were compared between BMI groups using a Pearson’s chi-squared test of independence. Specific differences between each BMI group were identified using a pairwise test of independence for nominal data. Gut microbial diversity (alpha and beta) indices were calculated using the vegan package [36] in R version 4.3.0 [37].
The alpha diversity measures the bacterial diversity within a single community or organism. Herein, the alpha diversity is reported for three alpha diversity indices, Chao1, Shannon, and inverse Simpson. A Shapiro–Wilk test was performed to determine the normality of the data. Then alpha diversity differences between groups were tested. A Wilcoxon rank test was used to assess differences in the alpha diversity by antibiotic exposure, medication usage, mom age group, smoking status, college graduation status, allergen diagnosis, marital status, and car/home ownership. A Kruskal–Wallis test was used to test differences in the alpha diversity by pre-pregnancy BMI status and racial demographic groups. Post hoc comparisons for the Chao1 and Shannon indices were performed using a Dunn’s test for multiple comparisons. An ANOVA or t-test was performed for inverse Simpson index comparisons between groups. Tukey’s honest significant difference test was used for a post hoc comparison for the inverse Simpson index between pre-pregnancy BMI categories.
The beta diversity measures the bacterial diversity across two or more groups. Two beta diversity metrics were calculated: Sorensen and Bray–Curtis. The Beta diversity was visualized using a principal coordinate analysis plot (PCoA) in R [37] using the vegan package [36]. Permutational multivariate analysis of variance (PERMANOVA) and permutation of dispersion (PERMDISP) were performed for both Sorensen and Bray–Curtis to test for differences in the beta diversity. A negative binomial model in the MASS package [38] was used to compare the relative abundance of individual taxa with a >1% relative average abundance between BMI categories as well as by other prenatal characteristics.
In multivariable analysis, selected prenatal characteristics were added to a multiple linear model (function lm and ANOVA in R version 4.2.0). The alpha diversity models were analyzed using a type II ANOVA. The beta diversity models were analyzed using PERMANOVA (adonis2 function in the vegan package). The results were considered significant when the p-value was at or below the alpha level of 0.05.

3. Results

3.1. Participant Characteristics

We collected questionnaire responses from 84 women and compared pre-pregnancy characteristics by the BMI category of the participants (Table 1). The majority of participants n = 74 (88.1%) identified as white and n = 58 (69.9%) had a bachelor’s degree or higher. According to pre-pregnancy BMI, there were 44 women (52.3%) with a normal BMI, 17 women (20.2%) with an overweight BMI, and 23 (27.4%) women with an obese BMI. The maternal age was recorded for 81 participants and was similar across BMI categories with an overall average age of 31.5 years. The maternal age ranged from 20 to 52 years, with 41 participants having a maternal age ≤ 31 years and 40 with a maternal age >31 years. Thus, 31 years was set as a cutoff. Women with either overweight or obesity pre-pregnancy were significantly more likely to have used antibiotics before their pregnancy (p = 0.001). Women with obesity were significantly more likely to have ever smoked cigarettes (p = 0.006) and to be unmarried (p = 0.004) and were significantly less likely to be a college graduate (p = 0.024) or own stocks or bonds (p = 0.048).

3.2. Alpha Diversity
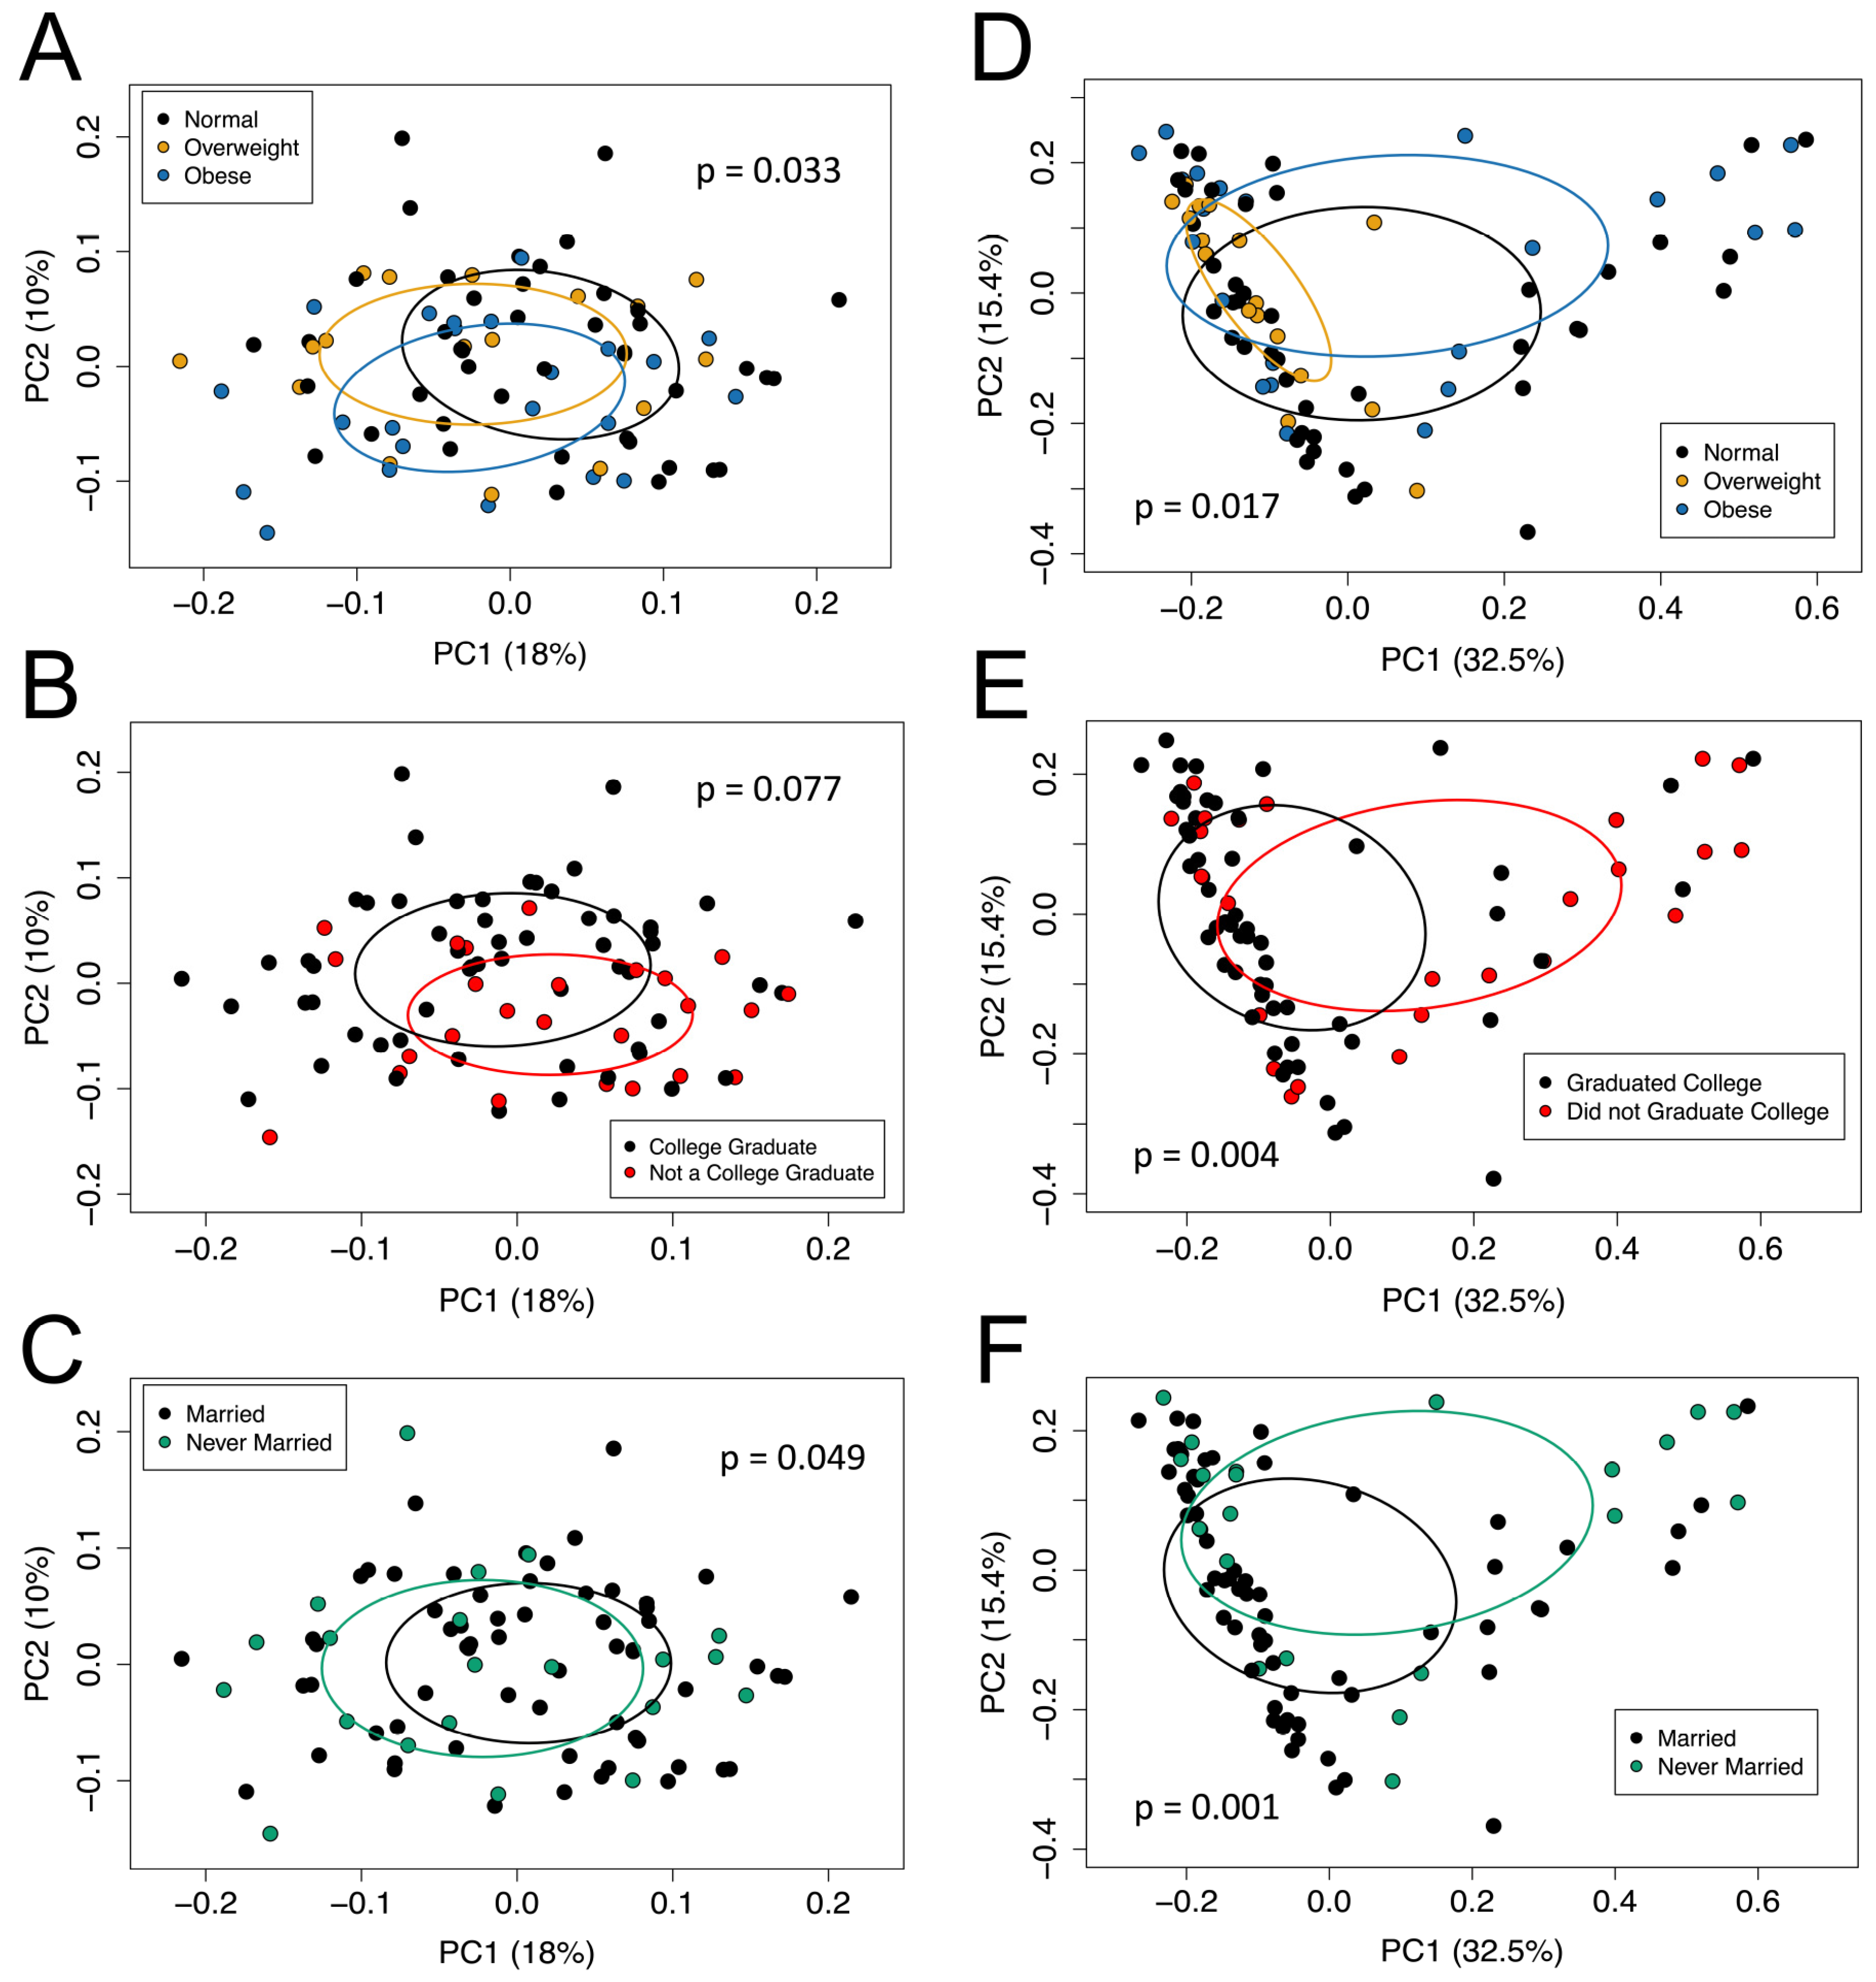
The third-trimester fecal alpha diversity significantly differed by pre-pregnancy BMI, maternal age, education level, marital status, and ownership of bonds status. Women with obesity prior to becoming pregnant had fecal microbial communities that were significantly more even (inverse Simpson) and had a lower diversity (Shannon) than those who had a normal or overweight BMI (Table 2). The participants had significantly less even (inverse Simpson) and more diverse (Shannon) fecal microbial communities at the genus level if they were over 31 years of age, a college graduate, married, and owned bonds (Table 2). The richness (Chao1) of the maternal fecal microbial community was similar regardless of the prenatal characteristic considered (Table 2). The other Table 1 characteristics were not associated with any alpha diversity metrics of the pregnancy gut microbiota.

3.3. Beta Diversity

The pregnancy microbial community composition (Sorensen) was significantly different at the genus level when the participant’s fecal microbial communities were categorized by pre-pregnancy BMI (Figure 1A), education level (Figure 1B), or marital status (Figure 1C). Similarly, the pregnancy microbial community structure (Bray–Curtis) was significantly different at the genus level when the participant’s fecal microbial communities were categorized by pre-pregnancy BMI (Figure 1D), education level (Figure 1E), or marital status (Figure 1F). Additionally, the PERMDISP was significant for the Bray–Curtis dissimilarity matrix according to pre-pregnancy BMI (p < 0.05). The PERMDISP was significant (p < 0.05) in the Sorensen index and Bray–Curtis index for both education level and marital status.

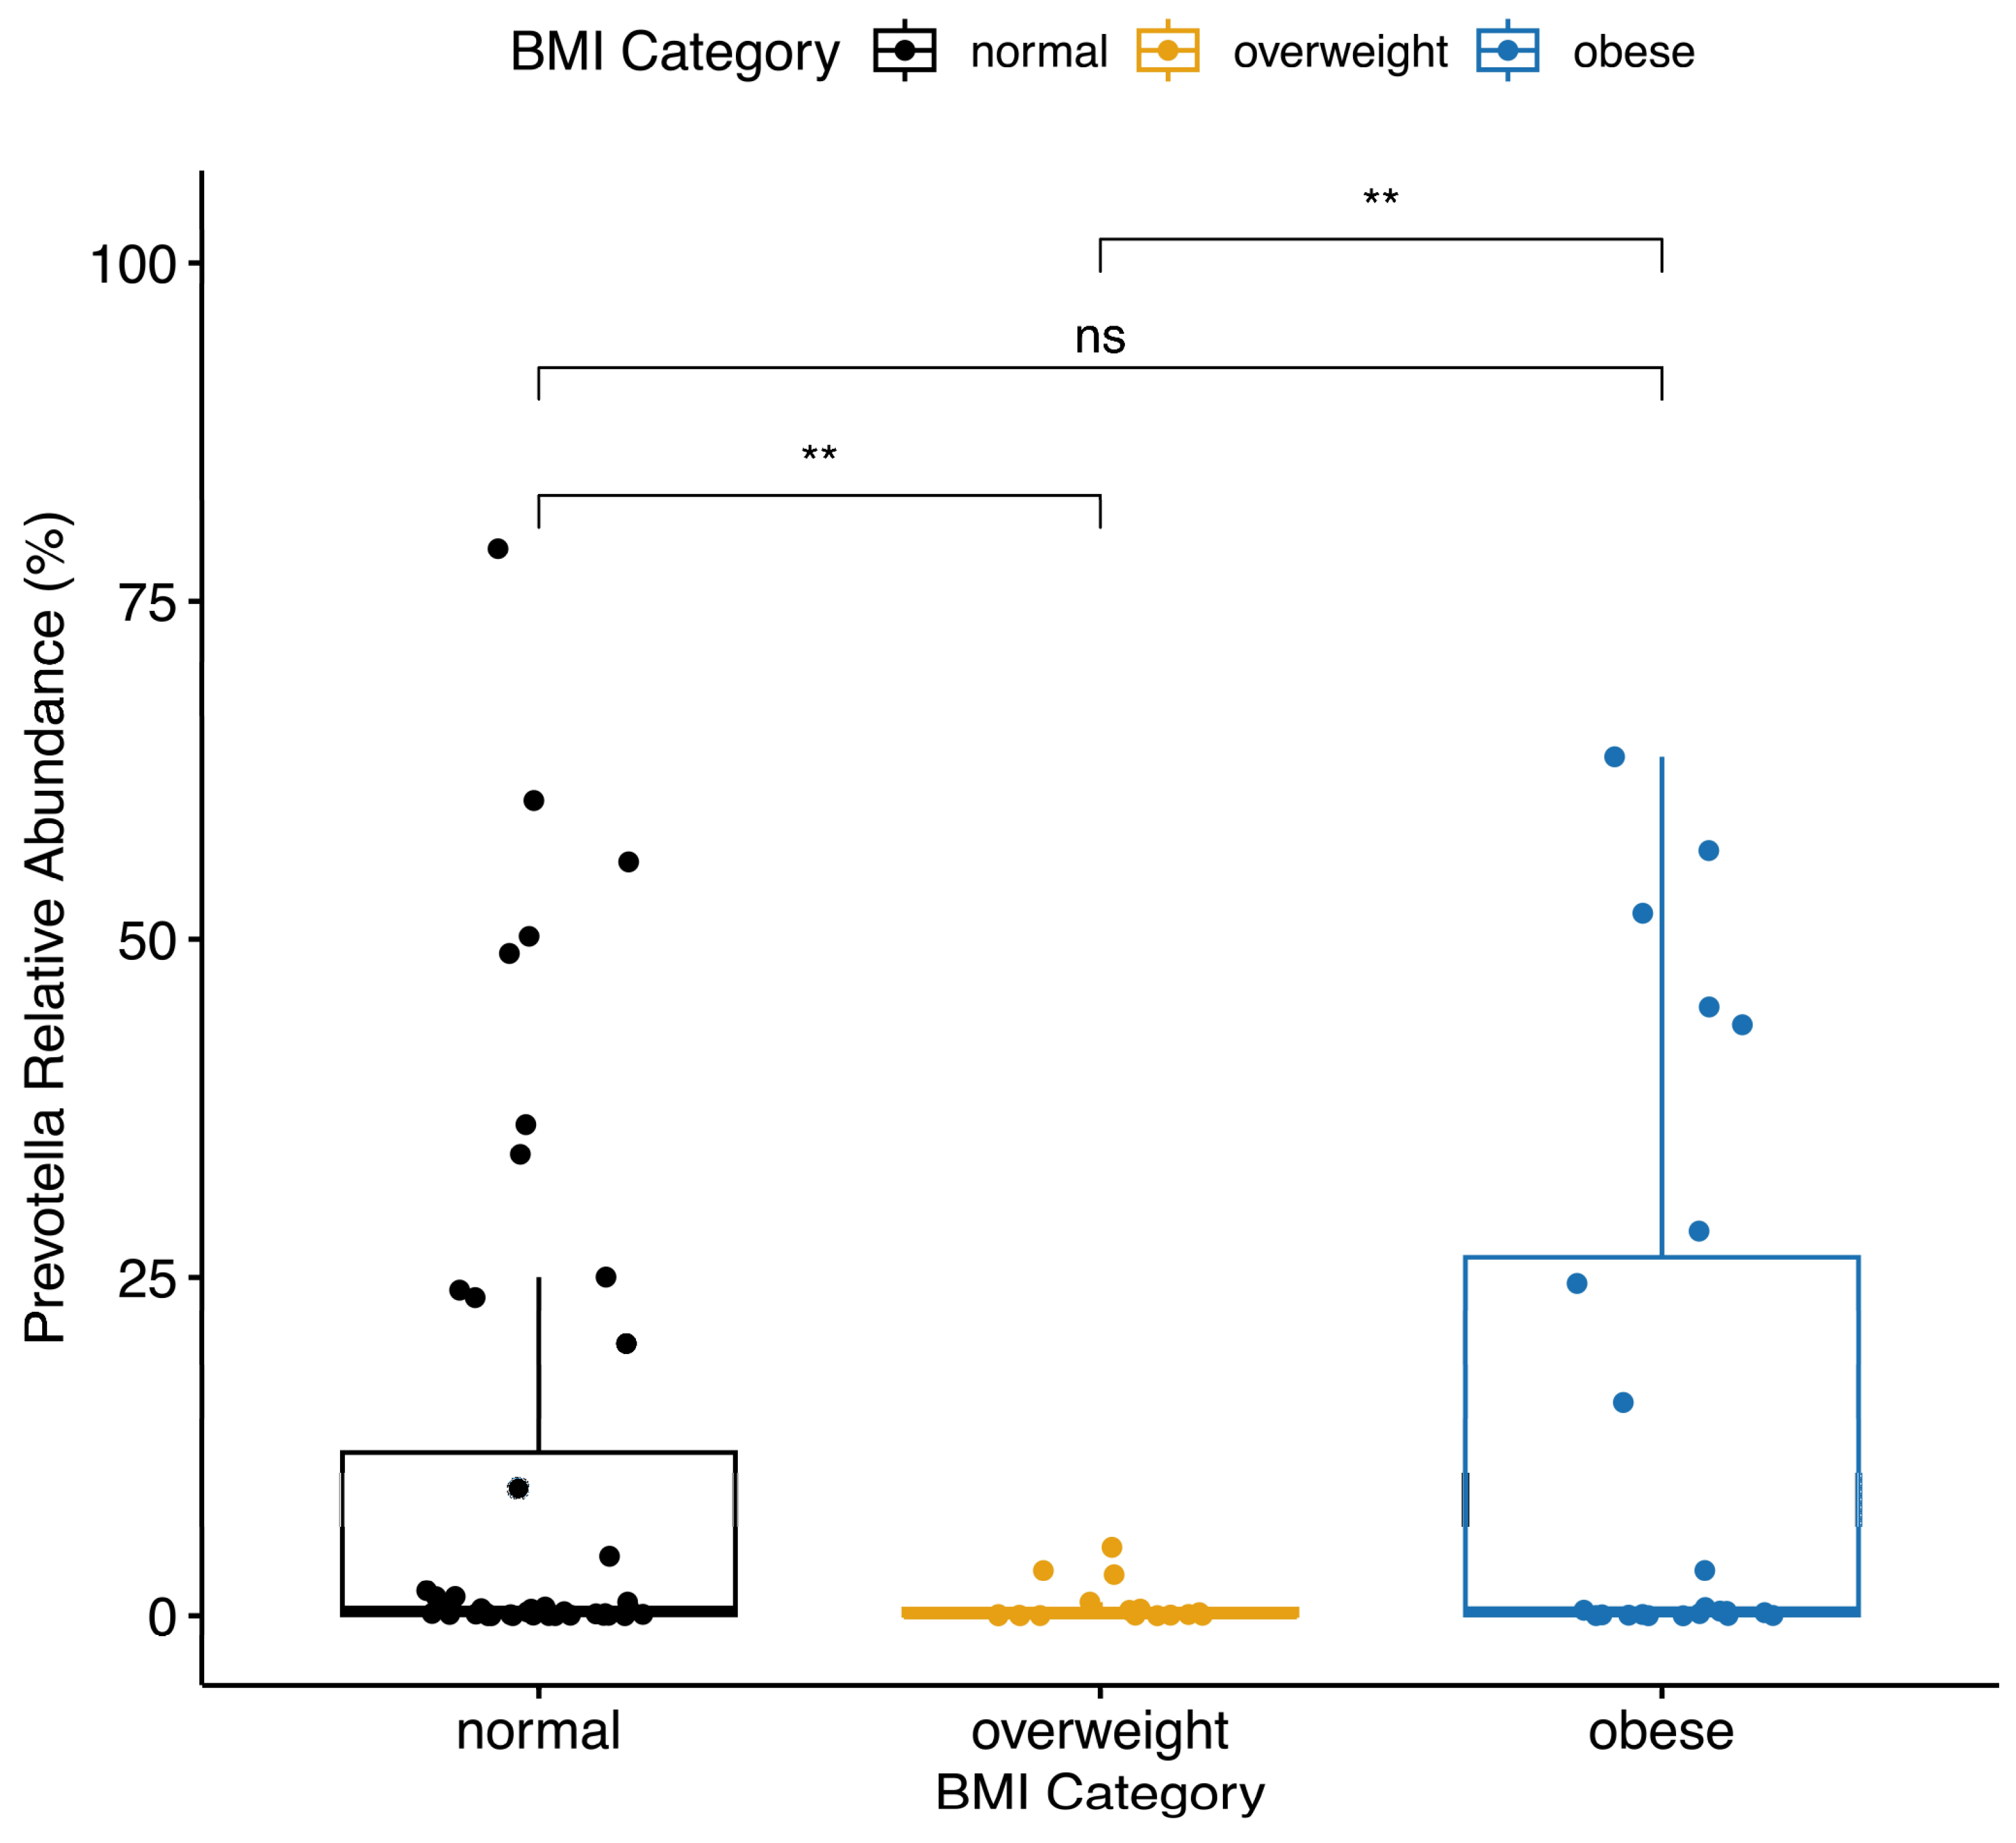
3.4. Differences in Bacterial Taxa

The maternal pre-pregnancy BMI category was associated with the relative abundance of Prevotella. Women who were overweight prior to their pregnancy had a significantly lower (p < 0.01) mean relative abundance of Prevotella (mean ± SD, 0.8% ± 1.5%) compared to women with normal weight (mean ± SD, 11% ± 20.1%) or women with obesity (mean ± SD, 14.6% ± 22%) (Figure 2). There was no significant difference in the Firmicutes-to-Bacteroidetes ratio by pre-pregnancy BMI category or any other pre-pregnancy characteristics tested. Smoking status and asthma diagnosis were related to the relative abundance of Blautia. Those who ever smoked had a significantly higher (p < 0.01) mean relative abundance of Blautia (mean ± SD, 2.9% ± 4.3%) compared to non-smokers (mean ± SD, 1.2% ± 1%). Similarly, those with asthma had significantly higher (p < 0.01) levels of Blautia (mean ± SD, 2.3% ± 3.5%) than those who did not have asthma (mean ± SD, 1.2% ± 1%). Marital status was significantly associated with Lachnospiraceae. Those who were married had a significantly higher (p < 0.05) relative abundance of Lachnospiraceae (mean ± SD, 8.2% ± 4%) compared to those who were unmarried (mean ± SD, 5.2% ± 3.5%).

3.5. Multivariable Analysis

A multivariable analysis was performed to determine which prenatal characteristics were associated with microbial diversity. Our multivariable model accounted for pre-pregnancy BMI category, antibiotic use, smoking status, marital status, college graduation status, and maternal age.

3.5.1. Alpha Diversity

We assessed whether there was a difference in the results of our alpha diversity measures, Chao, Shannon, and inverse Simpson if a multivariable model was used (Table 3). For Chao, similar results were observed for both the univariable and multivariable models. The pre-pregnancy BMI category was strongly associated with the alpha diversity in both univariable and multivariable models for the Chao1 index. For Shannon, the pre-pregnancy BMI was significant in the univariable model, but only the maternal age remained significant in the multivariable model. With inverse Simpson, the pre-pregnancy BMI was associated in the univariable model, and only the maternal age was significant in the multivariable model.

3.5.2. Beta Diversity

The univariable beta diversity results were compared to those of the multivariable models to assess the influence of covariables for both Sorensen and Bray–Curtis PERMANOVA (Table 4). Any variables that demonstrated an association with univariable beta diversity were included in the multivariable analysis for beta diversity. While the overall Sorensen multivariable model was significant (p < 0.05), no single factor was significant, but the BMI category contributed the most variance (r2 = 0.03), in the multivariable model. The overall Bray–Curtis multivariable model was significant (p < 0.01), and college graduation contributed the most variance (r2 = 0.04) in the model.

4. Discussion

In this study, we establish that pre-pregnancy BMI is associated with various prenatal characteristics and with third-trimester fecal microbial diversity. Women with an obese BMI were significantly more likely to have ever used antibiotics, have ever smoked, be unmarried, not graduated from college, and not own bonds. Women with obesity also had significantly lower alpha diversity, while women with overweight had significantly different bacterial taxa in their microbiomes. The main contributor to the differences in community structure, measured by the beta diversity, was the relative abundance of Prevotella, as women who were overweight had a significantly lower percentage. After controlling for any prenatal characteristics that were significantly different within our population, pre-pregnancy BMI remained associated with third-trimester microbial alpha and beta diversity.
Specific prenatal characteristics are associated with the maternal pre-pregnancy BMI, including antibiotic use, smoking status, marital status, education level, and bond ownership status. Antibiotic use has previously been linked to the prevalence of obesity in both human and animal trials [39,40,41]. Our study found that women who were overweight or obese were significantly more likely to use antibiotics before their pregnancy. This coincides with previous research, which has provided evidence that using antibiotics alters the gut microbiome and may decrease the number of bacteria that are known to protect against obesity [42,43]. Antibiotics disrupt the normal function of the gut microbiome, causing dysbiosis, altering nutrient and vitamin intake [44]. Similarly, we found that women with obesity in our study population were significantly more likely to have ever smoked. However, there is conflicting evidence on the associations between BMI and smoking status. Some studies have found that obese adults are significantly more likely to also be smokers [45], while others have found that smoking may be associated with a lower BMI [46]. Women with obesity in our study were more likely to be unmarried; a previous study in the United States of America found that married women were 21% less likely to be obese [47]. More research needs to be conducted to understand the mechanisms behind BMI and its relation to both smoking status and marital status. Furthermore, the overall evidence points to education level having an inverse relationship to BMI [48]. One study found that, for each additional year of education a person receives, their likelihood of obesity decreases between 2 and 9% [47]. However, some findings suggest that ethnicity plays a role in determining how one’s socioeconomic status is related to obesity [49]. It has been shown that the relationship between socioeconomic status and obesity is much more apparent in white populations compared to ethnic minorities [49]. These connections may help explain our results, as the majority of the study population was white (88.1%), and women with obesity in our study were significantly less likely to be a college graduate. Lastly, our results suggest that women with obesity are significantly less likely to be bond owners. One study also found that bond ownership is associated with a normal BMI [50], but there are limited findings in this area of study. Overall, the relationship between obesity and specific prenatal characteristics is complex.
The maternal pre-pregnancy BMI was significantly associated with both the alpha and the beta diversity of the microbiota of pregnant women during their third trimester of pregnancy. While there was no difference in the richness (Chao) of the fecal microbial communities between different BMI groups, women with obesity did have different levels of evenness (inverse Simpson, more emphasis on dominant taxa) and diversity levels (Shannon, accounts for rare taxa). Findings on the associations between the gut microbiota and maternal pre-pregnancy BMI are inconsistent. Some studies have found little to no association between the two [51,52], while others have established clear microbial differences between BMI categories, aligning with our results [14,53,54]. Additionally, associations between the gut microbiota alpha diversity and the pregnancy BMI are mixed. A prior meta-analysis observed that of seven studies that analyzed the Chao1 index of obese versus non-obese individuals, three studies reported lower richness levels while the other four found higher richness or no association [17]. Our results indicate that our study population of women with obesity is one subset that has normal richness compared to other BMI groups. In studies that have previously amplified the V3-V4 region, half (six of twelve) observed a lower Shannon index in obese versus non-obese individuals [17]. The association between low alpha diversity and obesity is most strongly observed in non-Hispanic white populations [55], like our cohort. Other research suggests that this difference in microbial diversity levels may be explained by dietary components, like fiber, meat, and fat intake. Individuals who consume large amounts of high-fat red meat have been shown to have a low alpha diversity and the highest BMI levels [55]. Maternal age is another variable that was significantly associated with evenness (inverse Simpson, abundant taxa) and diversity levels (Shannon, rare taxa) in our alpha diversity analysis. The relationship between maternal age and gut microbial diversity is not well characterized, but some studies suggest that the alpha diversity is higher in the gut microbiomes of young adults [56]. Our alpha diversity results support the idea that increased maternal age is associated with a greater evenness (inverse Simpson) and lower diversity levels (Shannon). Women with obesity in our study also had significantly different microbial community composition (Sorensen index) and structure (Bray–Curtis) compared to normal and overweight women.
When investigating specific bacterial taxa differences, women with overweight were the only maternal pre-pregnancy BMI category that had a difference in the relative abundance of bacteria, specifically Prevotella. Previous evidence has linked Prevotella abundance to high fiber intake, smoking, as well as lower alpha diversity [57,58]. These results indicate that the microbial differences of the women with obesity in our study may be due to factors such as genetics, lifestyle, or diet. Our analysis also measured the Firmicutes-to-Bacteroidetes ratio, which has been considered a hallmark indicator of obesity [59]. However, the Firmicutes-to-Bacteroidetes ratio has come to be considered highly variable and has not been scientifically correlated to any specific metabolic process or mechanism [60]. There was no difference in the Firmicutes-to-Bacteroidetes ratio among women in the three pre-pregnancy BMI categories tested in our study, which indicates that this measure is not an effective indicator of obesity for our study population.
Smoking status, asthma diagnosis, and marital status were associated with the abundance of several bacterial taxa in our study. A participant’s smoking status and asthma diagnosis was associated with their relative abundance of Blautia, with smokers and asthmatics having higher relative abundances. There are discrepancies in the findings regarding Blautia levels for individuals with obesity, with evidence of higher levels of Blautia in both obese individuals [53,61] and non-obese individuals [62]. Blautia is one of the most abundant genera in the gut, regardless of race [63], but it is less prominent in diabetic adults and in those with other diseases [62]. Further evidence suggests that high-protein and low-carbohydrate diets or diets mainly composed of animal products can decrease an individual’s number of Blautia species [64,65]. Our data also show that Lachnospiraceae was a bacterial taxon that was significantly more abundant in married women in our cohort. Members of the Lachnospiraceae family have been associated with both type 2 diabetes and obesity [66]. Though, the married women in our cohort were less likely to have obesity. Further investigation into the health history of the participants is required to assess whether the differences in bacterial taxa can be attributed to their prenatal characteristics or other health factors.
There were some limitations within our study that may have impacted the validity of our findings. One limitation was that the height and weight were self-reported. Self-reported pre-pregnancy height and weight have been found to be accurate in past female populations [67], but, in more recent studies, women with obesity have been found to be slightly more likely to overreport height and underreport weight [68]. Due to a small sample size and a limited number of non-white participants, the generalizability of our findings is limited for larger populations. The composition and functionality of the gut microbiome varies greatly between non-Hispanic whites and racial minority groups [69,70]. The inclusion of more participants from additional racial groups would provide a more representative dataset and allow for better generalizability. Furthermore, as an observational study, we are unable to assess the long-term impacts and changes of the gut microbiome both before and after pregnancy. A longitudinal study with a large sample size, such as the NIH Environmental Child Health Outcomes cohort, would allow us to determine whether our results were heavily influenced by short-term factors, like diet or exercise levels, compared to long-term factors, like BMI or medical history [71,72]. Future studies should also assess whether the microbial composition at the phylum level is associated with the pre-pregnancy BMI.
Additionally, dietary intake, physical activity, and health history data were not included in this analysis of the participants in our cohort. Differences in diet, exercise levels, and medical history have been shown to play a key role in shaping the human gut microbiome and epigenetic profiles [10,51,73,74,75]. Pregnant women with a preference for a “Western” diet, including large amounts of red meat, processed food, and alcohol, have previously been associated with higher pre-pregnancy BMI and excessive gestational weight gain [76,77]. More specifically, maternal nutrition plays a vital role in providing key nutrients, such as folate, methionine, and choline, which are required for one-carbon DNA methylation [13]. A maternal high-fat diet during pregnancy has been shown to lead to gut dysbiosis and increased exposure to pro-inflammatory markers involved in epigenetic aging [10,78]. Recent clinical trials have found that probiotic supplementation in pregnant women can lead to significantly decreased levels of DNA methylation in genes associated with obesity in both mothers and their infants [79]. While our study did not record nutritional trends, future studies should aim to investigate how the maternal gut–brain axis affects infant microbiota colonization and subsequent epigenetic aging.

5. Conclusions

This study reports associations between maternal pre-pregnancy BMI and prenatal characteristics as well as the gut microbiome. Prenatal characteristics, such as having ever smoked, marital status, antibiotic use, education level, and bond ownership, were associated with the BMI. Both the alpha and the beta diversity of the pregnancy gut microbiota were significantly different between BMI categories and across various other prenatal characteristics. Specific taxa, including Prevotella, were associated with the BMI, while Blautia and Lachnospiraceae were associated with various other prenatal characteristics. We hypothesize that differences in specific bacterial taxa may be explained by genetic, environmental, dietary, or lifestyle factors, but more health history is required to assess the validity of this hypothesis. Understanding the connections between prenatal characteristics, BMI, and the maternal microbiome, provides insight into how specific bacteria or diversity in the gut microbiome might be used as indicators of health risks or pregnancy outcomes.

Author Contributions

Conceptualization, N.H.N., E.N.H., J.M.K., A.E.C.-B. and S.S.C.; methodology, N.H.N., E.N.H. and S.S.C.; formal analysis, N.H.N. and E.N.H.; investigation, N.H.N. and E.N.H.; resources, J.M.K., A.E.C.-B. and S.S.C.; data curation, N.H.N. and E.N.H.; writing—original draft preparation, N.H.N.; writing—review and editing, N.H.N., E.N.H., J.M.K., A.E.C.-B. and S.S.C.; visualization, N.H.N.; supervision, S.S.C.; project administration, S.S.C.; funding acquisition, J.M.K., A.E.C.-B. and S.S.C. All authors have read and agreed to the published version of the manuscript.

Funding

This research was funded in part by the National Institute of Diabetes and Digestive and Kidney Diseases (NIDDK) grant number R01 DK135054 as well as the Office of the Director at the National Institutes of Health under award numbers UG3OD023285 and UH3OD023285, the Michigan Health Endowment Fund under award numbers G-1608-140432 and R-1605-140007 and from Michigan State University Center for Research in Autism, Intellectual, and Neurodevelopmental Disabilities (C-RAIND). This research also was supported in part by a CHARM (Child Health Advances from Research with Mothers) small grant funded by the Vice Presidents for Research of Michigan State University, University of Michigan, and Wayne State University.

Institutional Review Board Statement

This study was conducted in accordance with the Declaration of Helsinki and approved by the Institutional Review Board of Michigan State University under approval code 16-1429 on 26 May 2017 and 17-1352 on 30 October 2017.

Informed Consent Statement

Written, informed consent was obtained from all subjects involved in this study.

Data Availability Statement

The data presented in this study are available on request from the corresponding author. The data are not publicly available due to the sample size and consortium requirements.

Acknowledgments

This research could not have been carried out without the collaboration of Hurley Medical Center and Hurley Residency Clinic in Flint, MI, USA; Hutzel Medical Center; DMC Center for Obstetrics and Gynecology; and University Health Center in Detroit, MI, USA; Munson Hospital and Grand Traverse Women’s Clinic in Traverse City, MI, USA; University of Michigan Hospital; Von Voigtlander Women’s Center; West Ann Arbor Health Center; and Obstetrics and Gynecology at Briarwood Center in Ann Arbor, MI, USA; St. John’s Providence Park; Metro Partners in Women’s Health; and Women’s Health Consultants in Novi, MI, USA; St. Joseph Mercy Hospital; IHA Canton Obstetrics and Gynecology; and IHA Domino Farms in Ann Arbor, MI, USA; Sinai Grace Hospital, Sinai Grace OB-GYN Women’s Health Centers; Northwest Women’s Care; and DMC Northwest Women’s Care in Detroit, MI, USA; Beaumont Dearborn Hospital and Oakwood OB-GYN Associates in Dearborn, MI, USA; Covenant Hospital, Central Michigan University Health in Saginaw, MI, USA; SHMG OB/GYN; Grand Rapids Women’s Health, and Spectrum Health in Grand Rapids, MI, USA; Blue Water OB/GYN; NorthPointe OB/GYN; McLaren Port Huron Hospital in Port Huron, MI, USA; the MSU Faculty Clinic; the MSU Residency Clinic; and Sparrow Hospital, in Lansing, MI, USA.

Conflicts of Interest

A.E.C.-B. was employed by Henry Ford Health. The remaining authors declare that the research was conducted in the absence of any commercial or financial relationships that could be construed as a potential conflict of interest.

References

  1. Driscoll, A.K.; Gregory, E.C.W. Increases in Prepregnancy Obesity: United States, 2016–2019. NCHS Data Brief 2020, 392, 1–8. [Google Scholar]
  2. Yao, Y.; Cai, X.; Ye, Y.; Wang, F.; Chen, F.; Zheng, C. The Role of Microbiota in Infant Health: From Early Life to Adulthood. Front. Immunol. 2021, 12, 708472. [Google Scholar] [CrossRef] [PubMed]
  3. Sajdel-Sulkowska, E.M. The Impact of Maternal Gut Microbiota during Pregnancy on Fetal Gut–Brain Axis Development and Life-Long Health Outcomes. Microorganisms 2023, 11, 2199. [Google Scholar] [CrossRef] [PubMed]
  4. Huang, T.; Liang, X.; Bao, H.; Ma, G.; Tang, X.; Luo, H.; Xiao, X. Multi-Omics Analysis Reveals the Associations between Altered Gut Microbiota, Metabolites, and Cytokines during Pregnancy. mSystems 2024, 9, e01252-23. [Google Scholar] [CrossRef]
  5. Turroni, F.; Milani, C.; Duranti, S.; Lugli, G.A.; Bernasconi, S.; Margolles, A.; di Pierro, F.; van Sinderen, D.; Ventura, M. The Infant Gut Microbiome as a Microbial Organ Influencing Host Well-Being. Ital. J. Pediatr. 2020, 46, 16. [Google Scholar] [CrossRef]
  6. Kalbermatter, C.; Fernandez Trigo, N.; Christensen, S.; Ganal-Vonarburg, S.C. Maternal Microbiota, Early Life Colonization and Breast Milk Drive Immune Development in the Newborn. Front. Immunol. 2021, 12, 683022. [Google Scholar] [CrossRef]
  7. Portela, A.; Esteller, M. Epigenetic Modifications and Human Disease. Nat. Biotechnol. 2010, 28, 1057–1068. [Google Scholar] [CrossRef]
  8. Li, Y. Epigenetic Mechanisms Link Maternal Diets and Gut Microbiome to Obesity in the Offspring. Front. Genet. 2018, 9, 390209. [Google Scholar] [CrossRef] [PubMed]
  9. Sharp, G.C.; Salas, L.A.; Monnereau, C.; Allard, C.; Yousefi, P.; Everson, T.M.; Bohlin, J.; Xu, Z.; Huang, R.-C.; Reese, S.E.; et al. Maternal BMI at the Start of Pregnancy and Offspring Epigenome-Wide DNA Methylation: Findings from the Pregnancy and Childhood Epigenetics (PACE) Consortium. Hum. Mol. Genet. 2017, 26, 4067–4085. [Google Scholar] [CrossRef]
  10. Koemel, N.A.; Skilton, M.R. Epigenetic Aging in Early Life: Role of Maternal and Early Childhood Nutrition. Curr. Nutr. Rep. 2022, 11, 318–328. [Google Scholar] [CrossRef]
  11. Phang, M.; Ross, J.; Raythatha, J.H.; Dissanayake, H.U.; McMullan, R.L.; Kong, Y.; Hyett, J.; Gordon, A.; Molloy, P.; Skilton, M.R. Epigenetic Aging in Newborns: Role of Maternal Diet. Am. J. Clin. Nutr. 2020, 111, 555–561. [Google Scholar] [CrossRef] [PubMed]
  12. Monasso, G.S.; Küpers, L.K.; Jaddoe, V.W.V.; Heil, S.G.; Felix, J.F. Associations of Circulating Folate, Vitamin B12 and Homocysteine Concentrations in Early Pregnancy and Cord Blood with Epigenetic Gestational Age: The Generation R Study. Clin. Epigenet. 2021, 13, 95. [Google Scholar] [CrossRef] [PubMed]
  13. Cai, S.; Quan, S.; Yang, G.; Ye, Q.; Chen, M.; Yu, H.; Wang, G.; Wang, Y.; Zeng, X.; Qiao, S. One Carbon Metabolism and Mammalian Pregnancy Outcomes. Mol. Nutr. Food Res. 2021, 65, 2000734. [Google Scholar] [CrossRef] [PubMed]
  14. Sugino, K.Y.; Paneth, N.; Comstock, S.S. Michigan Cohorts to Determine Associations of Maternal Pre-Pregnancy Body Mass Index with Pregnancy and Infant Gastrointestinal Microbial Communities: Late Pregnancy and Early Infancy. PLoS ONE 2019, 14, e0213733. [Google Scholar] [CrossRef] [PubMed]
  15. Ruebel, M.L.; Gilley, S.P.; Sims, C.R.; Zhong, Y.; Turner, D.; Chintapalli, S.V.; Piccolo, B.D.; Andres, A.; Shankar, K. Associations between Maternal Diet, Body Composition and Gut Microbial Ecology in Pregnancy. Nutrients 2021, 13, 3295. [Google Scholar] [CrossRef] [PubMed]
  16. Strobel, K.M.; Juul, S.E.; Hendrixson, D.T. Maternal Nutritional Status and the Microbiome across the Pregnancy and the Post-Partum Period. Microorganisms 2023, 11, 1569. [Google Scholar] [CrossRef] [PubMed]
  17. Pinart, M.; Dötsch, A.; Schlicht, K.; Laudes, M.; Bouwman, J.; Forslund, S.K.; Pischon, T.; Nimptsch, K. Gut Microbiome Composition in Obese and Non-Obese Persons: A Systematic Review and Meta-Analysis. Nutrients 2021, 14, 12. [Google Scholar] [CrossRef] [PubMed]
  18. Koliada, A.; Syzenko, G.; Moseiko, V.; Budovska, L.; Puchkov, K.; Perederiy, V.; Gavalko, Y.; Dorofeyev, A.; Romanenko, M.; Tkach, S.; et al. Association between Body Mass Index and Firmicutes/Bacteroidetes Ratio in an Adult Ukrainian Population. BMC Microbiol. 2017, 17, 120. [Google Scholar] [CrossRef]
  19. Zacarías, M.F.; Collado, M.C.; Gómez-Gallego, C.; Flinck, H.; Aittoniemi, J.; Isolauri, E.; Salminen, S. Pregestational Overweight and Obesity Are Associated with Differences in Gut Microbiota Composition and Systemic Inflammation in the Third Trimester. PLoS ONE 2018, 13, e0200305. [Google Scholar] [CrossRef]
  20. Aatsinki, A.-K.; Uusitupa, H.-M.; Munukka, E.; Pesonen, H.; Rintala, A.; Pietilä, S.; Lahti, L.; Eerola, E.; Karlsson, L.; Karlsson, H. Gut Microbiota Composition in Mid-Pregnancy Is Associated with Gestational Weight Gain but Not Prepregnancy Body Mass Index. J. Womens Health 2018, 27, 1293–1301. [Google Scholar] [CrossRef]
  21. Daliry, A.; Pereira, E.N.G. da S. Role of Maternal Microbiota and Nutrition in Early-Life Neurodevelopmental Disorders. Nutrients 2021, 13, 3533. [Google Scholar] [CrossRef] [PubMed]
  22. Agustí, A.; García-Pardo, M.P.; López-Almela, I.; Campillo, I.; Maes, M.; Romaní-Pérez, M.; Sanz, Y. Interplay between the Gut-Brain Axis, Obesity and Cognitive Function. Front. Neurosci. 2018, 12, 155. [Google Scholar] [CrossRef] [PubMed]
  23. Asadi, A.; Shadab Mehr, N.; Mohamadi, M.H.; Shokri, F.; Heidary, M.; Sadeghifard, N.; Khoshnood, S. Obesity and Gut–Microbiota–Brain Axis: A Narrative Review. J. Clin. Lab. Anal. 2022, 36, e24420. [Google Scholar] [CrossRef] [PubMed]
  24. Mayer, E.A.; Nance, K.; Chen, S. The Gut–Brain Axis. Annu. Rev. Med. 2022, 73, 439–453. [Google Scholar] [CrossRef] [PubMed]
  25. Edlow, A.G. Maternal Obesity and Neurodevelopmental and Psychiatric Disorders in Offspring. Prenat. Diagn. 2017, 37, 95–110. [Google Scholar] [CrossRef] [PubMed]
  26. Buss, C.; Entringer, S.; Davis, E.P.; Hobel, C.J.; Swanson, J.M.; Wadhwa, P.D.; Sandman, C.A. Impaired Executive Function Mediates the Association between Maternal Pre-Pregnancy Body Mass Index and Child ADHD Symptoms. PLoS ONE 2012, 7, e37758. [Google Scholar] [CrossRef] [PubMed]
  27. Howell, K.R.; Powell, T.L. Effects of Maternal Obesity on Placental Function and Fetal Development. Reproduction 2017, 153, R97–R108. [Google Scholar] [CrossRef]
  28. Hu, C.; Yan, Y.; Ji, F.; Zhou, H. Maternal Obesity Increases Oxidative Stress in Placenta and It Is Associated with Intestinal Microbiota. Front. Cell. Infect. Microbiol. 2021, 11, 671347. [Google Scholar] [CrossRef]
  29. CHARM: Child Health Advances from Research with Mothers. Available online: https://charmstudy.epibio.msu.edu (accessed on 15 October 2023).
  30. Ma, T.; Bu, S.; Paneth, N.; Kerver, J.M.; Comstock, S.S. Vitamin D Supplementation in Exclusively Breastfed Infants Is Associated with Alterations in the Fecal Microbiome. Nutrients 2022, 14, 202. [Google Scholar] [CrossRef]
  31. Paneth, N.; Monk, C. The Importance of Cohort Research Starting Early in Life to Understanding Child Health. Curr. Opin. Pediatr. 2018, 30, 292–296. [Google Scholar] [CrossRef]
  32. Haddad, E.N.; Comstock, S.S. Archive for Research in Child Health (ARCH) and Baby Gut: Study Protocol for a Remote, Prospective, Longitudinal Pregnancy and Birth Cohort to Address Microbiota Development and Child Health. Methods Protoc. 2021, 4, 52. [Google Scholar] [CrossRef] [PubMed]
  33. Defining Adult Overweight and Obesity. Available online: https://www.cdc.gov/obesity (accessed on 17 August 2022).
  34. Kozich, J.J.; Westcott, S.L.; Baxter, N.T.; Highlander, S.K.; Schloss, P.D. Development of a Dual-Index Sequencing Strategy and Curation Pipeline for Analyzing Amplicon Sequence Data on the MiSeq Illumina Sequencing Platform. Appl. Environ. Microbiol. 2013, 79, 5112–5120. [Google Scholar] [CrossRef] [PubMed]
  35. Quast, C.; Pruesse, E.; Yilmaz, P.; Gerken, J.; Schweer, T.; Yarza, P.; Peplies, J.; Glöckner, F.O. The SILVA Ribosomal RNA Gene Database Project: Improved Data Processing and Web-Based Tools. Nucleic Acids Res. 2012, 41, D590–D596. [Google Scholar] [CrossRef] [PubMed]
  36. Oksanen, J.; Simpson, G.L.; Blanchet, G.; Kindt, R. Vegan: Community Ecology Package. R Version 2.6-2. Available online: https://cran.r-project.org/web/packages/vegan/index.html (accessed on 20 January 2021).
  37. R Core Team. R: A Language and Environment for Statistical Computing 2020; R Core Team: Vienna, Austria, 2020. [Google Scholar]
  38. Venables, W.N.; Ripley, B.D. Modern Applied Statistics with S; Springer: New York, NY, USA, 2002; ISBN 978-1-4419-3008-8. [Google Scholar]
  39. Scott, F.I.; Horton, D.B.; Mamtani, R.; Haynes, K.; Goldberg, D.S.; Lee, D.Y.; Lewis, J.D. Administration of Antibiotics to Children Before Age 2 Years Increases Risk for Childhood Obesity. Gastroenterology 2016, 151, 120–129.e5. [Google Scholar] [CrossRef] [PubMed]
  40. Furlong, M.; Deming-Halverson, S.; Sandler, D.P. Chronic Antibiotic Use during Adulthood and Weight Change in the Sister Study. PLoS ONE 2019, 14, e0216959. [Google Scholar] [CrossRef] [PubMed]
  41. Bongers, K.S.; McDonald, R.A.; Winner, K.M.; Falkowski, N.R.; Brown, C.A.; Baker, J.M.; Hinkle, K.J.; Fergle, D.J.; Dickson, R.P. Antibiotics Cause Metabolic Changes in Mice Primarily through Microbiome Modulation Rather than Behavioral Changes. PLoS ONE 2022, 17, e0265023. [Google Scholar] [CrossRef] [PubMed]
  42. Vallianou, N.; Dalamaga, M.; Stratigou, T.; Karampela, I.; Tsigalou, C. Do Antibiotics Cause Obesity Through Long-Term Alterations in the Gut Microbiome? A Review of Current Evidence. Curr. Obes. Rep. 2021, 10, 244–262. [Google Scholar] [CrossRef]
  43. Leong, K.S.W.; Derraik, J.G.B.; Hofman, P.L.; Cutfield, W.S. Antibiotics, Gut Microbiome and Obesity. Clin. Endocrinol. 2018, 88, 185–200. [Google Scholar] [CrossRef] [PubMed]
  44. del Fiol, F.S.; Balcão, V.M.; Barberato-Fillho, S.; Lopes, L.C.; Bergamaschi, C.C. Obesity: A New Adverse Effect of Antibiotics? Front. Pharmacol. 2018, 9, 1408. [Google Scholar] [CrossRef]
  45. Dare, S.; Mackay, D.F.; Pell, J.P. Relationship between Smoking and Obesity: A Cross-Sectional Study of 499,504 Middle-Aged Adults in the UK General Population. PLoS ONE 2015, 10, e0123579. [Google Scholar] [CrossRef]
  46. Klesges, R.C.; Meyers, A.W.; Klesges, L.M.; LaVasque, M.E. Smoking, Body Weight, and Their Effects on Smoking Behavior: A Comprehensive Review of the Literature. Psychol. Bull. 1989, 106, 204–230. [Google Scholar] [CrossRef] [PubMed]
  47. Reynolds, S.L.; Hagedorn, A.; Yeom, J.; Saito, Y.; Yokoyama, E.; Crimmins, E.M. A Tale of Two Countries—The United States and Japan: Are Differences in Health Due to Differences in Overweight? J. Epidemiol. 2008, 18, 280–290. [Google Scholar] [CrossRef] [PubMed]
  48. Tzotzas, T.; Vlahavas, G.; Papadopoulou, S.K.; Kapantais, E.; Kaklamanou, D.; Hassapidou, M. Marital Status and Educational Level Associated to Obesity in Greek Adults: Data from the National Epidemiological Survey. BMC Public Health 2010, 10, 732. [Google Scholar] [CrossRef]
  49. Zhang, Q.; Wang, Y. Socioeconomic Inequality of Obesity in the United States: Do Gender, Age, and Ethnicity Matter? Soc. Sci. Med. 2004, 58, 1171–1180. [Google Scholar] [CrossRef]
  50. Addoum, J.M.; Korniotis, G.; Kumar, A. Stature, Obesity, and Portfolio Choice. Manag. Sci. 2017, 63, 3393–3413. [Google Scholar] [CrossRef]
  51. Gallè, F.; Valeriani, F.; Cattaruzza, M.S.; Gianfranceschi, G.; Liguori, R.; Antinozzi, M.; Mederer, B.; Liguori, G.; Romano Spica, V. Mediterranean Diet, Physical Activity and Gut Microbiome Composition: A Cross-Sectional Study among Healthy Young Italian Adults. Nutrients 2020, 12, 2164. [Google Scholar] [CrossRef]
  52. Gao, X.; Zhang, M.; Xue, J.; Huang, J.; Zhuang, R.; Zhou, X.; Zhang, H.; Fu, Q.; Hao, Y. Body Mass Index Differences in the Gut Microbiota Are Gender Specific. Front. Microbiol. 2018, 9, 1250. [Google Scholar] [CrossRef]
  53. Peters, B.A.; Shapiro, J.A.; Church, T.R.; Miller, G.; Trinh-Shevrin, C.; Yuen, E.; Friedlander, C.; Hayes, R.B.; Ahn, J. A Taxonomic Signature of Obesity in a Large Study of American Adults. Sci. Rep. 2018, 8, 9749. [Google Scholar] [CrossRef]
  54. Kasai, C.; Sugimoto, K.; Moritani, I.; Tanaka, J.; Oya, Y.; Inoue, H.; Tameda, M.; Shiraki, K.; Ito, M.; Takei, Y.; et al. Comparison of the Gut Microbiota Composition between Obese and Non-Obese Individuals in a Japanese Population, as Analyzed by Terminal Restriction Fragment Length Polymorphism and next-Generation Sequencing. BMC Gastroenterol. 2015, 15, 100. [Google Scholar] [CrossRef]
  55. Stanislawski, M.A.; Dabelea, D.; Lange, L.A.; Wagner, B.D.; Lozupone, C.A. Gut Microbiota Phenotypes of Obesity. NPJ Biofilms Microbiomes 2019, 5, 18. [Google Scholar] [CrossRef]
  56. de la Cuesta-Zuluaga, J.; Kelley, S.T.; Chen, Y.; Escobar, J.S.; Mueller, N.T.; Ley, R.E.; McDonald, D.; Huang, S.; Swafford, A.D.; Knight, R.; et al. Age- and Sex-Dependent Patterns of Gut Microbial Diversity in Human Adults. mSystems 2019, 4, e00261-19. [Google Scholar] [CrossRef] [PubMed]
  57. Kovatcheva-Datchary, P.; Nilsson, A.; Akrami, R.; Lee, Y.S.; De Vadder, F.; Arora, T.; Hallen, A.; Martens, E.; Björck, I.; Bäckhed, F. Dietary Fiber-Induced Improvement in Glucose Metabolism Is Associated with Increased Abundance of Prevotella. Cell Metab. 2015, 22, 971–982. [Google Scholar] [CrossRef]
  58. Savin, Z.; Kivity, S.; Yonath, H.; Yehuda, S. Smoking and the Intestinal Microbiome. Arch. Microbiol. 2018, 200, 677–684. [Google Scholar] [CrossRef] [PubMed]
  59. Ley, R.E.; Turnbaugh, P.J.; Klein, S.; Gordon, J.I. Human Gut Microbes Associated with Obesity. Nature 2006, 444, 1022–1023. [Google Scholar] [CrossRef] [PubMed]
  60. Magne, F.; Gotteland, M.; Gauthier, L.; Zazueta, A.; Pesoa, S.; Navarrete, P.; Balamurugan, R. The Firmicutes/Bacteroidetes Ratio: A Relevant Marker of Gut Dysbiosis in Obese Patients? Nutrients 2020, 12, 1474. [Google Scholar] [CrossRef]
  61. Chen, J.; Ryu, E.; Hathcock, M.; Ballman, K.; Chia, N.; Olson, J.E.; Nelson, H. Impact of Demographics on Human Gut Microbial Diversity in a US Midwest Population. PeerJ 2016, 4, e1514. [Google Scholar] [CrossRef]
  62. Ozato, N.; Saito, S.; Yamaguchi, T.; Katashima, M.; Tokuda, I.; Sawada, K.; Katsuragi, Y.; Kakuta, M.; Imoto, S.; Ihara, K.; et al. Blautia Genus Associated with Visceral Fat Accumulation in Adults 20–76 Years of Age. NPJ Biofilms Microbiomes 2019, 5, 28. [Google Scholar] [CrossRef]
  63. Zhang, W.; Li, J.; Lu, S.; Han, N.; Miao, J.; Zhang, T.; Qiang, Y.; Kong, Y.; Wang, H.; Gao, T.; et al. Gut Microbiota Community Characteristics and Disease-Related Microorganism Pattern in a Population of Healthy Chinese People. Sci. Rep. 2019, 9, 1594. [Google Scholar] [CrossRef]
  64. Russell, W.R.; Gratz, S.W.; Duncan, S.H.; Holtrop, G.; Ince, J.; Scobbie, L.; Duncan, G.; Johnstone, A.M.; Lobley, G.E.; Wallace, R.J.; et al. High-Protein, Reduced-Carbohydrate Weight-Loss Diets Promote Metabolite Profiles Likely to Be Detrimental to Colonic Health. Am. J. Clin. Nutr. 2011, 93, 1062–1072. [Google Scholar] [CrossRef]
  65. David, L.A.; Maurice, C.F.; Carmody, R.N.; Gootenberg, D.B.; Button, J.E.; Wolfe, B.E.; Ling, A.V.; Devlin, A.S.; Varma, Y.; Fischbach, M.A.; et al. Diet Rapidly and Reproducibly Alters the Human Gut Microbiome. Nature 2014, 505, 559–563. [Google Scholar] [CrossRef]
  66. Meehan, C.J.; Beiko, R.G. A Phylogenomic View of Ecological Specialization in the Lachnospiraceae, a Family of Digestive Tract-Associated Bacteria. Genome Biol. Evol. 2014, 6, 703–713. [Google Scholar] [CrossRef] [PubMed]
  67. Shin, D.; Chung, H.; Weatherspoon, L.; Song, W.O. Validity of Prepregnancy Weight Status Estimated from Self-Reported Height and Weight. Matern. Child Health J. 2014, 18, 1667–1674. [Google Scholar] [CrossRef] [PubMed]
  68. Hodge, J.M.; Shah, R.; McCullough, M.L.; Gapstur, S.M.; Patel, A.v. Validation of Self-Reported Height and Weight in a Large, Nationwide Cohort of U.S. Adults. PLoS ONE 2020, 15, e0231229. [Google Scholar] [CrossRef] [PubMed]
  69. Yehya, N. Gut Bacteria Differences between Black and White Women Linked to Insulin Sensitivity. Available online: https://health.ucdavis.edu/news/headlines/gut-bacteria-differences-between-black-and-white-women-linked-to-insulin-sensitivity/2022/01 (accessed on 22 February 2023).
  70. Brooks, A.W.; Priya, S.; Blekhman, R.; Bordenstein, S.R. Gut Microbiota Diversity across Ethnicities in the United States. PLoS Biol. 2018, 16, e2006842. [Google Scholar] [CrossRef] [PubMed]
  71. Knapp, E.A.; Kress, A.M.; Parker, C.B.; Page, G.P.; McArthur, K.; Gachigi, K.K.; Alshawabkeh, A.N.; Aschner, J.L.; Bastain, T.M.; Breton, C.V.; et al. The Environmental Influences on Child Health Outcomes (ECHO)-Wide Cohort. Am. J. Epidemiol. 2023, 192, 1249–1263. [Google Scholar] [CrossRef] [PubMed]
  72. Bragg, M.G.; Westlake, M.; Alshawabkeh, A.N.; Bekelman, T.A.; Camargo, C.A.; Catellier, D.J.; Comstock, S.S.; Dabelea, D.; Dunlop, A.L.; Hedderson, M.M.; et al. Opportunities for Examining Child Health Impacts of Early-Life Nutrition in the ECHO Program: Maternal and Child Dietary Intake Data from Pregnancy to Adolescence. Curr. Dev. Nutr. 2023, 7, 102019. [Google Scholar] [CrossRef] [PubMed]
  73. Adithya, K.K.; Rajeev, R.; Selvin, J.; Seghal Kiran, G. Dietary Influence on the Dynamics of the Human Gut Microbiome: Prospective Implications in Interventional Therapies. ACS Food Sci. Technol. 2021, 1, 717–736. [Google Scholar] [CrossRef]
  74. Durack, J.; Lynch, S.v. The Gut Microbiome: Relationships with Disease and Opportunities for Therapy. J. Exp. Med. 2019, 216, 20–40. [Google Scholar] [CrossRef] [PubMed]
  75. Santarossa, S.; Sitarik, A.R.; Cassidy-Bushrow, A.E.; Comstock, S.S. Prenatal Physical Activity and the Gut Microbiota of Pregnant Women: Results from a Preliminary Investigation. Phys. Act. Nutr. 2023, 27, 001–007. [Google Scholar] [CrossRef]
  76. Maugeri, A.; Barchitta, M.; Favara, G.; La Rosa, M.C.; La Mastra, C.; Magnano San Lio, R.; Agodi, A. Maternal Dietary Patterns Are Associated with Pre-Pregnancy Body Mass Index and Gestational Weight Gain: Results from the “Mamma & Bambino” Cohort. Nutrients 2019, 11, 1308. [Google Scholar] [CrossRef]
  77. Ferreira, L.B.; Lobo, C.V.; Miranda, A.E.d.S.; Carvalho, B.d.C.; dos Santos, L.C. Dietary Patterns during Pregnancy and Gestational Weight Gain: A Systematic Review. Rev. Bras. de Ginecol. e Obs./RBGO Gynecol. Obstet. 2022, 44, 540–547. [Google Scholar] [CrossRef] [PubMed]
  78. Wesolowski, S.R.; El Kasmi, K.C.; Jonscher, K.R.; Friedman, J.E. Developmental Origins of NAFLD: A Womb with a Clue. Nat. Rev. Gastroenterol. Hepatol. 2017, 14, 81–96. [Google Scholar] [CrossRef] [PubMed]
  79. Vähämiko, S.; Laiho, A.; Lund, R.; Isolauri, E.; Salminen, S.; Laitinen, K. The Impact of Probiotic Supplementation during Pregnancy on DNA Methylation of Obesity-Related Genes in Mothers and Their Children. Eur. J. Nutr. 2019, 58, 367–377. [Google Scholar] [CrossRef] [PubMed]
Figure 1. The beta diversity of the fecal microbiota samples was measured using the (AC) Sorensen index and (DF) Bray–Curtis index according to participants’ pre-pregnancy BMI category (A,D), education level (B,E), and marital status (C,F). The percent variation explained by each axis is in parenthesis, calculated from the PCoA eigen values. Ellipses are around the mean location of each maternal pre-pregnancy BMI category (A,D), education level status (B,E), and marital status (C,F). Each dot represents the composition of the gastrointestinal microbiota of one participant. Panel (A): PERMANOVA, p = 0.033; PERMDISP, p = 0.166. Panel (B): PERMANOVA, p = 0.077; PERMDISP, p = 0.889. Panel (C): PERMANOVA, p = 0.049; PERMDISP, p = 0.893. Panel (D): PERMANOVA, p = 0.017; PERMDISP, p = 0.015. Panel (E): PERMANOVA, p = 0.004; PERMDISP, p = 0.016. Panel (F): PERMANOVA, p = 0.001; PERMDISP, p = 0.015.
Nutrients 16 01881 g001
Figure 2. Women with a BMI category of overweight prior to becoming pregnant had significantly lower Prevotella relative abundance than women with normal weight or obesity prior to becoming pregnant. Boxplot center lines indicate median; boxes indicate interquartile ranges; and whiskers indicate 1.5× the interquartile ranges. ** = p < 0.01, ns = p > 0.05.
Nutrients 16 01881 g002
Table 1. Characteristics of third-trimester pregnant participants by BMI status.
Pre-Pregnancy
Characteristic
Normal BMI
(n = 44)
n, (%)
Overweight BMI
(n = 17)
n, (%)
Obese BMI
(n = 23)
n, (%)
p-Value
Race 0.371
White40 (90.9)16 (94.1)18 (78.3)
Black2 (4.5)1 (5.9)4 (17.4)
Other2 (4.5)0 (0)1 (4.3)
Antibiotic use *13 (29.5)12 (70.6)16 (69.6)0.001
Ever smoked cigarettes2 (4.5)1 (5.9)7 (30.4)0.006
Ever smoked marijuana3 (7.0)1 (6.3)3 (13.0)0.657
Missing, n (%)1 (2.3)1 (5.9)0 (0)
Asthma diagnosis5 (11.4)5 (29.4)6 (26.1)0.165
Allergy diagnosis4 (9.3)2 (11.8)2 (8.7)0.943
Missing, n (%)1 (2.3)0 (0)0 (0)
College graduate34 (77.3)13 (81.3)11 (47.8)0.024
Missing, n (%)0 (0)1 (5.9)0 (0)
Married39 (88.6)12 (70.6)12 (52.2)0.004
Owns a car43 (97.7)14 (82.4)19 (82.6)0.060
Owns a home33 (76.7)11 (64.7)16 (69.6)0.607
Missing, n (%)1 (2.3)0 (0)0 (0)
Owns stocks or bonds24 (54.5)7 (41.2)5 (22.7)0.048
Missing, n (%)0 (0)0 (0)1 (4.3)
Pre-Pregnancy
Characteristic
Mean (± SD)Mean (± SD)Mean (± SD)p-Value
Maternal age31.5 (5.1)32.8 (7.0)30.7 (4.1)0.293
Missing, n (%)2 (4.5)0 (0)1 (4.3)
Parity1.38 (1.7)1.06 (1.1)2.05 (1.6)0.129
Missing, n (%)2 (4.5)0 (0)1 (4.3)
Note: Statistical tests did not include the “missing” category. * Participants were asked to report any antibiotic/medication usage within the past year.
Table 2. Alpha diversity of the fecal microbiota of pregnant participants by pre-pregnancy characteristics.
Pre-Pregnancy
Characteristics
Chao
Mean (SD)
Shannon
Mean (SD)
Inverse Simpson
Mean (SD)
Normal BMI116.7 (30.6)2.7 (0.4)9.7 (3.6)
Overweight BMI110.1 (21.4)2.7 (0.3)9.8 (3.5)
Obese BMI102.0 (19.5)2.5 (0.4)7.5 (3.3)
p-value0.1560.0320.035
≤31 years of age106.4 (21.7)2.5 (0.4)7.7 (3.6)
>31 years of age114.0 (26.3)2.8 (0.4)10.4 (3.1)
p-value0.152<0.001<0.001
College graduate113.4 (27.8)2.7 (0.3)9.7 (3.1)
Did not graduate college105.3 (23.3)2.5 (0.4)7.5 (3.8)
p-value0.1760.0200.014
Married111.5 (25.0)2.7 (0.3)9.7 (3.3)
Unmarried111.0 (32.0)2.5 (0.4)7.4 (4.1)
p-value0.6350.0070.025
Owned bonds111.1 (23.2)2.8 (0.2)10.6 (2.6)
Did not own bonds111.5 (29.5)2.5 (0.4)8.0 (3.8)
p-value0.696<0.001<0.001
Note: p-values in bold are statistically signifciant at p < 0.05.
Table 3. Multivariable linear regression modeling results for alpha diversity indexes according to pre-pregnancy characteristics.
Model
(Overall
p-Value)
VariableRegression
Coefficient
Standard
Error
p-Value
Chao1 IndexModel 1
(p = 0.098)
Intercept114.0983.708<0.0001
Normal BMI---
Overweight BMI−3.9876.9070.565
Obese BMI−11.5366.3240.072
Model 2
(p = 0.444)
Intercept109.3306.831<0.0001
Normal BMI---
Overweight BMI−5.6257.6930.467
Obese BMI−14.7527.7050.059
Antibiotic usage2.0846.4200.746
Smoking status11.4459.3600.225
College grad−0.2437.1070.973
Marital status−1.8317.9140.818
Maternal age8.4776.0500.166
Shannon
Index
Model 1
(p = 0.076)
Intercept2.6770.058<0.0001
Normal BMI---
Overweight BMI0.0630.1080.561
Obese BMI−0.1920.0990.057
Model 2
(p = 0.006)
Intercept2.5960.099<0.0001
Normal BMI---
Overweight BMI0.1160.1120.305
Obese BMI−0.1220.1120.279
Antibiotic usage−0.0850.0930.367
Smoking status0.2270.1360.100
College grad0.0210.1030.837
Marital status−0.1980.1150.089
Maternal age0.1970.0880.028
Inverse
Simpson Index
Model 1
(p = 0.047)
Intercept9.5530.543<0.0001
Normal BMI---
Overweight BMI0.2791.0120.783
Obese BMI−2.1220.543<0.0001
Model 2
(p = 0.006)
Intercept8.7220.935<0.0001
Normal BMI---
Overweight BMI0.4401.0530.677
Obese BMI−1.6511.0550.122
Antibiotic usage−0.2450.8790.781
Smoking status1.1331.2810.379
College grad−0.1160.9730.905
Marriage status−1.6081.0830.142
Maternal age2.2740.8280.008
Note: Hyphens indicate the reference group for variables with more than two levels.
Table 4. Beta diversity permutational multivariable analysis of variance using distance matrices according to pre-pregnancy characteristics.
Beta Diversity Model (Overall p-Value)Variablep-ValueR2Overall R2F-Statistic
Sorensen
(p = 0.024)
BMI0.1130.0310.0801.348
Antibiotic usage0.4800.011
Smoking status0.3530.013
College graduation status0.0820.018
Bray–Curtis
(p = 0.007)
BMI0.1090.0340.1031.792
Antibiotic usage0.4900.010
Smoking status0.4890.010
College graduation status0.0030.041
Disclaimer/Publisher’s Note: The statements, opinions and data contained in all publications are solely those of the individual author(s) and contributor(s) and not of MDPI and/or the editor(s). MDPI and/or the editor(s) disclaim responsibility for any injury to people or property resulting from any ideas, methods, instructions or products referred to in the content.

