Abstract
Background: We conducted a systematic review and meta-analysis to examine the effect of dietary intake of cocoa on anthropometric measurements, lipid and glycemic profiles, and blood pressure levels in adults, with and without comorbidities. Methods: The databases used were MEDLINE (PubMed), EMBASE, Web of Science, Cochrane, LILACS, and SciELO. The eligible studies were randomized clinical trials (RCTs) involving adults undergoing cocoa consumption (cocoa extract or ≥70% cocoa dark chocolate) for ≥4 weeks that evaluated at least one of the following markers: body weight, body mass index (BMI), waist/abdominal circumference, total cholesterol, LDL-c, triglycerides, HDL-c, blood glucose, glycated hemoglobin (HbA1c), and systolic and diastolic blood pressure (SBP/DBP). Results: Thirty-one studies were included, totaling 1986 participants. Cocoa consumption showed no effects on body weight, BMI, waist circumference, triglycerides, HDL-c and HbA1c. Yet, there was a reduction in total cholesterol (−8.35 mg/dL, 95% CI −14.01; −2.69 mg/dL), LDL-c (−9.47 mg/dL, 95% CI −13.75; −5.20 mg/dL), fasting blood glucose (−4.91 mg/dL, 95% CI −8.29; −1.52 mg/dL), SBP (−2.52 mmHg, 95% CI −4.17; −0.88 mmHg), and DBP (−1.58 mmHg, 95% CI −2.54; −0.62 mmHg). Conclusions: The consumption of cocoa showed protective effects on major cardiometabolic risk markers that have a clinical impact in terms of cardiovascular risk reduction.
1. Introduction
Cardiovascular diseases (CVDs), whether or not associated with adverse metabolic risk factors, accounted for 397,000 deaths in Brazil in 2019 [1]. Coronary artery disease is strongly associated with atherosclerosis and dyslipidemia and accounted for 171,246 deaths (43% of total CVD deaths). In addition, there were 80,754 deaths from diabetes mellitus (20%) that same year [1]. Interestingly, since the epidemiological “black box” concept has been introduced in the mid-1940s, we have sought to understand the relationship of CVD risk factors associated with adverse metabolic conditions, such as central obesity, type 2 diabetes mellitus, and dyslipidemia, among others. The Framingham Heart Study [2] was a pioneer and is the basis for the current cardiometabolic risk stratification [3] that includes age; sex; body weight-to-height ratio (body mass index, BMI); systolic blood pressure (SBP) and diastolic blood pressure (DBP) levels or well-established systemic arterial hypertension; fasting blood glucose or well-established type 2 diabetes mellitus; total cholesterol; high-density lipoprotein cholesterol (HDL-c); and smoking.
Scientific research studies have been investigating robust interventions to address these markers and reduce the risk and/or minimize the burden of cardiometabolic diseases. Some of these interventions involve nutritionally adequate diets that may have a positive impact on total body weight [4] and/or BMI, waist/abdominal circumference as a marker of central obesity, lipid profile [5], glycemic profile [6], and BP levels [7], among others. In particular, the consumption of foods containing bioactive substances, such as polyphenols [8], has been associated with improvements in major predictors of CVDs [9,10].
Theobroma cacao, popularly known as cocoa, is a fruit rich in polyphenols, mostly flavonoids [11,12]. Cocoa might exert beneficial cardiovascular effects that are probably mediated by this group of molecules. A range of potential mechanisms through which cocoa might improve cardiovascular health have been suggested, including the activation of nitric oxide (NO) and antioxidant/anti-inflammatory effects. This may explain the positive effects on endothelial function and the reduction of platelet function, blood pressure, markers of insulin resistance, and blood lipids found in epidemiological studies [13]. However, the impact of cocoa consumption in reducing cardiometabolic risk markers (listed in the Framingham risk score) has yet to be established, since the results from randomized clinical trials (RCTs) are controversial. In addition, the amount, frequency, and form of both cocoa and polyphenol intake that could provide these benefits has not been established.
We conducted a systematic review and meta-analysis of RCTs to examine the long-term effects of dietary cocoa consumption on cardiometabolic risk markers, including anthropometric measurements, lipid profile, and blood pressure levels, in adults with and without established comorbidities. Our initial hypothesis was that cocoa has adequate phenolic properties to exert cardioprotective effects on selected outcomes of interest, such as total body weight; BMI; waist/abdominal circumference; total cholesterol; low-density lipoprotein cholesterol (LDL-c); triglycerides; HDL-c; fasting blood glucose and glycated hemoglobin (HbA1c); and SBP and DBP levels.
2. Materials and Methods
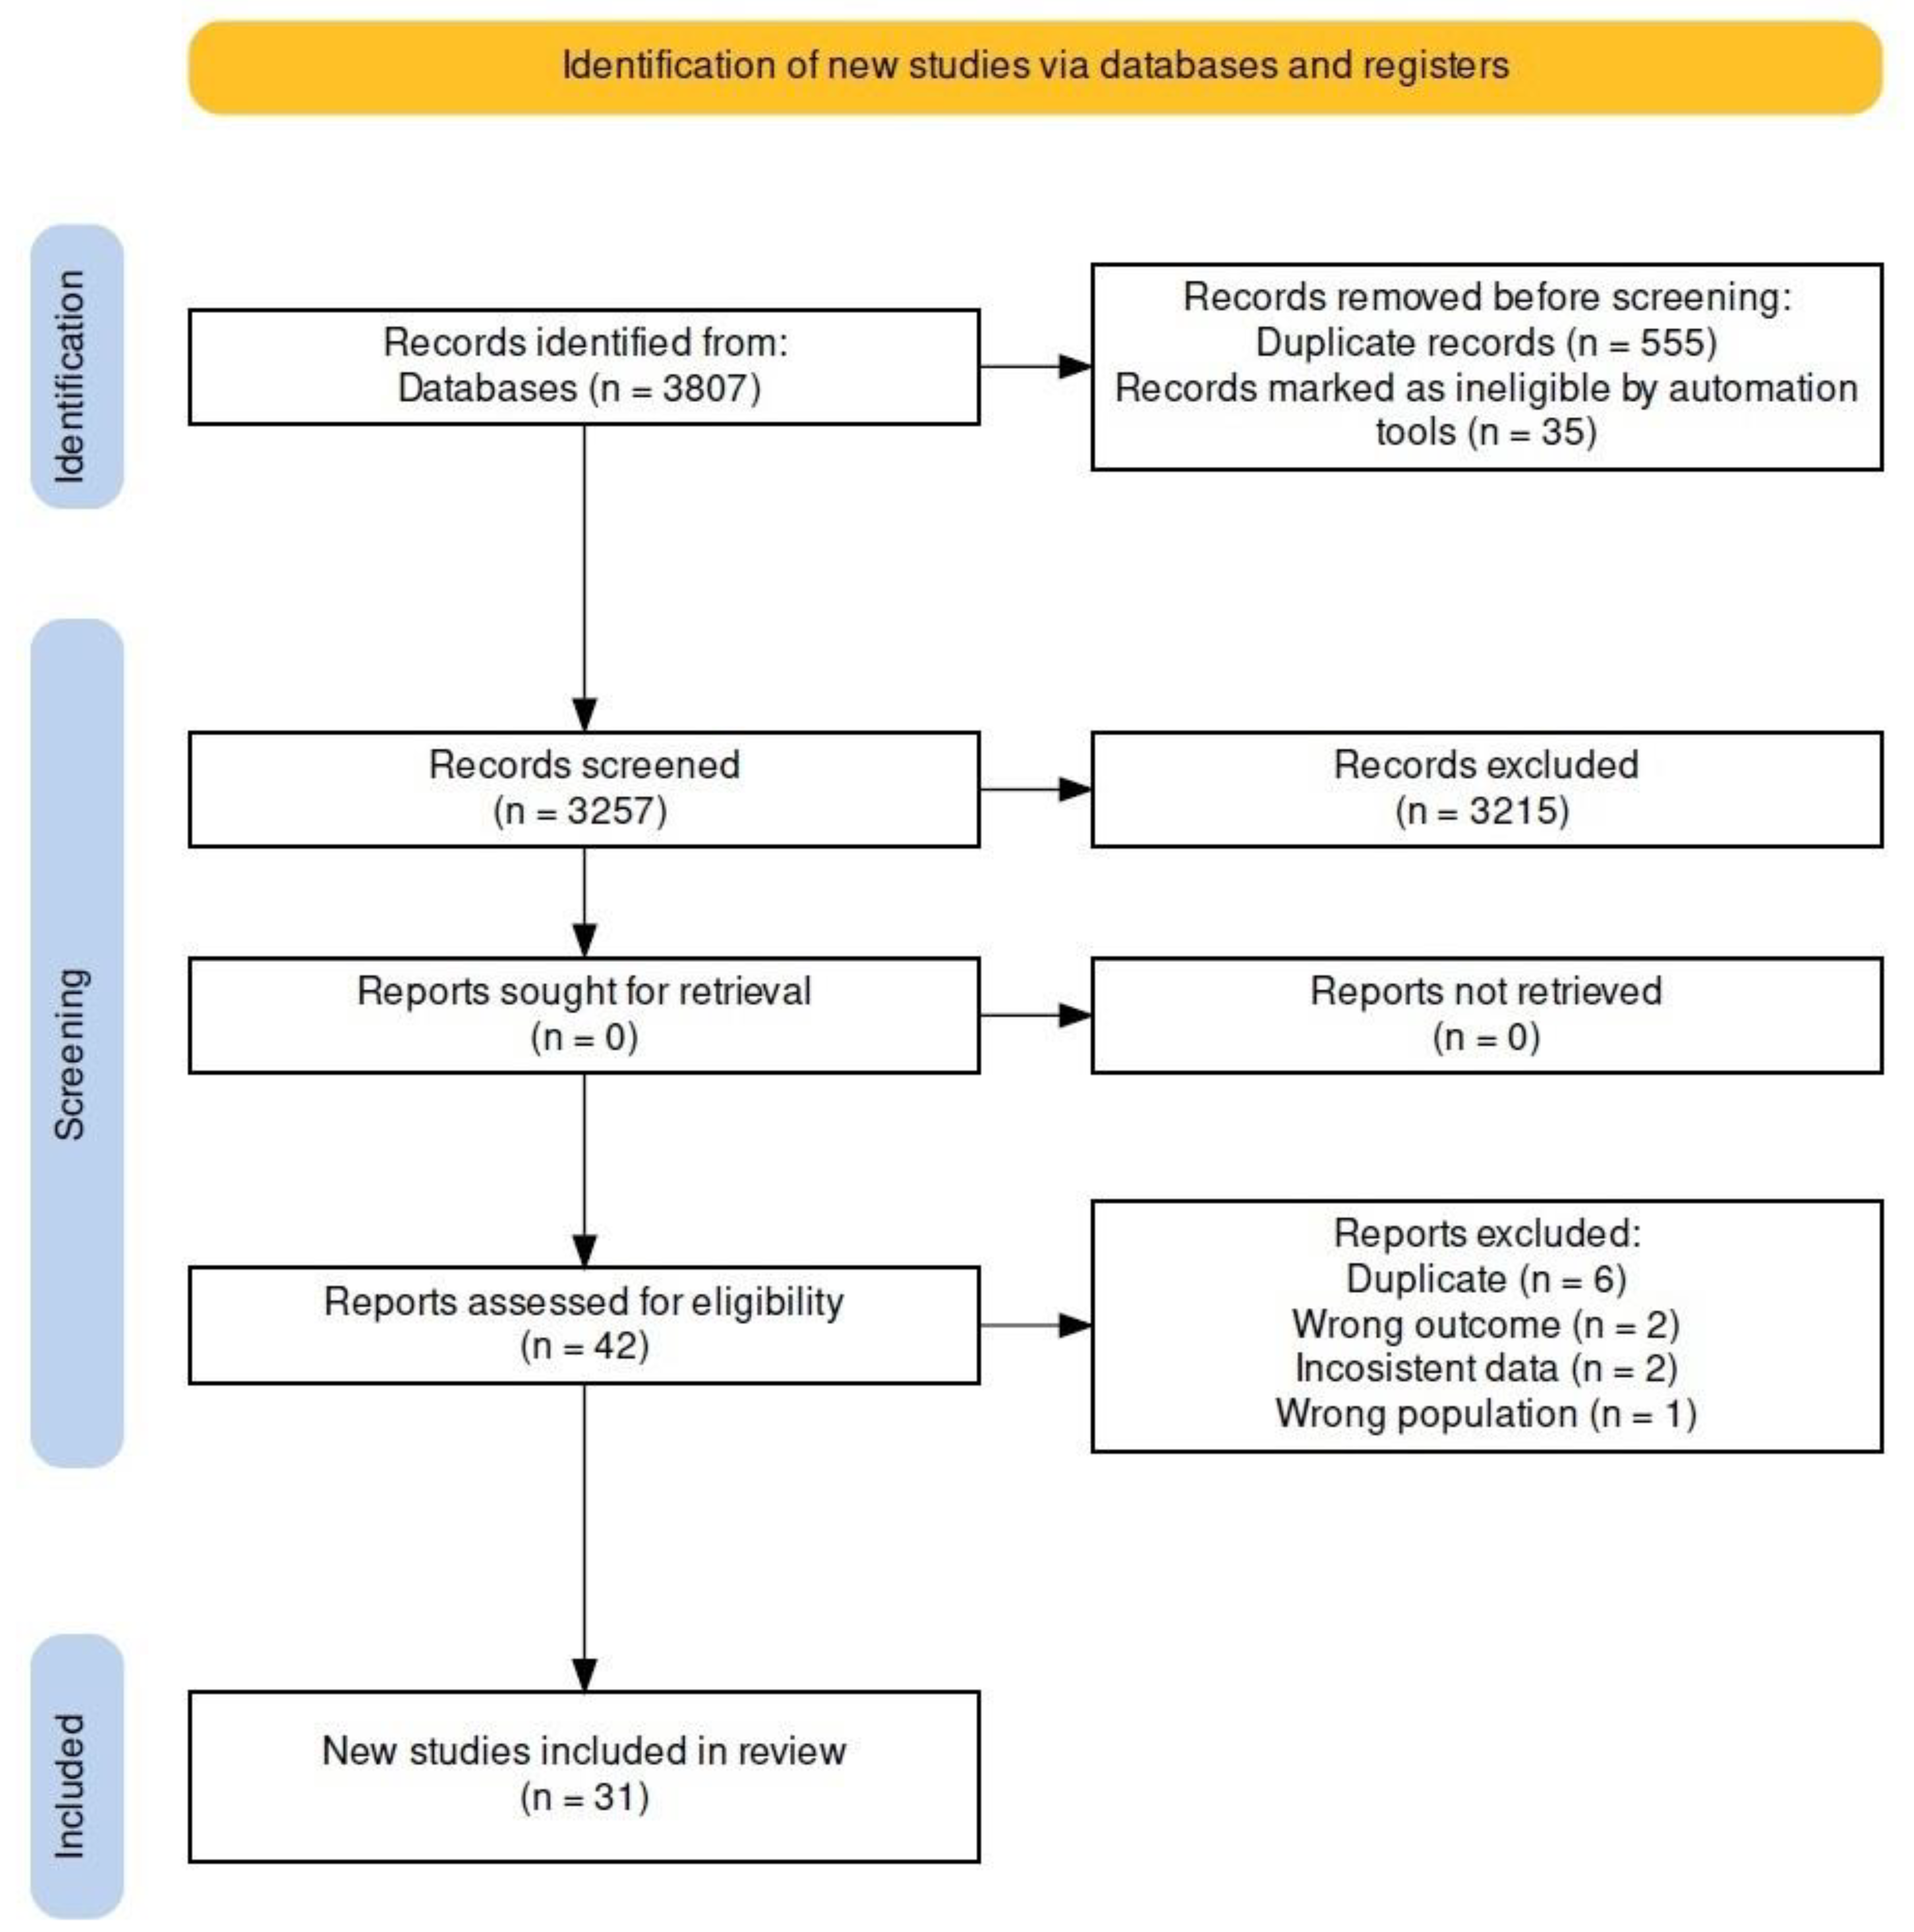
The study protocol was developed based on PRISMA (preferred reporting items for systematic review and meta-analysis) recommendations [14] and the Cochrane methodology for systematic reviews [15]. The protocol for this systematic review and meta-analysis was registered in the International Prospective Register of Systematic Reviews (PROSPERO) (www.crd.york.ac.uk/PROSPERO/, 17 May 2024) and ID “CRD42023484490”, 30 November 2023. The databases and script (Rstudio, version 1.3.959, and R package meta for Windows, version 3.6.1) used in this systematic review for the metanalysis are available on the Mendeley Data repository as open access (https://data.mendeley.com/; doi:10.17632/mwtwh6d8ws.1, 17 May 2024). Figure 1 summarizes the flowchart of the study design.
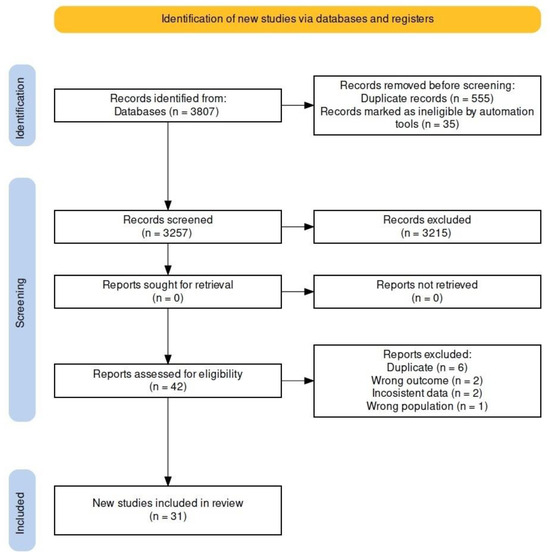
Figure 1.
Flowchart of the study selection process.
2.1. Eligibility Criteria
We used the PICOS design as a framework to formulate eligibility criteria as follows: population: age ≥18 years, healthy or diagnosed with arterial hypertension, and/or type 2 diabetes mellitus and/or dyslipidemia and/or overweight/obesity and/or myocardial infarction/stroke; intervention: cocoa-extract supplement or ≥70% cocoa dark chocolate for ≥4 weeks; comparison: placebo or <70% cocoa white/milk chocolate; outcomes: body weight (kg), BMI (kg/m2), or waist or abdominal circumference (cm) as an indicator of central obesity; total cholesterol (mg/dL), LDL-c (mg/dL), triglycerides (mg/dL), HDL-c (mg/dL); fasting blood glucose (mg/dL) and HbA1c (%); and SBP and DBP (mmHg); study: RCTs only.
We chose to examine adult populations with or without established cardiometabolic risk factors (arterial hypertension and/or type 2 diabetes mellitus and/or dyslipidemia and/or overweight/obesity and/or myocardial infarction/stroke), as their characteristics are closely associated with our research question.
As for the intervention, cocoa can be consumed in multiple variations without restrictions. Still, there is no clear definition of dark chocolate and its cocoa content. We used the United States Department of Agriculture (USDA) food data to standardize chocolate with high cocoa content (>70%) (https://fdc.nal.usda.gov/fdc-app.html#/food-details/170273/nutrients, accessed on 4 June 2024), low content (control) (https://fdc.nal.usda.gov/fdc-app.html#/food-details/170271/nutrients, accessed on 4 June 2024), and “cocoa, dry powder, unsweetened” (https://fdc.nal.usda.gov/fdc-app.html#/food-details/169593/nutrients, accessed on 4 June 2024).
In addition, we performed subgroup analyses comparing healthy and non-healthy individuals with cardiometabolic risk factors and discussed the results. For subgroup analyses by daily amount of polyphenol intake, we selected only RCTs reporting the amount of polyphenol intake in both the intervention and the control groups, and we calculated the median for each outcome of interest. After that, the results were then stratified as ‘below’ and ‘above’ the median (Supplementary Material File S3, Figures S11–S20). The authors were contacted by email to obtain any additional information not available and asked to respond within 15 days (maximum contact attempts of three).
2.2. Inclusion and Exclusion Criteria
Studies combining other dietary interventions with a well-defined intervention group of cocoa or dark-chocolate intake and a control group were carefully reviewed for inclusion. Studies with participants receiving medications or diet changes were eligible when they were introduced at least four weeks prior to the start of the intervention or were consistent throughout the study to allow for accurate analyses.
We excluded studies with participants undergoing treatments other than for cardiometabolic conditions; pregnant and post-menopausal women; concomitant use of dietary supplements that were not clearly different from the cocoa intervention; review or protocol studies; animal experimentation studies; and studies of conditions other than those related to cardiometabolic health such as cancer. Studies involving the same sample published in different journals were thoroughly reviewed, and the authors were contacted by email for additional information and asked to reply within 15 days (maximum contact attempts of three) and excluded if duplicates.
2.3. Search Strategy
Our search strategy for RCTs was developed and conducted by four independent reviewers (two pairs) in the databases recommended in the Cochrane Handbook for Systematic Reviews of Interventions [15]: MEDLINE (PubMed), EMBASE (European literature), Web of Science, and Cochrane (for trials that were not indexed in MEDLINE and EMBASE). To broaden our search, we also carried out searches of publications from Latin America in LILACS (Latin American and Caribbean Health Sciences Literature/Virtual Health Library [VHL]) and SciELO (Scientific Electronic Library Online). For unpublished ongoing studies, we searched the following clinical trial registries: ClinicalTrial.gov; the Brazilian Clinical Trials Registry (REBEC); and the World Health Organization (WHO) International Clinical Trials Registry Platform (ICTRP). We also searched preprint databases (preprints.org/, biorxiv.org, and medrxiv.org).
Articles in the Portuguese, English, and Spanish languages with no date-of-publication limits were eligible for inclusion. Upon completion of the review, we performed an additional search of all databases and registry platforms to ensure the inclusion of the most recent studies.
The main search terms included ‘cocoa’, ‘Theobroma cacao’, and ‘dark chocolate’ (Table S1, Supplementary Material File S1). To increase the accuracy and sensitivity of our searches, the search terms for the study design (RCT) were entered into the databases MEDLINE [16] and EMBASE [17] (Table S1, Supplementary Material File S1). Studies were independently selected and assigned to four reviewers after an initial screening of titles and abstracts. When abstracts did not contain enough information, the reviewers read the full text of the article. Any disagreements among the reviewers were resolved through discussion and, if no consensus was reached, a fifth reviewer (WG) was consulted.
2.4. Data Extraction and Management
After completing our searches in each database, all articles retrieved were exported as .ris or .enib files and imported into the Rayyan reference manager [18]. Duplicate studies were removed; our blinded reviewers manually checked for the remaining duplicates. They used the Rayyan application “to include” articles that met the eligibility criteria. Those that did not meet the inclusion criteria were marked as “excluded” and categorized by reason for exclusion (e.g., ineligible outcomes or population; non-RCT design). When it was not clear whether a study should be included or excluded, it was marked as “undecided”. In a virtual meeting, a pair of reviewers expressed their concerns regarding the “inclusion” or “exclusion” of an article to the other two reviewers. The issues were discussed among them and, if there was no consensus, they were presented to and resolved by a fifth reviewer (WG).
The four blinded reviewers independently performed data extraction. They used a pre-structured Excel 2019 database divided into columns to compile the data extracted, including reviewer; author; year; journal; country; inclusion and exclusion criteria; analysis strategy; the number of individuals included and excluded; the number of individuals analyzed; sex; age; follow-up period; nutritional supplement taken; how it was supplemented; daily amount; and risk of bias. For the main analysis, baseline and post-intervention data were extracted (mean and dispersion measures) for the following markers: body weight, BMI, waist and abdominal circumference; total cholesterol, LDL-c, triglycerides and HDL-c; blood glucose, HbA1c; and SBP and DBP. For the extraction of data from eligible studies with the results presented in graphs, we contacted the authors by email to obtain these data or used GetDate Graph Digitizer 2.26 to extract them.
2.5. Risk of Bias and Strength of Evidence
The risk of bias of RCTs was assessed using the Cochrane risk of bias (RoB) 2 tool included in the Cochrane Handbook [15,19,20]. The analysis was based on a set of six domains of bias and rated as low, high, or unclear risk of bias: randomization sequence generation, allocation concealment, blinding of participants and personnel, blinding of outcome assessment, incomplete outcome data, and selective reporting. When participants were not blinded, studies were classified as high risk of bias in the “blinding of participants and personnel” domain.
We assessed the strength of evidence using the Grading of Recommendations Assessment, Development, and Evaluation (GRADE) tool [21,22]. This tool assesses confidence in paired-effect estimates and classifies treatment effect in a meta-analysis (high, moderate, low, and very low confidence) in the following domains [21,22]: study design, methodological limitations (risk of bias), inconsistency, indirectness of evidence, imprecision, publication bias, magnitude of effect, dose-response gradient, and residual confounders.
GRADE assessments were conducted in a separate step upon the completion of data extraction. Since our meta-analysis included RCTs only, the recommendation is first to rate the study design as “high” [21]. As for the risk of methodological bias, we read the full text of all the articles included and rated them as “low risk”, “moderate risk”, or “high risk” for each item as follows: random sequence generation, allocation concealment, blinding (performance, participants and outcome assessment), incomplete outcome data, selective reporting, and other bias). A score was then generated for methodological bias. The item “inconsistency” was evaluated by the similarity of effect estimates with a 95% CI overlapping, as well as the degree of heterogeneity (I2); “indirectness of evidence” considers similarities between the participants, interventions, and outcomes evaluated. In our meta-analysis, they were all rated as “no risk” because of similar inclusion/exclusion criteria. Using forest plots with wide 95% CIs for each study and outcome, “imprecision” was assessed visually. The “risk of publication bias” was assessed by the symmetry of the funnel plot (Supplementary Material File S4, Figures S21–S30); “magnitude of effect, dose-response gradient, and residual confounders” would not imply a decrease of the strength of evidence, but rather would increase the strength of evidence, especially in studies with relative risk estimates.
2.6. Data-Analysis Strategy
We performed statistical analyses to estimate the effects of cocoa and/or ≥70% cocoa dark-chocolate consumption on anthropometric measurements, lipid and glycemic profiles, and BP levels compared to a control group. Summary effect estimates were expressed in terms of mean difference (MD) and 95% confidence interval (95% CI) pooled using a random-effects model and inverse variance method. We considered the calculated values for a prediction interval (PI), as they reflect the interval of uncertainty of the effects to be expected in future RCTs [23]. To avoid unit-of-analysis errors for RCTs with multiple treatment arms and a single control group, the number of participants in the control group was weighted by the number of groups and participants undergoing the intervention.
To assess the consistency of cocoa’s and/or ≥70% cocoa dark chocolate’s effects across studies, the degree of heterogeneity was tested using the inconsistency test by Higgins (I2) for every pairwise comparison [15,24]. To explore heterogeneity, we performed subgroup analyses and meta-regression analyses (≥10 studies) for effect modifiers with normal distribution in a quartile-quartile plot (qq-plot) and confirmed it using the Shapiro–Wilk test (p > 0.05) [25]. Non-normal data were normalized before performing the meta-regression analysis. When applicable (≥10 studies; more than one study with significant statistical data; studies with different sample sizes), we performed Egger’s test using a funnel plot to assess the potential publication bias in the meta-analysis [26,27].
Dispersion measures expressed as confidence intervals (CI) or standard errors (SE) were converted to standard deviation (SD = EP × √n) before the analysis. For eligible studies that did not report the SD of differences, the SD was estimated using an imputed correlation coefficient (CC) of 0.5, as described in Section 6.5.2.8, Cochrane Handbook [28]: Δ SD = √ SD2 baseline + SD2 final − (2 × CC × SD baseline × SD final). Two-tailed tests were used at a significance level of p < 0.05. Finally, we used RStudio (version 1.3.959) with the R package meta (version 3.6.1) for Windows.
3. Results
3.1. Characteristics of the Studies
Table 1 summarizes the characteristics of the studies selected for this review. The final analysis involved 31 studies [29,30,31,32,33,34,35,36,37,38,39,40,41,42,43,44,45,46,47,48,49,50,51,52,53,54,55,56,57,58,59] totaling 1986 participants, i.e., 1110 in the intervention group and 876 in the control group. The clinical characteristics of the participants were individually defined, but most studies involved participants with more than one health condition. Briefly, 13 studies involved healthy participants [30,31,33,37,39,41,45,47,48,49,57,59]; three with metabolic syndrome [29,54,58]; four with dyslipidemia [36,37,51,55]; two with pre-hypertension and/or hypertension [42,43]; four with excess weight [40,44,46,51]; seven with type 2 diabetes mellitus [32,35,42,43,52,53,56]; and one with insulin resistance [50]. Four studies evaluated older participants only [38,39,45,57] and five young individuals only [30,33,41,58,59].

Table 1.
Characteristics of the selected studies.
We conducted a thorough search of the literature, including the following databases: ClinicalTrials.gov (www.clinicaltrials.gov, accessed on 2 April 2024); Preprints (www.preprints.org, accessed on 2 April 2024); OpenGrey (www.opengrey.eu, accessed on 2 April 2024); the Brazilian Coordination for the Improvement of Higher Education Personnel (CAPES) Bank of Theses and Dissertations; and Brazilian Clinical Trials Registry (REBEC) (https://ensaiosclinicos.gov.br/, accessed on 2 April 2024). A total of 76 articles were retrieved from the ClinicalTrials.gov database, but they were all studies already retrieved in our initial search. We found no articles in Preprints and two articles in OpenGrey, but they were not eligible for inclusion in the review as they did not include outcomes of interest. We retrieved from the CAPES database two master dissertations based on a similar research topic and outcomes, but they were not eligible for inclusion due to sample overlap and no control group. Articles in the Portuguese, English, and Spanish languages with no date-of-publication limits were eligible for inclusion, and no articles were found in the REBEC database.
The mean duration of the intervention was 12 weeks (range 4–24 weeks), and the daily amount of cocoa intake ranged from 1.4 to 50.0 g. The types of bioactive compounds and their contents varied (Table 1). The types of cocoa products consumed included capsules (three studies) [31,32,47]; cocoa extracts and beverages (17 studies) [29,35,36,37,38,39,40,44,45,46,48,49,52,53,54,56,57]; cocoa bars/dark chocolate (nine studies) [30,33,41,42,43,50,57,58,59]; cocoa snacks (two studies) [51,55]; and mixed in the meal ingredients (one study) [34].
3.2. Meta-Analysis of the Effect on Anthropometric Measurements
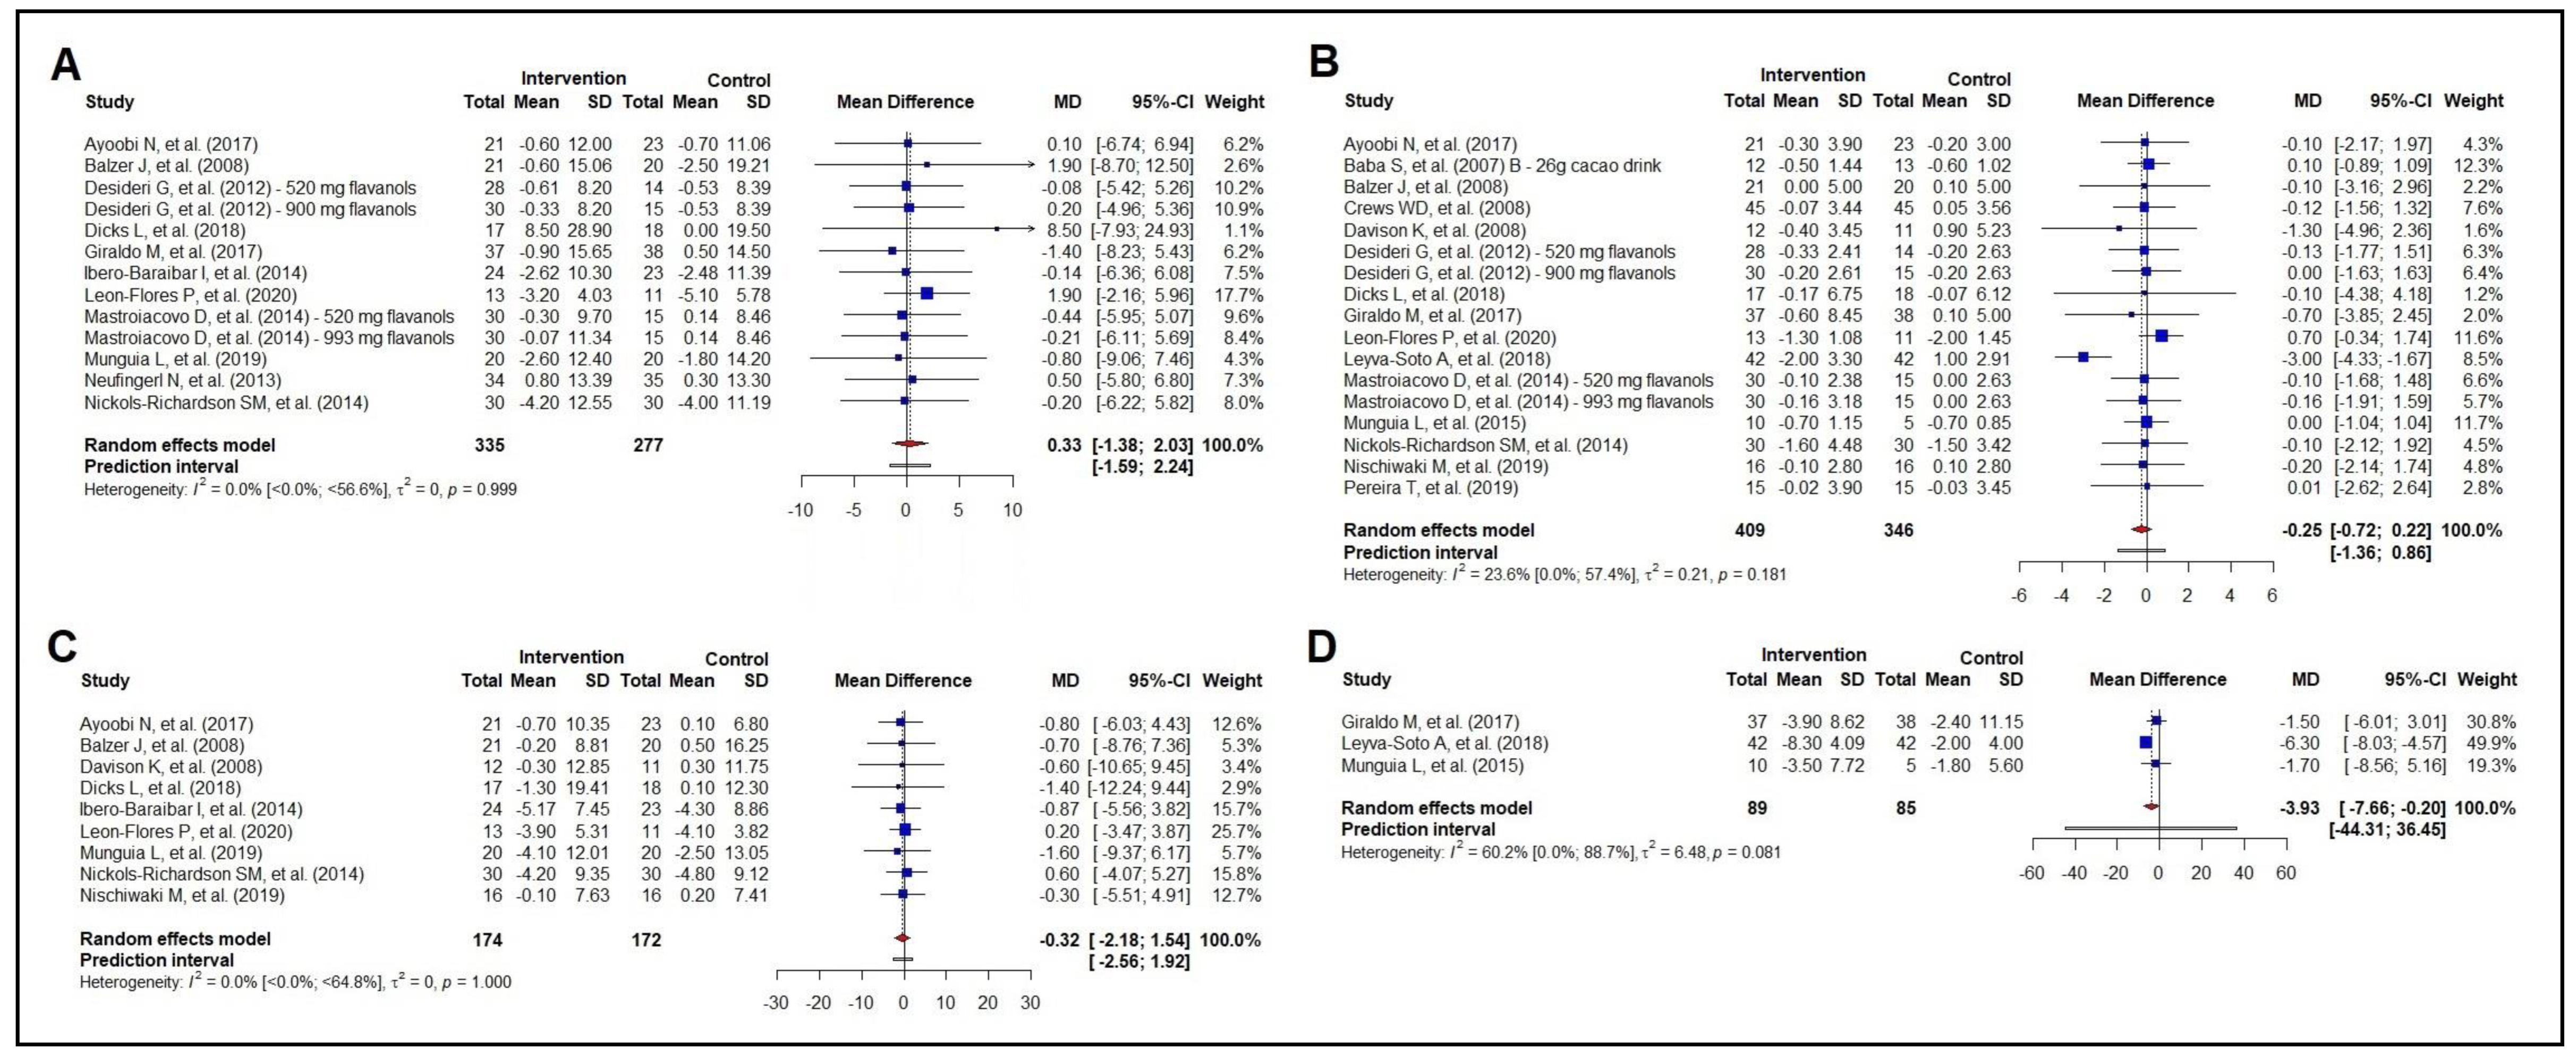
The effect of cocoa consumption on total body mass was evaluated in 11 studies (n = 612) and was found to be ineffective (Figure 2A), even in the subgroup analysis (Figure S1, Supplementary Material File S2; Figure S11, Supplementary Material File S3). The analysis of BMI involved 15 studies (n = 755), and we found no effect of cocoa consumption on reducing BMI; the subgroup analysis did not show any differences (Figure S2, Supplementary Material File S2; Figure S12, Supplementary Material File S3). The same was seen for waist circumference (nine studies; n = 346), as well as in the subgroup analysis (Figure S3, Supplementary Material File S2; Figure S13, Supplementary Material File S3).
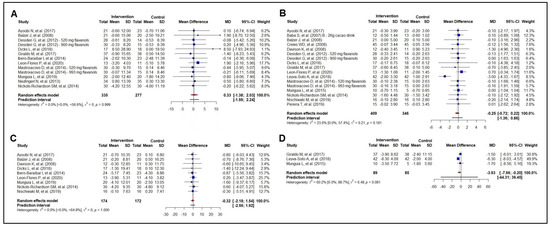
Figure 2.
Forest plot summarizing the results from the meta-analysis regarding the effects of cocoa consumption on anthropometric measurements versus control group. Panel (A): body weight: Ayoobi et al. 2017 [35]; Balzer et al. 2008 [53]; Desideri et al. 2012 [38]; Dicks et al. 2018 [32]; Giraldo et al. 2017 [50]; Ibero-Baraibar et al. 2014 [34]; León-Flores et al. 2020 [51]; Mastroiacovo et al. 2015 [39]; Munguia et al. 2019 [45]; Neufingerl et al 2013 [49]; Nickols-Richardson et al. 2014 [46]. panel (B): body mass index: Ayoobi et al. 2017 [35]; Baba et al. 2007 [37]; Balzer et al. 2008 [53]; Crews et al. 2008 [57]; Davison et al. 2008 [40]; Desideri et al. 2012 [38]; Dicks et al. 2018 [32]; Giraldo et al. 2017 [50]; León-Flores et al. 2020 [51]; Leyva-Soto et al. 2018 [58]; Mastroiacovo et al. 2015 [39]; Munguía et al. 2015 [44]; Nickols-Richardson et al. 2014 [46]; Nishiwaki et al. 2019 [41]; Pereira et al. 2019 [33]. panel (C): waist circumference: Ayoobi et al. 2017 [35]; Balzer et al. 2008 [53]; Davison et al. 2008 [40]; Dicks et al. 2018 [32]; Ibero-Baraibar et al. 2014 [34]; León-Flores et al. 2020 [51]; Munguia et al. 2019 [45]; Nickols-Richardson et al. 2014 [46]; Nishiwaki et al. 2019 [41]. panel (D): abdominal circumference: Giraldo et al. 2017 [50]; Leyva-Soto et al. 2018 [58]; Munguía et al. 2015 [44].
As for abdominal circumference (three studies; n = 174), our meta-analysis showed a reduction in abdominal circumference by 3.93 cm (95% CI −7.66 to −0.20 cm) (Figure 2D). However, there was moderate heterogeneity across the studies [60.2% (0.0%; 88.7%)]. Two studies coincided with the null line, and one study showed a favorable effect of the cocoa intervention.
Meta-regressions analyzing the potential effect modifiers, including the baseline total body mass, baseline waist circumference, baseline BMI, age, number of interventions, and amount of polyphenol intake, found no effect for the variables of total body mass, waist circumference, and abdominal circumference. However, in the intervention group, the baseline BMI proved to be an effect modifier, with an effect modification of 77.88% (p = 0.034). For every increase in baseline BMI of 1.0 kg/m2, there was a reduction of 0.14 kg/m2 following the cocoa intervention. A sensitivity analysis for the anthropometric measurements is available in Supplementary Material File S5.
3.3. Meta-Analysis of the Effect on Lipid Profile
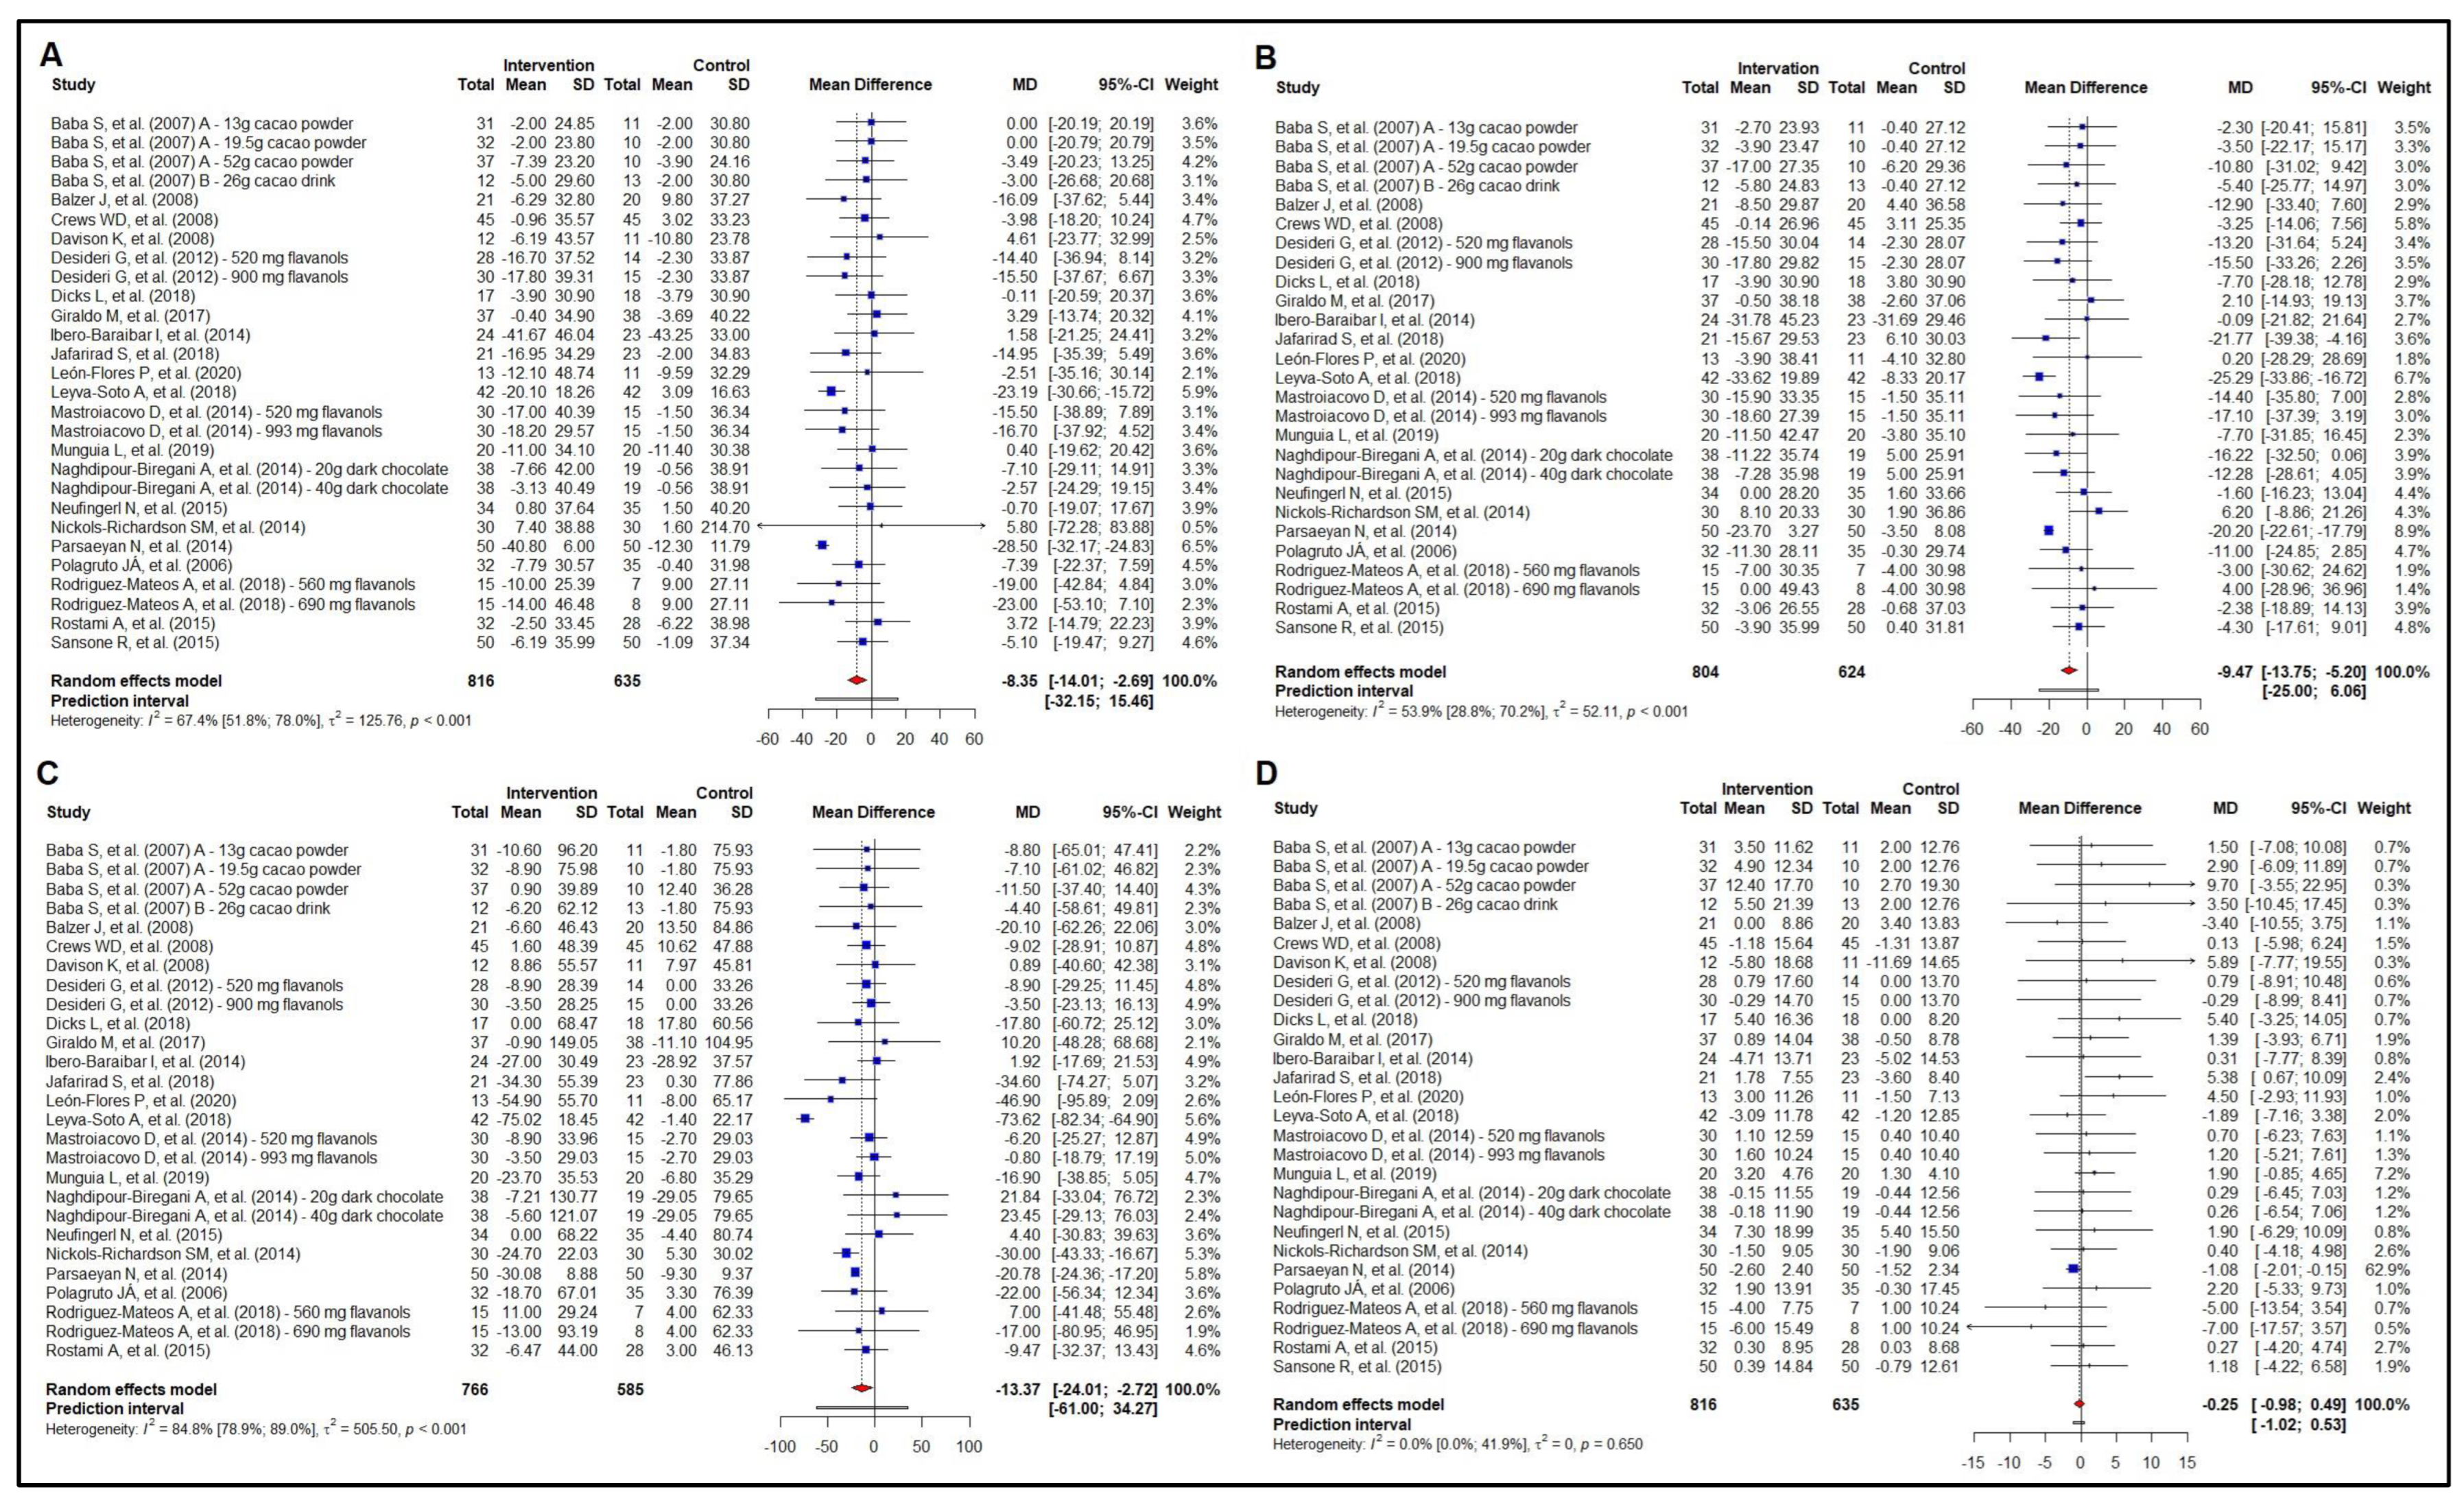
Twenty-two studies examined the effect of cocoa consumption on total cholesterol (n = 1451), evaluating a wide range of cocoa percentages. Dietary cocoa consumption effectively reduced total cholesterol by −8.35 mg/dL (95% CI −14.01 to −2.69 mg/dL) (Figure 3A). Interestingly, the subgroup analysis by health status (healthy vs. unhealthy) (Figure S4, Supplementary Material File S2) showed a reduction in total cholesterol of −7.11 mg/dL (95% CI −12.13 to −2.09 mg/dL) in unhealthy participants and of −7.37 mg/dL (95% CI −15.38 to 0.63 mg/dL) in healthy participants, though with no difference in the effect size between these groups (p = 0.959). Furthermore, this effect seems to be associated with a daily polyphenol intake above the median (369.7 mg) found in our meta-analysis (Figure S14, Supplementary Material File S3).
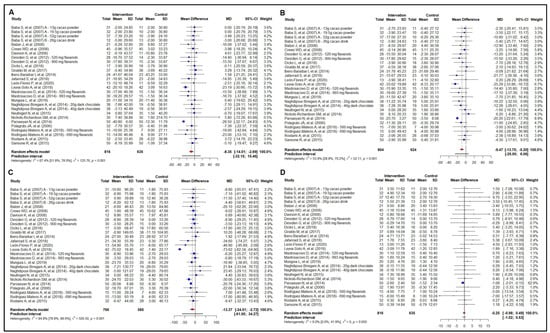
Figure 3.
Forest plot summarizing the results from the meta-analysis regarding the effects of cocoa consumption on lipid profile versus control group. Panel (A): total cholesterol; panel (B): low-density lipoprotein cholesterol (LDL-c). Baba et al. 2007 [37]; Baba et al. 2007 [36]; Balzer et al. 2008 [53]; Crews et al. 2008 [57]; Desideri et al. 2012 [38]; Dicks et al. 2018 [32]; Giraldo et al. 2017 [50]; Ibero-Baraibar et al. 2014 [34]; Jafarirad et al. 2018 [52]; León-Flores et al. 2020 [51]; Leyva-Soto et al. 2018 [58]; Mastroiacovo et al. 2015 [39]; Munguia et al. 2019 [45]; Naghdipour-Biregani et al. 2014 [54]; Neufingerl et al 2013 [49]; Nickols-Richardson et al. 2014 [46]; Parsaeyan et al. 2014 [56]; Polagruto et al. 2006 [55]; Rodriguez-Mateos et al. 2018 [47]; Rostami et al. 2015 [42]; Sansone et al. 2015 [48]. panel (C): triglycerides; Baba et al. 2007 [37]; Baba et al. 2007 [36]; Balzer et al. 2008 [53]; Crews et al. 2008 [57]; Davison et al. 2008 [40]; Desideri et al. 2012 [38]; Dicks et al. 2018 [32]; Giraldo et al. 2017 [50]; Ibero-Baraibar et al. 2014 [34]; Jafarirad et al. 2018 [52]; León-Flores et al. 2020 [51]; Leyva-Soto et al. 2018 [58]; Mastroiacovo et al. 2015 [39]; Munguia et al. 2019 [45]; Naghdipour-Biregani et al. 2014 [54]; Neufingerl et al 2013 [49]; Nickols-Richardson et al. 2014 [46]; Parsaeyan et al. 2014 [56]; Polagruto et al. 2006 [55]; Rodriguez-Mateos et al. 2018 [47]; Rostami et al. 2015 [42]; and panel (D): high-density lipoprotein cholesterol (HDL-c). Panel (A,D): Baba et al. 2007 [37]; Baba et al. 2007 [36]; Balzer et al. 2008 [53]; Crews et al. 2008 [57]; Davison et al. 2008 [40]; Desideri et al. 2012 [38]; Dicks et al. 2018 [32]; Giraldo et al. 2017 [50]; Ibero-Baraibar et al. 2014 [34]; Jafarirad et al. 2018 [52]; León-Flores et al. 2020 [51]; Leyva-Soto et al. 2018 [58]; Mastroiacovo et al. 2015 [39]; Munguia et al. 2019 [45]; Naghdipour-Biregani et al. 2014 [54]; Neufingerl et al 2013 [49]; Nickols-Richardson et al. 2014 [46]; Parsaeyan et al. 2014 [56]; Polagruto et al. 2006 [55]; Rodriguez-Mateos et al. 2018 [47]; Rostami et al. 2015 [42]; Sansone et al. 2015 [48].
The meta-analysis of the effect of cocoa consumption on LDL-c included the same above-mentioned studies that evaluated total cholesterol. However, the [51,55] study was excluded from this analysis, as we detected outlier values for LDL-c [40] in the sensitivity analysis and found a non-overlapping 95% CI with other studies. The analysis showed a reduction in LDL-c of −9.47 mg/dL (95% CI −13.75 to −5.20) with cocoa consumption (Figure 3B). The sub-analyses by health status (healthy vs. unhealthy) showed a reduction in LDL-c of −8.44 mg/dL (95% CI −13.03 to −3.85) only among the participants with unhealthy status (Figure S5, Supplementary Material File S2). The beneficial effects on LDL-c seem to be independent of the daily amount of polyphenol intake (Figure S15, Supplementary Material File S3).
Figure 3C shows the results of the meta-analysis of the effect of cocoa consumption on triglycerides. The effect size in reducing triglycerides was −13.37 mg/dL (95% CI −24.01 to −2.72 mg/dL). We also carried out subgroup analyses. Interestingly, the effect of cocoa consumption (Figure S6, Supplementary Material File S2) and daily polyphenol intake (Figure S16, Supplementary Material File S3) was no longer seen in both unhealthy and healthy participants.
Finally, as for the effect of cocoa consumption on HDL-c (Figure 3D), our analysis included the same studies as mentioned above for total cholesterol and LDL-c. Yet, it showed no effect on HDL-c. The same was seen in the subgroup analyses by health status (unhealthy vs. healthy) (Figure S7, Supplementary Material File S2) and daily amount of polyphenol intake (Figure S17, Supplementary Material File S3).
Meta-regressions analyzing potential effect modifiers (age, number of interventions, amount of polyphenol intake and baseline values of total body mass, total cholesterol, LDL-c, HDL-c, triglycerides, and BMI) were not found for the variables of total cholesterol, LDL-c, and HDL-c. However, for triglycerides, baseline BMI in the intervention group (61.82%; p = 0.025) and age in the intervention group (77.58%; p = 0.001) and control group (78.10%; p = 0.001) proved to be a strong effect modifier. In addition, we found a reduction in triglycerides of 3.06 mg/dL in the intervention group for every increase in baseline BMI of 1.0 kg/m2. As for age, in both the intervention and control groups, the data showed an increase in triglycerides of 0.84 mg/dL for every one-year increase in the participants’ age. A sensitivity analysis for the lipid profile is available in Supplementary Material File S5.
3.4. Meta-Analysis of the Effect on Glycemic Profile
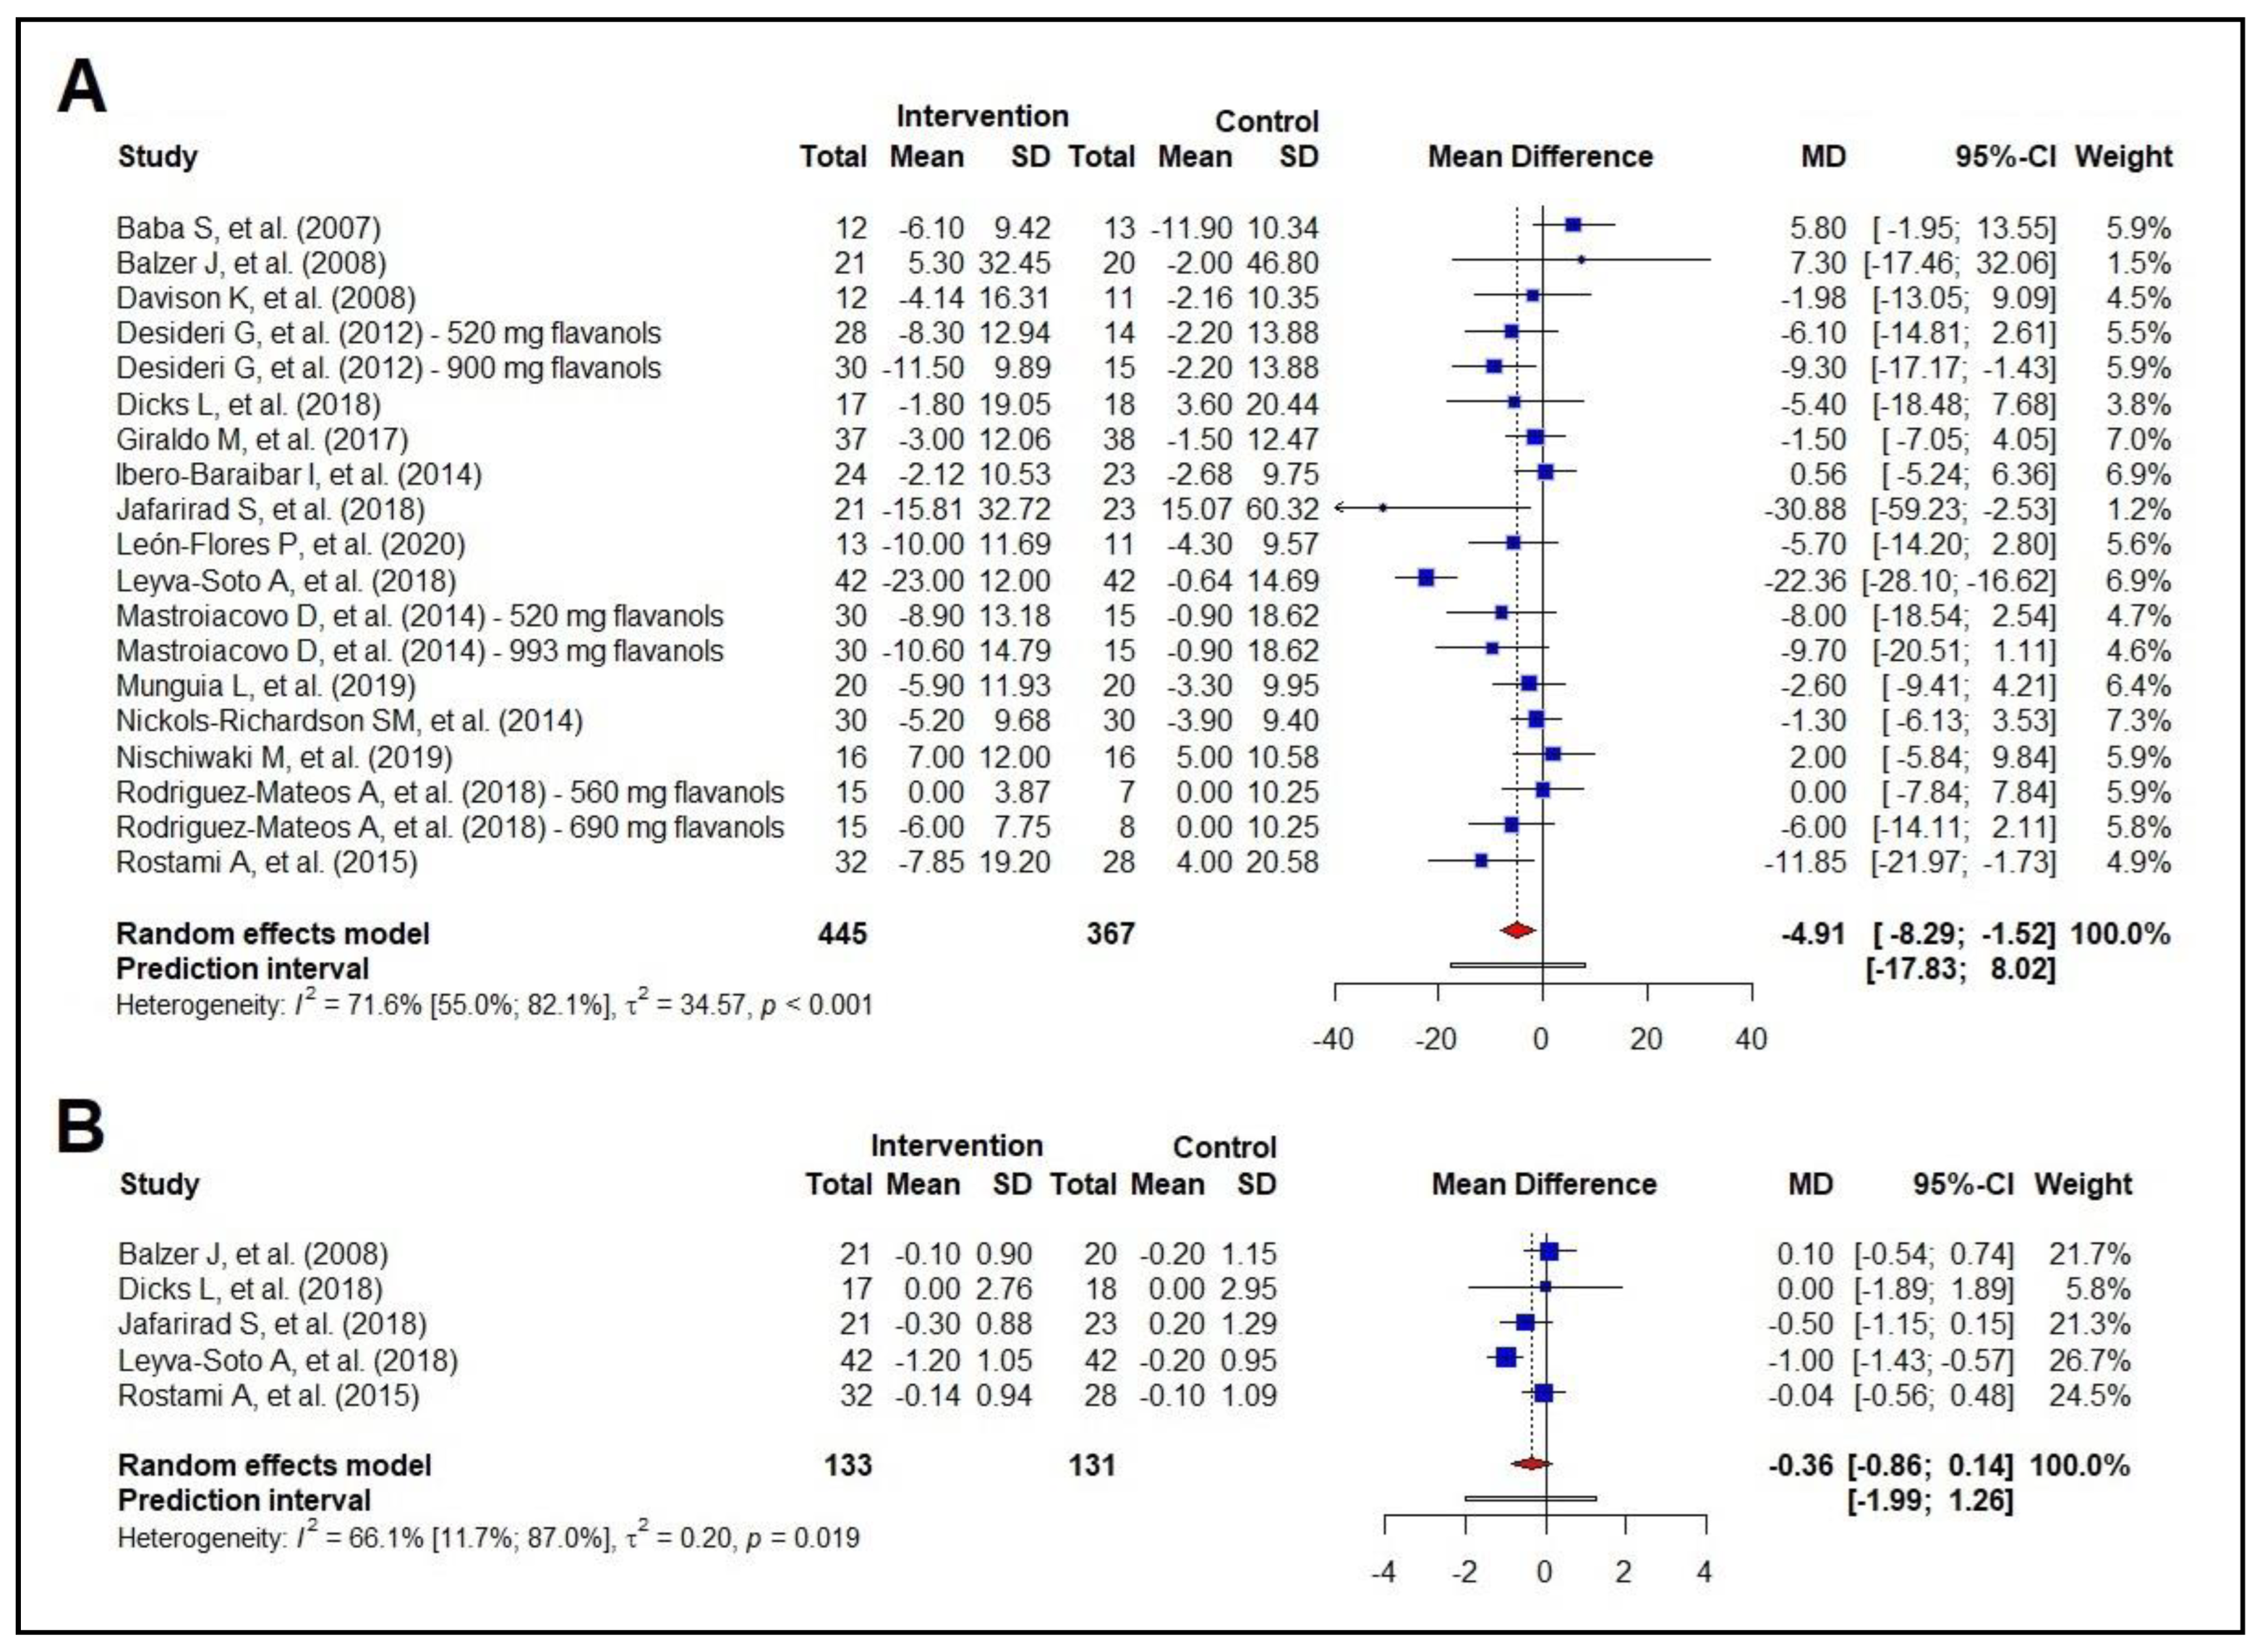
The results showed a reduction of −4.91 mg/dL in blood glucose in response to cocoa consumption (95% CI −8.29 to −1.52 mg/dL) (Figure 4A). Cocoa consumption led to a reduction in fasting blood glucose of −4.57 mg/dL (95% CI −8.37 to −0.77) only among the participants with an unhealthy status (Figure S8, Supplementary Material File S2). It is worth noting that this effect seems to be significant when the polyphenol intake is above the median (479.0 mg) (Figure S18, Supplementary Material File S3).
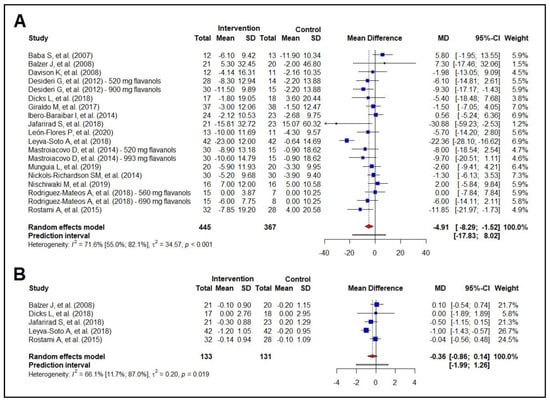
Figure 4.
Forest plot summarizing the results from the meta-analysis regarding the effects of cocoa consumption on glycemic markers versus control group. Panel (A): fasting blood glucose, Baba et al. 2007 [37]; Balzer et al. 2008 [53]; Davison et al. 2008 [40]; Desideri et al. 2012 [38]; Dicks et al. 2018 [32]; Giraldo et al. 2017 [50]; Ibero-Baraibar et al. 2014 [34]; Jafarirad et al. 2018 [52]; León-Flores et al. 2020 [51]; Leyva-Soto et al. 2018 [58]; Mastroiacovo et al. 2015 [39]; Munguia et al. 2019 [45]; Nickols-Richardson et al. 2014 [46]; Nishiwaki et al. 2019 [41]; Rodriguez-Mateos et al. 2018 [47]; Rostami et al. 2015 [42]; panel (B): glycated hemoglobin. Balzer et al. 2008 [53]; Dicks et al. 2018 [32]; Jafarirad et al. 2018 [52]; Leyva-Soto et al. 2018 [58]; Rostami et al. 2015 [42].
The other outcome of interest in glucose metabolism was HbA1c, and the results showed no effect of cocoa consumption on HbA1c (Figure 4B). Considering a borderline significance and the small number of studies evaluating HbA1c, further investigations may reveal a trend and help test new hypotheses about the effects of cocoa consumption on glucose metabolism.
Meta-regressions analyzing potential effect modifiers, including baseline total body mass, baseline fasting blood glucose, baseline BMI, age, number of interventions, and amount of polyphenol intake did not show these variables to be effect modifiers for fasting blood glucose. Due to the small number of studies evaluating the effect of cocoa on HbA1c, we could not perform a meta-regression. A sensitivity analysis for fasting blood glucose and HbA1c is available in Supplementary Material File S5.
3.5. Meta-Analysis of the Effect on Blood Pressure
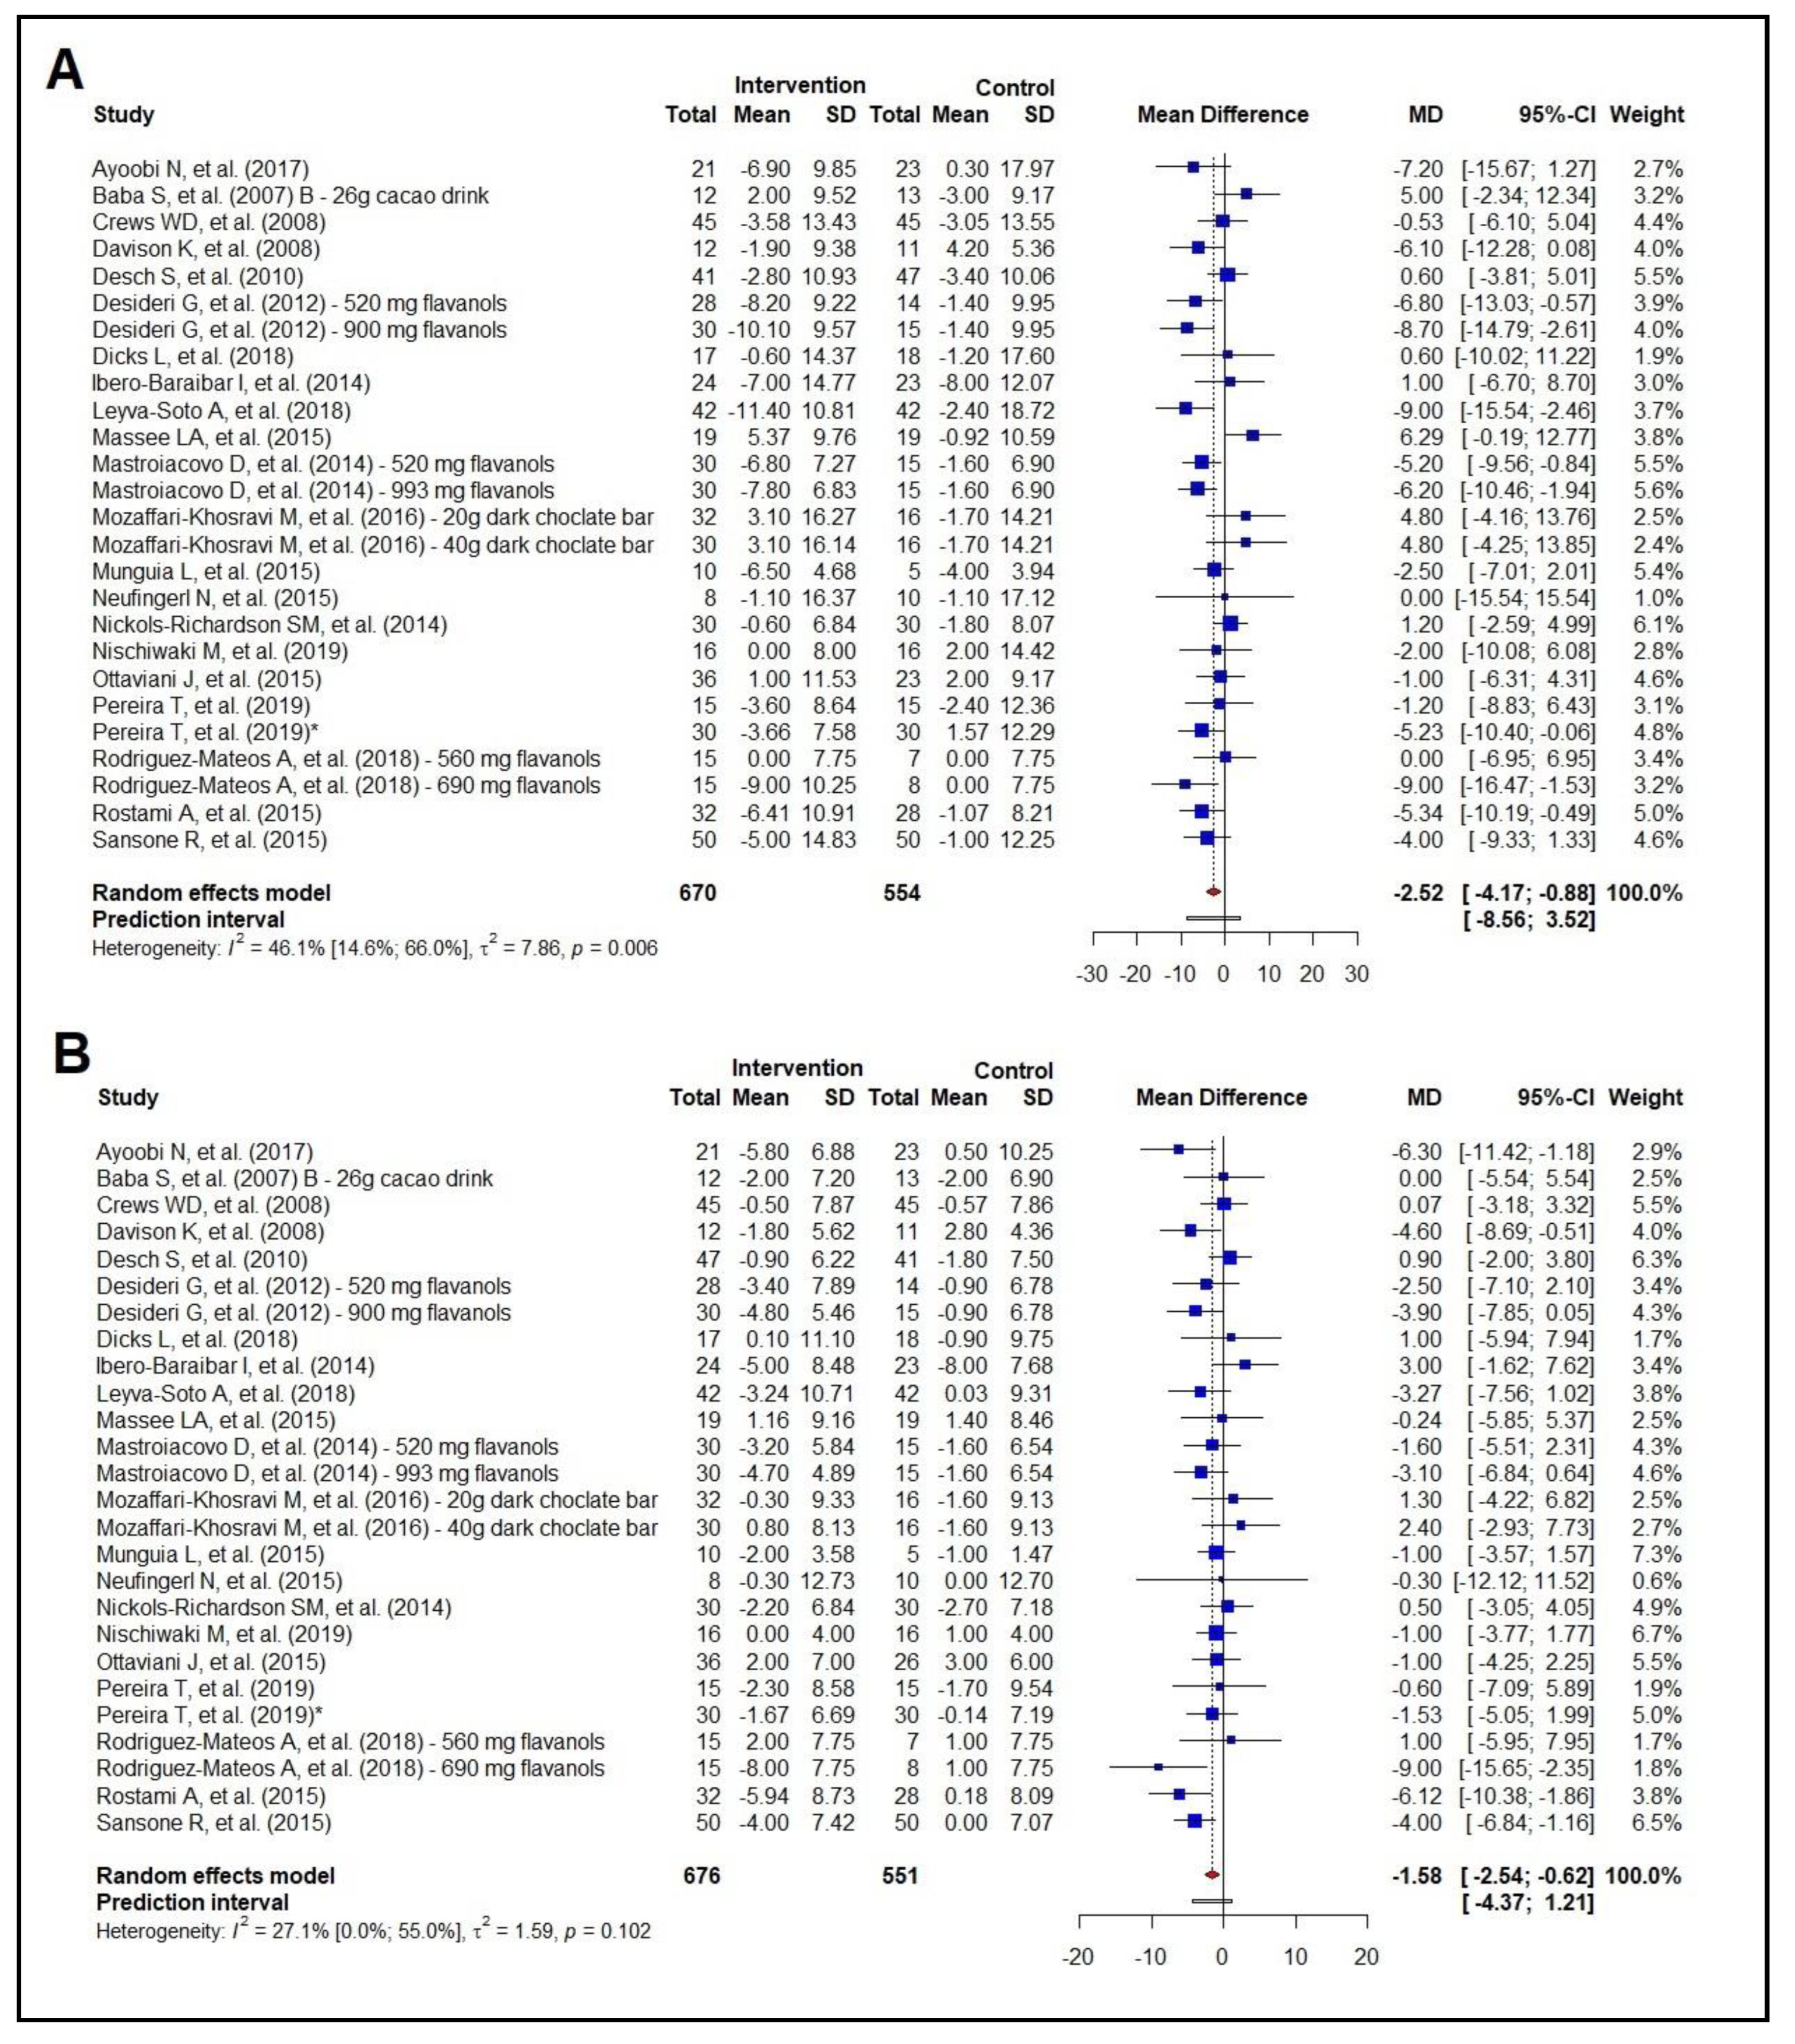
The overall analysis of the effect of cocoa consumption on blood pressure involved 22 studies (n = 1224) and showed a reduction in SBP of −2.52 mmHg (95% CI −4.17 to −0.88 mmHg) and a reduction in DBP of −1.58 mmHg (95% CI −2.54 to −0.62 mmHg) (Figure 5A,B). The subgroup analyses by health status showed a reduction in SBP of −2.72 mmHg (95% CI −5.05 to −0.40) in the unhealthy group but no effect in the healthy group (MD −1.51 mmHg; 95% CI −4.29 to 1.26) (Figure S9, Supplementary Material File S2). In addition, they showed no effect on DBP in the unhealthy group (MD −1.41 mmHg; 95% CI −2.99 to 0.18), but a reduction in DBP of −1.59 mmHg (95% CI −2.81 to −0.37 mmHg) in the healthy group (Figure S10, Supplementary Material File S2).
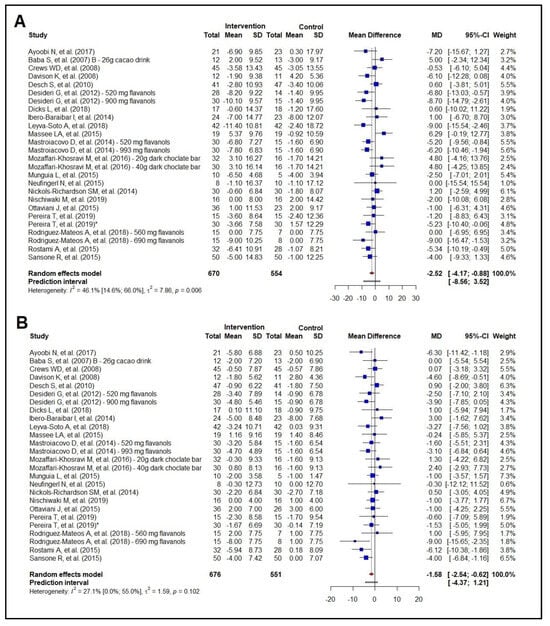
Figure 5.
Forest plot summarizing the results from the meta-analysis regarding the effects of cocoa consumption on blood pressure versus control group. Panel (A): systolic blood pressure. Ayoobi et al. 2017 [35]; Baba et al. 2007 [37]—26 g; Crews et al. 2008 [57]; Davison et al. 2008 [40]; Desch et al. 2010 [43]; Desideri et al. 2012 [38]; Dicks et al. 2018 [32]; Ibero-Baraibar et al. 2014 [34]; Leyva-Soto et al. 2018 [58]; Massee et al. 2015 [30]; Mastroiacovo et al. 2015 [39]; Mozaffari-Khosravi et al. 2016 [29]; Munguía et al. 2015 [44]; Neufingerl et al 2013 [49]; Nickols-Richardson et al. 2014 [46]; Nishiwaki et al. 2019 [41]; Ottaviani et al. 2015 [31]; Pereira et al. 2019 [33]; Rodriguez-Mateos et al. 2018 [47]; Rostami et al. 2015 [42]; Sansone et al. 2015 [48]; panel (B): diastolic blood pressure. Ayoobi et al. 2017 [35]; Baba et al. 2007 [37]—26 g; Crews et al. 2008 [57]; Davison et al. 2008 [40]; Desch et al. 2010 [43]; Desideri et al. 2012 [38]; Dicks et al. 2018 [32]; Ibero-Baraibar et al. 2014 [34]; Leyva-Soto et al. 2018 [58]; Massee et al. 2015 [30]; Mastroiacovo et al. 2015 [39]; Mozaffari-Khosravi et al. 2016 [29]; Munguía et al. 2015 [44]; Neufingerl et al 2013 [49].
The lowering of BP levels seems to be dependent upon the amount of polyphenol intake, as reductions in SBP and DBP were seen only with a daily polyphenol intake above the median (432.2 mg/day) (Figures S19 and S20, Supplementary Material File S3).
Meta-regressions were performed to analyze the potential effect modifiers (baseline body mass, baseline BMI, baseline waist circumference, baseline SBP/DBP, age, number of interventions, and amount of polyphenol intake) for BP levels. For SBP, only the baseline SBP values in the intervention group (72.47%; p = 0.001) and the control group (48.18%; p = 0.007) proved to be an effect modifier. For every 1.0 mmHg increase in baseline SBP, there was a reduction of 0.27 mmHg in the intervention group and 0.24 mmHg in the control group. We did not find an effect modification for DBP. A sensitivity analysis for BP is available in the Supplementary Material File S5.
3.6. Risk of Bias Assessment (RoB 2) and Strength of Evidence (GRADE)
A risk of bias assessment using the RoB 2 tool showed that all RCTs reported randomization [29,30,31,32,33,34,35,36,37,38,39,40,41,42,43,44,45,46,47,48,49,50,51,52,53,54,55,56,57,58,59] of the intervention. Of a total of 31 RCTs included in this meta-analysis, 20 reported blinded the evaluators and participants [30,31,32,33,34,36,37,38,39,40,42,44,45,47,48,49,50,55,57,58], four blinded the evaluators only [35,43,52,56], one blinded the participants only [51], two reported no blinding [41,59] and four did not report the blinding process [36,46,54,56].
Of the 31 studies included in this meta-analysis, nine showed a low risk of bias [17,23,34,40,52,60,61,62,63], as they met the RoB 2 criteria, including prior registration of studies on clinical trial registry platforms. The remaining 22 articles showed some concerns of bias, mostly because they did not present consistent data, especially in the reporting of outcomes domain (“Selection of the reported results”, Figure S31, Supplementary Material File S4).
GRADE was used to assess the strength of the evidence [64]. We rated as “moderate quality” outcomes related to anthropometric measurements (total body mass, BMI, waist circumference, and abdominal circumference) (Table S2, Supplementary Material File S4), lipid profile (total cholesterol, LDL-c, triglycerides, and HDL-c) (Table S3, Supplementary Material File S4), glycemic profile (fasting blood glucose and HbA1c) (Table S4, Supplementary Material File S4), and SBP and DBP (Table S5, Supplementary Material File S4). We chose to downgrade these outcomes by one point in the imprecision domain due to the different characteristics of the samples evaluated and wide confidence intervals. Though there was moderate heterogeneity in the results for some outcomes, we were able to conduct subgroup analyses, meta-regression analysis, and risk of publication bias assessment and, thus, did not rate down the quality of evidence due to inconsistency (heterogeneity), as recommended in the literature [15,25].
4. Discussion
We conducted a meta-analysis of RCTs to examine the long-term effects of cocoa consumption on cardiometabolic risk markers, including anthropometric measurements (total body weight, BMI, and waist and abdominal circumference), lipid profile (total cholesterol, LDL-c, triglycerides, and HDL-c), fasting blood glucose and HbA1c, and BP levels (SBP and DBP). The main findings of our study include: (i) cocoa consumption did not consistently reduce body weight, BMI, or waist circumference; (ii) on the other hand, cocoa polyphenol intake reduced total cholesterol (−8.35 mg/dL) and LDL-c (−9.47 mg/dL), but it did not reduce triglycerides and HDL-c; (iii) cocoa consumption was associated with a reduction in fasting blood glucose (−4.91 mg/dL), but not in HbA1c; and (iv) our meta-analysis showed that cocoa consumption reduced both SBP (−2.52 mmHg) and DBP levels (−1.58 mmHg), especially at higher amounts of polyphenol intake. In summary, cocoa consumption showed a protective effect on major cardiometabolic risk markers with a clinically significant impact in terms of cardiovascular risk reduction.
Concerning anthropometric measurements, catechins are the main type of compounds present in cocoa that apparently promote favorable effects on body composition. In addition, cocoa consumption seems to be associated with improved insulin sensitivity in animal models [60], but the findings in the literature are inconsistent in humans. A review of 35 RCTs examined the effects of cocoa and dark-chocolate consumption on total body weight, BMI, and waist circumference [65]. The meta-analysis showed no favorable effects of cocoa supplementation on body weight (MD −0.108 kg; 95% CI −0.262 to 0.046 kg), BMI (MD −0.014 kg/m2; 95% CI −0.105 to 0.077 kg/m2), and waist circumference (0.025 cm; 95% CI −0.083 to 0.129 cm) [65]. In contrast, an RCT evaluating a regular dietary intake of 99% cocoa dark chocolate (10 g; 64.5 mg of polyphenols) in 132 postmenopausal women for six months reported reductions in both total body weight (−0.63 kg; 95% CI −1.15 to −0.11 kg) and relative fat (−0.79%; 95% CI −1.31 to −0.26%), but no effect on BMI [66]. Despite these favorable results, the effect size was considered not clinically significant, with little or no impact in terms of reducing cardiometabolic outcomes.
Our results showed no effect of cocoa consumption on anthropometric measurements, except for abdominal circumference. However, our analysis was limited, as it included only three RCTs [44,50,58], and cocoa effectiveness was suggested in only one of them [58]. The subgroup analysis by health status (healthy vs. unhealthy individuals with comorbidities) or amount of polyphenol intake found no evidence in favor of cocoa consumption.
As for lipid profile, observational studies have identified high cholesterol and its fractions as modifiable risk factors for coronary artery disease and stroke [67,68,69,70]. A meta-analysis of 61 prospective studies and 55,000 vascular deaths demonstrated that a reduction of 1 mmol/L (38.7 mg/dL) in total cholesterol was associated with a 0.44 (95% CI 0.42 to 0.48 mg/dL) decrease in the risk of death from coronary artery disease in individuals of both sexes aged 40–49 years, a 0.66 decrease risk of death (95% CI 0.65 to 0.68) in those aged 50–69 years, and 0.83 risk of death (95% CI 0.81 to 0.85) in those aged 70–89 years [67]. Another meta-analysis pooled together data from 312,321 participants and found that a reduction in LDL-c levels was associated with a 54.5% decrease (95% CI 48.8 to 59.5%) in the risk of developing coronary heart disease for each one mmol/L (38.7 mg/dL) reduction in LDL-c [69]. Furthermore, Baigent et al. [71] reported a 12% proportional reduction in all-cause mortality for each one mmol/L reduction in LDL-c and, notably, a 19% reduction in coronary ischemic deaths [71]. A mechanistic hypothesis can help explain the observed reduction in total cholesterol and LDL-c that would be attributed to the action of flavonoids present in cocoa [12], especially procyanidins present in the form of monomers, oligomers, or polymers [63,72]. These compounds inhibit the absorption of cholesterol as well as the expression of LDL-c receptors [73,74]. Yet, our study found that cocoa consumption did not change triglyceride and HDL-c levels. The most likely explanation is that triglycerides levels are traditionally sensitive to a decrease in simple sugars and alcohol consumption [75], and these substances are not present in cocoa. Likewise, HDL-c levels are influenced by high consumption of mono and/or polyunsaturated fats (HDL-c) [75], which are also not present in high concentrations in cocoa. It is, thus, reasonable to expect no changes in these markers following polyphenol intake.
Reduced total cholesterol and LDL-C are associated with cardiovascular protection and lower mortality rates. Although our meta-analysis showed modest effects in reducing total cholesterol (−8.35 mg/dL, Figure 3A) and LDL-c (−9.47 mg/dL, Figure 3B), regular dietary intake of cocoa is an interesting strategy for reducing the occurrence of cardiovascular events when considering individual levels of total cholesterol and LDL-c.
Regarding glycemic profile, our systematic review and meta-analysis included 15 studies evaluating fasting glycemia. Our results showed a reduction of −4.91 mg/dL (Figure 4A) in response to cocoa consumption. Also, the subgroup analyses by health status (healthy vs. unhealthy participants with cardiometabolic comorbidities) demonstrated that cocoa consumption led to a reduction in fasting blood glucose of −4.57 mg/dL (95% CI −8.37 to −0.77) only among the participants with an unhealthy status. This effect becomes significant when polyphenol intake is above the median estimated for this outcome. Although cocoa consumption proved to have a beneficial effect on the glycemic profile, HbA1c levels remained unchanged (Figure 3B). However, it is well-known that changes in HbA1c levels become evident after three months. Interestingly, the intervention durations of five studies evaluating HbA1c included in this meta-analysis were as follows: four weeks in the [73,74] study; eight weeks in the [73,74] and [73,74] studies; 12 weeks in the [73,74] study; and 24 weeks in the [73,74] study. A favorable effect on HbA1c was reported in a single RCT with the longest duration, i.e., 24 weeks (Figure 4B). Therefore, other RCTs with longer intervention duration (≥12 weeks) are needed to provide supporting evidence of the effect of cocoa consumption on HbA1c.
Regarding BP levels, our results are in line with the findings reported by Desch, et al. [76] in a meta-analysis that showed a reduction in SBP of −4.5 mmHg and in DBP of −2.5 mmHg following the consumption of dark chocolate and cocoa beverages. In their meta-analysis, Desch et al. [76] examined the effects associated with grape polyphenol consumption and reported a reduction in SBP (−1.48 mmHg) but no effect on DBP [62]. The exact mechanisms for BP reduction associated with the consumption of cocoa products have not yet been fully elucidated. Yet, it has been postulated that it stimulates the formation of endothelial nitric oxide that promotes endothelium-dependent vasodilation, resulting in greater arterial compliance and lower peripheral vascular resistance [77].
Studies on the dietary intake of foods rich in phenolic acids, especially flavonoids such as anthocyanins, have demonstrated vascular protection and increased arterial compliance [61,78]. Our research group has proven that the consumption of anthocyanins, such as açai-jucara fruit (Euterpe edulis Martius), effectively protects against arterial stiffness [79], but does not act on endothelium-dependent dilation. Thus, another hypothesis for the reduction of BP levels is that cocoa flavonoids may inhibit the activity of the angiotensin-converting enzyme and promote BP reduction [80,81].
With regard to the amount of polyphenol intake, a double-blind RCT showed reductions of SBP (−3.0 mmHg) and DBP (−1.9 mmHg), even with low amounts of polyphenol intake (30 mg) in individuals with pre-hypertension or stage 1 hypertension [82]. However, our results suggest BP effects only with amounts of cocoa intake above the median calculated from selected RCTs (Figure S20, Supplementary Material File S3). This contrasting finding may be due to the different populations studied. [80,81] evaluated individuals with pre-hypertension or stage 1 hypertension, while our meta-analysis included participants with more diverse characteristics and comorbidities that likely require higher polyphenol amounts to effectively reduce BP levels. In summary, lowering BP even at a modest magnitude has well-documented and important clinical implications; a 4–5 mmHg decrease in SBP can lower cardiovascular risk by 8–20% [62,83]. Our study showed an effect size of −2.52 mmHg for SBP and −1.58 mmHg for DBP. And, this effect may be enhanced at higher amounts of polyphenol intake (SBP −4.66 mmHg; DBP −2.68 mmHg).
We emphasize the need for careful evaluation of dietary intake and/or supplementation of foods rich in polyphenols, including cocoa in pregnant women, especially in the third trimester. Numerous evidence indicate fetal ductus arteriosus constriction due to the anti-inflammatory and antioxidant actions of polyphenols and the inhibition of circulating prostaglandins E2 [84] that may result in fetal complications [85,86]. The literature recommends that pregnant women should limit their intake of foods and supplements rich in polyphenols (≥30 mg/100 g), with a recommended maximum daily intake of 125 mg of polyphenols [87].
Our study has some limitations. The RCTs included in this review evaluated different populations undergoing a variety of interventions in terms of cocoa products consumed (e.g., dry cocoa-extract capsules, >70% cocoa chocolate, cocoa bars or beverages, and cocoa mixed in the meal ingredients); duration (4–24 weeks); and polyphenol and flavonoid concentrations. Therefore, there was relatively high heterogeneity across the studies. However, we used a range of strategies, including subgroup analyses, meta-regressions, overlapping confidence intervals, and sensitivity analyses, to try to explain the source of the heterogeneity found. At the same time, we used a random-effects model to describe the summarized data. Because it takes into account the sample size and the variability of effects across the included studies, it allows for extrapolating the impact of the results to different populations, providing a more comprehensive analysis. Another issue was the studies that evaluated dietary cocoa intake through the consumption of dark chocolate. These products contain different types and amounts of sugar, milk, and chemical ingredients, among others, which may affect some of the outcomes evaluated. Other limitations included studies lacking blinding and/or having inadequate controls (e.g., white chocolate used as a ‘placebo’). Regarding potential biases, we used the RoB2 tool. Yet, this tool does not consider concepts such as the quality of reporting, precision (the extent to which results are free of random errors), or external validity (directness, applicability, or generalization) [64]. However, factors such as journal of publication, year of publication, country of origin, and omission of negative or unpublished data could be a source of location bias, selective (non-) reporting bias, and publication bias in this review. Considering the inclusion of searches in the non-traditional literature, no eligible study showed a high risk of bias by RoB2. Overall, despite these limitations, they do not diminish the validity of the findings in this meta-analysis.
5. Conclusions
We conclude that the consumption of cocoa as a dietary supplement in cocoa extract capsules or dark-chocolate products has a protective effect on most cardiometabolic risk markers evaluated in this analysis, including total cholesterol, LDL-c, fasting blood glucose, SBP, and DBP. As for total body weight, BMI, waist or abdominal circumference, triglycerides, and HDL-c, there is no evidence supporting the beneficial effects of cocoa consumption. Thus, we recommend the consumption of cocoa rich in polyphenols as a cardioprotective approach.
Long-term, multicenter well-designed RCTs are needed to confirm or refute our findings. In addition, the positive effects of cocoa should be demonstrated not only in surrogate outcomes but also in clinical trials assessing cardiovascular events in populations in primary and secondary prevention. Nevertheless, considering our results, we suggest that the consumption of polyphenol-rich cocoa could be part of a strategy aimed at promoting cardiovascular health.
Supplementary Materials
The following supporting information can be downloaded at https://www.mdpi.com/article/10.3390/nu16121919/s1: Supplementary Material File S1: Search strategy. Supplementary Material File S2: Analyses by health status. Supplementary Material File S3: Analysis by daily amount of polyphenol intake. Supplementary Material File S4: Risk of bias and strength of evidence. Supplementary Material File S5: Sensitivity Analyzes.
Author Contributions
Conceptualization, T.O.P.A., A.M.L. and G.W.; Methodology, T.O.P.A., D.S.d.S., E.S., C.W., P.C.d.O. and G.W.; Software, G.W.; Validation, A.M.L. and A.M.; Formal Analysis, A.M.L. and G.W.; Investigation, T.O.P.A., D.S.d.S., E.S., C.W. and P.C.d.O.; Data Curation, T.O.P.A., A.M.L. and G.W.; Writing—Original Draft Preparation, T.O.P.A.; Writing—Review and Editing, A.M.L. and A.M.; Visualization, A.M.L.; Supervision, A.M.L. and G.W. All authors have read and agreed to the published version of the manuscript.
Funding
This research received no external funding.
Data Availability Statement
The databases and script (Rstudio, version 1.3.959, and the R package meta version 3.6.1 for Windows) used in this systematic review for the metanalysis are available on the Mendeley Data repository as open access (https://data.mendeley.com/; doi:10.17632/mwtwh6d8ws.1, accessed on 17 May 2024).
Conflicts of Interest
The authors declare no conflicts of interest.
References
- Oliveira, G.; Brant, L.; Polanczyk, C.; Malta, D.; Biolo, A.; Nascimento, B.; Souza, M.; Lorenzo, A.; Fagundes Júnior, A.; Schaan, B.; et al. Estatística Cardiovascular–Brasil 2021. Arq. Bras. Cardiol. 2022, 118, 115–373. [Google Scholar] [CrossRef] [PubMed]
- Mahmood, S.S.; Levy, D.; Vasan, R.S.; Wang, T.J. The Framingham Heart Study and the epidemiology of cardiovascular disease: A historical perspective. Lancet 2014, 383, 999–1008. [Google Scholar] [CrossRef] [PubMed]
- D’Agostino, R.B.; Vasan, R.S.; Pencina, M.J.; Wolf, P.A.; Cobain, M.; Massaro, J.M.; Kannel, W.B. General cardiovascular risk profile for use in primary care: The Framingham Heart Study. Circulation 2008, 117, 743–753. [Google Scholar] [CrossRef] [PubMed]
- Parretti, H.M.; Jebb, S.A.; Johns, D.J.; Lewis, A.L.; Christian-Brown, A.M.; Aveyard, P. Clinical effectiveness of very-low-energy diets in the management of weight loss: A systematic review and meta-analysis of randomized controlled trials. Obes. Rev. 2016, 17, 225–234. [Google Scholar] [CrossRef] [PubMed]
- Sofi, F.; Dinu, M.; Pagliai, G.; Cesari, F.; Gori, A.M.; Sereni, A.; Becatti, M.; Fiorillo, C.; Marcucci, R.; Casini, A. Low-Calorie Vegetarian Versus Mediterranean Diets for Reducing Body Weight and Improving Cardiovascular Risk Profile: CARDIVEG Study (Cardiovascular Prevention With Vegetarian Diet). Circulation 2018, 137, 1103–1113. [Google Scholar] [CrossRef] [PubMed]
- Davies, M.J.; Aroda, V.R.; Collins, B.S.; Gabbay, R.A.; Green, J.; Maruthur, N.M.; Rosas, S.E.; Del Prato, S.; Mathieu, C.; Mingrone, G.; et al. Management of hyperglycaemia in type 2 diabetes, 2022. A consensus report by the American Diabetes Association (ADA) and the European Association for the Study of Diabetes (EASD). Diabetologia 2022, 65, 1925–1966. [Google Scholar] [CrossRef] [PubMed]
- Juraschek, S.P.; Miller, E.R., 3rd; Weaver, C.M.; Appel, L.J. Effects of Sodium Reduction and the DASH Diet in Relation to Baseline Blood Pressure. J. Am. Coll. Cardiol. 2017, 70, 2841–2848. [Google Scholar] [CrossRef] [PubMed]
- Tresserra-Rimbau, A.; Rimm, E.B.; Medina-Remon, A.; Martinez-Gonzalez, M.A.; Lopez-Sabater, M.C.; Covas, M.I.; Corella, D.; Salas-Salvado, J.; Gomez-Gracia, E.; Lapetra, J.; et al. Polyphenol intake and mortality risk: A re-analysis of the PREDIMED trial. BMC Med. 2014, 12, 77. [Google Scholar] [CrossRef] [PubMed]
- Bahramsoltani, R.; Ebrahimi, F.; Farzaei, M.H.; Baratpourmoghaddam, A.; Ahmadi, P.; Rostamiasrabadi, P.; Rasouli Amirabadi, A.H.; Rahimi, R. Dietary polyphenols for atherosclerosis: A comprehensive review and future perspectives. Crit. Rev. Food Sci. Nutr. 2019, 59, 114–132. [Google Scholar] [CrossRef] [PubMed]
- Tressera-Rimbau, A.; Arranz, S.; Eder, M.; Vallverdú-Queralt, A. Dietary Polyphenols in the Prevention of Stroke. Oxid. Med. Cell Longev. 2017, 2017, 7467962. [Google Scholar] [CrossRef]
- Meng, C.C.; Jalil, A.M.; Ismail, A. Phenolic and theobromine contents of commercial dark, milk and white chocolates on the Malaysian market. Molecules 2009, 14, 200–209. [Google Scholar] [CrossRef] [PubMed]
- Rudra, A.; Arvind, I.; Mehra, R. Polyphenols: Types, sources and therapeutic applications. Int. J. Home Sci. 2021, 7, 69–75. [Google Scholar] [CrossRef]
- Corti, R.; Flammer, A.J.; Hollenberg, N.K.; Lüscher, T.F. Cocoa and cardiovascular health. Circulation 2009, 119, 1433–1441. [Google Scholar] [CrossRef] [PubMed]
- Liberati, A.; Altman, D.G.; Tetzlaff, J.; Mulrow, C.; Gøtzsche, P.C.; Ioannidis, J.P.; Clarke, M.; Devereaux, P.J.; Kleijnen, J.; Moher, D. The PRISMA statement for reporting systematic reviews and meta-analyses of studies that evaluate healthcare interventions: Explanation and elaboration. BMJ 2009, 339, b2700. [Google Scholar] [CrossRef] [PubMed]
- Higgins, J.; Green, S. Cochrane Handbook for Systematic Reviews of Interventions, 2nd ed.; Wiley-Blackwell: Hoboken, NJ, USA, 2019; 694p. [Google Scholar]
- Robinson, K.A.; Dickersin, K. Development of a highly sensitive search strategy for the retrieval of reports of controlled trials using PubMed. Int. J. Epidemiol. 2002, 31, 150–153. [Google Scholar] [CrossRef] [PubMed]
- Glanville, J.; Foxlee, R.; Wisniewski, S.; Noel-Storr, A.; Edwards, M.; Dooley, G. Translating the Cochrane EMBASE RCT filter from the Ovid interface to Embase.com: A case study. Health Info Libr. J. 2019, 36, 264–277. [Google Scholar] [CrossRef] [PubMed]
- Ouzzani, M.; Hammady, H.; Fedorowicz, Z.; Elmagarmid, A. Rayyan-a web and mobile app for systematic reviews. Syst. Rev. 2016, 5, 210. [Google Scholar] [CrossRef] [PubMed]
- Whiting, P.; Savović, J.; Higgins, J.P.; Caldwell, D.M.; Reeves, B.C.; Shea, B.; Davies, P.; Kleijnen, J.; Churchill, R.; Group, R. ROBIS: A new tool to assess risk of bias in systematic reviews was developed. J. Clin. Epidemiol. 2016, 69, 225–234. [Google Scholar] [CrossRef] [PubMed]
- Sterne, J.A.C.; Savović, J.; Page, M.J.; Elbers, R.G.; Blencowe, N.S.; Boutron, I.; Cates, C.J.; Cheng, H.Y.; Corbett, M.S.; Eldridge, S.M.; et al. RoB 2: A revised tool for assessing risk of bias in randomised trials. BMJ 2019, 366, l4898. [Google Scholar] [CrossRef] [PubMed]
- Hultcrantz, M.; Rind, D.; Akl, E.A.; Treweek, S.; Mustafa, R.A.; Iorio, A.; Alper, B.S.; Meerpohl, J.J.; Murad, M.H.; Ansari, M.T.; et al. The GRADE Working Group clarifies the construct of certainty of evidence. J. Clin. Epidemiol. 2017, 87, 4–13. [Google Scholar] [CrossRef] [PubMed]
- Schunemann, H.J.; Brennan, S.; Akl, E.A.; Hultcrantz, M.; Alonso-Coello, P.; Xia, J.; Davoli, M.; Rojas, M.X.; Meerpohl, J.J.; Flottorp, S.; et al. The development methods of official GRADE articles and requirements for claiming the use of GRADE—A statement by the GRADE guidance group. J. Clin. Epidemiol. 2023, 159, 79–84. [Google Scholar] [CrossRef] [PubMed]
- IntHout, J.; Loannidis, J.; Rovers, M.; Goeman, J. Plea for routinely presenting prediction intervals in meta-analysis. BMJ Open 2015, 6, e010247. [Google Scholar] [CrossRef] [PubMed]
- Dias, S.; Sutton, A.; Welton, N.; Ades, A. Evidence synthesis for decision making 3: Heterogeneity--subgroups, meta-regression, bias, and bias-adjustment. Med. Decis. Making 2013, 33, 618–640. [Google Scholar] [CrossRef] [PubMed]
- Atkins, D.; Best, D.; Briss, P.A.; Eccles, M.; Falck-Ytter, Y.; Flottorp, S.; Guyatt, G.H.; Harbour, R.T.; Haugh, M.C.; Henry, D.; et al. Grading quality of evidence and strength of recommendations. BMJ 2004, 328, 1490. [Google Scholar] [CrossRef] [PubMed]
- Simmonds, M. Quantifying the risk of error when interpreting funnel plots. Syst. Rev. 2015, 4, 24. [Google Scholar] [CrossRef] [PubMed]
- Page, M.; Higgins, J.; Sterne, J. Chapter 13: Assessing risk of bias due to missing results in a synthesis. In Cochrane Handbook for Systematic Reviews of Interventions; Higgins, J., Thomas, J., Chandler, J., Cumpston, M., Li, T., Page, M., Welch, V., Eds.; Wiley Online Libraty: Minneapolis, MN, USA, 2021. [Google Scholar]
- Higgins, J.; Li, T.; Deeks, J. Choosing effect. In Cochrane Handbook for Systematic Reviews of Interventions Version 6.4 (Updated August 2023); Higgins, J., Thomas, J., Chandler, J., Cumpston, M., Li, T., Page, M., Welch, V., Eds.; Cochrane: London, UK, 2023. [Google Scholar]
- Mozaffari-Khosravi, H.; Naghdipour-Biregani, A.; Zavar-Reza, J.; Poursoleiman, F. The effects of dark chocolate consumption on oxidative stress and blood pressure in patients with metabolic syndrome: A randomized clinical trial. J. Nutr. Food Secur. 2016, 1, 1–8. [Google Scholar]
- Massee, L.A.; Ried, K.; Pase, M.; Travica, N.; Yoganathan, J.; Scholey, A.; Macpherson, H.; Kennedy, G.; Sali, A.; Pipingas, A. The acute and sub-chronic effects of cocoa flavanols on mood, cognitive and cardiovascular health in young healthy adults: A randomized, controlled trial. Front. Pharmacol. 2015, 6, 93. [Google Scholar] [CrossRef] [PubMed]
- Ottaviani, J.I.; Balz, M.; Kimball, J.; Ensunsa, J.L.; Fong, R.; Momma, T.Y.; Kwik-Uribe, C.; Schroeter, H.; Keen, C.L. Safety and efficacy of cocoa flavanol intake in healthy adults: A randomized, controlled, double-masked trial. Am. J. Clin. Nutr. 2015, 102, 1425–1435. [Google Scholar] [CrossRef] [PubMed]
- Dicks, L.; Kirch, N.; Gronwald, D.; Wernken, K.; Zimmermann, B.F.; Helfrich, H.P.; Ellinger, S. Regular Intake of a Usual Serving Size of Flavanol-Rich Cocoa Powder Does Not Affect Cardiometabolic Parameters in Stably Treated Patients with Type 2 Diabetes and Hypertension-A Double-Blinded, Randomized, Placebo-Controlled Trial. Nutrients 2018, 10, 1435. [Google Scholar] [CrossRef]
- Pereira, T.; Bergqvist, J.; Vieira, C.; Grüner Sveälv, B.; Castanheira, J.; Conde, J. Randomized study of the effects of cocoa-rich chocolate on the ventricle-arterial coupling and vascular function of young, healthy adults. Nutrition 2019, 63–64, 175–183. [Google Scholar] [CrossRef]
- Ibero-Baraibar, I.; Abete, I.; Navas-Carretero, S.; Massis-Zaid, A.; Martinez, J.A.; Zulet, M.A. Oxidised LDL levels decreases after the consumption of ready-to-eat meals supplemented with cocoa extract within a hypocaloric diet. Nutr. Metab. Cardiovasc. Dis. 2014, 24, 416–422. [Google Scholar] [CrossRef] [PubMed]
- Ayoobi, N.; Jafarirad, S.; Haghighizadeh, M.; Jahanshahi, A. Protective Effect of Dark Chocolate on Cardiovascular Disease Factors and Body Composition in Type 2 Diabetes: A Parallel, Randomized, Clinical Trial. Iran. Red. Crescent Med. J. 2017, 19, e21644. [Google Scholar] [CrossRef]
- Baba, S.; Osakabe, N.; Kato, Y.; Natsume, M.; Yasuda, A.; Kido, T.; Fukuda, K.; Muto, Y.; Kondo, K. Continuous intake of polyphenolic compounds containing cocoa powder reduces LDL oxidative susceptibility and has beneficial effects on plasma HDL-cholesterol concentrations in humans. Am. J. Clin. Nutr. 2007, 85, 709–717. [Google Scholar] [CrossRef] [PubMed]
- Baba, S.; Natsume, M.; Yasuda, A.; Nakamura, Y.; Tamura, T.; Osakabe, N.; Kanegae, M.; Kondo, K. Plasma LDL and HDL cholesterol and oxidized LDL concentrations are altered in normo- and hypercholesterolemic humans after intake of different levels of cocoa powder. J. Nutr. 2007, 137, 1436–1441. [Google Scholar] [CrossRef] [PubMed]
- Desideri, G.; Kwik-Uribe, C.; Grassi, D.; Necozione, S.; Ghiadoni, L.; Mastroiacovo, D.; Raffaele, A.; Ferri, L.; Bocale, R.; Lechiara, M.C.; et al. Benefits in cognitive function, blood pressure, and insulin resistance through cocoa flavanol consumption in elderly subjects with mild cognitive impairment: The Cocoa, Cognition, and Aging (CoCoA) study. Hypertension 2012, 60, 794–801. [Google Scholar] [CrossRef] [PubMed]
- Mastroiacovo, D.; Kwik-Uribe, C.; Grassi, D.; Necozione, S.; Raffaele, A.; Pistacchio, L.; Righetti, R.; Bocale, R.; Lechiara, M.C.; Marini, C.; et al. Cocoa flavanol consumption improves cognitive function, blood pressure control, and metabolic profile in elderly subjects: The Cocoa, Cognition, and Aging (CoCoA) Study--a randomized controlled trial. Am. J. Clin. Nutr. 2015, 101, 538–548. [Google Scholar] [CrossRef] [PubMed]
- Davison, K.; Coates, A.M.; Buckley, J.D.; Howe, P.R. Effect of cocoa flavanols and exercise on cardiometabolic risk factors in overweight and obese subjects. Int. J. Obes. 2008, 32, 1289–1296. [Google Scholar] [CrossRef] [PubMed]
- Nishiwaki, M.; Nakano, Y.; Matsumoto, N. Effects of regular high-cocoa chocolate intake on arterial stiffness and metabolic characteristics during exercise. Nutrition 2019, 60, 53–58. [Google Scholar] [CrossRef] [PubMed]
- Rostami, A.; Khalili, M.; Haghighat, N.; Eghtesadi, S.; Shidfar, F.; Heidari, I.; Ebrahimpour-Koujan, S.; Eghtesadi, M. High-cocoa polyphenol-rich chocolate improves blood pressure in patients with diabetes and hypertension. ARYA Atheroscler. 2015, 11, 21–29. [Google Scholar] [PubMed]
- Desch, S.; Kobler, D.; Schmidt, J.; Sonnabend, M.; Adams, V.; Sareban, M.; Eitel, I.; Blüher, M.; Schuler, G.; Thiele, H. Low vs. higher-dose dark chocolate and blood pressure in cardiovascular high-risk patients. Am. J. Hypertens. 2010, 23, 694–700. [Google Scholar] [CrossRef] [PubMed]
- Munguía, L.; Gutiérrez-Salmeán, G.; Hernández, M.; Ortiz, A.; Sánchez, M.; Nájera, N.; Meaney, E.; Rubio-Gayosso, I.; Ceballos, G. Beneficial effects of a flavanol-enriched cacao beverage on anthropometric and cardiometabolic risk profile in overweight subjects. Rev. Mex. Cardiol. 2015, 26, 78–86. [Google Scholar]
- Munguia, L.; Rubio-Gayosso, I.; Ramirez-Sanchez, I.; Ortiz, A.; Hidalgo, I.; Gonzalez, C.; Meaney, E.; Villarreal, F.; Najera, N.; Ceballos, G. High Flavonoid Cocoa Supplement Ameliorates Plasma Oxidative Stress and Inflammation Levels While Improving Mobility and Quality of Life in Older Subjects: A Double-Blind Randomized Clinical Trial. J. Gerontol. A Biol. Sci. Med. Sci. 2019, 74, 1620–1627. [Google Scholar] [CrossRef] [PubMed]
- Nickols-Richardson, S.M.; Piehowski, K.E.; Metzgar, C.J.; Miller, D.L.; Preston, A.G. Changes in body weight, blood pressure and selected metabolic biomarkers with an energy-restricted diet including twice daily sweet snacks and once daily sugar-free beverage. Nutr. Res. Pract. 2014, 8, 695–704. [Google Scholar] [CrossRef] [PubMed]
- Rodriguez-Mateos, A.; Weber, T.; Skene, S.S.; Ottaviani, J.I.; Crozier, A.; Kelm, M.; Schroeter, H.; Heiss, C. Assessing the respective contributions of dietary flavanol monomers and procyanidins in mediating cardiovascular effects in humans: Randomized, controlled, double-masked intervention trial. Am. J. Clin. Nutr. 2018, 108, 1229–1237. [Google Scholar] [CrossRef] [PubMed]
- Sansone, R.; Rodriguez-Mateos, A.; Heuel, J.; Falk, D.; Schuler, D.; Wagstaff, R.; Kuhnle, G.G.; Spencer, J.P.; Schroeter, H.; Merx, M.W.; et al. Cocoa flavanol intake improves endothelial function and Framingham Risk Score in healthy men and women: A randomised, controlled, double-masked trial: The Flaviola Health Study. Br. J. Nutr. 2015, 114, 1246–1255. [Google Scholar] [CrossRef] [PubMed]
- Neufingerl, N.; Zebregs, Y.E.; Schuring, E.A.; Trautwein, E.A. Effect of cocoa and theobromine consumption on serum HDL-cholesterol concentrations: A randomized controlled trial. Am. J. Clin. Nutr. 2013, 97, 1201–1209. [Google Scholar] [CrossRef] [PubMed]
- Giraldo, M.; Toro, J.; Arango, C.; Posada, L.; HI, G. Ensayo clínico aleatorizado y controlado del efecto del consumo de cacao en pacientes con resistencia a la insulina resistance. Acta Medica Colomb. 2017, 42, 90–96. [Google Scholar]
- León-Flores, P.; Nájera, N.; Pérez, E.; Pardo, B.; Jimenez, F.; Diaz-Chiguer, D.; Villarreal, F.; Hidalgo, I.; Ceballos, G.; Meaney, E. Effects of Cacao By-Products and a Modest Weight Loss Intervention on the Concentration of Serum Triglycerides in Overweight Subjects: Proof of Concept. J. Med. Food 2020, 23, 745–749. [Google Scholar] [CrossRef]
- Jafarirad, S.; Ayoobi, N.; Karandish, M.; Jalali, M.T.; Haghighizadeh, M.H.; Jahanshahi, A. Dark Chocolate Effect on Serum Adiponectin, Biochemical and Inflammatory Parameters in Diabetic Patients: A Randomized Clinical Trial. Int. J. Prev. Med. 2018, 9, 86. [Google Scholar] [CrossRef]
- Balzer, J.; Rassaf, T.; Heiss, C.; Kleinbongard, P.; Lauer, T.; Merx, M.; Heussen, N.; Gross, H.B.; Keen, C.L.; Schroeter, H.; et al. Sustained benefits in vascular function through flavanol-containing cocoa in medicated diabetic patients a double-masked, randomized, controlled trial. J. Am. Coll. Cardiol. 2008, 51, 2141–2149. [Google Scholar] [CrossRef] [PubMed]
- Naghdipour-Biregani, A.; Mozaffari-Khosravi, H.; Poursoleiman, F.; Zavar-Reza, J.; Rahmanian, M.; Dehghani, A. The Effect of Dark Chocolate Consumption on Lipid Profile in Patients with Metabolic Syndrome: A Randomized Clinical Trial. Iran. J. Diabetes Obes. 2014, 6, 9–13. [Google Scholar]
- Polagruto, J.A.; Wang-Polagruto, J.F.; Braun, M.M.; Lee, L.; Kwik-Uribe, C.; Keen, C.L. Cocoa flavanol-enriched snack bars containing phytosterols effectively lower total and low-density lipoprotein cholesterol levels. J. Am. Diet. Assoc. 2006, 106, 1804–1813. [Google Scholar] [CrossRef] [PubMed]
- Parsaeyan, N.; Mozaffari-Khosravi, H.; Absalan, A.; Mozayan, M.R. Beneficial effects of cocoa on lipid peroxidation and inflammatory markers in type 2 diabetic patients and investigation of probable interactions of cocoa active ingredients with prostaglandin synthase-2 (PTGS-2/COX-2) using virtual analysis. J. Diabetes Metab. Disord. 2014, 13, 30. [Google Scholar] [CrossRef] [PubMed]
- Crews, W.; Harrison, D.; Wright, J. A double-blind, placebo-controlled, randomized trial of the effects of dark chocolate and cocoa on variables associated with neuropsychological functioning and cardiovascular health: Clinical findings from a sample of healthy, cognitively intact older adults. Am. J. Clin. Nutr. 2008, 87, 872–880. [Google Scholar] [CrossRef] [PubMed]
- Leyva-Soto, A.; Chavez-Santoscoy, R.A.; Lara-Jacobo, L.R.; Chavez-Santoscoy, A.V.; Gonzalez-Cobian, L.N. Daily Consumption of Chocolate Rich in Flavonoids Decreases Cellular Genotoxicity and Improves Biochemical Parameters of Lipid and Glucose Metabolism. Molecules 2018, 23, 2220. [Google Scholar] [CrossRef] [PubMed]
- Pereira, T.; Maldonado, J.; Laranjeiro, M.; Coutinho, R.; Cardoso, E.; Andrade, I.; Conde, J. Central arterial hemodynamic effects of dark chocolate ingestion in young healthy people: A randomized and controlled trial. Cardiol. Res. Pract. 2014, 2014, 945951. [Google Scholar] [CrossRef] [PubMed]
- Gu, Y.; Yu, S.; Lambert, J.D. Dietary cocoa ameliorates obesity-related inflammation in high fat-fed mice. Eur. J. Nutr. 2014, 53, 149–158. [Google Scholar] [CrossRef] [PubMed]
- Jennings, A.; Welch, A.A.; Fairweather-Tait, S.J.; Kay, C.; Minihane, A.M.; Chowienczyk, P.; Jiang, B.; Cecelja, M.; Spector, T.; Macgregor, A.; et al. Higher anthocyanin intake is associated with lower arterial stiffness and central blood pressure in women. Am. J. Clin. Nutr. 2012, 96, 781–788. [Google Scholar] [CrossRef] [PubMed]
- Li, S.H.; Zhao, P.; Tian, H.B.; Chen, L.H.; Cui, L.Q. Effect of Grape Polyphenols on Blood Pressure: A Meta-Analysis of Randomized Controlled Trials. PLoS ONE 2015, 10, e0137665. [Google Scholar] [CrossRef] [PubMed]
- Magrone, T.; Russo, M.A.; Jirillo, E. Cocoa and Dark Chocolate Polyphenols: From Biology to Clinical Applications. Front. Immunol. 2017, 8, 677. [Google Scholar] [CrossRef] [PubMed]
- Higgins, J.; Thomas, J.; Chandler, J.; Cumpston, M.; Li, T.; Page, M.; Welch, V. Cochrane Handbook for Systematic Reviews of Interventions; Wiley: Hoboken, NJ, USA, 2022. [Google Scholar]
- Kord-Varkaneh, H.; Ghaedi, E.; Nazary-Vanani, A.; Mohammadi, H.; Shab-Bidar, S. Does cocoa/dark chocolate supplementation have favorable effect on body weight, body mass index and waist circumference? A systematic review, meta-analysis and dose-response of randomized clinical trials. Crit. Rev. Food Sci. Nutr. 2019, 59, 2349–2362. [Google Scholar] [CrossRef] [PubMed]
- Garcia-Yu, I.A.; Garcia-Ortiz, L.; Gomez-Marcos, M.A.; Rodriguez-Sanchez, E.; Lugones-Sanchez, C.; Maderuelo-Fernandez, J.A.; Recio-Rodriguez, J.I. Cocoa-rich chocolate and body composition in postmenopausal women: A randomised clinical trial. Br. J. Nutr. 2021, 125, 548–556. [Google Scholar] [CrossRef] [PubMed]
- Lewington, S.; Whitlock, G.; Clarke, R.; Sherliker, P.; Emberson, J.; Halsey, J.; Qizilbash, N.; Peto, R.; Collins, R. Blood cholesterol and vascular mortality by age, sex, and blood pressure: A meta-analysis of individual data from 61 prospective studies with 55,000 vascular deaths. Lancet 2007, 370, 1829–1839. [Google Scholar] [CrossRef] [PubMed]
- Yusuf, S.; Hawken, S.; Ounpuu, S.; Dans, T.; Avezum, A.; Lanas, F.; McQueen, M.; Budaj, A.; Pais, P.; Varigos, J.; et al. Effect of potentially modifiable risk factors associated with myocardial infarction in 52 countries (the INTERHEART study): Case-control study. Lancet 2004, 364, 937–952. [Google Scholar] [CrossRef] [PubMed]
- Ference, B.A.; Yoo, W.; Alesh, I.; Mahajan, N.; Mirowska, K.K.; Mewada, A.; Kahn, J.; Afonso, L.; Williams, K.A., Sr.; Flack, J.M. Effect of long-term exposure to lower low-density lipoprotein cholesterol beginning early in life on the risk of coronary heart disease: A Mendelian randomization analysis. J. Am. Coll. Cardiol. 2012, 60, 2631–2639. [Google Scholar] [CrossRef] [PubMed]
- Faludi, A.A.; Izar, M.C.O.; Saraiva, J.F.K.; Chacra, A.P.M.; Bianco, H.T.; Afiune, A.N.; Bertolami, A.; Pereira, A.C.; Lottenberg, A.M.; Sposito, A.C.; et al. Atualização da Diretriz Brasileira de Dislipidemias e Prevenção da Aterosclerose—2017. Arq. Bras. Cardiol. 2017, 109, 1–76. [Google Scholar] [CrossRef] [PubMed]
- Baigent, C.; Keech, A.; Kearney, P.M.; Blackwell, L.; Buck, G.; Pollicino, C.; Kirby, A.; Sourjina, T.; Peto, R.; Collins, R.; et al. Efficacy and safety of cholesterol-lowering treatment: Prospective meta-analysis of data from 90,056 participants in 14 randomised trials of statins. Lancet 2005, 366, 1267–1278. [Google Scholar] [CrossRef] [PubMed]
- Rusconi, M.; Conti, A. Theobroma cacao L., the Food of the Gods: A scientific approach beyond myths and claims. Pharmacol. Res. 2010, 61, 5–13. [Google Scholar] [CrossRef] [PubMed]
- Tokede, O.A.; Gaziano, J.M.; Djoussé, L. Effects of cocoa products/dark chocolate on serum lipids: A meta-analysis. Eur. J. Clin. Nutr. 2011, 65, 879–886. [Google Scholar] [CrossRef] [PubMed]
- Matsui, N.; Ito, R.; Nishimura, E.; Yoshikawa, M.; Kato, M.; Kamei, M.; Shibata, H.; Matsumoto, I.; Abe, K.; Hashizume, S. Ingested cocoa can prevent high-fat diet-induced obesity by regulating the expression of genes for fatty acid metabolism. Nutrition 2005, 21, 594–601. [Google Scholar] [CrossRef] [PubMed]
- Xavier, H.T.; Izar, M.; Faria Neto, J.; Assad, M.; Rocha, V.; Sposito, A.; Fonseca, F.; Dos Santos, J.; Santos, R.; Bertolami, M.; et al. V Diretriz brasileira de dislipidemias e prevenção da aterosclerose. Arq. Bras. Cardiol. 2013, 101, 1–30. [Google Scholar] [CrossRef] [PubMed]
- Desch, S.; Schmidt, J.; Kobler, D.; Sonnabend, M.; Eitel, I.; Sareban, M.; Rahimi, K.; Schuler, G.; Thiele, H. Effect of cocoa products on blood pressure: Systematic review and meta-analysis. Am. J. Hypertens. 2010, 23, 97–103. [Google Scholar] [CrossRef] [PubMed]
- Ried, K.; Fakler, P.; Stocks, N.P. Effect of cocoa on blood pressure. Cochrane Database Syst. Rev. 2017, 4, Cd008893. [Google Scholar] [CrossRef] [PubMed]
- Curtis, P.J.; van der Velpen, V.; Berends, L.; Jennings, A.; Feelisch, M.; Umpleby, A.M.; Evans, M.; Fernandez, B.O.; Meiss, M.S.; Minnion, M.; et al. Blueberries improve biomarkers of cardiometabolic function in participants with metabolic syndrome-results from a 6-month, double-blind, randomized controlled trial. Am. J. Clin. Nutr. 2019, 109, 1535–1545. [Google Scholar] [CrossRef] [PubMed]
- Arisi, T.O.P.; Gorski, F.; Eibel, B.; Barbosa, E.; Boll, L.; Waclawovsky, G.; Lehnen, A.M. Dietary intake of anthocyanins improves arterial stiffness, but not endothelial function, in volunteers with excess weight: A randomized clinical trial. Phytother. Res. 2023, 37, 798–808. [Google Scholar] [CrossRef] [PubMed]
- Actis-Goretta, L.; Ottaviani, J.I.; Fraga, C.G. Inhibition of angiotensin converting enzyme activity by flavanol-rich foods. J. Agric. Food Chem. 2006, 54, 229–234. [Google Scholar] [CrossRef] [PubMed]
- Persson, I.A.; Persson, K.; Hägg, S.; Andersson, R.G. Effects of cocoa extract and dark chocolate on angiotensin-converting enzyme and nitric oxide in human endothelial cells and healthy volunteers--a nutrigenomics perspective. J. Cardiovasc. Pharmacol. 2011, 57, 44–50. [Google Scholar] [CrossRef] [PubMed]
- Taubert, D.; Roesen, R.; Lehmann, C.; Jung, N.; Schömig, E. Effects of low habitual cocoa intake on blood pressure and bioactive nitric oxide: A randomized controlled trial. JAMA 2007, 298, 49–60. [Google Scholar] [CrossRef] [PubMed]
- McInnes, G.T. Lowering blood pressure for cardiovascular risk reduction. J. Hypertens. Suppl. 2005, 23, S3–S8. [Google Scholar] [CrossRef] [PubMed]
- Vian, I.; Zielinsky, P.; Zilio, A.M.; Schaun, M.I.; Brum, C.; Lampert, K.V.; De Avila, N.; Baldissera, G.; Klanovicz, T.M.; Zenki, K.; et al. Increase of prostaglandin E2 in the reversal of fetal ductal constriction after polyphenol restriction. Ultrasound Obstet. Gynecol. 2018, 52, 617–622. [Google Scholar] [CrossRef]
- Hahn, M.; Baierle, M.; Charao, M.F.; Bubols, G.B.; Gravina, F.S.; Zielinsky, P.; Arbo, M.D.; Cristina Garcia, S. Polyphenol-rich food general and on pregnancy effects: A review. Drug Chem. Toxicol. 2017, 40, 368–374. [Google Scholar] [CrossRef] [PubMed]
- Zielinsky, P.; Piccoli, A.L., Jr.; Manica, J.L.; Nicoloso, L.H.; Menezes, H.; Busato, A.; Moraes, M.R.; Silva, J.; Bender, L.; Pizzato, P.; et al. Maternal consumption of polyphenol-rich foods in late pregnancy and fetal ductus arteriosus flow dynamics. J. Perinatol. 2010, 30, 17–21. [Google Scholar] [CrossRef] [PubMed]
- Pedra, S.; Zielinsky, P.; Binotto, C.; Martins, C.; Fonseca, E.; Guimarães, I.; Corrêa, I.; Pedrosa, K.; Lopes, L.; Nicoloso, L.; et al. Brazilian Fetal Cardiology Guidelines—2019. Arq. Bras. Cardiol. 2019, 112, 600–648. [Google Scholar] [CrossRef] [PubMed]
Disclaimer/Publisher’s Note: The statements, opinions and data contained in all publications are solely those of the individual author(s) and contributor(s) and not of MDPI and/or the editor(s). MDPI and/or the editor(s) disclaim responsibility for any injury to people or property resulting from any ideas, methods, instructions or products referred to in the content. |
© 2024 by the authors. Licensee MDPI, Basel, Switzerland. This article is an open access article distributed under the terms and conditions of the Creative Commons Attribution (CC BY) license (https://creativecommons.org/licenses/by/4.0/).