Abstract
The role of nutrition in preventing non-communicable diseases has been widely studied in recent years, with indications that non-animal-based diets might improve body composition and therefore bring multiple health benefits. For all of these reasons, the main purpose was to compare body composition and metabolic status between vegetarian and omnivorous individuals and relate these values with cardiovascular risk. The present analysis included 176 participants (61 vegetarians and 115 omnivores). Body composition was assessed using a dual-energy X–ray absorptiometry, biochemical parameters obtained from capillary blood, and the 10-year cardiovascular risk (10RCVD) calculated by the QRISK3 score. No statistical differences were found between groups regarding body composition. Concerning metabolic markers, vegetarian individuals showed reduced values of total cholesterol, LDL cholesterol, and non–HDL cholesterol (p < 0.05). There were no differences in 10RCVD between groups. In both diets, moderate correlations between groups were found for cardiovascular risk and visceral adipose tissue. Our results suggest that the vegetarian regimen might be associated with better cardiometabolic biomarkers and better cardiovascular health, although controversial with the body composition trends observed. In conclusion, the results suggest that cardiovascular risk appears to be more influenced by body composition, mainly fat tissue, over dietary patterns itself.
1. Introduction
Non-communicable diseases are responsible for almost 90% of mortalities in Europe [1]. Obesity, defined as “abnormal or excessive fat accumulation that may impair health” [2], is a complex multifactorial disease universally graded by the body mass index (BMI) [1]. BMI, however, does not provide information regarding body fat distribution [3,4].
Several studies have reported an association between different fat compartments and cardiometabolic risk [3,5] thought to be related to an unhealthy distribution of fat or its excess [6]. Visceral adipose tissue (VAT) has been associated with increased cardiovascular risk and various health issues [4,7]. Some authors support the idea that VAT is an endocrine organ secreting adipocytokines, and strong evidence has shown that excess VAT leads to the development of dyslipidemia, hypertension, and insulin resistance [6]. Likewise, excess VAT has been linked to a higher prevalence of diabetes and high fasting glucose [8], hypertension [9], and dyslipidemia [10]. Subcutaneous adipose tissue (SAT), on the other hand, has been associated with a more protective role [8,9] and a reduced risk of diabetes and dyslipidemia [8].
Vegetarian diets, predominantly involving the consumption of plant-based foods while excluding the majority of, if not all, animal-based foods, have become increasingly popular in the last years [9,10]. Multiple health benefits have been reported when compared to omnivorous diets, and a properly planned, well-balanced vegetarian diet can provide all or nearly all required bodily nutrients [10]. Many plant-based foods are rich in flavonoids and carotenoids that might inhibit LDL cholesterol oxidation, leading to an increase in HDL cholesterol and, consequently, reducing concentrations of circulating total cholesterol and reducing the risk of atherosclerosis [11]. In turn, the high consumption of red meat and its derivatives seems to be related to an increase in mortality rates due to the high content of saturated fat present in these foods [12]. This high-fat content will contribute to an increase in LDL cholesterol and consequently result in the broader deposition of lipids in the vascular lumen, favoring sclerosis [11]. Some studies suggest that the increased consumption of vegetables and pulses, fruit, whole grains, and fish can lower all-cause mortality [12]. However, different authors argue that many of the associations between red meat and mortality may be influenced by other factors, including unhealthy lifestyle habits such as tobacco and alcohol consumption [12,13]. Vegetarian diets have been associated with higher weight loss, lower BMI, and, in some cases, a healthier distribution of body fat [10]. However, relationships between this regimen and body composition or adipose tissue distribution are not obvious [14]. Vegetarian diets have also been associated with lower values of systolic and diastolic blood pressure [15], triglycerides [16], and total and LDL cholesterol [17] compared to other omnivorous diets. People following vegetarian diets have been known to show better overall cardiovascular health metrics and lower healthy diet scores, likely due to the absence of fish consumption when compared to those following non-vegetarian diets [18]. However, these allegations are far from being accordant.
The present study aimed to explore the cardiovascular impact of vegetarian and omnivorous dietary regimens by evaluating body composition and calculating a ten-year cardiovascular risk.
2. Materials and Methods
2.1. Participants and Ethical Considerations
This cross-sectional observational study involved 176 previously selected participants (115 omnivorous and 61 vegetarian, 113 women and 63 men). Specific non-inclusion criteria included being pregnant or breastfeeding, being in the first week of the menstrual cycle, the regular use of medication that may evoke edema or dehydration, having an implanted pacemaker and/or any metal prosthesis, any previously diagnosed chronic non-communicable diseases, and practicing the respective dietary regimen for less than one year. All participants were residents of the Lisbon city district (Portugal) and were aged between 18 and 65 years old. The recruitment period took place between February 2022 and January 2023. The study was mainly disseminated through personal and institutional social networks. The sample size was calculated taking into consideration the last estimations for Portugal—76,000 people following a vegetarian dietary pattern. This represents a proportion of 0.9% of the total Portuguese population. This sample size calculation took into consideration a 95% confidence interval and an error margin of 5%.
All individuals agreed to participate in the study before data collection through informed written consent. Procedures respected all principles of good clinical practice adopted for human research studies, complying with current ethical standards for human research, following the Declaration of Helsinki [19] and respective amendments. The study was previously approved by the Ethics Committee of the School of Sciences and Health Technologies from Universidade Lusófona (EC.ECTS/P05.21).
2.2. Data Collection
An interview preceded each assessment to (part 1) identify general participant characteristics of biological sex, age, family history of the disease, area of residence, place of residence (according to the division of the Nomenclature of Territorial Units for Statistical Purposes (NUT) II [20]), educational level, area of study, and monthly net household income. The International Physical Activity Questionnaire—Short Form was then applied (part 2) to obtain data on the level of physical activity for each participant [21]. Finally (part 3), a food frequency questionnaire (FFQ) validated for the Portuguese population was applied [22]. After integration into the study and based on the FFQ responses, participants were divided into two groups—following a vegetarian diet or following an omnivorous diet. The vegetarian group included all individuals who did not consume any type of animal products (meat, fish, or/and its derivatives). However, the consumption of dairy products, eggs, and honey was admitted. On the other hand, the omnivorous group included all individuals who consumed animal products (meat, fish, or/and its derivatives), with no type of “restriction” in this group.
2.3. Measurement Outcomes
Body mass was measured by an electronic scale [0.1 kg (0.1–200 kg) accuracy]. Participants were wearing light clothes and no shoes. Height was a self-reported variable used to calculate BMI by the formula BMI = body mass (kg)/height (m2) [23]. Waist circumference (WC) was measured at the midpoint between the lower edge of the last palpable rib and the upper edge of the iliac crest. Finally, Dual-Energy X–ray Absorptiometry (DXA Lunar Prodigy Advance—General Electric Healthcare®; Chicago, IL, USA) was used to measure fat mass, fat-free mass, lean mass, bone mass, and VAT and SAT. Measurements were performed under twelve hours of fasting and exercise restriction within the twenty-four hours prior. The Appendicular Lean Mass Index (ALMI) was calculated using the formula [ALMI = (leg lean mass (kg) + arm lean mass (kg))/height (m2)] [24]. To identify excess fat mass, the NHAMES 1999–2014 cut-off for obesity diagnosis was used, considering excess fat mass values > 30% for men and values > 40% for women [25]. The lean mass deficit was identified using the EWGSOP2 cut-offs [26] for the ALMI, with a deficit being considered when women showed values < 5.5 kg/m2 and men values < 7.0 kg/m2. Although these cut-offs were created for older individuals [26], they have been recommended in the Global Leadership Initiative on Malnutrition—GLIM criteria for the adult population [27]. Health risk linked to waist circumference was classified according to WHO criteria, considering that the risk was increased when the values were ≥94 cm in men and ≥80 cm in women and substantially increased when the values were ≥102 cm in men and ≥88 cm in women [28].
Blood pressure and cardiac frequency were measured in the individual’s non-dominant arm with a digital sphygmomanometer. Three measurements were taken, discarding the first and averaging the other two. Reference values followed the European Society of Cardiology recommendations for systolic (SBP ≤ 120 mmHg) and diastolic blood pressure (DBP ≤ 80 mmHg) [29]. Mean Arterial Pressure (MAP), defined as the mean blood pressure throughout the cardiac cycle and a main determinant of perfusion and predictor of stroke risk [30] was also calculated using the formula [MAP = 1/3 × SBP + 2/3 × DBP]. A rapid testing device, the LINX DUO (A. Menarini Diagnostics®, Firenze, Italy), was used to assess metabolic markers in capillary blood, including glycated hemoglobin (Hemoglobin A1C), lipids (triglycerides, total cholesterol, and high-density lipoprotein [HDL]), and glucose. Low-density lipoprotein (LDL), very-low-density lipoprotein (VLDL), total cholesterol–HDL ratio, and cholesterol non–HDL were also quantified. The American Diabetes Association’s primary care cut-offs were used to classify excess hemoglobin A1c and fasting blood glucose [31]. Hemoglobin values ≤ of 5.7% and fasting glycemia values ≤ of 100 mg/dL were considered to be adequate [31]. Considering the recommendations of the European Society of Cardiology, evaluated parameters for triglycerides ≤ 150 mg/dL [32], total cholesterol ≤ 155 mg/dL [32], and LDL cholesterol ≤ 100 mg/dL [29] were regarded as normal. HDL cholesterol values >50 mg/dL for women and >40 mg/dL for men were considered acceptable [33]. The 10-year risk for cardiovascular disease (10RCVD) and the relative risk was calculated using the QRISK®3 score [34]. This algorithm uses risk equations, derived through Cox proportional hazards models, that are separate for men and women [34]. This algorithm has been released as open-source software under the GNU Lesser General Public Licence, version 3 [35].
2.4. Statistical Analysis
Statistical analysis was performed using the Statistical Package for Social Sciences (IBM SPSS) version 27.0 (SPPS Inc., Chicago, IL, USA). Data normality was assessed by the Kolmogorov–Smirnov test when n > 50 and the Shapiro–Wilk normality when n < 50 and parametric or non-parametric tests were chosen accordingly. Data were expressed as means (standard deviation, SD), median (interquartile range, IQR), and percentages (absolute values, n), according to the variable’s type. For comparison between categorical variables and scale variables, Student’s t-test and the Mann–Whitney U test were used. To compare two categorical variables, the Chi-squared, Fisher’s Exact, and Monte Carlo tests were used as appropriate. Pearson and Spearman’s correlations were also used. For better data visualization, scatter plots were created, allowing variable adjustment to the simple linear regression line. To evaluate the influence of confounding factors on body composition variables and biochemical parameters, multiple linear regression was used, creating two adjustment factor models. In Model 1, age, BMI, total energy value per weight unit, level of physical activity, smoking habits, academic qualifications, and dietary pattern were included as confounding factors. In Model 2, fat mass and VAT data were included along with all variables of Model 1. The models obtained obey Gauss–Markov conditions (residuals with zero mean, constant variance, and normal distribution). All statistical tests were two-tailed, and p ≤ 0.05 was adopted as the significance level.
3. Results
Details of the studied population are summarized in Table 1. Our study included 176 participants, of which 65.34% followed an omnivorous diet and 64.20% were women. Most participants were non-smokers (77.80%) and 38.60% had a BSc degree. The median participant age was 31 years old. Significant differences between groups were found regarding physical activity (p = 0.014) with the omnivorous group being associated with more moderate levels of physical activity (53.90% vs. 39.30%), and the vegetarian group showing more vigorous activities (39.90% vs. 19.10%). No other differences were found between the groups concerning body mass, height, BMI, or waist circumference.

Table 1.
General characteristics of the study population, according to dietary pattern.
Regarding macronutrient intake according to the dietary pattern (Table 2), we found that the OM population had a higher energy intake (OM: 2392.11 kcal vs. VG: 2066.40 kcal; p = 0.004) than the VG population. The OM group also presented a higher consumption of protein (OM: 18.00% vs. VG: 13.07%; p ≤ 0.001), saturated fat (OM: 9.43% vs. VG: 7.84%; p ≤ 0.001), and dietary cholesterol (OM: 349.25 mg vs. VG: 155.29 mg; p ≤ 0.001). On the other hand, the VG population presented a higher consumption of carbohydrates (VG: 50.20% vs. OM: 42.24%; p ≤ 0.001) and dietary fiber (VG: 35.32 g vs. OM: 30.85 g; p ≤ 0.027).
Table 2.
Daily dietetic intake of the study population according to each sex and dietary pattern.
Regarding body composition (Table 3) no differences were found between both dietary patterns. However, our attention was drawn to some of the numbers observed in both groups, specifically, vegetarian women’s VAT (median: 205 cm3 vs. 173 cm3) and SAT (1053 cm3 vs. 898 cm3); vegetarian men’s fat mass (22.38% vs. 21.89%), VAT (median: 532 cm3 vs. 323 cm3), SAT (median: 947 cm3 vs. 875 cm3), and fat-free mass (77.61% vs. 78.11%) and ALMI (7.93 kg/m2 vs. 8.40 kg/m2). However, after adjusting for confounding factors, vegetarian men showed significantly lower values of lean mass (adjusted p-value = 0.013) and ALMI (adjusted p-value = 0.006).
Table 3.
Body composition of the study population according to the dietary pattern sorted by sex.
Regarding cardiometabolic markers (Table 4), the omnivorous group showed statistically significant higher values of total cholesterol (OM: 183.83 mg/dL vs. VG: 159.77 mg/dL, p ≤ 0.001), LDL cholesterol (OM: 93 mg/dL, dL vs. VG: 83 mg/dL, p = 0.002) and non-HDL cholesterol (OM: 116 mg/dL vs. VG: 110 mg/dL, p ≤ 0.001) than the vegetarian group. These values remained statistically significant after adjusting for confounding variables.
Table 4.
Cardiometabolic markers and cardiovascular disease risk of study population according to dietary pattern.
Assessing the inadequacy of health outcomes (Table 5), omnivorous population depicted non-significant differences regarding fat mass (Men: 13.20% vs. 8%; Women: 19.50% vs. 11.10%) or lean mass (Men: 7.90% vs. 16.00%). For the metabolic markers, it was possible to verify that 50% of the men following an omnivorous diet showed elevated LDL cholesterol values and 31.60% reduced HDL cholesterol values, with these data being statistically significant between groups. These values remained statistically significant after adjusting for confounding variables. On the other hand, 47.20% of vegetarian women had statistically significant hemoglobin A1c, and 30.60% reduced HDL cholesterol. Women including animal products in their diet showed higher total cholesterol (79.20%, p = 0.042). When adjusting for confounding factors, it was also possible to verify that vegetarian women showed lower LDL cholesterol levels (adjusted p-value = 0.017).
Table 5.
Inadequacy of body composition, anthropometrics, and metabolic markers of the study population, according to each sex and dietary pattern.
Correlation analysis revealed that fat mass was positively correlated with triglycerides (rs = 0.230, p = 0.013), total cholesterol (r = 0.393, p ≤ 0.001), LDL cholesterol (rs = 0.291, p = 0.002), and 10RCVD (rs = 0.259, p = 0.026) within the sample following an omnivorous diet (Table 6). VAT was positively correlated with all metabolic markers and cardiovascular risk parameters, as well as SAT, which was only not correlated with hemoglobin A1c and MAP. In the population practicing a vegetarian dietary pattern, fat mass correlated positively with hemoglobin A1c (r = 0.328, p = 0.010) and with LDL cholesterol (r = 0.292, p = 0.022). VAT correlated positively with 10RCVD (rs = 0.583, p ≤ 0.001) and MAP (rs = 0.510, p = 0.018), and SAT correlated negatively with HDL cholesterol (rs = −0.261, p = 0.043) and positively with LDL cholesterol (r = 0.266, p = 0.038) and 10RCVD (rs = 0.357, p = 0.010), in the same population.
Table 6.
Correlations between body composition and metabolic markers, vital signs, and cardiovascular disease risk according to dietary pattern.
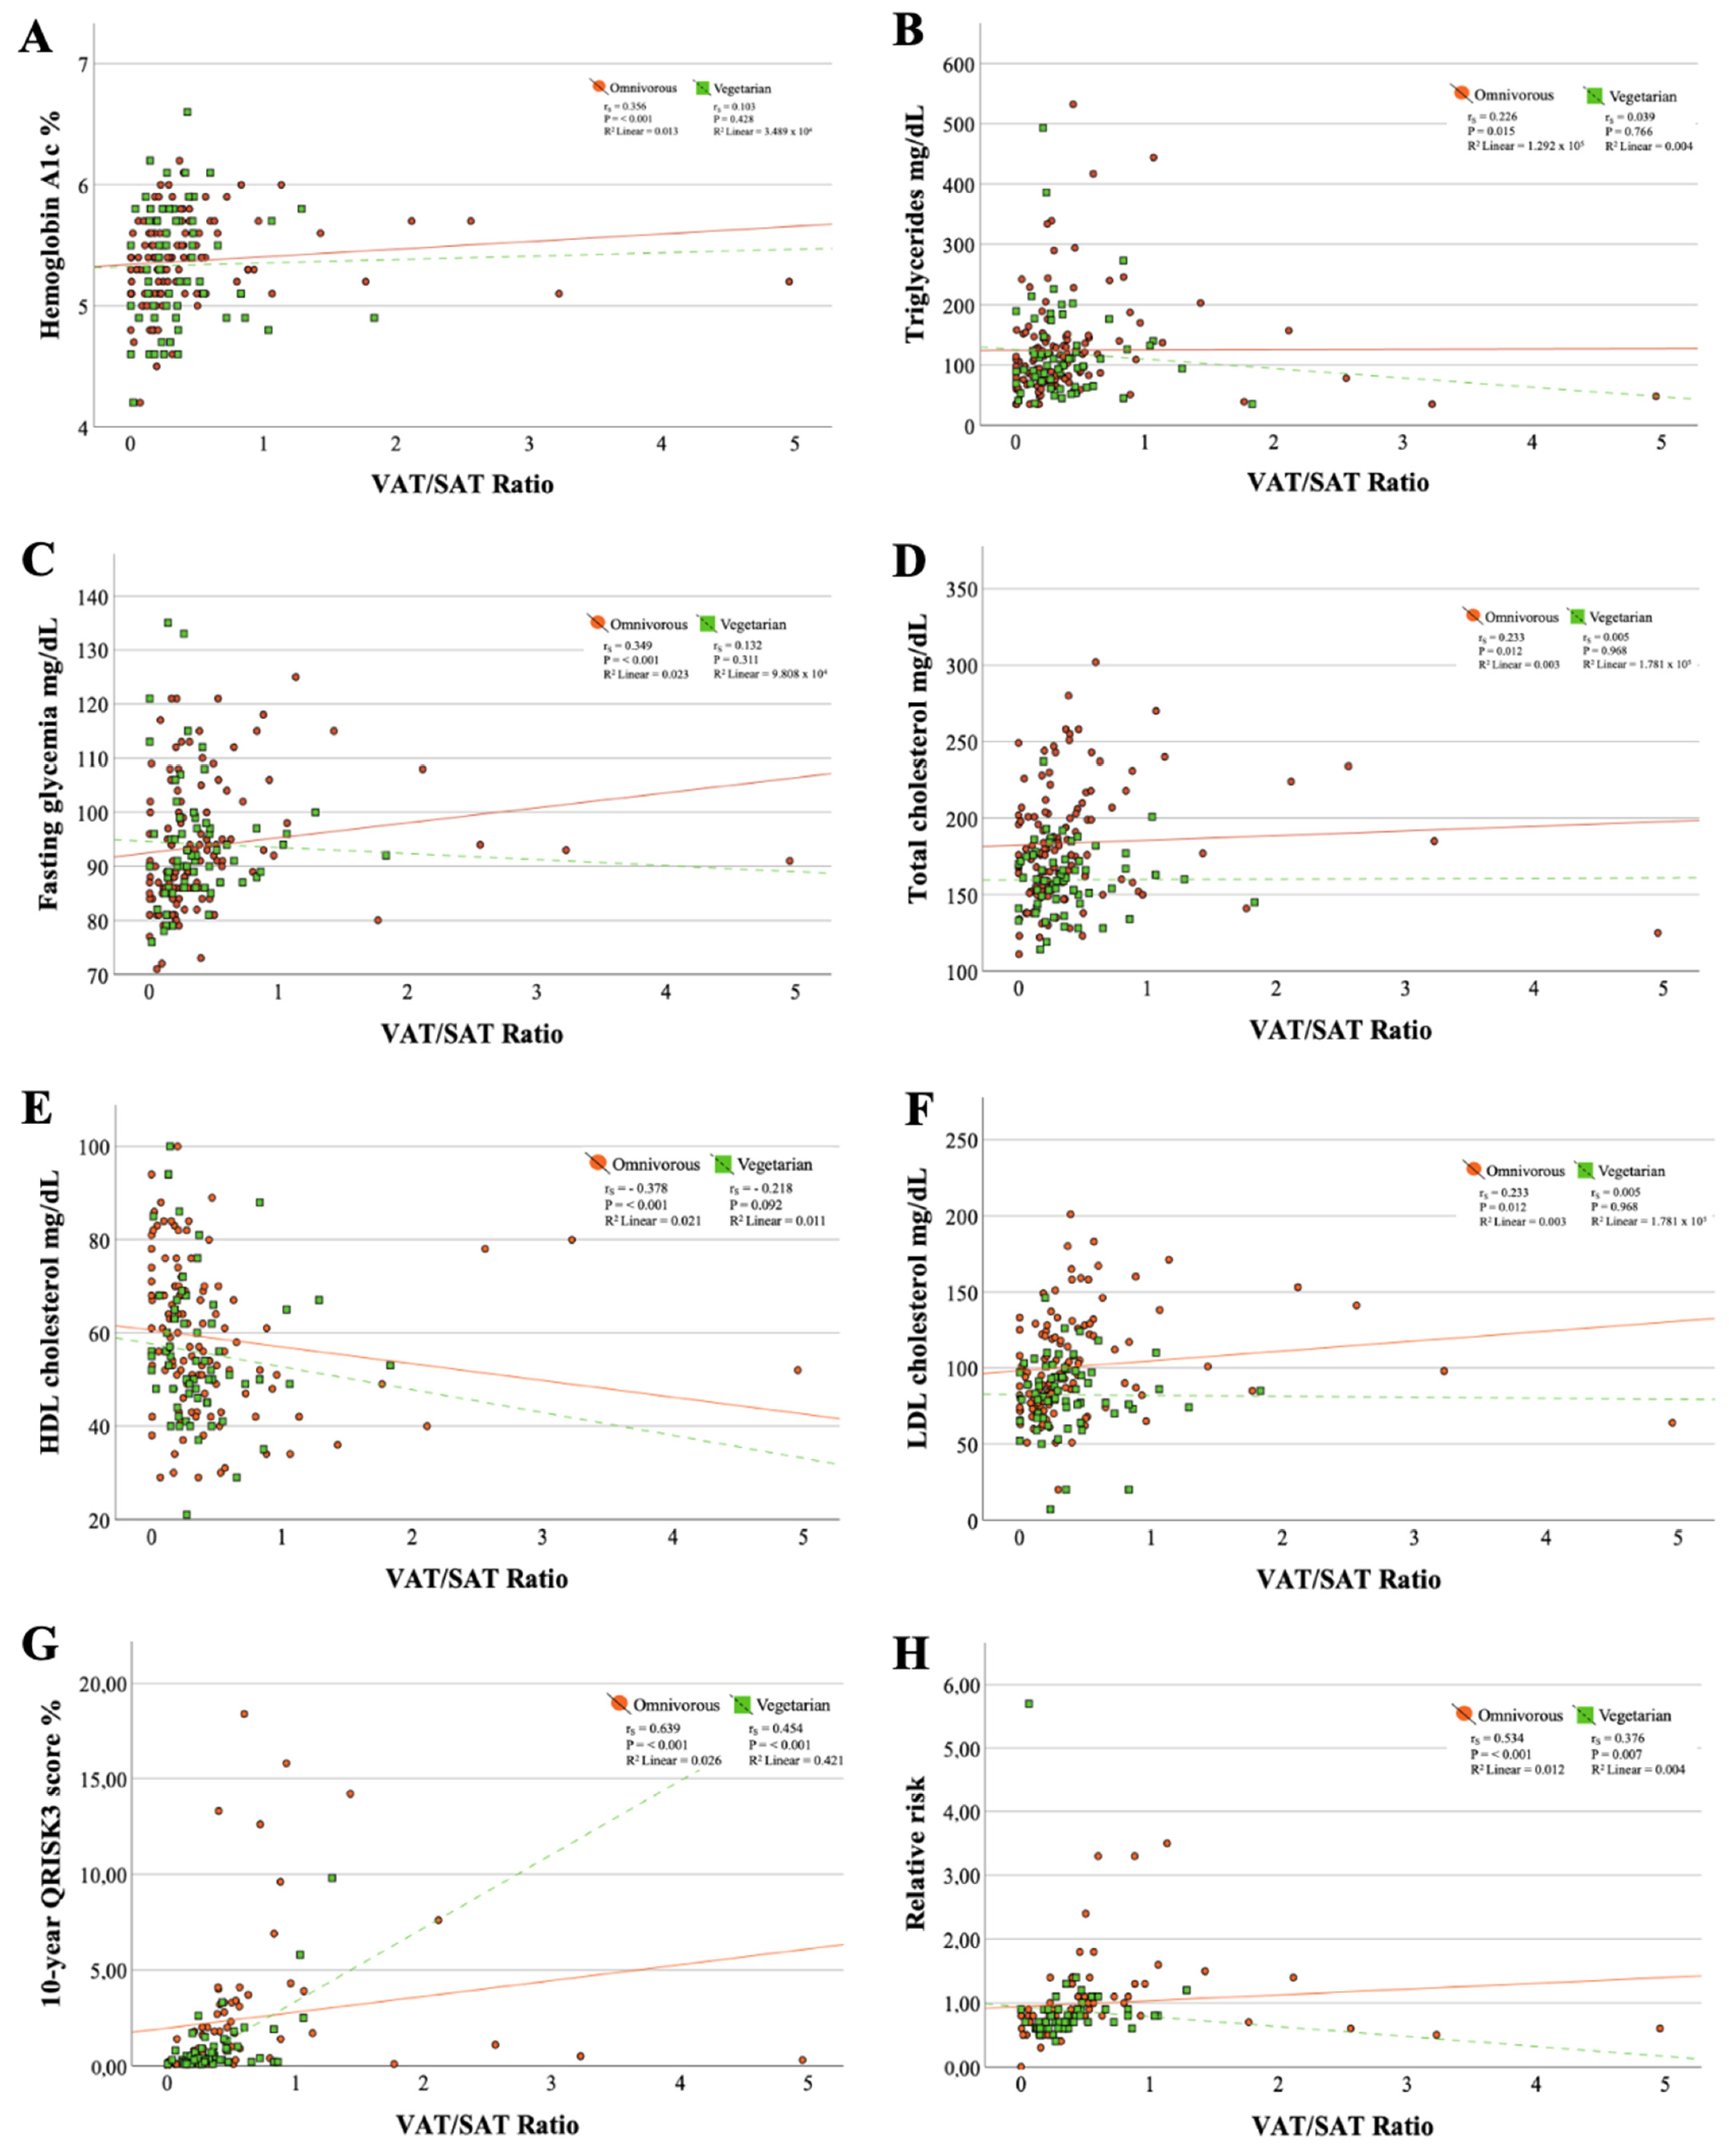
Moderate correlations were found between the VAT/SAT ratio and the 10-year cardiovascular risk (omnivorous diet: rs = 0.639, p ≤ 0.001 and vegetarian diet: rs = 0.454, p ≤ 0.001) (Figure 1). Additionally, the goodness of fit of the simple linear regression line for these data revealed that for individuals following an omnivorous diet, the VAT/SAT ratio contributed only 2.6% (linear R2 = 0.026) to the variation of 10RCVD, while in participants practicing a vegetarian dietary pattern, this contribution was 42.1% (linear R2 = 0.421). All other correlations with the VAT/SAT ratio were weak or held in only one of the dietary patterns.
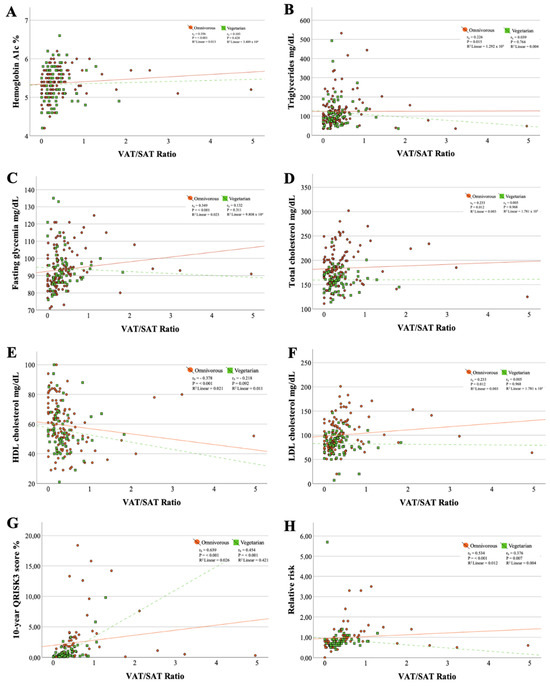
Figure 1.
Scatter plots between metabolic markers and VAT/SAT ratio. (A) Correlation between hemoglobin A1c and VAT/SAT ratio; (B) Correlation between triglycerides and VAT/SAT ratio; (C) Correlation between fasting glycemia and VAT/SAT ratio; (D) Correlation between total cholesterol and VAT/SAT ratio; (E) Correlation between HDL cholesterol and VAT/SAT ratio; (F) Correlation between LDL cholesterol and VAT/SAT ratio; (G) Correlation between triglycerides 10-year QRISK3 score and VAT/SAT ratio; (H) Correlation between relative risk and VAT/SAT ratio.
4. Discussion
The present study revealed no statistically significant differences between dietary groups and respective body composition. However, some specific aspects involving VAT and SAT detected in the vegetarian group have drawn our attention. Different interventions and case-control studies have associated vegetarian diets with lower values of body weight, BMI, and in some cases, total fat mass and VAT when compared with other, omnivorous diets [36,37]. Nevertheless, these results tend to be associated with intervention groups on a low-fat vegetarian diet and are compared to a control diet with no reduction in fat or other food groups, and sometimes there was an increase in food intake in these control groups [36,37]. In our study, we found that the total fat consumption of our sample of vegetarian individuals corresponded to 38% of the total daily energy value (TEV), of which approximately 8% corresponds to saturated fat. This high consumption of fat might explain the slightly elevated VAT and SAT values within the vegetarian group. Another study by Sofi et al. compared the effectiveness of a vegetarian diet vs. a Mediterranean diet (both with low energy value) and produced similar comments on body weight, BMI, and total fat mass, with no statistical differences between diets [38]. Shah et al. also found no statistically significant differences in BMI and waist circumference reduction when comparing a vegetarian diet with the diet recommended by the American Heart Association [39]. These studies demonstrate that when overall energy consumption is equivalent, no significant differences regarding body composition are shown [37,38]. In our study, similar fat consumption was also found in the omnivorous participants (39% of TEV), however, this group presented a higher moderate physical exercise practice, which likely may influence the VAT and SAT values [40].
In the analysis of body composition, it was also possible to verify that concerning ALMI, we found that men following a vegetarian dietary pattern had lower values (VG: 7.93 kg/m2 vs. OM: 8.40 kg/m2, p = 0.006) and a lower protein intake compared to those following a diet including animal-origin products (VG: 12.56% of TEV vs. OM: 18.61% of TEV, p = 0.002). Studies reported a statistically significant decrease in muscle mass and lean mass in men related to this plant-based diet allegedly associated with lower levels of leucine, an essential branched-chain amino acid responsible for muscle protein synthesis [40,41]. Leucine levels tend to be lower in vegetarians due to low or no intake of protein of high biological value [40,41].
The evaluation of metabolic markers indicated more accentuated differences between the dietary patterns. The vegetarian group presented significantly lower values of total cholesterol and LDL cholesterol compared to the omnivorous group. This is in line with results from other studies associating a vegetarian diet with lower levels of total cholesterol and LDL cholesterol [38,42]. Some studies suggested that low consumption of dietary cholesterol would involve a low rate of absorption and its conversion in the bloodstream [38,43], which would explain the low serum values in individuals following a vegetarian dietary regimen, as well as the higher intake of fiber here observed. However, the role of dietary cholesterol in reducing serum cholesterol levels is still a controversial issue with contradictory results [43]. There exists evidence suggesting that the consumption of saturated fat might be associated with increased LDL cholesterol and consequently increased cardiovascular risk, recommending a low consumption of saturated fat to control cholesterolemia [33]. In our study, we observed that the population following a vegetarian diet had a lower consumption of dietary cholesterol (155.29 mg vs. 349.25 mg, p ≤ 0.001) and saturated fat (7.84% of TEV vs. 9.47% of TEV, p ≤ 0.001) which could be a possible justification for the observed results. When results were analyzed considering the recommended cut-offs, we found differences between sexes that were not possible to verify in the population as a whole.
In our study, women following a vegetarian diet showed a higher percentage of hemoglobin A1c levels. Most studies on this issue suggest that vegetarian diets tend to be more beneficial for diabetes prevention control [43,44,45,46]. Consumption of dietary fiber, fruit, and vegetables has been related to lower levels of postprandial glucose and lipids [44,45]. However, most of these findings did not assess hemoglobin A1c levels or did not find reductions in its values [44,45]. A study conducted on Nepalese women found that vegetarians showed higher hemoglobin A1c levels, likely related to higher consumption of simple carbohydrates [47]. Dietary recommendations for individuals with diabetes and pre-diabetes emphasize the consumption of fruits, vegetables, whole grains, and low-energy protein [46]. The consumption of fats and simple carbohydrates (sugars) is also widely discussed in this pathology, and a daily energy consumption of more than 35% fats or 10% sugars is not recommended [46]. The female vegetarians in our study showed a high consumption of fat (40.08% of TEV, p = 0.989) and simple carbohydrates (17.29% of TEV, p = 0.247) which might contribute to explaining our results.
VAT and the VAT/SAT ratio showed moderate correlations with metabolic markers and/or cardiovascular risk. The omnivorous group showed non-significant correlations between VAT and all evaluated variables, while the vegetarian group showed non-significant correlations with MAP and cardiovascular risk. The other fat tissues showed weak correlations with these same variables. VAT volume has been associated with multiple cardiometabolic risk factors supporting the idea that VAT, besides contributing to general adiposity, also contributes to cardiometabolic risk [48]. This pathological potential of VAT has been associated with its ability to secrete pro-inflammatory and insulin-resistant adipokines. A study by Neeland et al. reported that obese individuals with high amounts of VAT also showed atherogenic dyslipidemia, hyperinsulinemia, and glucose intolerance [49]. The same profile was not present in obese individuals with low VAT values or in non-obese individuals, suggesting a relationship between higher VAT volumes and these cardiometabolic profiles [49], suggesting that VAT has a crucial impact on cardiovascular risk regardless of the dietary pattern.
Our study provides a broad and rigorous view of the main players relating to diet, body composition, and cardiovascular risk, involving (a) deep analysis of known determinants such as age, weight, height, and BMI, complemented by body composition, metabolic markers, food intake, and lifestyles, while (b) exploring body composition through DXA, a precise and reliable technology serving our original purpose. Nevertheless, some limitations must be considered, such as (i) the size and heterogeneity of the sample; (ii) the cross-sectional design of the study not allowing a cause–effect relationship; (iii) the use of an unconventional method, using capillary blood, to evaluate the metabolic parameters, since some studies described the weak correlation between capillary and venous blood values [50,51]; and (iv) the use of self-reported height for the BMI calculation [52].
5. Conclusions
In conclusion, there were no differences in 10-year cardiovascular risk between these two dietary patterns. However, vegetarian participants displayed distinct macronutrient profiles showing a lower consumption of total energy, protein, saturated fat, and dietary cholesterol while exhibiting higher intakes of carbohydrates and dietary fiber compared to those on an omnivorous diet. These dietary variations may have contributed to the observed differences in metabolic markers, where vegetarians showed significantly lower levels of total, LDL, and non–HDL cholesterol. Dietary patterns by themselves do not seem to exert differential effects on specific aspects of body composition, BMI, or WC. Nevertheless, vegetarian men showed lower levels of lean mass and ALMI when adjusted for several confounding factors. Furthermore, correlation analysis revealed significant associations between fat mass, VAT, SAT, and cardiovascular risk, emphasizing the role of adipose tissue distribution in cardiometabolic health and risk. In this way, cardiovascular risk seems to be more influenced by body composition, fat mass distribution, and VAT and SAT levels, that is, by the diet quality rather than by the dietary regimen.
Author Contributions
Conceptualization, C.F.-P. and L.M.R.; methodology, C.F.-P.; software, T.F. and S.L.; validation, C.F.-P., R.M. and L.M.R.; formal analysis, T.F., M.E. and C.F.-P.; investigation, T.F., S.L. and R.M.; resources, C.F.-P., R.M. and L.M.R.; data curation, T.F., S.L., M.E. and C.F.-P.; writing—original draft preparation, T.F.; writing—review and editing, M.E., R.M., L.M.R. and C.F.-P.; visualization, R.M., L.M.R. and C.F.-P.; supervision, C.F.-P. and L.M.R.; project administration, C.F.-P.; funding acquisition, C.F-P. and R.M. All authors have read and agreed to the published version of the manuscript.
Funding
This research was funded by national funds through the FCT—Foundation for Science and Technology, I.P. (Portugal), under the [DOI 10.54499/UIDB/04567/2020] and [DOI 10.54499/UIDP/04567/2020] projects, and by COFAC/ILIND—Cooperativa De Formação e Animação Cultural CRL/Instituto Lusófono de Investigação e Desenvolvimento (grant COFAC/ILIND/CBIOS/2/2021). C.F.-P. is funded by the FCT—Foundation for Science and Technology, I.P. (Portugal) Scientific Employment Stimulus contract [DOI 10.54499/CEECINST/00147/2018/CP1498/CT0009]. R.M. is funded by the FCT—Foundation for Science and Technology, I.P. (Portugal) Scientific Employment Stimulus contract [DOI: 10.54499/CEECINST/00002/2021/CP2788/CT0004].
Institutional Review Board Statement
The study was conducted following the Declaration of Helsinki and approved by the Ethics Committee of the School of Sciences and Health Technologies from Universidade Lusófona (EC.ECTS/P05.21, approval date 13 September 2021).
Informed Consent Statement
Informed consent was obtained from all subjects involved in the study.
Data Availability Statement
Data are unavailable due to privacy restrictions.
Acknowledgments
The authors acknowledge Elisabete Carolino for the collaboration in statistical analysis as well as all of the participants.
Conflicts of Interest
The authors declare no conflicts of interest.
References
- WHO Regional Office for Europe. WHO European Regional Obesity Report 2022; WHO Regional Office for Europe: Copenhagen, Denmark, 2022; ISBN 978-92-890-5773-8. [Google Scholar]
- Cederholm, T.; Barazzoni, R.; Austin, P.; Ballmer, P.; Biolo, G.; Bischoff, S.C.; Compher, C.; Correia, I.; Higashiguchi, T.; Holst, M.; et al. ESPEN Guidelines on Definitions and Terminology of Clinical Nutrition. Clin. Nutr. 2017, 36, 49–64. [Google Scholar] [CrossRef] [PubMed]
- Storz, C.; Heber, S.D.; Rospleszcz, S.; Machann, J.; Sellner, S.; Nikolaou, K.; Lorbeer, R.; Gatidis, S.; Elser, S.; Peters, A.; et al. The Role of Visceral and Subcutaneous Adipose Tissue Measurements and Their Ratio by Magnetic Resonance Imaging in Subjects with Prediabetes, Diabetes and Healthy Controls from a General Population without Cardiovascular Disease. Br. J. Radiol. 2018, 91, 20170808. [Google Scholar] [CrossRef] [PubMed]
- Fox, C.S.; Massaro, J.M.; Hoffmann, U.; Pou, K.M.; Maurovich-Horvat, P.; Liu, C.Y.; Vasan, R.S.; Murabito, J.M.; Meigs, J.B.; Cupples, L.A.; et al. Abdominal Visceral and Subcutaneous Adipose Tissue Compartments: Association with Metabolic Risk Factors in the Framingham Heart Study. Circulation 2007, 116, 39–48. [Google Scholar] [CrossRef] [PubMed]
- Kim, S.R.; Lee, G.; Choi, S.; Oh, Y.H.; Son, J.S.; Park, M.; Park, S.M. Changes in Predicted Lean Body Mass, Appendicular Skeletal Muscle Mass, and Body Fat Mass and Cardiovascular Disease. J. Cachexia Sarcopenia Muscle 2022, 13, 1113–1123. [Google Scholar] [CrossRef] [PubMed]
- Frühbeck, G.; Busetto, L.; Dicker, D.; Yumuk, V.; Goossens, G.H.; Hebebrand, J.; Halford, J.G.C.; Farpour-Lambert, N.J.; Blaak, E.E.; Woodward, E.; et al. The ABCD of Obesity: An EASO Position Statement on a Diagnostic Term with Clinical and Scientific Implications. Obes. Facts 2019, 12, 131–136. [Google Scholar] [CrossRef] [PubMed]
- Nielsen, S.; Guo, Z.; Johnson, C.M.; Hensrud, D.D.; Jensen, M.D. Splanchnic Lipolysis in Human Obesity. J. Clin. Investig. 2004, 113, 1582–1588. [Google Scholar] [CrossRef] [PubMed]
- Porter, S.A.; Massaro, J.M.; Hoffmann, U.; Vasan, R.S.; O’Donnel, C.J.; Fox, C.S. Abdominal Subcutaneous Adipose Tissue: A Protective Fat Depot? Diabetes Care 2009, 32, 1068–1075. [Google Scholar] [CrossRef] [PubMed]
- Hargreaves, S.M.; Raposo, A.; Saraiva, A.; Zandonadi, R.P. Vegetarian Diet: An Overview through the Perspective of Quality of Life Domains. IJERPH 2021, 18, 4067. [Google Scholar] [CrossRef]
- Fontes, T.; Rodrigues, L.M.; Ferreira-Pêgo, C. Comparison between Different Groups of Vegetarianism and Its Associations with Body Composition: A Literature Review from 2015 to 2021. Nutrients 2022, 14, 1853. [Google Scholar] [CrossRef] [PubMed]
- Pilis, W.; Stec, K.; Zych, M.; Pilis, A. Health benefits and risk associated with adopting a vegetarian diet. Natl. Inst. Public Health Natl. Inst. Hyg. 2014, 65, 9–14. [Google Scholar]
- Arnett, D.K.; Blumenthal, R.S.; Albert, M.A.; Buroker, A.B.; Goldberger, Z.D.; Hahn, E.J.; Himmelfarb, C.D.; Khera, A.; Lloyd-Jones, D.; McEvoy, J.W.; et al. 2019 ACC/AHA Guideline on the Primary Prevention of Cardiovascular Disease: A Report of the American College of Cardiology/American Heart Association Task Force on Clinical Practice Guidelines. Circulation 2019, 140, e596–e646. [Google Scholar] [CrossRef] [PubMed]
- Godfray, H.C.J.; Aveyard, P.; Garnett, T.; Hall, J.W.; Key, T.J.; Lorimer, J.; Pierrehumbert, R.T.; Scarborough, P.; Springmann, M.; Jebb, S.A. Meat Consumption, Health, and the Environment. Science 2018, 361, eaam5324. [Google Scholar] [CrossRef] [PubMed]
- Monteiro Rodrigues, L.; Menezes, R.; Andrade, S.; Fontes, T.; Lopes, S.; Ferreira-Pego, C. Dietary Pattern, Body Composition, Metabolic Markers, and Skin Physiology. Physiology 2023, 38, 5790039. [Google Scholar] [CrossRef]
- Yokoyama, Y.; Nishimura, K.; Barnard, N.D.; Takegami, M.; Watanabe, M.; Sekikawa, A.; Okamura, T.; Miyamoto, Y. Vegetarian Diets and Blood Pressure: A Meta-Analysis. JAMA Intern. Med. 2014, 174, 577. [Google Scholar] [CrossRef] [PubMed]
- Zhang, Z.; Ma, G.; Chen, S.; Li, Z.; Xia, E.; Sun, Y.; Yang, F.; Zheng, L.; Feng, X. Comparison of Plasma Triacylglycerol Levels in Vegetarians and Omnivorous: A Meta-Analysis. Nutrition 2013, 29, 426–430. [Google Scholar] [CrossRef] [PubMed]
- Ferreira-Pêgo, C.; Giacomelli Tavares, R.; Lopes, S.; Fontes, T.; Monteiro Rodrigues, L. Body Composition Assessment of Vegetarian-Vegan and Omnivorous Young Women—An Exploratory Study: Body Composition Assessment of Vegetarian-Vegan and Omnivorous Young Women—An Exploratory Study. BBR 2021, 18, 15. [Google Scholar] [CrossRef]
- He, Y.-M.; Chen, W.-L.; Kao, T.-W.; Wu, L.-W.; Yang, H.-F.; Peng, T.-C. Association Between Ideal Cardiovascular Health and Vegetarian Dietary Patterns Among Community-Dwelling Individuals. Front. Nutr. 2022, 9, 761982. [Google Scholar] [CrossRef] [PubMed]
- World Medical Association (WMA). Declaration of Helsinki—Ethical Principles for Medical Research Involving Human Subjects. J. Am. Coll. Dent. 2013, 81, 14–18. [Google Scholar]
- Instituto Nacional de Estatística. Nuts 2013|As Novas Unidades Territoriais Para Fins Estatísticos; Instituto Nacional de Estatística: Lisboa, Portugal, 2015. [Google Scholar]
- Craig, C.L.; Marshall, A.L.; Sjöström, M.; Bauman, A.E.; Booth, M.L.; Ainsworth, B.E.; Pratt, M.; Ekelund, U.; Yngve, A.; Sallis, J.F.; et al. International Physical Activity Questionnaire: 12-Country Reliability and Validity. Med. Sci. Sports Exerc. 2003, 35, 1381–1395. [Google Scholar] [CrossRef] [PubMed]
- Lopes, C.; Aro, A.; Azevedo, A.; Ramos, E.; Barros, H. Intake and Adipose Tissue Composition of Fatty Acids and Risk of Myocardial Infarction in a Male Portuguese Community Sample. J. Am. Diet. Assoc. 2007, 107, 276–286. [Google Scholar] [CrossRef]
- Keys, A.; Fidanza, F.; Karvonen, M.; Kimura, N.; Taylor, H.L. Indices of relative weight and obesity. J. Chronic Dis. 1972, 25, 329–343. [Google Scholar] [CrossRef] [PubMed]
- Baumgartner, R.N.; Koehler, K.M.; Gallagher, D.; Romero, L.; Heymsfield, S.B.; Ross, R.R.; Garry, P.J.; Lindeman, R.D. Epidemiology of Sarcopenia among the Elderly in New Mexico. Am. J. Epidemiol. 1998, 147, 755–763. [Google Scholar] [CrossRef] [PubMed]
- Woolcott, O.O.; Bergman, R.N. Defining Cutoffs to Diagnose Obesity Using the Relative Fat Mass (RFM): Association with Mortality in NHANES 1999–2014. Int. J. Obes. 2020, 44, 1301–1310. [Google Scholar] [CrossRef] [PubMed]
- Cruz-Jentoft, A.J.; Bahat, G.; Bauer, J.; Boirie, Y.; Bruyère, O.; Cederholm, T.; Cooper, C.; Landi, F.; Rolland, Y.; Sayer, A.A.; et al. Sarcopenia: Revised European Consensus on Definition and Diagnosis. Age Ageing 2019, 48, 16–31. [Google Scholar] [CrossRef] [PubMed]
- Cederholm, T.; Jensen, G.L.; Correia, M.I.T.D.; Gonzalez, M.C.; Fukushima, R.; Higashiguchi, T.; Baptista, G.; Barazzoni, R.; Blaauw, R.; Coats, A.; et al. GLIM Criteria for the Diagnosis of Malnutrition—A Consensus Report from the Global Clinical Nutrition Community. Clin. Nutr. 2019, 38, 207–217. [Google Scholar] [CrossRef] [PubMed]
- World Health Organization. Waist Circumference and Waist-Hip Ratio: Report of a WHO Expert Consultation. Geneva, Switzerland, 8–11 December 2008; 2011. Available online: https://iris.who.int/bitstream/handle/10665/44583/9789241501491_eng.pdf?sequence=1 (accessed on 18 June 2024).
- Visseren, F.L.J.; Mach, F.; Smulders, Y.M.; Carballo, D.; Koskinas, K.C.; Bäck, M.; Benetos, A.; Biffi, A.; Boavida, J.-M.; Capodanno, D.; et al. 2021 ESC Guidelines on Cardiovascular Disease Prevention in Clinical Practice. Eur. Heart J. 2021, 42, 3227–3337. [Google Scholar] [CrossRef] [PubMed]
- Magder, S. The Meaning of Blood Pressure. Crit. Care 2018, 22, 257. [Google Scholar] [CrossRef] [PubMed]
- American Diabetes Association. Standards of Medical Care in Diabetes—2022 Abridged for Primary Care Providers. Clin. Diabetes 2022, 40, 10–38. [Google Scholar] [CrossRef] [PubMed]
- Mach, F.; Baigent, C.; Catapano, A.L.; Koskinas, K.C.; Casula, M.; Badimon, L.; Chapman, M.J.; De Backer, G.G.; Delgado, V.; Ference, B.A.; et al. 2019 ESC/EAS Guidelines for the Management of Dyslipidaemias: Lipid Modification to Reduce Cardiovascular Risk. Eur. Heart J. 2020, 41, 111–188. [Google Scholar] [CrossRef] [PubMed]
- Alberti, K.G.M.M.; Eckel, R.H.; Grundy, S.M.; Zimmet, P.Z.; Cleeman, J.I.; Donato, K.A.; Fruchart, J.-C.; James, W.P.T.; Loria, C.M.; Smith, S.C. Harmonizing the Metabolic Syndrome: A Joint Interim Statement of the International Diabetes Federation Task Force on Epidemiology and Prevention; National Heart, Lung, and Blood Institute; American Heart Association; World Heart Federation; International Atherosclerosis Society; and International Association for the Study of Obesity. Circulation 2009, 120, 1640–1645. [Google Scholar] [CrossRef] [PubMed]
- Hippisley-Cox, J.; Coupland, C.; Brindle, P. Development and Validation of QRISK3 Risk Prediction Algorithms to Estimate Future Risk of Cardiovascular Disease: Prospective Cohort Study. BMJ 2017, 357, j2099. [Google Scholar] [CrossRef] [PubMed]
- Free Software Foundation GNU Lesser General Public License v3.0—GNU Project. Available online: https://www.gnu.org/licenses/lgpl-3.0-standalone.html (accessed on 18 June 2024).
- Kahleova, H.; Dort, S.; Holubkov, R.; Barnard, N. A Plant-Based High-Carbohydrate, Low-Fat Diet in Overweight Individuals in a 16-Week Randomized Clinical Trial: The Role of Carbohydrates. Nutrients 2018, 10, 1302. [Google Scholar] [CrossRef] [PubMed]
- Kahleova, H.; Hlozkova, A.; Fleeman, R.; Fletcher, K.; Holubkov, R.; Barnard, N.D. Fat Quantity and Quality, as Part of a Low-Fat, Vegan Diet, Are Associated with Changes in Body Composition, Insulin Resistance, and Insulin Secretion. A 16-Week Randomized Controlled Trial. Nutrients 2019, 11, 615. [Google Scholar] [CrossRef] [PubMed]
- Sofi, F.; Dinu, M.; Pagliai, G.; Cesari, F.; Gori, A.M.; Sereni, A.; Becatti, M.; Fiorillo, C.; Marcucci, R.; Casini, A. Low-Calorie Vegetarian Versus Mediterranean Diets for Reducing Body Weight and Improving Cardiovascular Risk Profile: CARDIVEG Study (Cardiovascular Prevention With Vegetarian Diet). Circulation 2018, 137, 1103–1113. [Google Scholar] [CrossRef] [PubMed]
- Shah, B.; Newman, J.D.; Woolf, K.; Ganguzza, L.; Guo, Y.; Allen, N.; Zhong, J.; Fisher, E.A.; Slater, J. Anti-Inflammatory Effects of a Vegan Diet Versus the American Heart Association–Recommended Diet in Coronary Artery Disease Trial. JAHA 2018, 7, e011367. [Google Scholar] [CrossRef]
- Zhang, H.J.; He, J.; Pan, L.L.; Ma, Z.M.; Han, C.K.; Chen, C.S.; Chen, Z.; Han, H.W.; Chen, S.; Sun, Q.; et al. Effects of Moderate and Vigorous Exercise on Nonalcoholic Fatty Liver Disease: A Randomized Clinical Trial. JAMA Intern. Med. 2016, 176, 1074. [Google Scholar] [CrossRef]
- Duan, Y.; Li, F.; Li, Y.; Tang, Y.; Kong, X.; Feng, Z.; Anthony, T.G.; Watford, M.; Hou, Y.; Wu, G.; et al. The Role of Leucine and Its Metabolites in Protein and Energy Metabolism. Amino Acids 2016, 48, 41–51. [Google Scholar] [CrossRef]
- Oussalah, A.; Levy, J.; Berthezène, C.; Alpers, D.H.; Guéant, J.-L. Health Outcomes Associated with Vegetarian Diets: An Umbrella Review of Systematic Reviews and Meta-Analyses. Clin. Nutr. 2020, 39, 3283–3307. [Google Scholar] [CrossRef] [PubMed]
- Hu, F.B.; Rosner, B.A. Dietary Fat Intake and the Risk of Coronary Heart Disease in Women. N. Engl. J. Med. 1997, 337, 1491–1499. [Google Scholar] [CrossRef]
- Chandalia, M.; Garg, A.; Lutjohann, D.; Von Bergmann, K.; Grundy, S.M.; Brinkley, L.J. Beneficial Effects of High Dietary Fiber Intake in Patients with Type 2 Diabetes Mellitus. N. Engl. J. Med. 2000, 342, 1392–1398. [Google Scholar] [CrossRef] [PubMed]
- Jenkins, D.J.; Kendall, C.W.; Marchie, A.; Jenkins, A.L.; Augustin, L.S.; Ludwig, D.S.; Barnard, N.D.; Anderson, J.W. Type 2 Diabetes and the Vegetarian Diet. Am. J. Clin. Nutr. 2003, 78, 610S–616S. [Google Scholar] [CrossRef] [PubMed]
- Rydén, L.; Grant, P.J.; Anker, S.D.; Berne, C.; Cosentino, F.; Danchin, N.; Deaton, C.; Escaned, J.; Hammes, H.P.; Huikuri, H.; et al. The Task Force on Diabetes, Pre-Diabetes, and Cardiovascular Diseases of the European Society of Cardiology (ESC) and Developed in Collaboration with the European Association for the Study of Diabetes (EASD). Rev. Española Cardiol. 2014, 67, 136. [Google Scholar] [CrossRef]
- Yogal, C.; Shakya, S.; Karmarcharya, B.; Koju, R.; Stunes, A.K.; Mosti, M.P.; Gustafsson, M.K.; Åsvold, B.O.; Schei, B.; Syversen, U. Unni Syversen Diabetes Prevalence and Associated Risk Factors among Women in a Rural District of Nepal Using HbA1c as a Diagnostic Tool: A Population-Based Study. IJERPH 2022, 1, 7011. [Google Scholar] [CrossRef] [PubMed]
- Abraham, T.M.; Pedley, A.; Massaro, J.M.; Hoffmann, U.; Fox, C.S. Association Between Visceral and Subcutaneous Adipose Depots and Incident Cardiovascular Disease Risk Factors. Circulation 2015, 132, 1639–1647. [Google Scholar] [CrossRef] [PubMed]
- Neeland, I.J.; Poirier, P.; Després, J.P. Cardiovascular and Metabolic Heterogeneity of Obesity: Clinical Challenges and Implications for Management. Circulation 2018, 137, 1391–1406. [Google Scholar] [CrossRef]
- Saito, K.; Ueno, S.; Nakayama, A.; Nitta, S.; Arai, K.; Hasunuma, T.; Saito, Y. Overall Similarities and a Possible Factor Affecting Plasma Metabolome Profiles Between Venous and Capillary Blood Samples From 20 Healthy Human Males. J. Pharm. Sci. 2019, 108, 3737–3744. [Google Scholar] [CrossRef] [PubMed]
- Stahl, M.; Brandslund, I.; Jørgensen, L.G.M.; Petersen, P.H.; Borch-Johnsen, K.; Olivarius, N.D.F. Can Capillary Whole Blood Glucose and Venous Plasma Glucose Measurements Be Used Interchangeably in Diagnosis of Diabetes Mellitus? Scand. J. Clin. Lab. Investig. 2002, 62, 159–166. [Google Scholar] [CrossRef] [PubMed]
- Lipsky, L.M.; Haynie, D.L.; Hill, C.; Nansel, T.R.; Li, K.; Liu, D.; Iannotti, R.J.; Simons-Morton, B. Accuracy of Self-Reported Height, Weight, and BMI Over Time in Emerging Adults. Am. J. Prev. Med. 2019, 56, 860–868. [Google Scholar] [CrossRef] [PubMed]
Disclaimer/Publisher’s Note: The statements, opinions and data contained in all publications are solely those of the individual author(s) and contributor(s) and not of MDPI and/or the editor(s). MDPI and/or the editor(s) disclaim responsibility for any injury to people or property resulting from any ideas, methods, instructions or products referred to in the content. |
© 2024 by the authors. Licensee MDPI, Basel, Switzerland. This article is an open access article distributed under the terms and conditions of the Creative Commons Attribution (CC BY) license (https://creativecommons.org/licenses/by/4.0/).