Abstract
Nut-based products are a good source of high-quality plant protein in addition to mono- and polyunsaturated fatty acids, and may aid low-glycaemic dietary strategies important for the prevention of type 2 diabetes (T2D). In particular, they may be advantageous in populations susceptible to dysglycaemia, such as Asian Chinese. The present study aimed to compare effects of a higher-protein nut bar (HP-NB, also higher in total fibre and unsaturated fats, comprising mixed almonds and peanuts) vs. an isoenergetic higher-carbohydrate cereal bar (HC-CB) within the diet of 101 Chinese adults with overweight and normo- or hyperglycaemia. Ectopic pancreas and liver fat were characterised using magnetic resonance imaging and spectroscopy (MRI/S) as a secondary outcome. Participants were randomized to receive HP-NB or HC-CB daily as a 1 MJ light meal or snack replacement, in addition to healthy eating advice. Anthropometry and clinical indicators of T2D risk were assessed fasted and during an oral glucose tolerance test (OGTT), pre- and post-intervention. No significant difference was observed between diet groups for body weight, body mass index, waist or hip circumference, blood pressure, glucoregulatory markers, lipid profile or inflammatory markers over 12 weeks (all, p > 0.05). No difference was observed between glycaemic subgroups or those with normal versus high ectopic organ fat. Although HP-NB can attenuate postprandial glycaemia following a meal, no effects were observed for either fasting or glucose-mediated outcomes following longer-term inclusion in the habitual diet of Chinese adults with overweight, including at-risk subgroups.
1. Introduction
The prevalence of type 2 diabetes (T2D) has escalated worldwide to 536 million in 2021, and is estimated to rise further to 578 million by 2030 [1]. In China, the total number of adults with T2D has reached 116 million (one in nine adults), the biggest population with T2D globally [1]. Evidence has shown an increased susceptibility to T2D at a low body mass index (BMI) in Asian Chinese compared to many other ethnicities, with a predisposition to pancreatic β-cell dysfunction and insulin resistance, and thus dysglycaemia [2]. It is hypothesized that higher ectopic fat deposition in organs such as the pancreas and liver may typify Chinese individuals who in turn are characterized by the thin-on-the-outside-fat-on-the-inside (TOFI) phenotype [3,4,5]. The TOFI phenotype is an important determinant of hepatic insulin resistance, propagating a negative cycle leading to worsening β-cell dysfunction and T2D [6,7,8]. When exposed to repeated acute postprandial hyperglycaemia, Asian cohorts are subjected to a higher risk of multiple metabolic disorders [9,10], with evidence of adverse glycaemic excursions [11,12,13].
Nuts are proposed to play a role in ameliorating the risk of T2D [14], owing to macro-and micro-nutrient content and bioactive compounds that may work synergistically to lower postprandial glycaemia. Whilst not meeting the botanical definition of a ‘true nut’, peanuts (Arachis hypogaea, ground nut, legume) and almonds (Prunus dulcis, tree nut, drupe) are considered to be within the wider grouping of edible nuts. As such, nuts are a good source of high-quality plant protein, mono- (MUFAs) and polyunsaturated fatty acids (PUFAs), and low glycaemic index (GI) dietary fibre, which are proposed to improve blood lipid profiles, decrease insulin resistance, decrease inflammation and oxidative stress, and modulate endothelial function [15,16,17], as well as potentially promote satiety [18]. There is inconsistent evidence for improvements in blood pressure [17]. Other bioactive compounds present in nuts, such as polyphenol quercetin, may exhibit protective mechanisms including acute inhibition of postprandial α-amylase and α-glucosidase activity and longer-term changes in the gut microbiome [14,19,20]. Lowering the GI or glycaemic load (GL) can benefit postprandial blood glucose and, in turn, may decrease long-term risk of T2D and CVD [10,21]. The beneficial effects of a diet rich in nuts on long-term glycaemic control has been demonstrated in the large European cardiovascular disease (CVD) prevention study PREDIMED (Prevención con Dieta Mediterránea) [22], an intervention in ~7500 participants. Notably, other meta-analyses have shown the Mediterranean diet to be associated with prevention/improvement in fatty liver [23].
Further, a systematic review and meta-analysis of randomized controlled trials (RCTs) in 2019 reported that tree nut and/or peanut consumption had a favourable effect on fasting insulin and insulin resistance (IR) as defined by the homeostatic model assessment model HOMA-IR, although no significant improvements were observed in fasting plasma glucose (FPG) or the longer-term biomarker glycated haemoglobin (HbA1c) [24]. The authors proposed that protective effects may be driven through improved insulin sensitivity [24].
Compared to the Mediterranean diet, nuts may be a less common food item in the traditional Chinese diet. The Chinese Centre for Disease Control and Prevention reported daily nut consumption to be as low as 3.8 g/day, based on self-reported intake assessed at 150 sites across 31 provinces in the China National Nutrition and Health Survey [25]. This is significantly lower than, for example, the 28 g/day recommended intake proposed in a previous meta-analysis and systematic review of RCTs of walnut interventions [26] and supported in several meta-analyses of prospective cohort studies of nut consumption [27,28]. Certainly, low nut intake has been one of several dietary factors associated with increased CVD risk in the Chinese population [29]. RCTs of nut consumption in Chinese individuals at increased risk of T2D are lacking in the literature. In a Tū Ora postprandial study, we recently reported in a cohort of individuals of Asian Chinese descent that a nut-based snack product significantly improved acute glucose response compared with a typical energy-matched cereal-based snack [30]. This was observed when consumed either alone or with other foods containing a high content of refined carbohydrate (CHO, e.g., white bread), in a group of participants with overweight and prediabetes [30]. A similar acute postprandial study has also recently shown an almond ‘snack’ to suppress both glycaemia and energy intake when compared to an isoenergetic CHO-rich snack in healthy adults both lean and overweight [31]. In the absence of body weight gain when extended over 12 months, this again promoted inclusion of almonds in the diet [32]. Of note in our original study [30], magnetic resonance (MR) assessment of pancreas and liver fat revealed greater suppression of (adverse) postprandial blood glucose peaks by the nut product in the subgroup with low organ fat content, confirming the role of ectopic fat deposition in nutrient response. Fatty pancreas and/or liver worsened this protective dietary response. However, longer-term effects of including a nut-enriched vs. a cereal-rich product in individuals with overweight, in whom blood glucose and ectopic fat are characterized, has not as yet been assessed. Our current Tū Ora 12-week RCT therefore aimed to investigate the effect of a higher-protein, lower-GI nut-enriched product on fasting glycaemia, insulin and related metabolic markers when consumed daily for a duration of 3 months as a replacement for one meal or snack in Chinese men and women with overweight.
2. Materials and Methods
A two-arm, parallel-group, dual-centre randomized clinical trial (RCT) was conducted at the Human Nutrition Unit (HNU), University of Auckland, and the Centre of Endocrinology and Diabetes and Obesity Research (CEDOR), Capital and Coast Health, Wellington, New Zealand. Ethical approval was obtained from the National Health and Disabilities Ethics Committee (HDEC), Auckland, New Zealand (18/NTB/1/). The study was registered with the Australian New Zealand Clinical Trials Registry (ACTRN12618000476235). All participants received an information sheet detailing the study protocol and provided written informed consent.
2.1. Participants
Participants were recruited from the greater Auckland (AKL) and Wellington (WLG) regions through local and social media advertisements. Eligibility criteria were ethnic Chinese descent defined by self-identification of the participant and both parents, 25–70 years of age, BMI 23–40 kg/m2, Finnish Diabetes Risk Score (FINDRISC) ≥ 12 [33], with prediabetes based on the American Diabetes Association (ADA)-defined impaired fasting glucose (IFG), 5.6–6.9 mmol/L [34], and otherwise healthy. Impaired glucose tolerance was not used as an inclusion criterion at screening. Participants were excluded based on change in bodyweight of >5% over the previous 3 months, prior or current significant disease including T2D, current medication likely to affect body weight or glucose metabolism, and tree nut, peanut or other associated food allergies.
All participants attended a screening visit in clinic where body weight, height and blood pressure were recorded and a fasted venous blood sample was collected for the same-day analysis of blood glucose. A total of 187 individuals were assessed for eligibility, of which 106 (AKL n = 90; WLG n = 16) participants were enrolled into the study. All enrolled participants were confirmed with raised FPG within the ADA cut-points at the screen visit. There was then a delay of up to 6 weeks between screening/enrolment and start of the diet intervention with participants grouped into cohorts of n = 10 to facilitate conduct of the trial.
2.2. Diet Groups
All enrolled participants were randomized to one of two diet groups: (1) higher-protein nut bar (HP-NB) or (2) isoenergetic higher-CHO cereal bar (HC-CB). A computer-generated random number sequence provided randomization tables stratified for the two clinical sites. Both sites were given the same randomization sequence (i.e., an equal ratio of two diet groups: 1:1). No block randomization was used. The trial was unblinded, with open allocation to diet group. Ingredient composition of HP-NB and HC-CB products has been detailed previously [30]. Briefly, the HP-NB was formulated to contain (i) the recommended daily serving of nuts > 28 g/day [26] comprising almonds and peanuts, (ii) higher total protein, (iii) higher total and unsaturated fat and (iv) lower total CHO and free sugars. The HC-CB was formulated to comprise (i) matched energy content, (ii) higher cereal content, (iii) higher total CHO and free sugars and (iv) lower total fat (Table 1).

Table 1.
Energy and macronutrient composition of the intervention products.
Both products were manufactured by the High Value Nutrition Science of Food team based at the Riddet Institute, Massey University FoodPILOT (Palmerston North, New Zealand) with manufacturing advice provided by The Griffin’s Food Company™ (Auckland, New Zealand) and the NUKU ki te PukuTM (Wellington, New Zealand) coalition of Māori food and beverage businesses.
2.3. Study Design
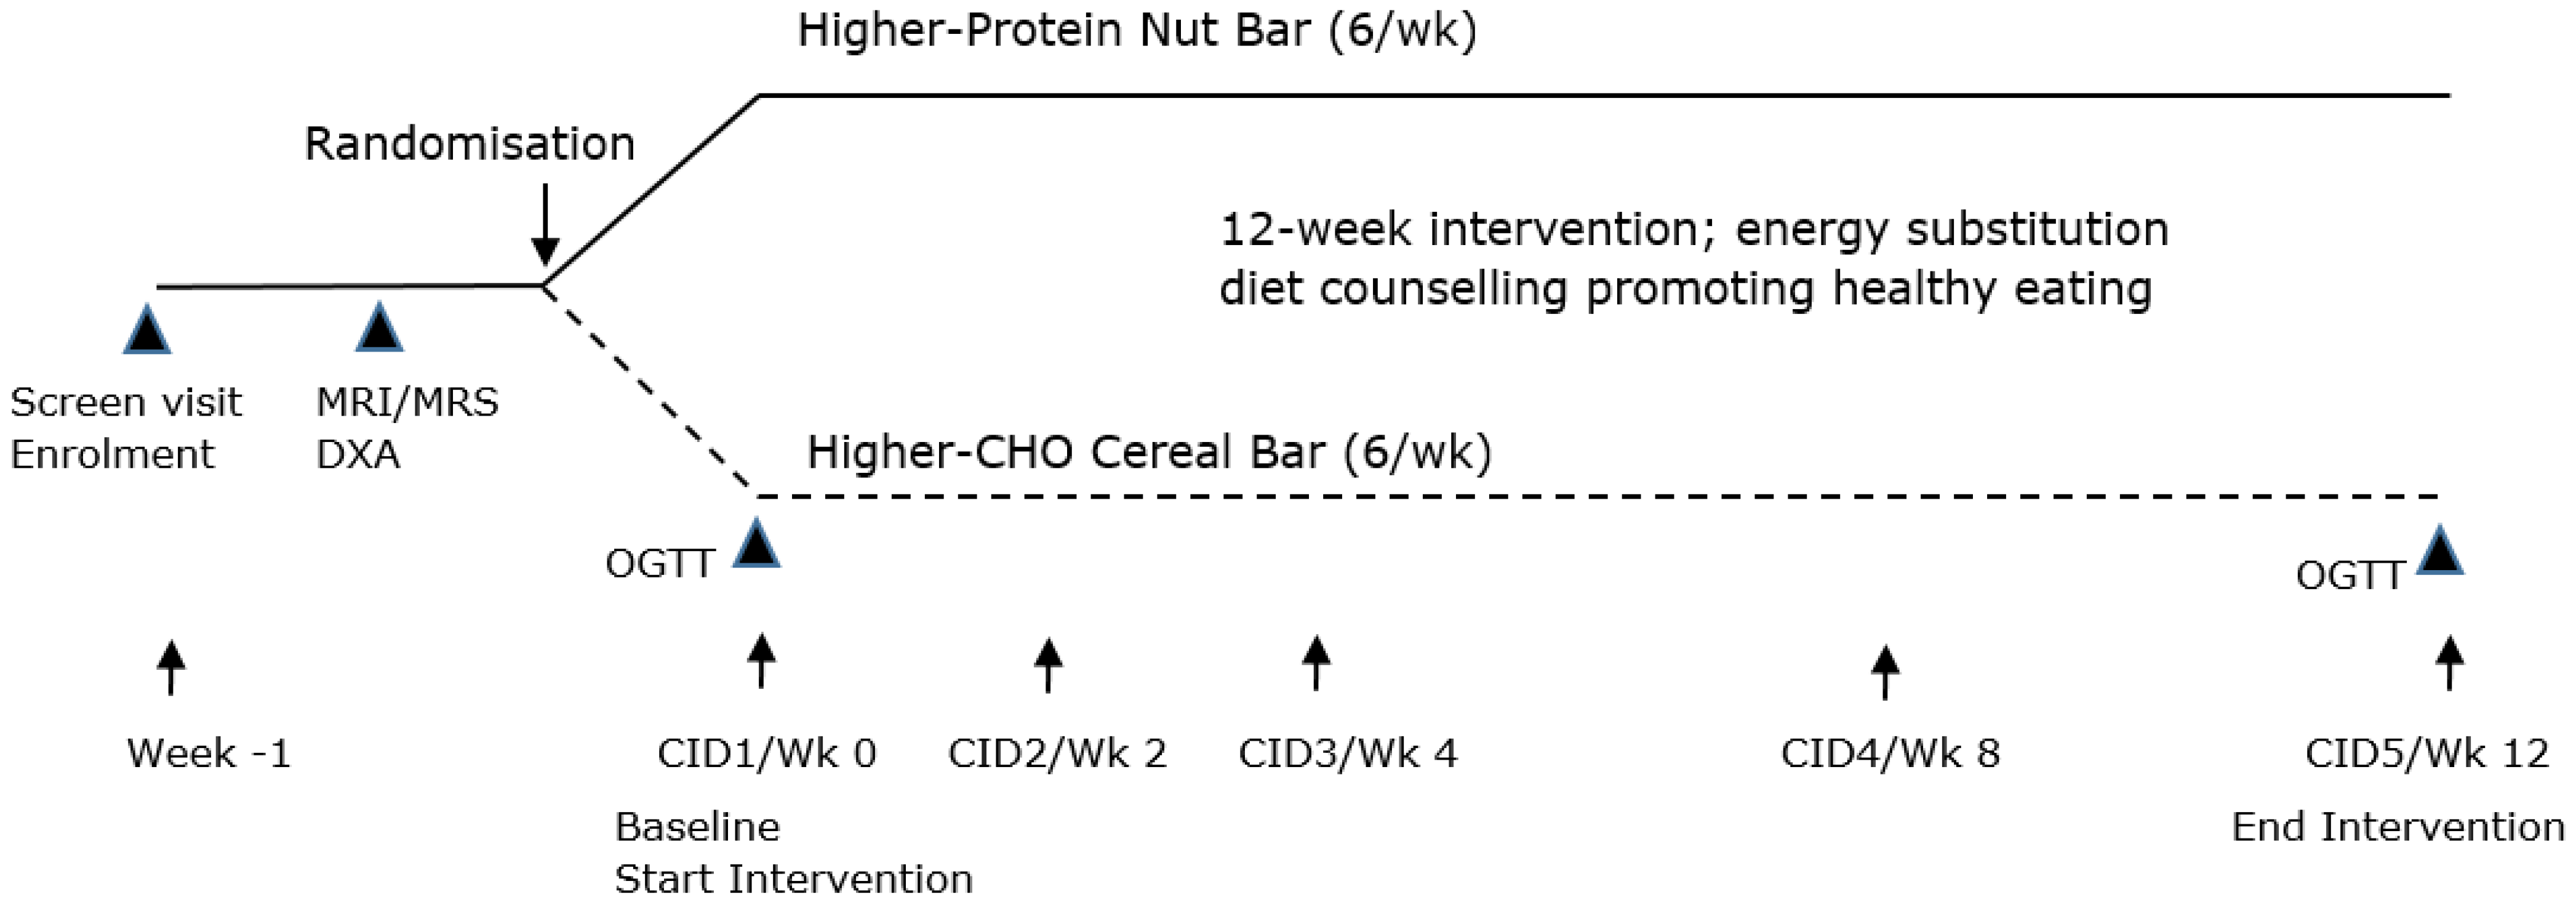
Each participant attended 5 clinical investigation days (CIDs), as shown in Figure 1. CID1/baseline (week 0), CID 2 (week 2), CID 3 (week 4), CID 4 (week 8) and CID 5/end of study (week 12). All CIDs were completed in the morning, with participants fasted overnight prior to each clinic visit. Following the start of the diet intervention, participants were asked to maintain their current dietary, medication and lifestyle habits over the 12-week study period. A week prior to CID1, each participant underwent dual-energy X-ray absorptiometry (DXA) scanning to assess total body and abdominal fat, and magnetic resonance imaging (MRI) and spectroscopy (MRS) to assess abdominal, pancreatic and liver fat.
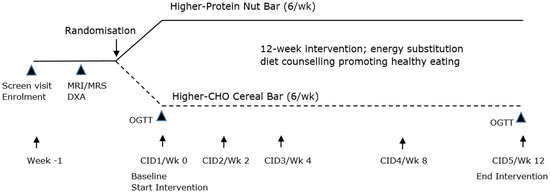
Figure 1.
Study design. CHO, carbohydrate; CID, clinical investigation day; Wk, week; OGTT, oral glucose tolerance test; MRI, magnetic resonance imaging; MRS, magnetic resonance spectroscopy; and DXA, dual-energy X-ray absorptiometry.
At CID1 and CID 5, assessments comprised anthropometry, blood pressure and fasted blood tests including FPG, insulin, HbA1c, lipid profile and inflammatory markers. Additionally a 2 h oral glucose tolerance test (OGTT, 75 g glucose) was conducted, with glucose and insulin sequentially assessed at 0, 30, 60, 90 and 120 min. All blood samples were stored frozen at −80 °C until batch analysis of all participants upon completion of the intervention.
All participants completed a 10-question Eating Habit Questionnaire (EHQ) at baseline to record habitual dietary pattern and meal or snack times [36]. Based on this information, a dietitian instructed participants to incorporate HP-NB or HC-CB test products into their daily diet, substituting for one meal or snack at least 5 days per week. Participants were provided with these products at each CID visit, with a total of 72 bars dispensed during the 12-week intervention (6/week). The dietary plan was energy substitution, not addition, across the intervention period. Dietary counselling on healthy eating habits to decrease risk of T2D was provided, based on the Eating and Activity Guidelines for New Zealand Adults, Chinese Dietary Guidelines [37] and China Medical Nutrition Therapy (MNT) Guidelines for Diabetes [38]. These recommendations focused on the 4 macronutrient groups. In summary, recommendations were to avoid added sugars; increase fibre intake from whole grains, legumes, and a variety of colourful fruits and vegetables; decrease saturated fat from animal products and increase unsaturated fat from plant-based products; increase lean meat and meat alternatives; moderate alcohol consumption; and limit salt intake. Participants were requested to not begin vitamin or mineral supplements during the study.
At CID2, CID3 and CID4, body weight was recorded and fasted blood collected for assessment of FPG and insulin.
2.4. Anthropometry
Body weight and height were assessed using a calibrated scale (AKL: Mettler Toledo Spider, Colombus, OH, US; WLG: Tanita Corporation, Tokyo, Japan) and stadiometer (AKL: Seca 222, Hamburg, Germany; WLG: Holtain Ltd., Crymych, UK), while lightly clad and without shoes or a hat. Waist and hip circumference were measured using a nonstretch anthropometric tape (Abbott Laboratories, Green Oaks, IL, USA). Blood pressure was measured seated following >3 min rest, on the non-dominant arm using an automated Digital Critikon Dinamap Sphygmomanometer (GE Healthcare, Shanghai, China).
2.5. Body Composition—DXA
DXA whole-body scans were conducted in the body composition laboratory of the Department of Surgery, University of Auckland (iDXA, software v.15, GE-Lunar, Madison, WI, US), and CEDOR, University of Otago, Wellington (Horizon DXA system, Hologic, Marlborough, MA, USA) using standardised imaging and body positioning protocols [39]. Total fat mass (TFM), total fat-free mass (FFM), TFM percentage (%), abdominal fat mass (AbFM) and abdominal fat mass percentage (AbFM%) were measured in the supine position as previously described [30].
2.6. Body Composition—MRI and MRS Organ Fat Imaging
MRI/MRS imaging was conducted on a 3T Magnetom Skyra scanner (Siemens, Munich, Germany) in both AKL and WLG, located at the Centre for Advanced Magnetic Resonance Imaging (CAMRI), University of Auckland, and Pacific Radiology, Wellington, respectively. Fast sagittal localizing abdominal images from the diaphragm to pelvis were acquired using the 3D dual gradient-echo sequence (VIBE) 2-point Dixon method [40]. Visceral (VAT) and subcutaneous adipose tissue (SAT) were quantified from a single fat fraction map at the L4-L5 intervertebral disc space [41] using ImageJ v1.51 [42]. Pancreas fat was determined using the ‘MR-opsy’ method [43] with thresholding (1–20%) applied to eliminate any inclusion of non-parenchymal tissue. MRS was performed using a respiratory-gated sequence [44], and liver fat was calculated using the SIVIC software v0.9.105 [45] from the area under the curve (AUC) of water and fat peaks from non-water-suppressed spectra and presented as percentage volume/volume. Pancreas images from 3 participants contained artefacts and could not be analysed; hence, pancreas fat percentage (%) was measured in 98 participants. Additionally, the spectroscopy signal obtained from one participant could not be analysed; hence, liver fat percentage (%) was measured in 100 participants.
Based on weighted means as reported in a recent meta-analysis, ≥4.5% was used to classify those with high pancreas fat [8], which aligned with median value of 4.53% calculated from a prior data set from our laboratory [46], and ≥5.6% for those with elevated liver fat [47]. Following quantification and classification based on these internal cut-points, participants with either high pancreas fat and/or high liver fat were characterized as high ectopic fat (HEF). Participants without high pancreas and without high liver fat were characterized as normal ectopic fat (NEF).
2.7. Blood Sample Analyses
At screening, fasting plasma glucose (FPG) was measured in AKL from whole blood using a Reflotron Plus Desk Top Analyzer (Roche, Basel, Switzerland) and in WLG from plasma using a COBAS c331 auto analyzer (Roche, Basel, CH). During the intervention, serum and plasma samples were collected and centrifuged at 1400× g for 10 min at 4 °C. Aliquots were then prepared and stored at −80 °C for batch analysis of all participants at the end of the study. Plasma glucose was collected in fluoride oxalate vacutainer tubes and determined using a COBAS c311 hexokinase method auto analyzer (Roche, Basel, CH, Switherland). Serum insulin was collected in a serum-separating tube and determined by electrochemiluminescence immunoassay (ECLIA) using a COBAS e400 auto analyzer (Roche, Basel, CH, Switzerland). Insulin sensitivity was calculated using the Homeostatic Model Assessment of Insulin Resistance (HOMA-IR) method: HOMA-IR = fasting insulin (µU/mL) × FPG (mmol/L)/22.5 [48]. Total cholesterol (TC), HDL-cholesterol (HDL-C) and triglyceride (TG) were measured using a COBAS c311auto analyzer (Roche, Basel, CH, Switzerland). LDL-cholesterol (LDL-C) was calculated using the Friedewald equation [49]. Plasma and neuro-inflammatory markers interleukin-6 (IL-6), high-sensitivity C-reactive protein (hsCRP), Dickkopf-1 (DKK-1), brain-derived neurotrophic factor (BDNF) and S100 calcium-binding protein beta (S100beta; Mybiosource, San Diego, CA, USA) were determined by colorimetry using Human ELISA kits (Abcam, Cambridge, UK).
2.8. Compliance Assessment
Daily energy intake (DEI) was self-reported on 3 occasions at CID1/baseline, CID4 and CID5 using a 110-item food frequency questionnaire (FFQ), modified from the 137-item 2008/09 New Zealand Adult Nutrition Survey [50]. The total number of intervention products consumed was also recorded at each CID visit, based on participant home records. Compliance to dietary products over the 12-week intervention was calculated as: Compliance (%) = (total no. bars consumed/total no. bars dispensed) × 100.
2.9. Statistical Analysis
Participant characteristics at CID1/baseline are expressed as mean and standard deviation (SD). An independent sample t-test was used to compare between HP-NB and HC-CB diet groups, subgroups with normoglycaemia and prediabetes, and NEF and HEF subgroups. Efficacy endpoints are expressed as mean and standard error of the mean (SEM). Diet group effects at CID5/12 weeks were analysed using two-way repeated measures ANOVA (diet*time interaction) and Bonferroni’s post hoc analysis. Effects of diet at 12 weeks between subgroups with normoglycaemia and prediabetes, and between NEF and HEF subgroups, were analysed using a three-way repeated measures ANOVA, and Tukey’s post hoc multiple comparisons test. At CID1 and CID5, the OGTT incremental area under the curve (iAUC) of glucose and insulin was calculated using the trapezoid method, including both positive and negative peaks. Peak concentration (Cmax,) for glucose and insulin was also recorded from the 2 h curves. Change over 12 weeks for OGTT parameters was compared between HP-NB and HC-CB diet groups using a three-way ANCOVA and Bonferroni’s post hoc analysis. % compliance to treatment was compared between diet groups using an independent sample t-test. All data were analysed using Prism 8 (GraphPad Software v8.0, San Diego, CA, USA) in n = 101 and n = 97 participants at CID1 and CID5, respectively. Missing data in repeat measures analyses (anthropometry, clinical samples) were imputed at CID 1/baseline using the group mean and at later time points using the last value carried forward (LVCF) method. Missing data for outcomes assessed only at, or prior to, CID1/baseline (DXA and MRI/MRS body composition) were not imputed. p ≤ 0.05 represented statistical significance.
3. Results
3.1. Participant Flow and Characteristics at CID1/Baseline
The participant flow chart is shown in Figure 2. A total of 106 participants met the inclusion criteria and were randomized to the two diet groups. Mean (SD) FPG at randomization was 6.1 (0.4) mmol/L. Five participants withdrew prior to CID1/baseline (AKL, n = 3; WLG, n = 2), all from the HC-CB diet group. Hence, 101 participants (M:F, 54:47) were assessed at CID1 and started the intervention, of which 97 then completed the 12-week period. Data analysis was undertaken for the n = 97 completers. At CID1, the mean FPG for all participants was 5.5 (0.6) mmol/L. The baseline characteristics of participants in the HP-NB and HC-CB diet groups, and also glycaemic and ectopic fat subgroups, are shown in Table 2.
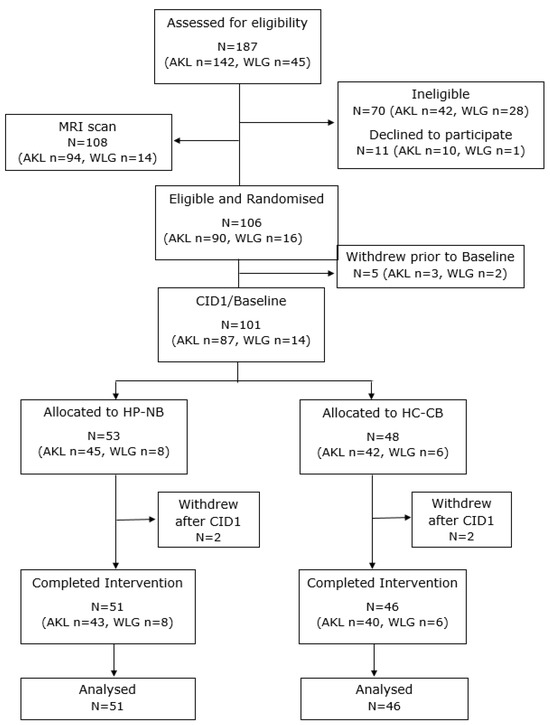
Figure 2.
CONSORT flowchart of participants. AKL: Auckland site; CID1: clinical investigation day 1/baseline; HC-CB: higher-CHO cereal bar; HP-NB: higher-protein nut bar; and WLG: Wellington site.
Table 2.
Participant characteristics at baseline for all and sub-group diet, glycaemia, ectopic fat.
3.2. Compliance to Treatment
Both diet groups reported high compliance to the test bars over the 12-week intervention. In the 97 completers, the mean compliance was 82% and 85% in the HP-NB and HC-CB groups, respectively, with no difference between groups (p > 0.05, Table 3). Over half of all participants (HP-NB: 59%; HC-CB: 67%) consumed the minimum of five (out of six) bars per week across each of the 12 weeks of the study.
Table 3.
Compliance over the 12-week intervention.
3.3. Diet Subgroups: HP-NB vs. HC-CB
There was no significant difference at baseline between the HP-NB and HC-CB diet groups for any parameters other than diastolic blood pressure (DBP), LDL-C and MRI-assessed pancreas fat % (all, p < 0.05), which were higher in the HP-NB group by chance. Importantly, age, body weight, and BMI, DXA body composition parameters, and MRI-VAT:SAT ratio and MRS-liver fat% were not significantly different between diet groups. There was also no significant difference in mean FFQ self-reported energy intake (HP-NB: 9.4 ± 0.7 MJ/day; HC-CB: 9.3 ± 0.5 MJ/day) at baseline. Throughout the 12-week intervention, in accordance with the recommendation that product bars be consumed as an energy substitution rather than addition, there was no significant increase in body weight, BMI, waist or hip circumference in either group (time, p > 0.05, Table 4), nor was there a difference between the two diet groups (diet*time, p > 0.05). FFQ self-reported daily energy intake was also not significantly different between the HP-NB and HC-CB groups (p > 0.05). Contrary to our hypothesis, however, there was also no significant difference in change in primary endpoint FPG between HP-NB and HC-CB over 12 weeks (diet*time, p = 0.991, see Table 4). Sensitivity analyses comparing imputed and observed ‘raw’ data confirmed no difference in outcomes. There were also no significant diet group differences in change over 12 weeks in fasting insulin, HOMA-IR, HbA1c and lipids, nor any measured inflammatory markers (diet*time, all p > 0.05). Unexpectedly, HbA1c increased in both diet groups by ~10% over 12 weeks (time, p = 0.016). Conversely, hsCRP decreased in both groups (time, p = 0.014). Assessed through OGTT, there was also no significant difference in change over 12 weeks between HP-NB and HC-CB for glucose and insulin ∆Cmax, iAUCglucose 0–120min or iAUCinsulin 0–120min response (diet*time, all p > 0.05).
Table 4.
Anthropometry and clinical markers at baseline and 12 weeks.
3.4. Glycaemia Subgroups: Normal vs. Impaired Fasting Glucose
The mean (SD) FPG at CID1 was 5.5 (0.6) mmol/L; hence, a sub-analysis was conducted to determine responses to the dietary intervention between normo- and impaired fasting glucose subgroups. At baseline, there was no significant difference between the two subgroups in age, body weight or BMI (see Table 2, all, p > 0.05). Waist circumference and the majority of metabolic endpoints were significantly higher in the group with prediabetes, including FPG, insulin, HbA1c, HOMA-IR, total and LDL-C, and TG (all, p < 0.01). Also significantly higher at baseline in the pre-diabetic group were the MRI-VAT:SAT ratio (p = 0.002) and MRI-pancreas fat % (p < 0.05). MRS-liver fat % was numerically higher (+2%) but due to high variance did not reach statistical significance between glycaemic subgroups (p = 0.089; see Table 2). Over the 12-week intervention, baseline differences between glycaemic subgroups were maintained for multiple endpoints, including many anthropometric, fasting and OGTT glycaemic parameters, lipids and inflammatory markers (all p < 0.001). Conversely and notably, however, there was no significant difference in trajectory between diet groups for change in primary variable FPG over 12 weeks when glycaemic status was included in the model (glycaemia*diet*time, p > 0.05).
3.5. Ectopic Fat Subgroups: Normal vs. High Pancreas and/or Liver Fat
A secondary sub-analysis was also conducted to determine whether there was a differential response to the intervention between the NEF and HEF subgroups. At baseline, HEF participants were of similar age but with significantly higher body weight, BMI, waist and hip circumference (all, p < 0.05, see Table 2). There was no difference at baseline in primary endpoint FPG (p = 0.206), whilst fasting insulin and HOMA-IR were both significantly higher in the HEF subgroup (p < 0.05). DXA-assessed body composition showed significantly higher total FM, FFM and AbFM% (all, p < 0.05) in the HEF subgroup, in addition to significantly higher MRI-VAT:SAT ratio, pancreas and liver fat % (all, p < 0.001). Over the 12-week intervention, baseline differences between subgroups were maintained for multiple endpoints, including many anthropometric, fasting and OGTT glycaemic parameters (all p < 0.001). Conversely and notably, however, there was no significant difference between diet groups for change in primary variable FPG over 12 weeks when ectopic fat status was included in the analysis (ectopic fat*diet*time, p > 0.05), or for other anthropometric, fasting and OGTT glycaemic parameters, fasting lipids and inflammatory markers (ectopic fat*diet*time, all p > 0.05).
4. Discussion
Our current study found that daily consumption of HP-NB, containing ~28 g of mixed almonds and peanuts, over 12 weeks did not alter markers of glycaemia or insulin resistance relative to an isoenergetic higher-CHO cereal-based bar. There was no evidence that FPG, OGTT 2 h glycaemic response or other T2D-associated blood markers including insulin response improved in this cohort of Chinese adults with overweight. Nor was there an improvement in lipids or inflammatory markers. Based on prior observational studies [27,28] and RCTs [24,52,53,54], we hypothesized that daily consumption of the lower-GI nut-rich HP-NB, when replacing a light meal or snack, would improve some markers of diabetes risk. Previous evidence from our laboratory of glycaemia-related improvements in an acute postprandial setting by the HP-NB intervention [30] was therefore not replicated in our current, longer-term, investigation of fasting and OGTT biomarkers.
Tree nuts and peanuts have been proposed as an attractive snack food for individuals with dysglycaemia, owing to their pleasant taste and multiple ways of being included in the daily diet. They provide a good source of dietary fibre (~3–13 g per serving), plant-based unsaturated fatty acids (~44–76 en%, mostly MUFA and PUFA), plant-based protein, micronutrients (e.g., vitamins, calcium, magnesium, potassium, etc.) and polyphenols (e.g., α-Tocopherol) [55] while being low in saturated fatty acids (~4–16 en%) and available CHO (~12–30 en%), making them a potential candidate for attenuating the GI response to a meal, and potentially improving longer-term glycaemic control [21,56]. A systematic review and meta-analysis of five prospective cohort studies reported that weekly consumption of four servings of ~28 g of tree nuts, peanuts and legumes reduced the relative risk of T2D by 13% [27]. A later systematic review and meta-analysis of four prospective studies reported a 39% reduction in mortality from T2D per 28 g of nuts and peanuts consumed/day [28]. In addition, a meta-analysis of 39 RCTs by Tindall and colleagues showed significant improvements in fasting insulin and HOMA-IR in nut supplementation trials of median duration of 12 weeks. Perhaps surprisingly, however, there was no effect of supplementation with nuts on FPG compared to the low-nut control diet [24]. Subgroup analyses of baseline glycaemic status (normoglycaemia, prediabetes and T2D), body weight status (normal weight, overweight and obesity) or quantity of nuts consumed/day did not alter the main results [24]. The subgroup analyses conducted in our current study also failed to detect any differences between glycaemic (normoglycaemia–prediabetes) and ectopic fat (normal–high) subgroups within the main cohort. Individuals with prediabetes, and hence with higher baseline FPG and potential for abnormal pancreatic β-cell function, compared with those with normoglycaemia may be expected to be better responders to our current dietary intervention. This is similar for the high ectopic fat subgroup, where adverse effects of fat infiltration into the pancreas may be hypothesised to counteract any protective effects of the nut intervention on glycaemic endpoints. In our prior MRI-MRS study of pancreas and liver fat in individuals with overweight, we showed that the suppression of postprandial blood glucose achieved by the HP-NB product was countered in individuals with high organ fat content [30], confirming the role of ectopic fat deposition in moderating postprandial nutrient response.
Other key endpoints in our current intervention were fasting insulin and HOMA-IR, both previously reported to be altered by RCTs incorporating nuts into the diet [24]. However, there was no significant improvement in either fasting insulin concentration or the concurrent OGTT-induced insulin peak. The substitution of SFA and available CHO by unsaturated MUFA and PUFA may potentially contribute to an improvement of insulin sensitivity (i.e., HOMA-IR) and fasting insulin, although notably neither of these parameters were altered in our current trial. Perhaps the most likely explanation for the lack of protective effect of the nut product in our intervention compared with the previous literature is a dose–response effect. The median dose of nuts and peanuts in the Tindall meta-analysis was a high 52 g/day, with a range of 20–113 g/day, almost twice that of our HP-NB test product [24]. An intake of 28 g/day of mixed almonds and peanuts may have been insufficient to show an impact within 12 weeks. Unexpectedly, we observed an increase in HbA1c in both diet groups during the intervention, for which there is also no clear explanation. Neither dietary product led to an adverse change in body weight or adiposity, nor was there significant worsening over time in any associated blood parameters in both diet groups.
One concern for our current dietary intervention was the possibility that the nut bar would be included in the diet as an additional energy source, rather than as a substitution. Almonds and peanuts are high in energy, with the potential to increase body weight, and in turn worsen glycaemia. However, there was no evidence of significant changes in body weight or composition from either the ~1 MJ HP-NB or isoenergetic HC-CB groups, suggesting that participants adhered to the advice to substitute the intervention products for a meal or snack. Previous RCTs [12,19,53] which have substituted a nut-free diet with an isoenergetic almond- and pistachio-containing diet have reported similar positive findings. Similar outcomes were observed in an RCT investigating longer-term effects of the inclusion of walnuts in the diet [57]. A recent meta-analysis of RCTs also reported no significant effects of nut interventions on body weight, BMI, waist circumference or percentage body fat in T2D patients [58], supporting the inclusion of these products in the diet of individuals with overweight and dysglycaemia despite their high total fat content.
Since edible nuts are present in diets in a great number of forms with variable compositions, the type of nut consumed is likely to be an important factor to consider. The 2019 meta-analysis by Tindall and colleagues [24] showed no significant effect of almonds [12,59,60,61,62,63,64], peanuts [65,66,67], cashew nuts [61,68] or walnuts [59,69,70] on FPG or HbA1c, but positive effects on HOMA-IR and fasting insulin. Only pistachio nuts, a tree nut of the cashew family, significantly decreased FPG [24] in addition to the markers of insulin sensitivity. However, perhaps unexpectedly, a recent 12-week RCT of pistachio nuts (57 g/day) consumed as a night-time snack in individuals with prediabetes [71] failed to show improvements in FPG, HbA1c, HOMA-IR or fasting insulin when compared with a positive control of ‘usual care’. We need to consider whether the lack of efficacy in our current study may have been due to the type of nut, almonds and peanuts, or the weight/dose of the nuts incorporated into the HP-NB diet. Insufficient intervention duration may be a further possible explanation. A prior meta-analysis reported greatest effects on glycaemia between nut-supplemented and control diets in studies of 12 week to 24 month durations [54]. However, conversely, the more recent Tindall meta-analysis failed to observe this effect in the sub-groups of long-term studies with duration > 12 weeks [24]. Tindall et al. also reported that no association was observed between the mean difference in FPG or other glycaemia-related outcomes and dose of nuts consumed.
There are some limitations to our study. Firstly, the Tū Ora RCT aimed to improve fasting glycaemia in participants with prediabetes at high risk of developing T2D. However, a cohort of individuals had reverted from dysglycaemia to normoglycaemia by the start of the study at CID1. This was unexpected and may have been due in part to a delay in the start of the intervention due to slower-than-predicted recruitment rates, or possibly changes in diet and lifestyle by participants after diagnosis of prediabetes at screening. Another possible explanation is the assessment of FPG at different laboratories at screening and CID1 timepoints. At both sites, blood samples collected at the screening visit were analysed daily in real time, from either whole blood (AKL) or plasma (WLG), whilst at CID1/baseline, FPG was batch analysed for both sites from frozen plasma samples. Both were validated analytical methods, and regularly calibrated within-site during the study. Finally, as glucose is a continuous biological variable, small natural variability within individuals may have moved them across the arbitrary threshold for the definition of prediabetes.
5. Conclusions
Our current intervention showed that an intake of ~28 g of nuts/day, consumed as a 1 MJ almond and peanut bar as a replacement for a meal or snack, over 12 weeks did not result in adverse weight gain or change in body composition in a cohort of Chinese adults with overweight. There was no suppression of FPG or related glycaemic endpoints, including fasting insulin and HOMA-IR. In subgroup analyses, there was no evidence that the presence of risk factors that promote susceptibility to T2D, including dysglycaemia and fat infiltration into the pancreas and liver, altered responses to the nut intervention, despite reporting these in our previous postprandial study [30]. A higher dose, longer intervention duration, and addition of other nut types, such as pistachio, may promote better responses to this nut intervention.
Author Contributions
Conceptualization, S.D.P., M.P.S. and L.W.L.; methodology, S.D.P., M.P.S., L.W.L., I.R.S.-B., L.D.P., N.M., A.A.-F., A.P.-S., K.G.H. and A.T.; formal analysis, S.D.P., L.W.L. and I.R.S.-B.; writing—original draft preparation, S.D.P., I.R.S.-B. and L.W.L.; writing—review and editing, M.P.S., L.D.P., K.G.H., A.T., J.L.M.-C., J.D.K. and M.F.; supervision, S.D.P., M.F. and J.D.K.; project administration, M.F.; funding acquisition, S.D.P. and J.L.M.-C. All authors have read and agreed to the published version of the manuscript.
Funding
This study was funded through the New Zealand National Science Challenge High-Value-Nutrition (HVN) program, via the Ministry for Business, Innovation and Employment (MBIE, Grant No. 3710040). I.R.S.-B. and L.W.L. held postdoctoral fellowships funded by the HVN program. M.F. received funding to support product development and S.D.P., I.R.S.-B., L.W.L., M.P.S., M.F., N.M. and A.A.-F. received in kind support from the food and beverage cluster NUKU ki te PukuTM Ltd. (Wellington, New Zealand) and to conduct this study.
Institutional Review Board Statement
The study was conducted according to the guidelines of Good Clinical Practice, and approved by the New Zealand Northern B Health and Disability Ethics Committee (HDEC) on 13 March 2018 (ref: 18/NTB/1).
Informed Consent Statement
Informed consent was obtained from all participants involved in the study.
Data Availability Statement
De-identified data may be shared and made available upon reasonable request to the corresponding author and subject to an approved proposal and data access agreement due to ethical reasons.
Acknowledgments
Mohammed Rizwan and Alisa Boucsein from University of Otago contributed to analysis of plasma inflammatory markers. Janiene Gilliland from the Massey FoodPILOT, Palmerston North, New Zealand, contributed to product development and also manufactured test and comparator formulations. Griffins Food Co. and Tasman Bay Foods also provided input into bar development. We also thank all study participants.
Conflicts of Interest
M.F. was employed by the company Edible Research Ltd. The remaining authors declare no conflicts of interest. The funders had no role in the design of the study; in the collection, analyses, or interpretation of data; in the writing of the manuscript; or in the decision to publish the results.
References
- International Diabetes Federation. IDF Diabetes Atlas, 10th ed.; International Diabetes Federation: Brussels, Belgium, 2021. [Google Scholar]
- Moreira, N.C.D.V.; Ceriello, A.; Basit, A.; Balde, N.; Mohan, V.; Gupta, R.; Misra, A.; Bhowmik, B.; Lee, M.K.; Zuo, H.; et al. Race/ethnicity and challenges for optimal insulin therapy. Diabetes Res. Clin. Pr. 2021, 175, 108823. [Google Scholar] [CrossRef] [PubMed]
- Rattarasarn, C. Dysregulated lipid storage and its relationship with insulin resistance and cardiovascular risk factors in non-obese Asian patients with type 2 diabetes. Adipocyte 2018, 7, 71–80. [Google Scholar] [CrossRef] [PubMed]
- Sattar, N.; Gill, J.M. Type 2 diabetes as a disease of ectopic fat? BMC Med. 2014, 12, 123. [Google Scholar] [CrossRef] [PubMed]
- Wulan, S.N.; Westerterp, K.R.; Plasqui, G. Ethnic differences in body composition and the associated metabolic profile: A comparative study between Asians and Caucasians. Maturitas 2010, 65, 315–319. [Google Scholar] [CrossRef] [PubMed]
- Liew, C.F.; Seah, E.S.; Yeo, K.P.; Lee, K.O.; Wise, S.D. Lean, nondiabetic Asian Indians have decreased insulin sensitivity and insulin clearance, and raised leptin compared to Caucasians and Chinese subjects. Int. J. Obes. 2003, 27, 784–789. [Google Scholar] [CrossRef] [PubMed]
- Sequeira, I.R.; Yip, W.; Lu, L.; Jiang, Y.; Murphy, R.; Plank, L.; Zhang, S.; Liu, H.; Chuang, C.L.; Vazhoor-Amarsingh, G.; et al. Visceral adiposity and glucoregulatory peptides are associated with susceptibility to Type 2 Diabetes: The TOFI_Asia Study. Obesity 2020, 28, 2368–2378. [Google Scholar] [CrossRef] [PubMed]
- Singh, R.G.; Yoon, H.D.; Poppitt, S.D.; Plank, L.D.; Petrov, M.S. Ectopic fat accumulation in the pancreas and its biomarkers: A systematic review and meta-analysis. Diabetes Metab. Res. Rev. 2017, 33, e2918. [Google Scholar] [CrossRef] [PubMed]
- Brownlee, M. Biochemistry and molecular cell biology of diabetic complications. Nature 2001, 414, 813–820. [Google Scholar] [CrossRef] [PubMed]
- Livesey, G.; Taylor, R.; Livesey, H.; Liu, S. Is there a dose-response relation of dietary glycemic load to risk of type 2 diabetes? Meta-analysis of prospective cohort studies. Am. J. Clin. Nutr. 2013, 97, 584–596. [Google Scholar] [CrossRef]
- Kataoka, M.; Venn, B.J.; Williams, S.M.; Te Morenga, L.A.; Heemels, I.M.; Mann, J.I. Glycaemic responses to glucose and rice in people of Chinese and European ethnicity. Diabet. Med. 2013, 30, e101–e107. [Google Scholar] [CrossRef]
- Tan, V.M.; Lee, Y.S.; Venkataraman, K.; Khoo, E.Y.; Tai, E.S.; Chong, Y.S.; Gluckman, P.; Leow, M.K.; Khoo, C.M. Ethnic differences in insulin sensitivity and beta-cell function among Asian men. Nutr. Diabetes 2015, 5, e173. [Google Scholar] [CrossRef] [PubMed]
- Venn, B.S.; Williams, S.M.; Mann, J.I. Comparison of postprandial glycaemia in Asians and Caucasians. Diabet. Med. 2010, 27, 1205–1208. [Google Scholar] [CrossRef] [PubMed]
- Hernández-Alonso, P.; Camacho-Barcia, L.; Bulló, M.; Salas-Salvadó, J. Nuts and dried fruits: An update of their beneficial effects on Type 2 Diabetes. Nutrients 2017, 9, 673. [Google Scholar] [CrossRef] [PubMed]
- Hou, Y.Y.; Ojo, O.; Wang, L.L.; Wang, Q.; Jiang, Q.; Shao, X.Y.; Wang, X.H. A randomized controlled trial to compare the effect of peanuts and almonds on the cardio-metabolic and inflammatory parameters in patients with Type 2 diabetes mellitus. Nutrients 2018, 10, 1565. [Google Scholar] [CrossRef] [PubMed]
- Luo, C.; Zhang, Y.; Ding, Y.; Shan, Z.; Chen, S.; Yu, M.; Hu, F.B.; Liu, L. Nut consumption and risk of type 2 diabetes, cardiovascular disease, and all-cause mortality: A systematic review and meta-analysis. Am. J. Clin. Nutr. 2014, 100, 256–269. [Google Scholar] [CrossRef] [PubMed]
- Houston, L.; Probst, Y.C.; Singh, M.C.; Neale, E.P. Tree Nut and Peanut Consumption and Risk of Cardiovascular Disease. A Systematic Review and Meta-Analysis of Randomized Controlled Trials. Adv. Nutr. Int. Rev. J. 2023, 14, 1029–1049. [Google Scholar] [CrossRef] [PubMed]
- Tan, S.Y.; Dhillon, J.; Mattes, R.D. A review of the effects of nuts on appetite, food intake, metabolism, and body weight. Am. J. Clin. Nutr. 2014, 100, 412S–422S. [Google Scholar] [CrossRef] [PubMed]
- Hernández-Alonso, P.; Salas-Salvadó, J.; Baldrich-Mora, M.; Juanola-Falgarona, M.; Bulló, M. Beneficial effect of pistachio consumption on glucose metabolism, insulin resistance, inflammation, and related metabolic risk markers: A randomized clinical trial. Diabetes Care 2014, 37, 3098–3105. [Google Scholar] [CrossRef] [PubMed]
- Kim, Y.; Keogh, J.B.; Clifton, P.M. Polyphenols and glycemic control. Nutrients 2016, 8, 17. [Google Scholar] [CrossRef]
- Augustin, L.S.A.; Kendall, C.W.C.; Jenkins, D.J.A.; Willett, W.C.; Astrup, A.; Barclay, A.W.; Björck, I.; Brand-Miller, J.C.; Brighenti, F.; Buyken, A.E.; et al. Glycemic index, glycemic load and glycemic response: An International Scientific Consensus Summit from the In-ternational Carbohydrate Quality Consortium (ICQC). Nutr. Metab. Cardiovasc. Dis. 2015, 25, 795–815. [Google Scholar] [CrossRef]
- Estruch, R.; Ros, E.; Salas-Salvadó, J.; Covas, M.-I.; Corella, D.; Arós, F.; Gómez-Gracia, E.; Ruiz-Gutiérrez, V.; Fiol, M.; Lapetra, J.; et al. Primary Prevention of Cardiovascular Disease with a Mediterranean Diet Supplemented with Extra-Virgin Olive Oil or Nuts. N. Engl. J. Med. 2018, 378, e34. [Google Scholar] [CrossRef] [PubMed]
- Gosal, H.; Kaur, H.; Ngassa, H.C.; A Elmenawi, K.; Anil, V.; Mohammed, L. The Significance of the Mediterranean Diet in the Management of Non-Alcoholic Fatty Liver Disease. A Syst. Review. Cureus 2021, 13, e15618. [Google Scholar] [CrossRef]
- Tindall, A.M.; Johnston, E.A.; Kris-Etherton, P.M.; Petersen, K.S. The effect of nuts on markers of glycemic control: A systematic review and meta-analysis of randomized controlled trials. Am. J. Clin. Nutr. 2019, 109, 297–314. [Google Scholar] [CrossRef] [PubMed]
- Ju, L.H.; Yu, D.M.; Xu, X.L. Status and variation trend of nut intake among Chinese residents, 2010-2012. Chinese J. Publ. Health 2017, 33, 916–918. [Google Scholar]
- Guasch-Ferré, M.; Li, J.; Hu, F.B.; Salas-Salvadó, J.; Tobias, D.K. Effects of walnut consumption on blood lipids and other cardiovascular risk factors: An updated meta-analysis and systematic review of controlled trials. Am. J. Clin. Nutr. 2018, 108, 174–187. [Google Scholar] [CrossRef] [PubMed]
- Afshin, A.; Micha, R.; Khatibzadeh, S.; Mozaffarian, D. Consumption of nuts and legumes and risk of incident ischemic heart disease, stroke, and diabetes: A systematic review and meta-analysis. Am. J. Clin. Nutr. 2014, 100, 278–288. [Google Scholar] [CrossRef] [PubMed]
- Aune, D.; Keum, N.; Giovannucci, E.; Fadnes, L.T.; Boffetta, P.; Greenwood, D.C.; Tonstad, S.; Vatten, L.J.; Riboli, E.; Norat, T. Nut consumption and risk of cardiovascular disease, total cancer, all-cause and cause-specific mortality: A systematic review and dose-response meta-analysis of prospective studies. BMC Med. 2016, 14, 207. [Google Scholar] [CrossRef] [PubMed]
- He, Y.; Li, Y.; Yang, X.; Hemler, E.C.; Fang, Y.; Zhao, L.; Zhang, J.; Yang, Z.; Wang, Z.; He, L.; et al. The dietary transition and its association with cardiometabolic mortality among Chinese adults, 1982–2012: A cross-sectional population-based study. Lancet Diabetes Endocrinol. 2019, 7, 540–548. [Google Scholar] [CrossRef] [PubMed]
- Lu, L.W.; Silvestre, M.P.; Sequeira, I.R.; Plank, L.D.; Foster, M.; Middleditch, N.; Acevedo-Fani, A.; Hollingsworth, K.G.; Poppitt, S.D. A higher-protein nut-based snack product suppresses glycaemia and decreases glycaemic response to co-ingested carbohydrate in an overweight prediabetic Asian Chinese cohort: The Tū Ora postprandial, RCT. J. Nutr. Sci. 2021, 10, e30. [Google Scholar] [CrossRef]
- Brown, R.C.; Ware, L.; Gray, A.R.; Chisholm, A.; Tey, S.L. Snacking on almonds lowers glycaemia and energy intake compared to a popular high-carbohydrate snack food: An acute randomised crossover study. Int. J. Environ. Res. Public. Health 2021, 18, 10989. [Google Scholar] [CrossRef]
- Brown, R.C.; Ware, L.; Gray, A.R.; Tey, S.L.; Chisholm, A. Comparing the effects of consuming almonds or biscuits on body weight in habitual snackers: A 1-year randomized controlled trial. Am. J. Clin. Nutr. 2023, 118, 228–240. [Google Scholar] [CrossRef] [PubMed]
- Lindström, J.; Tuomilehto, J. The diabetes risk score: A practical tool to predict type 2 diabetes risk. Diabetes Care 2003, 26, 725–731. [Google Scholar] [CrossRef] [PubMed]
- American Diabetes Association (ADA). Diagnosis and classification of diabetes mellitus. Diabetes Care 2010, 33, S62–S69. [Google Scholar] [CrossRef] [PubMed]
- Food Standards Australia New Zealand: Short Guide for Industry to the Nutrient Profiling Scoring Criterion. 2016. Available online: https://www.foodstandards.gov.au/business/labelling/Short-guide-for-industry-to-the-NPSC (accessed on 30 April 2024).
- Philipsen, S.C. Validation of a Newly Developed Eating Habits Questionnaire for New Zealand Women. Master’s Thesis, Massey University, Auckland, New Zealand, 2015. Available online: https://mro.massey.ac.nz/server/api/core/bitstreams/c7b13842-457d-4de4-92e4-a8d1e794ac71/content (accessed on 2 April 2024).
- Ministry of Health. Eating and Activity Guidelines for New Zealand Adults; Ministry of Health: Wellington, New Zealand, 2015.
- Chinese Diabetes Society. China medical nutrition therapy guideline for diabetes. Chin. J. Diabetes Mellit. 2015, 7, 73–78. [Google Scholar]
- Park, S.S.; Lim, S.; Kim, H.; Kim, K.M. Comparison of Two DXA Systems, Hologic Horizon W and GE Lunar Prodigy, for Assessing Body Composition in Healthy Korean Adults. Endocrinol. Metab. 2021, 36, 1219–1231. [Google Scholar] [CrossRef] [PubMed]
- Berglund, J.; Ahlström, H.; Johansson, L.; Kullberg, J. Two-point Dixon method with flexible ECHO times. Magn. Reson. Med. 2011, 65, 994–1004. [Google Scholar] [CrossRef] [PubMed]
- Schweitzer, L.; Geisler, C.; Pourhassan, M.; Braun, W.; Glüer, C.C.; Bosy-Westphal, A.; Müller, M.J. What is the best reference site for a single MRI slice to assess whole-body skeletal muscle and adipose tissue volumes in healthy adults? Am. J. Clin. Nutr. 2015, 102, 58–65. [Google Scholar] [CrossRef] [PubMed]
- Schneider, C.A.; Rasband, W.S.; Eliceiri, K.W. NIH Image to ImageJ: 25 years of image analysis. Nat. Methods 2012, 9, 671–675. [Google Scholar] [CrossRef] [PubMed]
- Al-Mrabeh, A.; Hollingsworth, K.G.; Steven, S.; Tiniakos, D.; Taylor, R. Quantification of intrapancreatic fat in type 2 diabetes by MRI. PLoS ONE 2017, 12, e0174660. [Google Scholar] [CrossRef]
- Bredella, M.A.; Ghomi, R.H.; Thomas, B.J.; Ouellette, H.A.; Sahani, D.V.; Miller, K.K.; Torriani, M. Breath-hold 1H-magnetic resonance spectroscopy for intrahepatic lipid quantification at 3 Tesla. J. Comput. Assist. Tomogr. 2010, 34, 372–376. [Google Scholar] [CrossRef]
- Crane, J.C.; Olson, M.P.; Nelson, S.J. SIVIC: Open-Source, Standards-Based Software for DICOM MR Spectroscopy Workflows. Int. J. Biomed. Imaging 2013, 2013, 169526. [Google Scholar] [CrossRef] [PubMed]
- Joblin-Mills, A.; Wu, Z.E.; Fraser, K.; Jones, B.; Yip, W.; Lim, J.J.; Lu, L.W.; Sequeira, I.R.; Poppitt, S.D. The impact of ethnicity and in-tra-pancreatic fat on the postprandial metabolome response to whey protein in overweight Asian Chinese and European Caucasian women with prediabetes. Front. Clin. Diab Healthc. 2022, 3, 980856. [Google Scholar] [CrossRef] [PubMed]
- Martin-Rodriguez, J.L.; Gonzalez-Cantero, J.; Gonzalez-Cantero, A.; Arrebola, J.P.; Gonzalez-Calvin, J.L. Diagnostic accuracy of serum alanine aminotransferase as biomarker for nonalcoholic fatty liver disease and insulin resistance in healthy subjects, using 3T MR spectroscopy. Medicine 2017, 96, e6770. [Google Scholar] [CrossRef] [PubMed]
- Matthews, D.R.; Hosker, J.P.; Rudenski, A.S.; Naylor, B.A.; Treacher, D.F.; Turner, R.C. Homeostasis model assessment: Insulin resistance and beta-cell function from fasting plasma glucose and insulin concentrations in man. Diabetologia 1985, 28, 412–419. [Google Scholar] [CrossRef] [PubMed]
- Friedewald, W.T.; Levy, R.I.; Fredrickson, D.S. Estimation of the concentration of low-density lipoprotein cholesterol in plasma, without use of the preparative ultracentrifuge. Clin. Chem. 1972, 18, 499–502. [Google Scholar] [CrossRef] [PubMed]
- Parnell, W.; Heath, A.-L.; Brown, R.; Walker, H.; Gray, A.; Blakey, C.; Fleming, L.; Turley, M.; Mackay, S.; Weerasekera, D. Methodology Report for the 2008/09 NZ Adult Nutrition Survey. Ministry of Health: Wellington, New Zealand. Available online: https://www.health.govt.nz/system/files/documents/publications/methodology-report.pdf (accessed on 1 December 2017).
- Fogh-Andersen, N.; Wimberley, P.D.; Thode, J.; Siggaard-Andersen, O. Direct reading glucose electrodes detect the molality of glucose in plasma and whole blood. Clin. Chim. Acta 1990, 189, 33–38. [Google Scholar] [CrossRef] [PubMed]
- Mohammadifard, N.; Salehi-Abargouei, A.; Salas-Salvadó, J.; Guasch-Ferré, M.; Humphries, K.; Sarrafzadegan, N. The effect of tree nut, peanut, and soy nut consumption on blood pressure: A systematic review and meta-analysis of randomized controlled clinical trials. Am. J. Clin. Nutr. 2015, 101, 966–982. [Google Scholar] [CrossRef]
- Ntzouvani, A.; Antonopoulou, S.; Nomikos, T. Effects of nut and seed consumption on markers of glucose metabolism in adults with prediabetes: A systematic review of randomised controlled trials. Br. J. Nutr. 2019, 122, 361–375. [Google Scholar] [CrossRef]
- Viguiliouk, E.; Kendall, C.W.; Blanco Mejia, S.; Cozma, A.I.; Ha, V.; Mirrahimi, A.; Jayalath, V.H.; Augustin, L.S.; Chiavaroli, L.; Leiter, L.A.; et al. Effect of tree nuts on glycemic control in diabetes: A systematic review and meta-analysis of randomized controlled dietary trials. PLoS ONE 2014, 9, e103376. [Google Scholar] [CrossRef]
- US Department of Agriculture (USDA). Composition of Foods Raw, Processed, Prepared USDA National Nutrient Database for Standard Reference, Release 23. Available online: https://www.ars.usda.gov/arsuserfiles/80400525/data/sr23/sr23_doc.pdf (accessed on 13 March 2022).
- Imamura, F.; Micha, R.; Wu, J.H.; de Oliveira Otto, M.C.; Otite, F.O.; Abioye, A.I.; Mozaffarian, D. Effects of saturated fat, polyunsaturated fat, monounsaturated fat, and carbohydrate on glucose-insulin homeostasis: A systematic review and meta-analysis of ran-domised controlled feeding trials. PLoS Med. 2016, 13, e1002087. [Google Scholar] [CrossRef]
- Njike, V.Y.; Ayettey, R.; Petraro, P.; Treu, J.A.; Katz, D.L. Walnut ingestion in adults at risk for diabetes: Effects on body composition, diet quality, and cardiac risk measures. BMJ Open Diabetes Res. Care 2015, 3, e000115. [Google Scholar] [CrossRef] [PubMed]
- Fernández-Rodríguez, R.; Martínez-Vizcaíno, V.; Garrido-Miguel, M.; A Martínez-Ortega, I.; Álvarez-Bueno, C.; Mesas, A.E. Nut consumption, body weight, and adiposity in patients with type 2 diabetes: A systematic review and meta-analysis of randomized controlled trials. Nutr. Rev. 2021, 80, 645–655. [Google Scholar] [CrossRef] [PubMed]
- Damasceno, N.R.; Pérez-Heras, A.; Serra, M.; Cofán, M.; Sala-Vila, A.; Salas-Salvadó, J.; Ros, E. Crossover study of diets enriched with virgin olive oil, walnuts or almonds. Effects on lipids and other cardiovascular risk markers. Nutr. Metab. Cardiovasc. Dis. 2011, 21, S14–S20. [Google Scholar] [CrossRef] [PubMed]
- Jenkins, D.J.; Kendall, C.W.; Marchie, A.; Josse, A.R.; Nguyen, T.H.; Faulkner, D.A.; Lapsley, K.G.; Singer, W. Effect of almonds on insulin secretion and insulin resistance in nondiabetic hyperlipidemic subjects: A randomized controlled crossover trial. Metabolism 2008, 57, 882–887. [Google Scholar] [CrossRef] [PubMed]
- Mukuddem-Petersen, J.; Stonehouse Oosthuizen, W.; Jerling, J.C.; Hanekom, S.M.; White, Z. Effects of a high walnut and high cashew nut diet on selected markers of the metabolic syndrome: A controlled feeding trial. Br. J. Nutr. 2007, 97, 1144–1153. [Google Scholar] [CrossRef] [PubMed]
- Wien, M.; Bleich, D.; Raghuwanshi, M.; Gould-Forgerite, S.; Gomes, J.; Monahan-Couch, L.; Oda, K. Almond consumption and car-diovascular risk factors in adults with prediabetes. J. Am. Coll. Nutr. 2010, 29, 189–197. [Google Scholar] [CrossRef] [PubMed]
- Wien, M.A.; Sabaté, J.M.; Iklé, D.N.; Cole, S.E.; Kandeel, F.R. Almonds vs complex carbohydrates in a weight reduction program. Int. J. Obes. Relat. Metab. Disord. 2003, 27, 1365–1372. [Google Scholar] [CrossRef] [PubMed]
- Abazarfard, Z.; Salehi, M.; Keshavarzi, S. The effect of almonds on anthropometric measurements and lipid profile in overweight and obese females in a weight reduction program: A randomized controlled clinical trial. J. Res. Med. Sci. 2014, 19, 457–464. [Google Scholar] [PubMed]
- Johnston, C.S.; Trier, C.M.; Fleming, K.R. The effect of peanut and grain bar preloads on postmeal satiety, glycemia, and weight loss in healthy individuals: An acute and a chronic randomized intervention trial. Nutr. J. 2013, 12, 35. [Google Scholar] [CrossRef]
- Moreira Alves, R.D.; Boroni Moreira, A.P.; Macedo, V.S.; Bressan, J.; de Cássia Gonçalves Alfenas, R.; Mattes, R.; Brunoro Costa, N.M. High-oleic peanuts: New perspective to attenuate glucose homeostasis disruption and inflammation related obesity. Obesity 2014, 22, 1981–1988. [Google Scholar] [CrossRef]
- Wien, M.; Oda, K.; Sabaté, J. A randomized controlled trial to evaluate the effect of incorporating peanuts into an American Diabetes Association meal plan on the nutrient profile of the total diet and cardiometabolic parameters of adults with type 2 diabetes. Nutr. J. 2014, 13, 10. [Google Scholar] [CrossRef] [PubMed]
- Mohan, V.; Gayathri, R.; Jaacks, L.M.; Lakshmipriya, N.; Anjana, R.M.; Spiegelman, D.; Jeevan, R.G.; Balasubramaniam, K.K.; Shobana, S.; Jayanthan, M.; et al. Cashew nut consumption increases HDL-cholesterol and reduces systolic blood pressure in Asian Indi-ans with Type 2 Diabetes: A 12-week randomized controlled trial. J. Nutr. 2018, 148, 63–69. [Google Scholar] [CrossRef] [PubMed]
- Bamberger, C.; Rossmeier, A.; Lechner, K.; Wu, L.; Waldmann, E.; Stark, R.G.; Altenhofer, J.; Henze, K.; Parhofer, K.G. A Walnut-Enriched Diet Reduces Lipids in Healthy Caucasian Subjects, Independent of Recommended Macronutrient Replacement and Time Point of Consumption: A Prospective, Randomized, Controlled Trial. Nutrients 2017, 9, 1097. [Google Scholar] [CrossRef] [PubMed]
- Katz, D.L.; Davidhi, A.; Ma, Y.; Kavak, Y.; Bifulco, L.; Njike, V.Y. Effects of walnuts on endothelial function in overweight adults with visceral obesity: A randomized, controlled, crossover trial. J. Am. Coll. Nutr. 2012, 31, 415–423. [Google Scholar] [CrossRef]
- Riley, T.M.; Kris-Etherton, P.M.; Hart, T.L.; Petersen, K.S. Intake of pistachios as a nighttime snack has similar effects on short- and longer-term glycemic control compared with education to consume 1-2 carbohydrate exchanges in adults with prediabetes: A 12-wk randomized crossover trial. J. Nutr. 2024, 154, 1219–1231. [Google Scholar] [CrossRef]

Disclaimer/Publisher’s Note: The statements, opinions and data contained in all publications are solely those of the individual author(s) and contributor(s) and not of MDPI and/or the editor(s). MDPI and/or the editor(s) disclaim responsibility for any injury to people or property resulting from any ideas, methods, instructions or products referred to in the content. |
© 2024 by the authors. Licensee MDPI, Basel, Switzerland. This article is an open access article distributed under the terms and conditions of the Creative Commons Attribution (CC BY) license (https://creativecommons.org/licenses/by/4.0/).