
Quality and Quantity of School Lunch in Nanjing: Based on Data from the Sunshine Restaurant Supervision Platform

Abstract
:1. Introduction
2. Materials and Methods
2.1. Sample Collection
2.2. Data Collection and Evaluation Methods
2.3. Statistical Analysis
3. Results
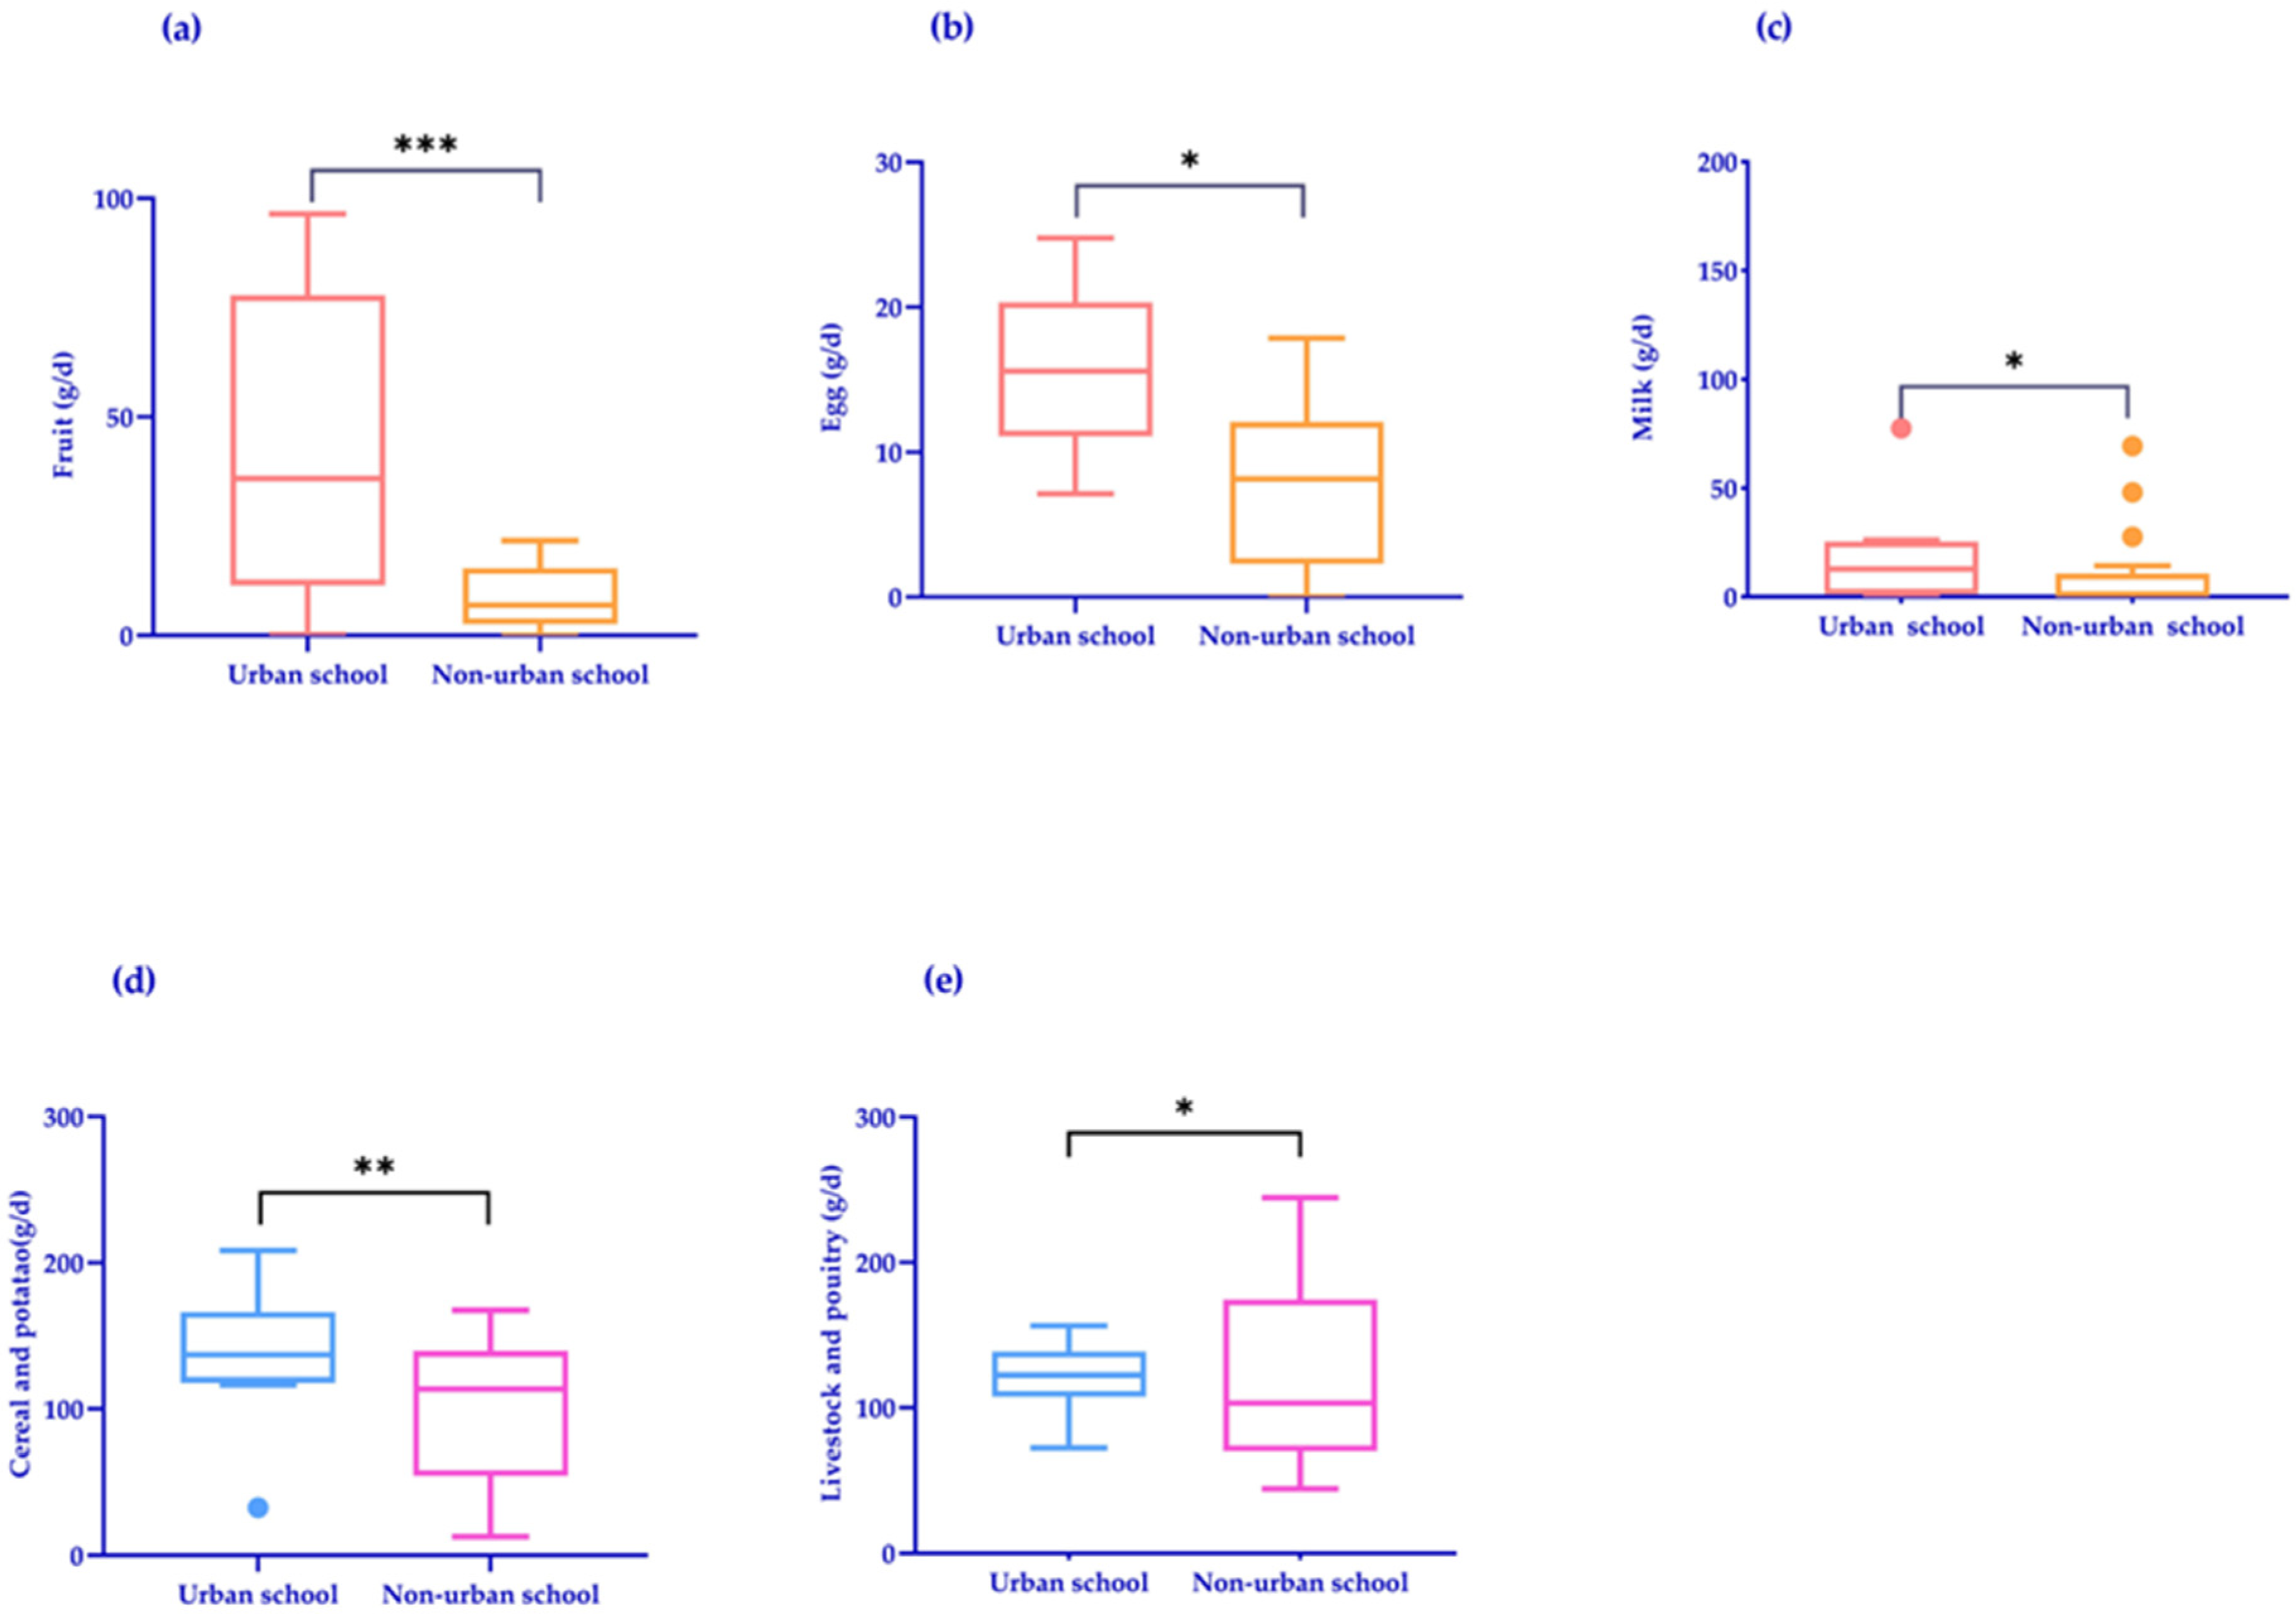
3.1. Food Supply
3.2. Compliance Rate of Food Supply
3.3. Energy and Nutrient Availability
3.4. Energy and Nutrients Supply and Account for Recommended Standards
4. Discussion
4.1. Serious Insufficient Supply of Milk and Fruits
4.2. Imbalance in Supply of Livestock and Poultry, and Fish, Shrimps, and Shellfish
4.3. Insufficient Supply of Cereals and Potatoes
4.4. Inadequate Supply of Calcium and Vitamin A
4.5. Strengths and Limitations
5. Conclusions
Supplementary Materials
Author Contributions
Funding
Institutional Review Board Statement
Informed Consent Statement
Data Availability Statement
Acknowledgments
Conflicts of Interest
References
- Wu, X.; Huang, W.; Shao, Y.; Li, H.; Yang, J.; Guo, D.; Ma, R.; Yue, J. Nutritional of assessment school lunches for primary and secondary school students in the Pearl River Delta. Chin. J. Sch. Health 2021, 42, 207–210+214. [Google Scholar]
- Jacob, J.A.; Nair, M.K. Protein and micronutrient supplementation in complementing pubertal growth. Indian J. Pediatr. 2012, 79 (Suppl. 1), S84–S91. [Google Scholar] [CrossRef] [PubMed]
- Liang, Y.; Hou, D.; Zhao, X.; Wang, L.; Hu, Y.; Liu, J.; Cheng, H.; Yang, P.; Shan, X.; Yan, Y.; et al. Childhood obesity affects adult metabolic syndrome and diabetes. Endocrine 2015, 50, 87–92. [Google Scholar] [CrossRef] [PubMed]
- Papandreou, D.; Makedou, K.; Zormpa, A.; Karampola, M.; Ioannou, A.; Hitoglou-Makedou, A. Are Dietary Intakes Related to Obesity in Children? Open Access Maced. J. Med. Sci. 2016, 4, 194–199. [Google Scholar] [CrossRef] [PubMed]
- Petkeviciene, J.; Klumbiene, J.; Kriaucioniene, V.; Raskiliene, A.; Sakyte, E.; Ceponiene, I. Anthropometric measurements in childhood and prediction of cardiovascular risk factors in adulthood: Kaunas cardiovascular risk cohort study. BMC Public Health 2015, 15, 218. [Google Scholar] [CrossRef] [PubMed]
- Wiseman, M. The second World Cancer Research Fund/American Institute for Cancer Research expert report. Food, nutrition, physical activity, and the prevention of cancer: A global perspective. Proc. Nutr. Soc. 2008, 67, 253–256. [Google Scholar] [CrossRef] [PubMed]
- Zhou, S.; Ye, B.; Fu, P.; Li, S.; Yuan, P.; Yang, L.; Zhan, X.; Chao, F.; Zhang, S.; Wang, M.Q.; et al. Double Burden of Malnutrition: Examining the Growth Profile and Coexistence of Undernutrition, Overweight, and Obesity among School-Aged Children and Adolescents in Urban and Rural Counties in Henan Province, China. J. Obes. 2020, 2020, 2962138. [Google Scholar] [CrossRef] [PubMed]
- Pan, X.F.; Wang, L.; Pan, A. Epidemiology and determinants of obesity in China. Lancet Diabetes Endocrinol. 2021, 9, 373–392. [Google Scholar] [CrossRef] [PubMed]
- Wu, J.; Wang, H.J.; Zhang, X.; Chen, L.; Sha, Y.Y.; Tian, M.D. Vitamin A status and its hematological correlates among preschool children in Beijing, China. Asia Pac. J. Clin. Nutr. 2022, 31, 748–752. [Google Scholar]
- Ayling, K.; Li, R.; Muhardi, L.; Melse-Boonstra, A.; Sun, Y.; Chen, W.; Kudla, U. Systematic Literature Review of the Nutrient Status, Intake, and Diet Quality of Chinese Children across Different Age Groups. Nutrients 2023, 15, 1536. [Google Scholar] [CrossRef]
- Woodside, J.V.; Adamson, A.; Spence, S.; Baker, T.; McKinley, M.C. Opportunities for intervention and innovation in school food within UK schools. Public Health Nutr. 2021, 24, 2313–2317. [Google Scholar] [CrossRef] [PubMed]
- McIntyre, R.L.; Adamson, A.J.; Nelson, M.; Woodside, J.; Beattie, S.; Spence, S. Changes and differences in school food standards (2010–2021) and free school meal provision during COVID-19 across the UK: Potential implications for children’s diets. Nutr. Bull. 2022, 47, 230–245. [Google Scholar] [CrossRef] [PubMed]
- McKelvie-Sebileau, P.; Swinburn, B.; Glassey, R.; Tipene-Leach, D.; Gerritsen, S. Health, wellbeing and nutritional impacts after 2 years of free school meals in New Zealand. Health Promot. Int. 2023, 38, daad093. [Google Scholar] [CrossRef] [PubMed]
- Petchoo, J.; Kaewchutima, N.; Tangsuphoom, N. Nutritional quality of lunch meals and plate waste in school lunch programme in Southern Thailand. J. Nutr. Sci. 2022, 11, e35. [Google Scholar] [CrossRef] [PubMed]
- Duan, X.; Liang, Y.; Peng, X. Free school meals and cognitive ability: Evidence from China’s student nutrition improvement plan. Health Econ. 2024, 33, 1480–1502. [Google Scholar] [CrossRef] [PubMed]
- Gao, H.; Zhang, Y.; Hong, J.; Wang, J.; Jiang, D. Investigation of lunch supply in primary and middle school dining roomsin Ningbo City. China Prev. Med. J. 2022, 34, 1212–1217. [Google Scholar]
- Huang, Z.-R.; Gao, R.-Y.; Zhang, Y.-L.; Bawuerjiang, N.; Cai, M.-Q. Investigation on school lunch and nutritional status in primary schools and middle schools of Shanghai. J. Shanghai Jiaotong Univ. Med. Sci. 2017, 37, 106–108+117. [Google Scholar]
- Wang, Z.; Song, J.; Gao, H.; Zheng, J.; Huang, C.; Zang, J.; Zhou, J.; Zou, S. Nutrition status of self-feeding lunch in primary school for children of migrant workers in Shanghai. Chin. J. Sch. Health 2015, 36, 655–657+662. [Google Scholar]
- Zhao, D.; Han, D.; Zhu, D.; Su, D.; Huang, L.; Wang, W.; He, M.; Fang, Y.; Zhang, R. Lunch supply in public primary school canteens in Zhejiang Province. Chin. J. Sch. Health 2021, 42, 1152–1155. [Google Scholar]
- Liu, H.; Cai, L.; Li, Y.; Rong, S.; Li, W.; Zeng, J. [Nutrition quality of school lunch for children aged 9-12 years in Wuhan City and its relationship with physical development]. Wei Sheng Yan Jiu = J. Hyg. Res. 2019, 48, 403–412. [Google Scholar]
- Brennan, S.F.; Lavelle, F.; Moore, S.E.; Dean, M.; McKinley, M.C.; McCole, P.; Hunter, R.F.; Dunne, L.; O’Connell, N.E.; Cardwell, C.R.; et al. Food environment intervention improves food knowledge, wellbeing and dietary habits in primary school children: Project Daire, a randomised-controlled, factorial design cluster trial. Int. J. Behav. Nutr. Phys. Act. 2021, 18, 23. [Google Scholar] [CrossRef] [PubMed]
- Juton, C.; Berruezo, P.; Torres, S.; Castañer, O.; Según, G.; Fitó, M.; Homs, C.; Gómez, S.F.; Schröder, H. Association between Meal Frequency and Weight Status in Spanish Children: A Prospective Cohort Study. Nutrients 2023, 15, 870. [Google Scholar] [CrossRef] [PubMed]
- Manger, M.S.; McKenzie, J.E.; Winichagoon, P.; Gray, A.; Chavasit, V.; Pongcharoen, T.; Gowachirapant, S.; Ryan, B.; Wasantwisut, E.; Gibson, R.S. A micronutrient-fortified seasoning powder reduces morbidity and improves short-term cognitive function, but has no effect on anthropometric measures in primary school children in northeast Thailand: A randomized controlled trial. Am. J. Clin. Nutr. 2008, 87, 1715–1722. [Google Scholar] [CrossRef] [PubMed]
- WS/T 554-2017 2017; Nutrition Guidelines of School Meals. National Health and Family Planning Commission of the People’s Republic of China: Beijing, China, 2017.
- Yang, Y. China Food Composition Tables Standard Edition; Peking University Press: Beijing, China, 2018; Volume 6. [Google Scholar]
- Society, C.N. Chinses Dietary Reference Intakes 2023; People’s Medical Publishing Press: Beijing, China, 2023. [Google Scholar]
- de Lamas, C.; de Castro, M.J.; Gil-Campos, M.; Gil, Á.; Couce, M.L.; Leis, R. Effects of Dairy Product Consumption on Height and Bone Mineral Content in Children: A Systematic Review of Controlled Trials. Adv. Nutr. 2019, 10, S88–S96. [Google Scholar] [CrossRef] [PubMed]
- Rizzoli, R. Dairy products and bone health. Aging Clin. Exp. Res. 2022, 34, 9–24. [Google Scholar] [CrossRef] [PubMed]
- Duan, J.; Pan, Y.; Teng, L.; Zhao, R.; Qin, Y. Nutrition quality of self-feeding lunch in the primary and secondary schools in Beijing. Chin. J. Sch. Health 2012, 33, 651–653. [Google Scholar]
- Darma, A.; Sumitro, K.R.; Jo, J.; Sitorus, N. Lactose Intolerance versus Cow’s Milk Allergy in Infants: A Clinical Dilemma. Nutrients 2024, 16, 414. [Google Scholar] [CrossRef] [PubMed]
- Fabre, A.; Fabre, A.; Bon, C.; Guerry, P.; Segurel, L. Proposed mechanism for the selection of lactase persistence in childhood. BioEssays News Rev. Mol. Cell. Dev. Biol. 2023, 45, e2200243. [Google Scholar] [CrossRef]
- Lomer, M.C.; Parkes, G.C.; Sanderson, J.D. Review article: Lactose intolerance in clinical practice–myths and realities. Aliment. Pharmacol. Ther. 2008, 27, 93–103. [Google Scholar] [CrossRef]
- Lott, T.T.; Wiedmann, M.; Martin, N.H. Shelf-life storage temperature has a considerably larger effect than high-temperature, short-time pasteurization temperature on the growth of spore-forming bacteria in fluid milk. J. Dairy Sci. 2023, 106, 3838–3855. [Google Scholar] [CrossRef]
- Du, X.Q.; Greenfield, H.; Fraser, D.R.; Ge, K.Y.; Liu, Z.H.; He, W. Milk consumption and bone mineral content in Chinese adolescent girls. Bone 2002, 30, 521–528. [Google Scholar] [CrossRef] [PubMed]
- Xu, X.; Cheng, X.; Zhao, L.; Fang, H.; Guo, Q.; Ju, L.; Li, S.; Cai, S.; Piao, W.; Yu, D. Consumption of Milk and Dairy Products Among Junior High and Senior High School Students—China, 2016–2017. China CDC Wkly. 2022, 4, 47–51. [Google Scholar] [PubMed]
- Zhang, M.; Dong, X.; Huang, Z.; Li, X.; Zhao, Y.; Wang, Y.; Zhu, H.; Fang, A.; Giovannucci, E.L. Cheese consumption and multiple health outcomes: An umbrella review and updated meta-analysis of prospective studies. Adv. Nutr. 2023, 14, 1170–1186. [Google Scholar] [CrossRef] [PubMed]
- Wilson-Barnes, S.L.; Lanham-New, S.A.; Lambert, H. Modifiable risk factors for bone health & fragility fractures. Best Pract. Res. Clin. Rheumatol. 2022, 36, 101758. [Google Scholar] [PubMed]
- Huang, L.; Wang, Z.; Wang, H.; Zhao, L.; Jiang, H.; Zhang, B.; Ding, G. Nutrition transition and related health challenges over decades in China. Eur. J. Clin. Nutr. 2021, 75, 247–252. [Google Scholar] [CrossRef] [PubMed]
- Huang, Z.; Gao, R.; Bawuerjiang, N.; Zhang, Y.; Huang, X.; Cai, M. Food and Nutrients Intake in the School Lunch Program among School Children in Shanghai, China. Nutrients 2017, 9, 582. [Google Scholar] [CrossRef] [PubMed]
- Wang, W.; Liu, Y.; Wang, Z. Progress in the legislations regarding school nutrition lunch and nutrition status in China and some other countries. Shanghai J. Prev. Med. 2023, 35, 1130–1135+1152. [Google Scholar]
- Kaur, K.D.; Jha, A.; Sabikhi, L.; Singh, A.K. Significance of coarse cereals in health and nutrition: A review. J. Food Sci. Technol. 2014, 51, 1429–1441. [Google Scholar] [CrossRef] [PubMed]
- Mazhar, M.; Zhu, Y.; Qin, L. The Interplay of Dietary Fibers and Intestinal Microbiota Affects Type 2 Diabetes by Generating Short-Chain Fatty Acids. Foods 2023, 12, 1023. [Google Scholar] [CrossRef]
- Wawrzyniak, N.; Suliburska, J. Nutritional and health factors affecting the bioavailability of calcium: A narrative review. Nutr. Rev. 2021, 79, 1307–1320. [Google Scholar] [CrossRef]
- Miller, G.D.; Jarvis, J.K.; McBean, L.D. The importance of meeting calcium needs with foods. J. Am. Coll. Nutr. 2001, 20, 168s–185s. [Google Scholar] [CrossRef] [PubMed]
- Stevens, S.L. Fat-Soluble Vitamins. Nurs. Clin. N. Am. 2021, 56, 33–45. [Google Scholar] [CrossRef] [PubMed]
- Du, W.; Wang, H.; Wang, Z.; Zhang, J.; Su, C.; Jia, X.; Zhang, J.; Jiang, H.; Huang, F.; Ouyang, Y.; et al. Dietary vitamin a intake among Chinese adults: Findings from CNTCS2015. Nutr. J. 2018, 17, 60. [Google Scholar] [CrossRef] [PubMed]


| Total | Urban | Non-Urban | ||||
|---|---|---|---|---|---|---|
| Number of Schools | Number of Students | Number of Schools | Number of Students | Number of Schools | Number of Students | |
| Primary school | 24 | 37,931 | 8 | 12,765 | 16 | 25,166 |
| Middle school | 20 | 27,002 | 8 | 10,057 | 12 | 16,945 |
| Category | Primary School (n = 24) | Middle School (n = 20) | ||||||||
|---|---|---|---|---|---|---|---|---|---|---|
| Recommended | Urban | Non-Urban | Z | p- Value | Recommended | Urban | Non-Urban | Z | p- Value | |
| Cereal and potato | 120 | 89.9 (74.9) | 73.8 (61.5) | 0.979 | 0.327 | 150 | 138.9 (92.6) | 82.2 (54.8) | 3.138 | 0.002 |
| Vegetable | 140 | 120.8 (86.3) | 115.2 (82.3) | 0.801 | 0.423 | 170 | 173.2 (101.9) | 154.9 (91.1) | 0.314 | 0.753 |
| Fruit | 80 | 35.2 (44.0) | 3.2 (4.0) | 5.055 | <0.001 | 110 | 3.4 (3.1) | 2.5 (2.3) | 0.385 | 0.701 |
| Livestock and poultry | 16 | 77.3 (482.9) | 76.2 (476.3) | 0.451 | 0.652 | 22 | 112.2 (510.0) | 91.5 (451.9) | 2.347 | 0.019 |
| Fish, shrimp, and shellfish | 16 | 6.3 (39.4) | 4.5 (28.1) | 0.846 | 0.398 | 22 | 8.0 (36.4) | 4.0 (18.2) | 1.892 | 0.059 |
| Egg | 20 | 15.3 (76.5) | 6.2 (31.0) | 2.530 | 0.011 | 30 | 13.5 (45.1) | 10.6 (35.3) | 1.212 | 0.226 |
| Soy and nuts | 13 | 7.9 (60.8) | 10.1 (77.7) | 1.438 | 0.150 | 16 | 11.5 (71.9) | 13.2 (82.5) | 0.629 | 0530 |
| Milk | 80 | 0.0 (0.0) | 0.0 (0.0) | 2.235 | 0.025 | 100 | 0.0 (0.0) | 0.0 (0.0) | 1.724 | 0.085 |
| Item | Primary School (n = 24) | Middle School (n = 20) | ||||||||
|---|---|---|---|---|---|---|---|---|---|---|
| DRIs | Urban | Non-Urban | Z | p-Value | DRIs | Urban | Non-Urban | Z | p-Value | |
| Energy (kcal) | 660 | 807.1 (122.3) | 666.7 (101.0) | 2.440 | 0.015 | 920 | 1115.9 (121.3) | 768.1 (83.5) | 2.907 | 0.004 |
| Protein (g) | 15 | 32.1 (214.1) | 30.5 (203.3) | 0.987 | 0.324 | 22 | 48.0 (218.2) | 33.9 (154.1) | 2.347 | 0.019 |
| Protein % of E | - | 16.3 | 18.4 | 2.588 | 0.010 | - | 17.1 | 16.8 | 0.697 | 0.200 |
| Fat % of E | 20–30 | 35.7 | 38.8 | 1.135 | 0.256 | 20–30 | 38.6 | 40.8 | 1.237 | 0.186 |
| Carbohydrate (g) | 48 | 98.2 (204.6) | 77.2 (160.8) | 2.386 | 0.017 | 60 | 140.4 (233.9) | 86.5 (144.2) | 3.428 | <0.001 |
| Carbohydrate % of E | 50–65 | 48.8 | 43.1 | 1.710 | 0.087 | 50–65 | 45.6 | 40.0 | 1.974 | 0.031 |
| Vitamin A (ug RAE) | 198 | 188.5 (95.2) | 106.0 (53.5) | 3.163 | 0.002 | 312 | 153.2 (49.1) | 148.9 (47.7) | 1.257 | 0.209 |
| Vitamin B1 (mg) | 0.42 | 0.45 (107.1) | 0.37 (88.1) | 2.526 | 0.012 | 0.56 | 0.64 (114.3) | 0.49 (92.5) | 2.583 | 0.010 |
| Vitamin B2 (mg) | 0.42 | 0.42 (100.0) | 0.31 (73.8) | 2.573 | 0.010 | 0.56 | 0.56 (100.0) | 0.36 (64.3) | 2.416 | 0.016 |
| Vitamin C (mg) | 28 | 51.3 (183.3) | 38.9 (139.0) | 3.000 | 0.003 | 38 | 47.6 (125.1) | 48.2 (126.9) | 0.000 | 1.000 |
| Calcium (mg) | 360 | 188.7 (52.4) | 150.3 (41.8) | 2.573 | 0.010 | 400 | 215.4 (53.9) | 188.5 (47.1) | 1.424 | 0.154 |
| Iron (mg) | 5.6 | 7.7 (138.2) | 6.7 (119.6) | 2.738 | 0.017 | 7.2 | 10.0 (139.2) | 8.3 (115.3) | 2.092 | 0.036 |
| Zinc (mg) | 2.8 | 4.8 (170.0) | 4.1 (146.4) | 1.593 | 0.111 | 3.4 | 7.6 (222.4) | 5.3 (155.9) | 2.789 | 0.005 |
Disclaimer/Publisher’s Note: The statements, opinions and data contained in all publications are solely those of the individual author(s) and contributor(s) and not of MDPI and/or the editor(s). MDPI and/or the editor(s) disclaim responsibility for any injury to people or property resulting from any ideas, methods, instructions or products referred to in the content. |
© 2024 by the authors. Licensee MDPI, Basel, Switzerland. This article is an open access article distributed under the terms and conditions of the Creative Commons Attribution (CC BY) license (https://creativecommons.org/licenses/by/4.0/).
Share and Cite
Lin, X.; Li, Y.; Wu, Q.; Lv, Y.; Zhu, Y.; Liu, J.; He, L.; Wang, Z. Quality and Quantity of School Lunch in Nanjing: Based on Data from the Sunshine Restaurant Supervision Platform. Nutrients 2024, 16, 2184. https://doi.org/10.3390/nu16142184
Lin X, Li Y, Wu Q, Lv Y, Zhu Y, Liu J, He L, Wang Z. Quality and Quantity of School Lunch in Nanjing: Based on Data from the Sunshine Restaurant Supervision Platform. Nutrients. 2024; 16(14):2184. https://doi.org/10.3390/nu16142184
Chicago/Turabian StyleLin, Xiaofang, Yuanyuan Li, Qiong Wu, Yizhou Lv, Yirong Zhu, Jingwen Liu, Le He, and Zhixu Wang. 2024. "Quality and Quantity of School Lunch in Nanjing: Based on Data from the Sunshine Restaurant Supervision Platform" Nutrients 16, no. 14: 2184. https://doi.org/10.3390/nu16142184