
Effect of Early Time-Restricted Eating on Metabolic Markers and Body Composition in Individuals with Overweight or Obesity

 , ,
, ,  , , ,
, , ,
Abstract
:
1. Introduction
2. Materials and Methods
2.1. Ethics Statement
2.2. Participants
2.3. Study Design and Protocol
2.4. Adherence
2.5. Body Composition and Blood Pressure
2.6. Meal Tolerance Test
2.7. Appetite Assessment
2.8. Biochemical Measurements
2.9. Statistical Analysis
3. Results
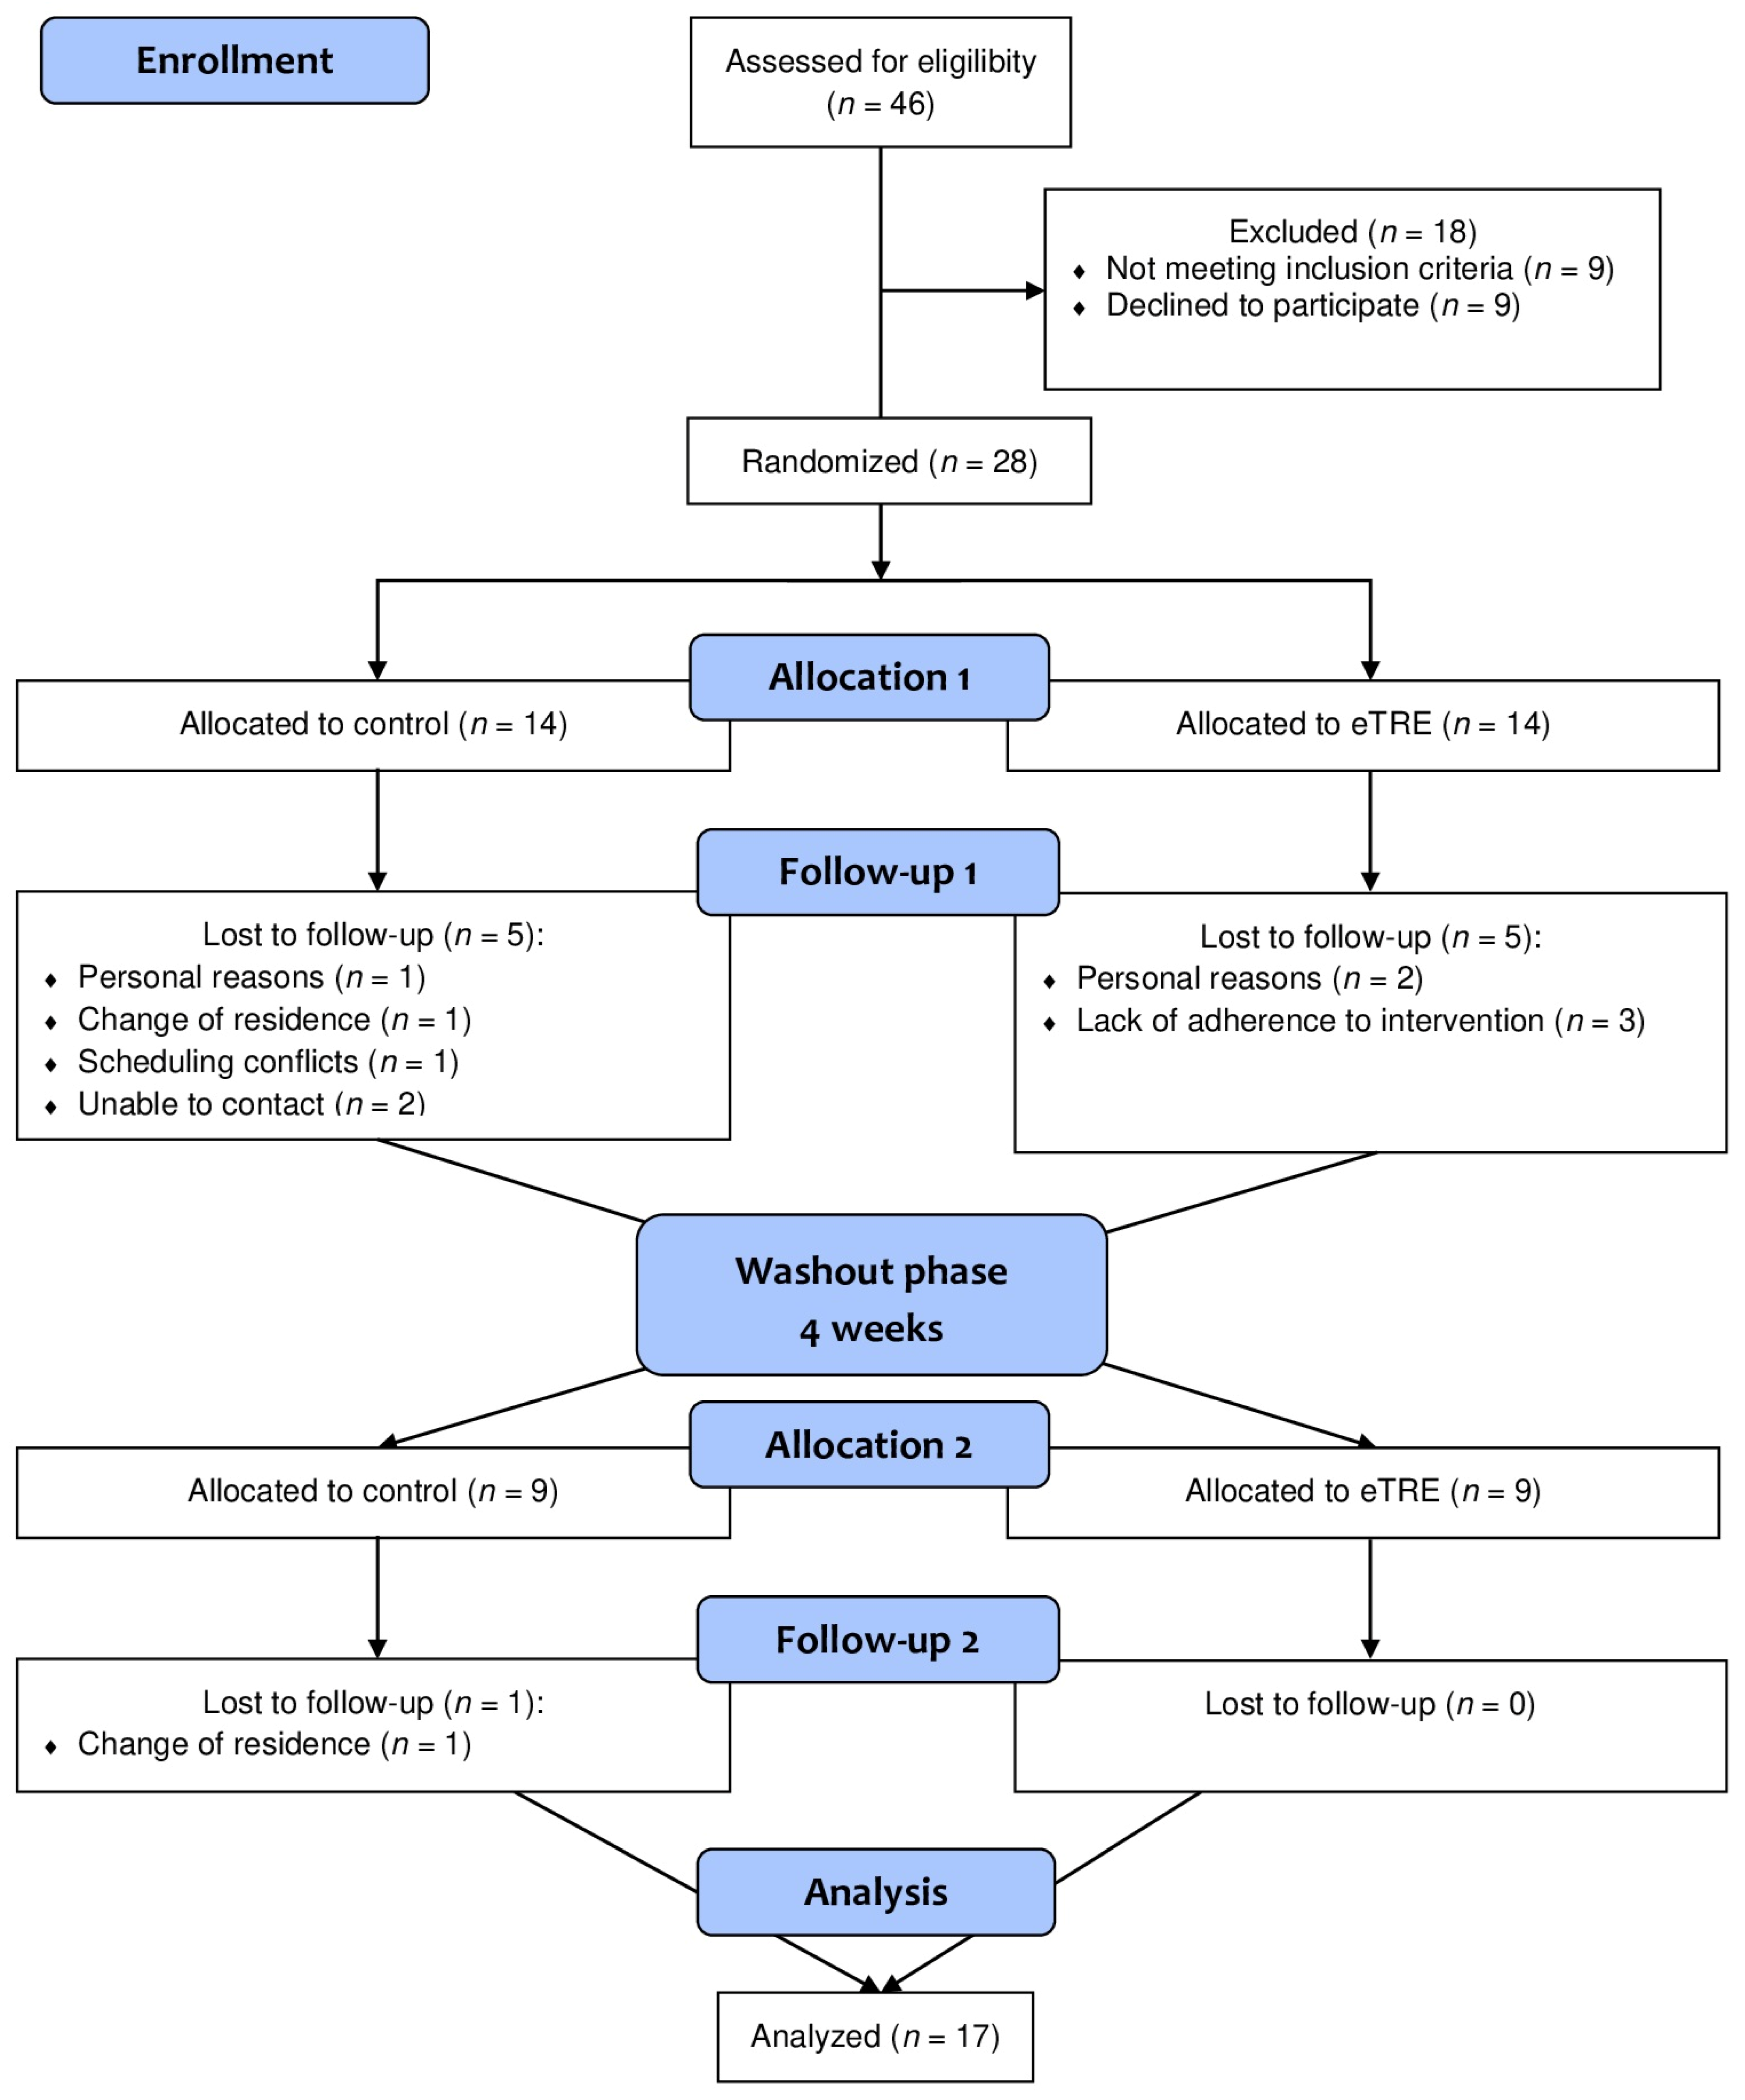
3.1. Participants
3.2. Effect of eTRE on Fasting Biochemical Parameters
3.3. Effect of eTRE on Body Composition and Blood Pressure
3.4. Effect of eTRE on Glycemic Response
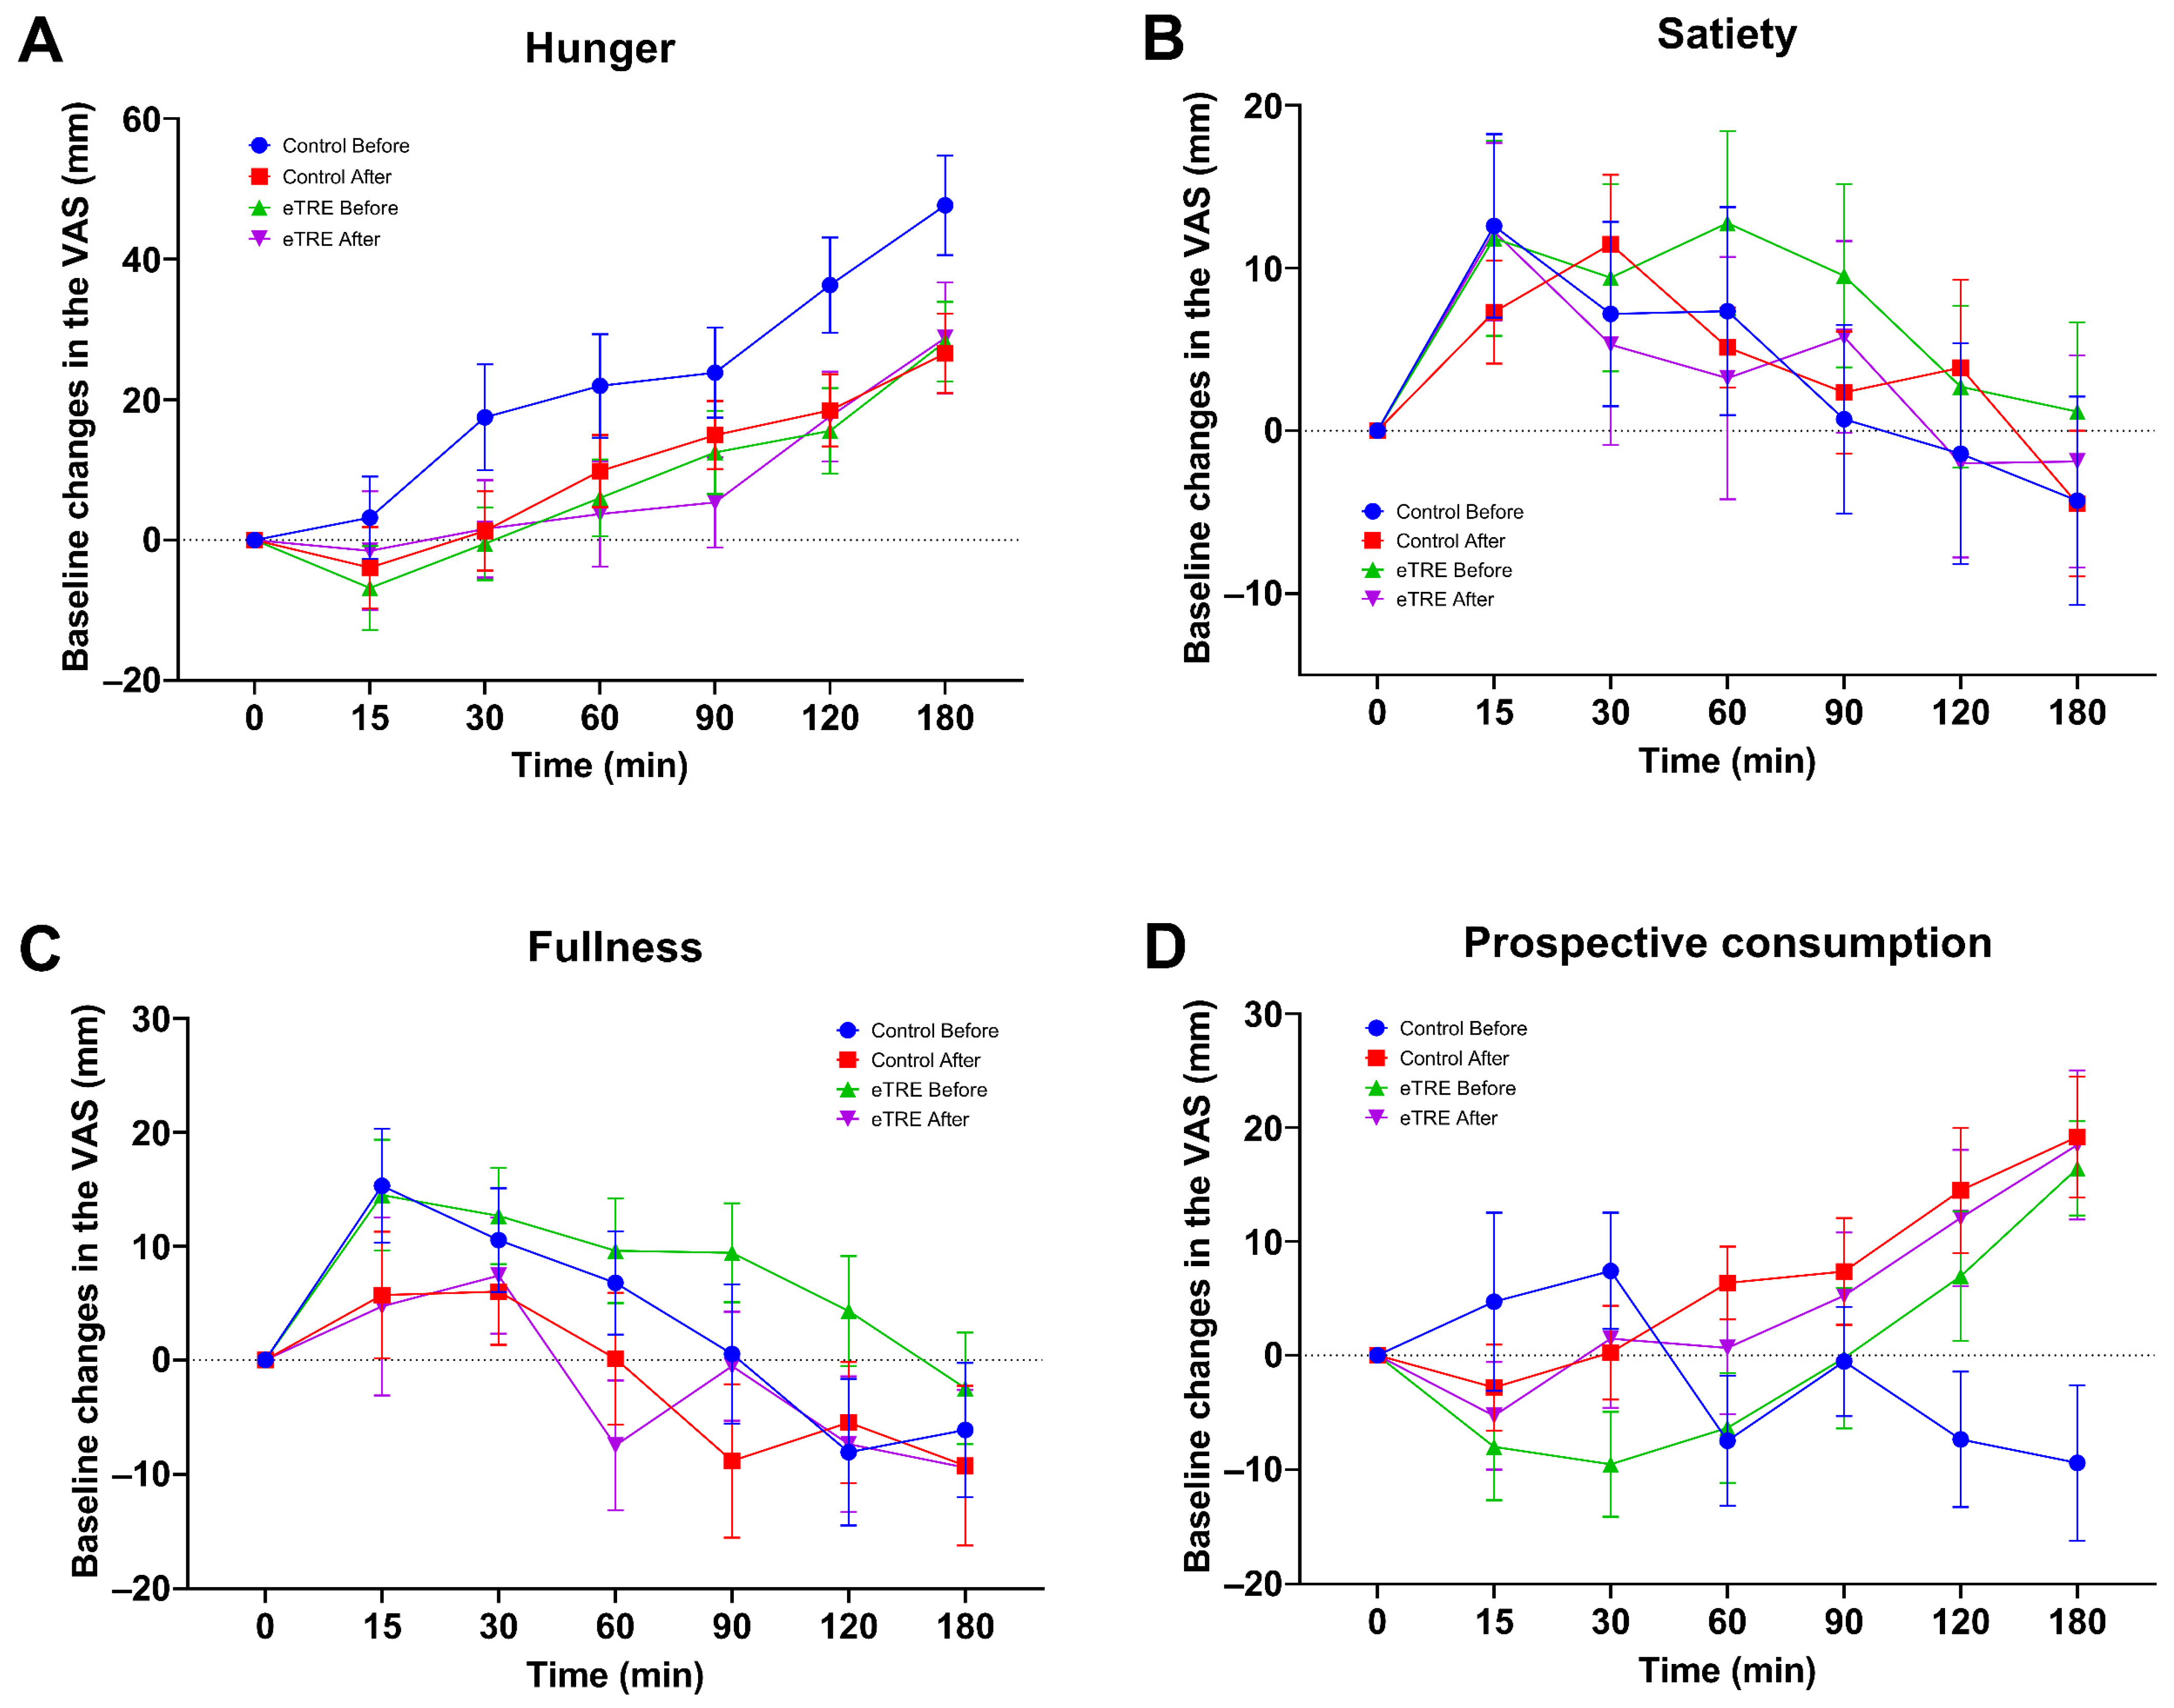
3.5. Effect of eTRE on Subjective Appetite
4. Discussion
5. Conclusions
Supplementary Materials
Author Contributions
Funding
Institutional Review Board Statement
Informed Consent Statement
Data Availability Statement
Acknowledgments
Conflicts of Interest
References
- Chooi, Y.C.; Ding, C.; Magkos, F. The epidemiology of obesity. Metabolism 2019, 92, 6–10. [Google Scholar] [CrossRef] [PubMed]
- Obesity and Overweight. Available online: https://www.who.int/news-room/fact-sheets/detail/obesity-and-overweight (accessed on 9 June 2024).
- Pureza, I.; Macena, M.L.; da Silva Junior, A.E.; Praxedes, D.R.S.; Vasconcelos, L.G.L.; Bueno, N.B. Effect of early time-restricted feeding on the metabolic profile of adults with excess weight: A systematic review with meta-analysis. Clin. Nutr. 2021, 40, 1788–1799. [Google Scholar] [CrossRef] [PubMed]
- Kahan, S. Overweight and obesity management strategies. Am. J. Manag. Care 2016, 22, s186–s196. [Google Scholar] [PubMed]
- Ryan, D.H.; Kahan, S. Guideline recommendations for obesity management. Med. Clin. N. Am. 2018, 102, 49–63. [Google Scholar] [CrossRef] [PubMed]
- Moon, S.; Kang, J.; Kim, S.H.; Chung, H.S.; Kim, Y.J.; Yu, J.M.; Cho, S.T.; Oh, C.M.; Kim, T. Beneficial effects of time-restricted eating on metabolic diseases: A systemic review and meta-analysis. Nutrients 2020, 12, 1267. [Google Scholar] [CrossRef] [PubMed]
- Welton, S.; Minty, R.; O’Driscoll, T.; Willms, H.; Poirier, D.; Madden, S.; Kelly, L. Intermittent fasting and weight loss: Systematic review. Can. Fam. Physician 2020, 66, 117–125. [Google Scholar]
- Elortegui Pascual, P.; Rolands, M.R.; Eldridge, A.L.; Kassis, A.; Mainardi, F.; Lê, K.A.; Karagounis, L.G.; Gut, P.; Varady, K.A. A meta-analysis comparing the effectiveness of alternate day fasting, the 5:2 diet, and time-restricted eating for weight loss. Obesity 2023, 31 (Suppl. 1), 9–21. [Google Scholar] [CrossRef]
- Patterson, R.E.; Sears, D.D. Metabolic effects of intermittent fasting. Annu. Rev. Nutr. 2017, 37, 371–393. [Google Scholar] [CrossRef]
- Pellegrini, M.; Cioffi, I.; Evangelista, A.; Ponzo, V.; Goitre, I.; Ciccone, G.; Ghigo, E.; Bo, S. Effects of time-restricted feeding on body weight and metabolism. A systematic review and meta-analysis. Rev. Endocr. Metab. Disord. 2020, 21, 17–33. [Google Scholar] [CrossRef]
- Anton, S.D.; Moehl, K.; Donahoo, W.T.; Marosi, K.; Lee, S.A.; Mainous, A.G., 3rd; Leeuwenburgh, C.; Mattson, M.P. Flipping the metabolic switch: Understanding and applying the health benefits of fasting. Obesity 2018, 26, 254–268. [Google Scholar] [CrossRef]
- Li, Z.; Heber, D. Intermittent fasting. JAMA 2021, 326, 1338. [Google Scholar] [CrossRef]
- Sutton, E.F.; Beyl, R.; Early, K.S.; Cefalu, W.T.; Ravussin, E.; Peterson, C.M. Early time-restricted feeding improves insulin sensitivity, blood pressure, and oxidative stress even without weight loss in men with prediabetes. Cell Metab. 2018, 27, 1212–1221. [Google Scholar] [CrossRef]
- Jamshed, H.; Beyl, R.A.; Della Manna, D.L.; Yang, E.S.; Ravussin, E.; Peterson, C.M. Early time-restricted feeding improves 24-hour glucose levels and affects markers of the circadian clock, aging, and autophagy in humans. Nutrients 2019, 11, 1234. [Google Scholar] [CrossRef]
- Xie, Z.; Sun, Y.; Ye, Y.; Hu, D.; Zhang, H.; He, Z.; Zhao, H.; Yang, H.; Mao, Y. Randomized controlled trial for time-restricted eating in healthy volunteers without obesity. Nat. Commun. 2022, 13, 1003. [Google Scholar] [CrossRef]
- Schroder, J.D.; Falqueto, H.; Mânica, A.; Zanini, D.; de Oliveira, T.; de Sá, C.A.; Cardoso, A.M.; Manfredi, L.H. Effects of time-restricted feeding in weight loss, metabolic syndrome and cardiovascular risk in obese women. J. Transl. Med. 2021, 19, 3. [Google Scholar] [CrossRef]
- Lowe, D.A.; Wu, N.; Rohdin-Bibby, L.; Moore, A.H.; Kelly, N.; Liu, Y.E.; Philip, E.; Vittinghoff, E.; Heymsfield, S.B.; Olgin, J.E.; et al. Effects of time-restricted eating on weight loss and other metabolic parameters in women and men with overweight and obesity: The treat randomized clinical trial. JAMA Intern. Med. 2020, 180, 1491–1499. [Google Scholar] [CrossRef]
- Flint, A.; Raben, A.; Blundell, J.E.; Astrup, A. Reproducibility, power and validity of visual analogue scales in assessment of appetite sensations in single test meal studies. Int. J. Obes. Relat. Metab. Disord. 2000, 24, 38–48. [Google Scholar] [CrossRef]
- Matthews, D.R.; Hosker, J.P.; Rudenski, A.S.; Naylor, B.A.; Treacher, D.F.; Turner, R.C. Homeostasis model assessment: Insulin resistance and beta-cell function from fasting plasma glucose and insulin concentrations in man. Diabetologia 1985, 28, 412–419. [Google Scholar] [CrossRef]
- Friedewald, W.T.; Levy, R.I.; Fredrickson, D.S. Estimation of the concentration of low-density lipoprotein cholesterol in plasma, without use of the preparative ultracentrifuge. Clin. Chem. 1972, 18, 499–502. [Google Scholar] [CrossRef] [PubMed]
- Cornelissen, G. When you eat matters: 60 years of Franz Halberg’s Nutrition Chronomics. Open Nutraceuticals J. 2012, 5, 1. [Google Scholar] [CrossRef]
- Marcheva, B.; Ramsey, K.M.; Buhr, E.D.; Kobayashi, Y.; Su, H.; Ko, C.H.; Ivanova, G.; Omura, C.; Mo, S.; Vitaterna, M.H.; et al. Disruption of the clock components clock and BMAL1 leads to hypoinsulinaemia and diabetes. Nature 2010, 466, 627–631. [Google Scholar] [CrossRef]
- Singh, R.B.; Cornelissen, G.; Mojto, V.; Fatima, G.; Wichansawakun, S.; Singh, M.; Kartikey, K.; Sharma, J.P.; Torshin, V.I.; Chibisov, S.; et al. Effects of circadian restricted feeding on parameters of metabolic syndrome among healthy subjects. Chronobiol. Int. 2020, 37, 395–402. [Google Scholar] [CrossRef]
- Kamarul Zaman, M.; Teng, N.; Kasim, S.S.; Juliana, N.; Alshawsh, M.A. Effects of time-restricted eating with different eating duration on anthropometrics and cardiometabolic health: A systematic review and meta-analysis. World J. Cardiol. 2023, 15, 354–374. [Google Scholar] [CrossRef]
- Cienfuegos, S.; McStay, M.; Gabel, K.; Varady, K.A. Time restricted eating for the prevention of type 2 diabetes. J. Physiol. 2022, 600, 1253–1264. [Google Scholar] [CrossRef]
- Vasim, I.; Majeed, C.N.; DeBoer, M.D. Intermittent fasting and metabolic health. Nutrients 2022, 14, 631. [Google Scholar] [CrossRef]
- Chair, S.Y.; Cai, H.; Cao, X.; Qin, Y.; Cheng, H.Y.; Ng, M.T. Intermittent fasting in weight loss and cardiometabolic risk reduction: A randomized controlled trial. J. Nurs. Res. 2022, 30, e185. [Google Scholar] [CrossRef]
- Peeke, P.M.; Greenway, F.L.; Billes, S.K.; Zhang, D.; Fujioka, K. Effect of time restricted eating on body weight and fasting glucose in participants with obesity: Results of a randomized, controlled, virtual clinical trial. Nutr. Diabetes 2021, 11, 6. [Google Scholar] [CrossRef]
- Cienfuegos, S.; Gabel, K.; Kalam, F.; Ezpeleta, M.; Wiseman, E.; Pavlou, V.; Lin, S.; Oliveira, M.L.; Varady, K.A. Effects of 4- and 6-h time-restricted feeding on weight and cardiometabolic health: A randomized controlled trial in adults with obesity. Cell Metab. 2020, 32, 366–378. [Google Scholar] [CrossRef]
- Chow, L.S.; Manoogian, E.N.C.; Alvear, A.; Fleischer, J.G.; Thor, H.; Dietsche, K.; Wang, Q.; Hodges, J.S.; Esch, N.; Malaeb, S.; et al. Time-restricted eating effects on body composition and metabolic measures in humans who are overweight: A feasibility study. Obesity 2020, 28, 860–869. [Google Scholar] [CrossRef]
- Haganes, K.L.; Silva, C.P.; Eyjólfsdóttir, S.K.; Steen, S.; Grindberg, M.; Lydersen, S.; Hawley, J.A.; Moholdt, T. Time-restricted eating and exercise training improve HBA1C and body composition in women with overweight/obesity: A randomized controlled trial. Cell Metab. 2022, 34, 1457–1471.e1454. [Google Scholar] [CrossRef]
- Liu, D.; Huang, Y.; Huang, C.; Yang, S.; Wei, X.; Zhang, P.; Guo, D.; Lin, J.; Xu, B.; Li, C.; et al. Calorie restriction with or without time-restricted eating in weight loss. N. Engl. J. Med. 2022, 386, 1495–1504. [Google Scholar] [CrossRef]
- Hutchison, A.T.; Regmi, P.; Manoogian, E.N.C.; Fleischer, J.G.; Wittert, G.A.; Panda, S.; Heilbronn, L.K. Time-restricted feeding improves glucose tolerance in men at risk for type 2 diabetes: A randomized crossover trial. Obesity 2019, 27, 724–732. [Google Scholar] [CrossRef]
- Martens, C.R.; Rossman, M.J.; Mazzo, M.R.; Jankowski, L.R.; Nagy, E.E.; Denman, B.A.; Richey, J.J.; Johnson, S.A.; Ziemba, B.P.; Wang, Y.; et al. Short-term time-restricted feeding is safe and feasible in non-obese healthy midlife and older adults. Geroscience 2020, 42, 667–686. [Google Scholar] [CrossRef]
- Lages, M.; Barros, R.; Moreira, P.; Guarino, M.P. Metabolic effects of an oral glucose tolerance test compared to the mixed meal tolerance tests: A narrative review. Nutrients 2022, 14, 2032. [Google Scholar] [CrossRef]
- Moro, T.; Tinsley, G.; Bianco, A.; Marcolin, G.; Pacelli, Q.F.; Battaglia, G.; Palma, A.; Gentil, P.; Neri, M.; Paoli, A. Effects of eight weeks of time-restricted feeding (16/8) on basal metabolism, maximal strength, body composition, inflammation, and cardiovascular risk factors in resistance-trained males. J. Transl. Med. 2016, 14, 290. [Google Scholar] [CrossRef]
- ElSayed, N.A.; Aleppo, G.; Aroda, V.R.; Bannuru, R.R.; Brown, F.M.; Bruemmer, D.; Collins, B.S.; Hilliard, M.E.; Isaacs, D.; Johnson, E.L.; et al. 8. Obesity and weight management for the prevention and treatment of type 2 diabetes: Standards of care in diabetes—2023. Diabetes Care 2022, 46, S128–S139. [Google Scholar] [CrossRef]
- Ravussin, E.; Beyl, R.A.; Poggiogalle, E.; Hsia, D.S.; Peterson, C.M. Early time-restricted feeding reduces appetite and increases fat oxidation but does not affect energy expenditure in humans. Obesity 2019, 27, 1244–1254. [Google Scholar] [CrossRef]
- Gabel, K.; Hoddy, K.K.; Haggerty, N.; Song, J.; Kroeger, C.M.; Trepanowski, J.F.; Panda, S.; Varady, K.A. Effects of 8-hour time restricted feeding on body weight and metabolic disease risk factors in obese adults: A pilot study. Nutr. Healthy Aging 2018, 4, 345–353. [Google Scholar] [CrossRef]
- Phillips, L.S.; Ratner, R.E.; Buse, J.B.; Kahn, S.E. We can change the natural history of type 2 diabetes. Diabetes Care 2014, 37, 2668–2676. [Google Scholar] [CrossRef] [PubMed]
- American Diabetes Association Professional Practice Committee. 2. Classification and diagnosis of diabetes: Standards of medical care in diabetes—2022. Diabetes Care 2022, 45 (Suppl. 1), S17–S38. [Google Scholar] [CrossRef] [PubMed]
- De Sanctis, V.; Daar, S.; Soliman, A.T.; Tzoulis, P.; Karimi, M.; Di Maio, S.; Kattamis, C. Screening for glucose dysregulation in β-thalassemia major (β-tm): An update of current evidences and personal experience. Acta Biomed. 2022, 93, e2022158. [Google Scholar]
- Grundy, S.M.; Brewer, H.B., Jr.; Cleeman, J.I.; Smith, S.C., Jr.; Lenfant, C. Definition of metabolic syndrome: Report of the National Heart, Lung, and Blood Institute/American Heart Association conference on scientific issues related to definition. Circulation 2004, 24, e13–e18. [Google Scholar]
- Isenmann, E.; Dissemond, J.; Geisler, S. The effects of a macronutrient-based diet and time-restricted feeding (16:8) on body composition in physically active individuals-a 14-week randomised controlled trial. Nutrients 2021, 13, 3122. [Google Scholar] [CrossRef]
- Jones, R.; Pabla, P.; Mallinson, J.; Nixon, A.; Taylor, T.; Bennett, A.; Tsintzas, K. Two weeks of early time-restricted feeding (etrf) improves skeletal muscle insulin and anabolic sensitivity in healthy men. Am. J. Clin. Nutr. 2020, 112, 1015–1028. [Google Scholar] [CrossRef]
- Naguib, M.N.; Hegedus, E.; Raymond, J.K.; Goran, M.I.; Salvy, S.J.; Wee, C.P.; Durazo-Arvizu, R.; Moss, L.; Vidmar, A.P. Continuous glucose monitoring in adolescents with obesity: Monitoring of glucose profiles, glycemic excursions, and adherence to time restricted eating programs. Front. Endocrinol. 2022, 13, 841838. [Google Scholar] [CrossRef]
- Vidmar, A.P.; Naguib, M.; Raymond, J.K.; Salvy, S.J.; Hegedus, E.; Wee, C.P.; Goran, M.I. Time-limited eating and continuous glucose monitoring in adolescents with obesity: A pilot study. Nutrients 2021, 13, 3697. [Google Scholar] [CrossRef]
- Ellison-Barnes, A.; Johnson, S.; Gudzune, K. Trends in obesity prevalence among adults aged 18 through 25 years, 1976–2018. JAMA 2021, 326, 2073–2074. [Google Scholar] [CrossRef]
- Katsoulis, M.; Lai, A.G.; Diaz-Ordaz, K.; Gomes, M.; Pasea, L.; Banerjee, A.; Denaxas, S.; Tsilidis, K.; Lagiou, P.; Misirli, G.; et al. Identifying adults at high-risk for change in weight and bmi in england: A longitudinal, large-scale, population-based cohort study using electronic health records. Lancet Diabetes Endocrinol. 2021, 9, 681–694. [Google Scholar] [CrossRef]
- Poobalan, A.; Aucott, L. Obesity among young adults in developing countries: A systematic overview. Curr. Obes. Rep. 2016, 5, 2–13. [Google Scholar] [CrossRef]
- Dhurandhar, N.V.; Schoeller, D.; Brown, A.W.; Heymsfield, S.B.; Thomas, D.; Sørensen, T.I.; Speakman, J.R.; Jeansonne, M.; Allison, D.B. Energy balance measurement: When something is not better than nothing. Int. J. Obes. 2015, 39, 1109–1113. [Google Scholar] [CrossRef]
- Schoeller, D.A.; Thomas, D.; Archer, E.; Heymsfield, S.B.; Blair, S.N.; Goran, M.I.; Hill, J.O.; Atkinson, R.L.; Corkey, B.E.; Foreyt, J.; et al. Self-report-based estimates of energy intake offer an inadequate basis for scientific conclusions. Am. J. Clin. Nutr. 2013, 97, 1413–1415. [Google Scholar] [CrossRef]
- Gill, S.; Panda, S. A smartphone app reveals erratic diurnal eating patterns in humans that can be modulated for health benefits. Cell Metab. 2015, 22, 789–798. [Google Scholar] [CrossRef]


| Variable | All Participants (n = 17) | Women (n = 12) | Men (n = 5) |
|---|---|---|---|
| Age (years) | 25.7 ± 10.0 | 20.0 (18.3–33.3) | 21.0 (19.5–38.0) |
| Body weight (kg) | 85. 4 ± 19.6 | 85.3 ± 22.8 | 83.2 (73.9–94.4) |
| BMI (kg/m2) | 32.0 ± 6.3 | 33.0 ± 7.1 | 29.1 (27.1–31.9) |
| BMI 25–29.9 kg/m2 | 8 (47%) | 4 (33%) | 4 (80%) |
| BMI >30 kg/m2 | 9 (53%) | 8 (67%) | 1 (20%) |
| % Body fat | 36.7 ± 9.6 | 38.8 ± 9.1 | 27.6 (21.9–35.1) |
| Fat mass (kg) | 26.50 (20.4–37.3) | 33.9 ± 16.2 | 24.0 (17.0–32.7) |
| Lean mass (kg) | 54.2 ± 10.7 | 47.1 (43.4–57.5) | 63.0 (56.8–63.7) |
| Waist circumference (cm) | 92.9 ± 12.9 | 91.8 ± 14.0 | 99.0 (85.3–104.0) |
| SBP (mmHg) | 120.3 ± 15.5 | 117.3 ± 16.7 | 131.5 (118.5–135.0) |
| DBP (mmHg) | 78.0 ± 10.3 | 77.3 ± 10.2 | 83 (67.8–89.5) |
| Fasting glucose (mg/dL) | 82.0 ± 10.8 | 81.4 ± 8.8 | 83.5 (68.1–98.9) |
| Fasting insulin (μU/mL) | 4.6 (3.7–6.5) | 4.4 (3.6–5.6) | 6.2 (4.5–8.9) |
| Total cholesterol (mg/dL) | 171.5 ± 30.7 | 174.9 ± 31.3 | 155.0 (137.5–195.2) |
| Triglycerides (mg/dL) | 97.1 (68.5–152.5) | 106.9 ± 50.6 | 110.0 (72.4–236.8) |
| HDL-C (mg/dL) | 42.2 ± 6.2 | 43.9 ± 5.0 | 33.8 (32.7–47.0) |
| HOMA-IR | 2.1 (1.7–4.3) | 2.0 (1.6–3.6) | 3.3 (1.5–7.2) |
| Variable | n | eTRE | Control | p Value | ||
|---|---|---|---|---|---|---|
| Before | After | Before | After | |||
| Metabolic markers | ||||||
| Glucose (mg/dL) | 15 | 84.7 ± 8.8 | 89.7 ± 9.1 | 89.4 ± 14.3 | 87.4 ± 12.9 | 0.75 |
| Insulin (μU/mL) | 15 | 8.2 (4.0–16.6) | 14.4 (12.1–18.2) | 11.8 ± 8.6 | 18.8 ± 8.0 | 0.53 |
| Total cholesterol (mg/dL) | 15 | 162.1 (144.0–203.8) | 188.4 (140.5–198.9) | 174.6 ± 37.6 | 170.5 ± 34.9 | 0.92 |
| Triglycerides (mg/dL) | 15 | 103.0 (71.0–144.5) | 125.1 (62.0–186.8) | 98.4 (63.6–155.1) | 104.3 (79.0–136.0) | 0.93 |
| HDL-C (mg/dL) | 15 | 44.7 ± 8.0 | 41.5 ± 8.2 | 42.5 ± 6.6 | 43.6 ± 11.4 | 0.98 |
| LDL-C (mg/dL) | 15 | 102.6 ± 23.5 | 107.3 ± 31.0 | 106.7 ± 30.6 | 100.6 ± 30.5 | 0.89 |
| HOMA-IR | 15 | 1.2 (0.7–2.9) | 3.2 (2.6–4.3) | 2.0 (1.3–3.6) | 3.9 (3.0–5.8) | 0.46 |
| Body composition | ||||||
| Body weight (kg) | 17 | 85.3 ± 19.6 | 84.7 ± 19.5 | 85.0 ± 19.5 | 84.9 ± 19.3 | 0.99 |
| BMI (kg/m2) | 17 | 31.9 ± 6.4 | 31.7 ± 6.3 | 31.8 ± 6.3 | 31.8 ± 6.2 | 0.98 |
| % Body fat | 17 | 36.1 ± 9.6 | 36.7 ± 9.6 | 37.2 ± 9.4 | 36.9 ± 9.4 | 0.84 |
| Fat mass (kg) | 17 | 26.5 (20.8–37.3) | 28.5 (21.0–39.4) | 32.7 ± 15.2 | 32.5 ± 15.2 | 0.78 |
| Lean mass (kg) | 17 | 50.0 (43.7–58.5) | 54.8 (44.1–59.0) | 52.3 ± 8.4 | 50.7 ± 9.5 | 0.84 |
| Waist circumference (cm) | 17 | 90.0 (82.0–97.0) | 92.0 (80.0–101.5) | 91.3 ± 13.7 | 92.1 ± 12.8 | 0.82 |
| Hip circumference (cm) | 17 | 114.2 ± 16.3 | 115.1 ± 13.7 | 114.1 ± 13.9 | 114.9 ± 14.8 | 0.98 |
| WHR | 17 | 0.8 ± 0.1 | 0.8 ± 0.1 | 0.8 ± 0.1 | 0.8 ± 0.1 | 0.71 |
| Physiological parameters | ||||||
| SBP (mmHg) | 17 | 116.0 (107.5–123.0) | 115.0 (111.0–119.5) | 118.4 ± 14.4 | 113.1 ± 13.1 | 0.84 |
| DBP (mmHg) | 17 | 77.5 ± 10.5 | 76.9 ± 8.2 | 78.8 ± 10.3 | 75.0 ± 8.6 | 0.92 |
| Heart rate (bpm) | 17 | 77.7 ± 12.3 | 75.7 ± 11.0 | 75.7 ± 14.5 | 76.9 ± 12.8 | 0.90 |
Disclaimer/Publisher’s Note: The statements, opinions and data contained in all publications are solely those of the individual author(s) and contributor(s) and not of MDPI and/or the editor(s). MDPI and/or the editor(s) disclaim responsibility for any injury to people or property resulting from any ideas, methods, instructions or products referred to in the content. |
© 2024 by the authors. Licensee MDPI, Basel, Switzerland. This article is an open access article distributed under the terms and conditions of the Creative Commons Attribution (CC BY) license (https://creativecommons.org/licenses/by/4.0/).
Share and Cite
Mena-Hernández, D.R.; Jiménez-Domínguez, G.; Méndez, J.D.; Olvera-Hernández, V.; Martínez-López, M.C.; Guzmán-Priego, C.G.; Reyes-López, Z.; Ramos-García, M.; Juárez-Rojop, I.E.; Zavaleta-Toledo, S.S.; et al. Effect of Early Time-Restricted Eating on Metabolic Markers and Body Composition in Individuals with Overweight or Obesity. Nutrients 2024, 16, 2187. https://doi.org/10.3390/nu16142187
Mena-Hernández DR, Jiménez-Domínguez G, Méndez JD, Olvera-Hernández V, Martínez-López MC, Guzmán-Priego CG, Reyes-López Z, Ramos-García M, Juárez-Rojop IE, Zavaleta-Toledo SS, et al. Effect of Early Time-Restricted Eating on Metabolic Markers and Body Composition in Individuals with Overweight or Obesity. Nutrients. 2024; 16(14):2187. https://doi.org/10.3390/nu16142187
Chicago/Turabian StyleMena-Hernández, Dalila Rubí, Guadalupe Jiménez-Domínguez, José D. Méndez, Viridiana Olvera-Hernández, Mirian C. Martínez-López, Crystell G. Guzmán-Priego, Zeniff Reyes-López, Meztli Ramos-García, Isela E. Juárez-Rojop, Selene S. Zavaleta-Toledo, and et al. 2024. "Effect of Early Time-Restricted Eating on Metabolic Markers and Body Composition in Individuals with Overweight or Obesity" Nutrients 16, no. 14: 2187. https://doi.org/10.3390/nu16142187
APA StyleMena-Hernández, D. R., Jiménez-Domínguez, G., Méndez, J. D., Olvera-Hernández, V., Martínez-López, M. C., Guzmán-Priego, C. G., Reyes-López, Z., Ramos-García, M., Juárez-Rojop, I. E., Zavaleta-Toledo, S. S., & Ble-Castillo, J. L. (2024). Effect of Early Time-Restricted Eating on Metabolic Markers and Body Composition in Individuals with Overweight or Obesity. Nutrients, 16(14), 2187. https://doi.org/10.3390/nu16142187