
Intake of Artificial Sweeteners through Soft Drinks in the Preschool- and School-Aged Population
 , , and
Abstract
:1. Introduction
2. Materials and Methods
2.1. Survey
Survey Design
2.2. Samples
2.3. Determination of Acesulfame Potassium, Sodium Saccharin Dihydrate and Aspartame
2.3.1. Chemicals and Working Solutions
2.3.2. Sample Preparation
2.3.3. Method
2.4. Determination of Cyclamate
2.4.1. Chemicals and Working Solutions
2.4.2. Sample Preparation
2.4.3. Method
2.5. Statistical Analysis
3. Results and Discussion
Study Limitations
4. Conclusions
Author Contributions
Funding
Institutional Review Board Statement
Data Availability Statement
Acknowledgments
Conflicts of Interest
References
- OECD/European Union. Health at a Glance: Europe 2018: State of Health in the EU Cycle; OECD Publishing, Paris/European Union: Brussels, Belgium, 2018. [Google Scholar] [CrossRef]
- EUROSTAT. Available online: https://ec.europa.eu/eurostat/statistics-explained/index.php?title=Overweight_and_obesity_-_BMI_statistics (accessed on 30 April 2024).
- Dai, H.; Alsalhe, T.A.; Chalghaf, N.; Ricco, M.; Bragazzi, N.L.; Wu, J. The global burden of disease attributable to high body mass index in 195 countries and territories, 1990-2017: An analysis of the Global Burden of Disease Study. PLoS Med. 2020, 17, e1003198. [Google Scholar] [CrossRef] [PubMed]
- WHO Online Publications: Guideline: Sugars intake for adults and children. 2015. Available online: https://www.who.int/publications/i/item/9789241549028 (accessed on 30 April 2024).
- European Commision. Regulation (EC) No 1333/2008 on Food Additives; European Commision: Brussels, Belgium, 2008. [Google Scholar]
- Carocho, M.; Morales, P.; Ferreira, I. Sweeteners as food additives in the XXI century: A review of what is known, and what is to come. Food Chem. Toxicol. 2017, 107, 302–317. [Google Scholar] [CrossRef]
- Chattopadhyay, S.; Raychaudhuri, U.; Chakraborty, R. Artificial sweeteners—A review. J Food Sci. Technol. 2014, 51, 611–621. [Google Scholar] [CrossRef] [PubMed]
- Ruiz-Ojeda, F.J.; Plaza-Díaz, J.; Sáez-Lara, M.J.; Gil, A. Effects of Sweeteners on the Gut Microbiota: A Review of Experimental Studies and Clinical Trials. Adv. Nutr. 2019, 10, S31–S48. [Google Scholar] [CrossRef]
- Ižaković, M.; Ačkar, Đ.; Šubarić, D. Commonly used artificial sweeteners in Europe. Food Health Dis. 2021, 10, 24–34. [Google Scholar]
- Sylvetsky, A.C.; Jin, Y.; Clark, E.J.; Welsh, J.A.; Rother, K.I.; Talegawkar, S.A. Consumption of low-calorie sweeteners among children and adults in the United States. J. Acad. Nutr. Diet. 2017, 117, 441–448. [Google Scholar] [CrossRef] [PubMed]
- Andueza, N.; Navas-Carretero, S.; Cuervo, M. Effectiveness of Nutritional Strategies on Improving the Quality of Diet of Children from 6 to 12 Years Old: A Systematic Review. Nutrients 2022, 14, 372. [Google Scholar] [CrossRef] [PubMed]
- Tarro, S.; Lahdenpera, M.; Vahtera, J.; Pentti, J.; Lagstrom, H. Diet quality in preschool children and associations with individual eating behavior and neighborhood socioeconomic disadvantage. The STEPS Study. Appetite 2022, 172, 105950. [Google Scholar] [CrossRef]
- Gazec, P.; Civka, K.; Friganović, A. Nutritional Habits of Preschool Children. Croat. Nurs. J. 2021, 5, 143–156. [Google Scholar] [CrossRef]
- Mazarello Paes, V.; Hesketh, K.; O’Malley, C.; Moore, H.; Summerbell, C.; Griffin, S. Determinants of sugar-sweetened beverage consumption in young children: A systematic review. Obes. Rev. 2015, 16, 903–913. [Google Scholar] [CrossRef]
- Heinen, M.M.; Bel-Serrat, S.; Kelleher, C.C.; Buoncristiano, M.; Spinelli, A.; Nardone, P.; Musić Milanović, S.; Rito, A.I.; Bosi, A.T.B.; Gutiérrrez-González, E.; et al. Urban and rural differences in frequency of fruit, vegetable, and soft drink consumption among 6–9-year-old children from 19 countries from the WHO European region. Obes. Rev. 2021, 22, 13207. [Google Scholar] [CrossRef] [PubMed]
- World Health Organization (WHO). Use of Non-Sugar Sweeteners: WHO Guideline; World Health Organization: Geneva, Switzerland, 2023. [Google Scholar]
- Sánchez-Tapia, M.; Martínez-Medina, J.; Tovar, A.R.; Torres, N. Natural and Artificial Sweeteners and High Fat Diet Modify Differential Taste Receptors, Insulin, and TLR4-Mediated Inflammatory Pathways in Adipose Tissues of Rats. Nutrients 2019, 11, 880. [Google Scholar] [CrossRef]
- Singh, S.; Kohli, A.; Trivedi, S.; Kanagala, S.G.; Anamika, F.N.U.; Garg, N.; Patel, M.A.; Munjal, R.S.; Jain, R. The contentious relationship between artificial sweeteners and cardiovascular health. Egypt. J. Intern. Med. 2023, 35, 43. [Google Scholar] [CrossRef]
- Debras, C.; Chazelas, E.; Sellem, L.; Porcher, R.; Druesne-Pecollo, N.; Esseddik, Y.; de Edelenyi, F.S.; Agaësse, C.; De Sa, A.; Lutchia, R.; et al. Artificial sweeteners and risk of cardiovascular diseases: Results. BMJ. 2022, 378, e071204. [Google Scholar] [CrossRef] [PubMed]
- Spencer, M.; Gupta, A.; Dam, L.V.; Shannon, C.; Menees, S.; Chey, W.D. Artificial Sweeteners: A Systematic Review and Primer for Gastroenterologists. J. Neurogastroenterol. Motil. 2016, 22, 168–180. [Google Scholar] [CrossRef] [PubMed]
- Suez, J.; Korem, T.; Zeevi, D.; Zilberman-Schapira, G.; Thaiss, C.; Maza, O.; Israeli, D.; Zmora, N.; Gilad, S.; Weinberger, A.; et al. Artificial sweeteners induce glucose intolerance by altering the gut microbiota. Nature 2014, 514, 181–186. [Google Scholar] [CrossRef]
- Suez, J.; Korem, T.; Zilberman-Schapira, G.; Sega, E.; Elinav, E. Non-caloric artificial sweeteners and the microbiome: Findings and challenges. Gut Microbes 2015, 6, 149–155. [Google Scholar] [CrossRef] [PubMed]
- Basson, A.R.; Rodriguez-Palacio, A.; Cominelli, F. Artificial Sweeteners: History and New Concepts on Inflammation. Front. Nutr. 2021, 8, 746247. [Google Scholar] [CrossRef]
- Walbolt, J.; Kohn, Y. Non-nutritive Sweeteners and Their Associations with Obesity and Type 2 Diabetes. J. Obes. Metab. Syndr. 2020, 29, 114–123. [Google Scholar] [CrossRef]
- Posta, E.; Fekete, I.; Gyarmati, E.; Stündl, L.; Zolt, E.; Barta, Z. The Effects of Artificial Sweeteners on Intestinal Nutrient-Sensing Receptors: Dr. Jekyll or Mr. Hyde? Life 2024, 14, 10. [Google Scholar] [CrossRef]
- Lohner, S.; Toews, I.; Meerpohl, J. Health outcomes of non-nutritive sweeteners: Analysis of the research landscape. Nutr. J. 2017, 16, 55. [Google Scholar] [CrossRef]
- Thow, A.M.; Rippin, H.L.; Mulcahy, G.; Duffey, K.; Wickramasinghe, K. Sugar-sweetened beverage taxes in Europe: Learning for the future. Eur. J. Public Health 2022, 32, 273–280. [Google Scholar] [CrossRef]
- European Commision. Regulation (EU) No 1169/2011 on the Provision of Food Information to Consumers; European Commision: Brussels, Belgium, 2011. [Google Scholar]
- Croatian Food Agency. Available online: https://www.hah.hr/citajte-deklaracije-na-hranisvjetski-dan-prava-potrosaca-2017/ (accessed on 4 June 2024).
- Croatian Food Agency. Available online: https://www.hapih.hr/gradani-hrvatske-trebali-bi-posvecivati-vise-paznje-prilikom-pripreme-i-cuvanja-hrane-a-deklaracije-cita-njih-gotovo-95/ (accessed on 4 June 2024).
- Icer, M.A.; Karadag, M.G. Evaluation of nutrition label reading habits and knowledge levels among Turkish consumers: Implications for healthier food choices. Eur. J. Environ. Public Health 2023, 7, em0144. [Google Scholar] [CrossRef]
- Musić Milanović, S.; Križan, H.; Lang Morović, M.; Meštrić, S.; Šlaus, N.; Pezo, A. European initiative to monitor obesity in children, Croatia 2021/2022.(CroCOSI); Croatian Institute for Public Health: Zagreb, Croatia, 2024. [Google Scholar]
- HRN EN 12856:2000; Foodstuffs—Determination of Acesulfame-K, Aspartame and Saccharin—High Performance Liquid Chromatographic Method. iTeh Standards: Newark, DE, USA, 2000.
- EN 12857:1999; Foodstuffs—Determination of Cyclamate—High Performance Liquid Chromatographic Method. iTeh Standards: Newark, DE, USA, 2000.
- World Health Organization. Available online: https://www.who.int/europe/news-room/fact-sheets/item/a-healthy-lifestyle---who-recommendations (accessed on 4 June 2024).
- Magnuson, B.A.; Carakostas, M.C.; Moore, N.H.; Poulos, S.P.; Renwick, A.G. Biological fate of low-calorie sweeteners. Nutr. Rev. 2016, 74, 670–689. [Google Scholar] [CrossRef]
- Lin, C.H.; Li, H.Y.Y.; Wang, S.H.; Chen, Y.H.; Chen, Y.C.; Wu, H.T. Consumption of Non-Nutritive Sweetener, Acesulfame Potassium Exacerbates Atherosclerosis through Dysregulation of Lipid Metabolism in ApoE-/- Mice. Nutrients 2021, 13, 3984. [Google Scholar] [CrossRef]
- Sun, J.P.; Han, Q.; Zhang, X.Q.; Ding, M.Y. Investigations on the degradation of aspartame using high-performance liquid chromatography/tandem mass spectrometry. Chin. Chem. Lett. 2014, 25, 1259–1264. [Google Scholar] [CrossRef]
- European Food Safety Authority. Scientific Opinion on the re-evaluation of aspartame (E 951) as a food additive. EFSA J. 2013, 11, 3496. [Google Scholar]
- Trawiński, J.; Skibiński, R. Stability of aspartame in the soft drinks: Identification of the novel phototransformation products and their toxicity evaluation. Food Res. Int. 2023, 173, 113365. [Google Scholar] [CrossRef]
- Etchison, W.C.; Bloodgood, E.A.; Minton, C.P.; Thompson, N.J.; Collins, M.A.; Hunter, S.C.; Dai, H. Body mass index and percentage of body fat as indicators for obesity in an adolescent athletic population. Sports Health 2011, 3, 249–252. [Google Scholar] [CrossRef]
- Vanderwall, C.; Randall, C.R.; Eickhoff, J.; Carrel, A.L. BMI is a poor predictor of adiposity in young overweight and obese children. BMC Pediatr. 2017, 2, 135. [Google Scholar] [CrossRef]
- Barrios-Correa, A.A.; Estrada, J.A.; Martel, C.; Olivier, M.; López-Santiago, R.; Contreras, I. Chronic Intake of Commercial Sweeteners Induces Changes in Feeding Behavior and Signaling Pathways Related to the Control of Appetite in BALB/c Mice. Biomed Res. Int. 2018, 2018, 3628121. [Google Scholar] [CrossRef]
- Schorb, S.; Gleiss, K.; Wedekind, R.; Suonio, E.; Kull, A.K.; Kuntz, M.; Walch, S.G.; Lachenmeier, D.W. Assessment of Aspartame (E951) Occurrence in Selected Foods and Beverages on the German Market 2000–2022. Foods 2023, 12, 2156. [Google Scholar] [CrossRef]
- Yu, Z.; Wang, Y.; Lu, J.; Bond, P.L.; Guo, J. Nonnutritive sweeteners can promote the dissemination of antibiotic resistance through conjugative gene transfer. ISME J. 2021, 15, 2117–2130. [Google Scholar] [CrossRef]
- Yu, Z.; Wang, Y.; Henderson, I.R.; Guo, J. Artificial Sweeteners Stimulate Horizontal Transfer of Extracellular Antibiotic Resistance Genes through Natural Transformation. ISME J. 2022, 2, 543–554. [Google Scholar] [CrossRef]
- Debras, C.; Deschasaux-Tanguy, M.; Chazelas, E.; Sellem, L.; Druesne-Pecollo, N.; Esseddik, Y.; Szabo de Edelenyi, F.; Agaëesse, C.; De Sa, A.; Lutchia, R.; et al. Artificial Sweeteners and Risk of Type 2 Diabetes in the Prospective NutriNet-Sant e Cohort. Diabetes Care 2023, 46, 1681–1690. [Google Scholar] [CrossRef]
- Pang, M.D.; Goossens, G.H.; Blaak, E.E. The Impact of Artificial Sweeteners on Body Weight Control and Glucose Homeostasis. Front. Nutr. 2021, 7, 598340. [Google Scholar] [CrossRef]
- Hughes, R.L.; Davis, C.D.; Lobach, A.; Holscher, H.D. Overview of Current Knowledge of the Gut Microbiota and Low-Calorie Sweeteners. Nutr. Today 2024, 56, 105–113. [Google Scholar] [CrossRef]
- Conz, A.; Salmona, M.; Diomede, L. Effect of Non-Nutritive Sweeteners on the Gut Microbiota. Nutrients 2023, 15, 1869. [Google Scholar] [CrossRef]
- Daher, M.I.; Matta, J.M.; Abdel Nour, A.M. Non-nutritive sweeteners and type 2 diabetes: Should we ring the bell? Diabetes Res. Clin. Pract. 2019, 155, 107786. [Google Scholar] [CrossRef]
- Shaher, S.A.A.; Mihailescu, D.F.; Amuzescu, B. Aspartame Safety as a Food Sweetener and Related Health Hazards. Nutrients 2023, 15, 3627. [Google Scholar] [CrossRef]


| Sweeteners | * Degree of Sweetness | kcal g−1 |
ADI mg kg−1 b.w. | Natural Sugars | * Degree of Sweetness | kcal g−1 |
ADI mg kg −1 b.w. |
|---|---|---|---|---|---|---|---|
| Artificial sweeteners | |||||||
| Advantame | 37,000 | 0 | 5 | Fructose | 1.1–1.5 | 4 | not specified |
| Aspartame | 200 | 4 | 40 | Sucrose | 1 | 4 | not specified |
| Acesulfame K | 150–200 | 0 | 9 | Dextrose | 0.9 | 4 | not specified |
| Cyclamate | 30–80 | 0 | 11 | Glucose | 0.75 | 4 | not specified |
| Neotame | 7000–13,000 | 0 | 2 | Maltose | 0.4 | 4 | not specified |
| Neohespedrin DC | 1500–2000 | 2 | 20 | Galactose | 0.3 | 4 | not specified |
| Sucralose | 400–800 | 0 | 15 | Raffinose | 0.2 | 4 | not specified |
| Saccharin | 240–300 | 3.6 | 5 | ||||
| Natural sweeteners | |||||||
| Natural plant protein | |||||||
| Thaumatin | 3000 | 4.0 | not specified | ||||
| Sugar alcohols–polyols | |||||||
| Lactitol | 0.35 | 2 | not specified | ||||
| Xylitol | 1 | 2.4 | not specified | ||||
| Erythritol | 0.7 | 0.2 | 0.5 | ||||
| Maltitol | 0.75 | 2.1 | not specified | ||||
| Mannitol | 0.6 | 1.6 | not specified | ||||
| Sorbitol | 0.6 | 2.6 | not specified | ||||
| Isomaltose | 0.55 | 2 | not specified | ||||
| Steviol glycosides | 250 | 0 | 4 | ||||
| Variable | Age 1–6.9 N = 250 | Age 7–14 N = 73 | Difference between Groups (According to Age) χ2 Test | |
|---|---|---|---|---|
| Gender | F | 108 | 37 | p = 0.258 |
| M | 142 | 36 | ||
| Age | Minimum | 1.0 | 7.0 | |
| Maximum | 6.5 | 14.0 | ||
| Average ± S.D. | 4.42 ± 1.44 | 8.92 ± 2.0 | ||
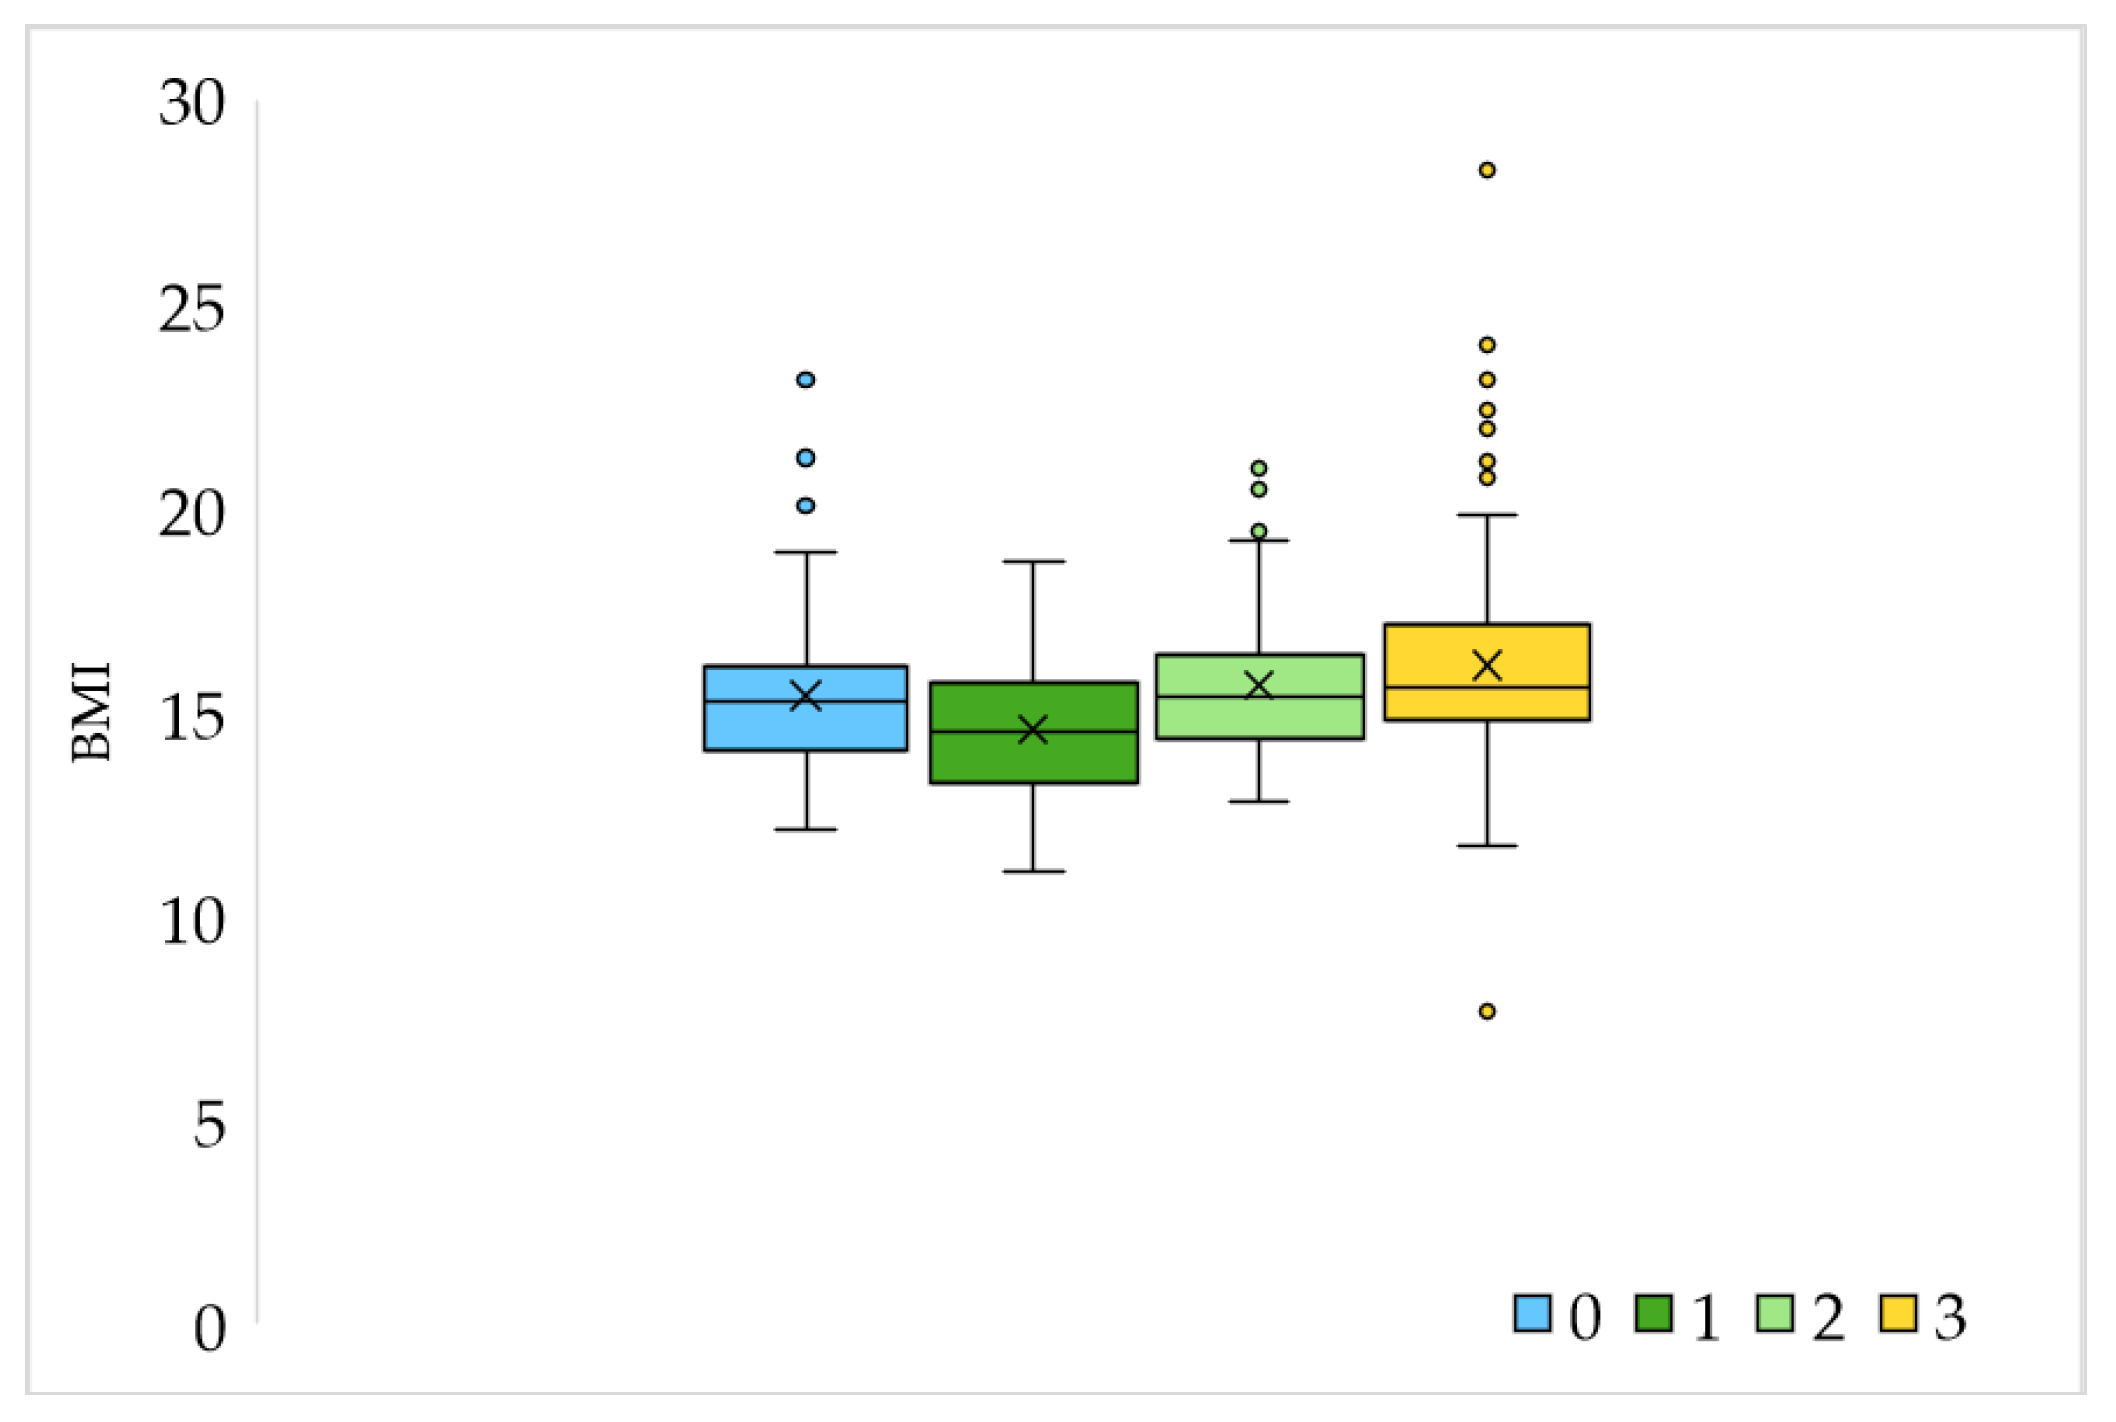
| BMI | Minimum | 11.11 | 7.65 | |
| Maximum | 28.28 | 24.0 | ||
| Average ± S.D. | 15.49 ± 1.99 | 16.4 ± 2.69 | ||
| BMI Parents * | Minimum | 16.61 | 19.15 | |
| Maximum | 36.82 | 36.01 | ||
| Average ± S.D. | 23.13 ± 3.21 | 24.59 ± 4.20 | ||
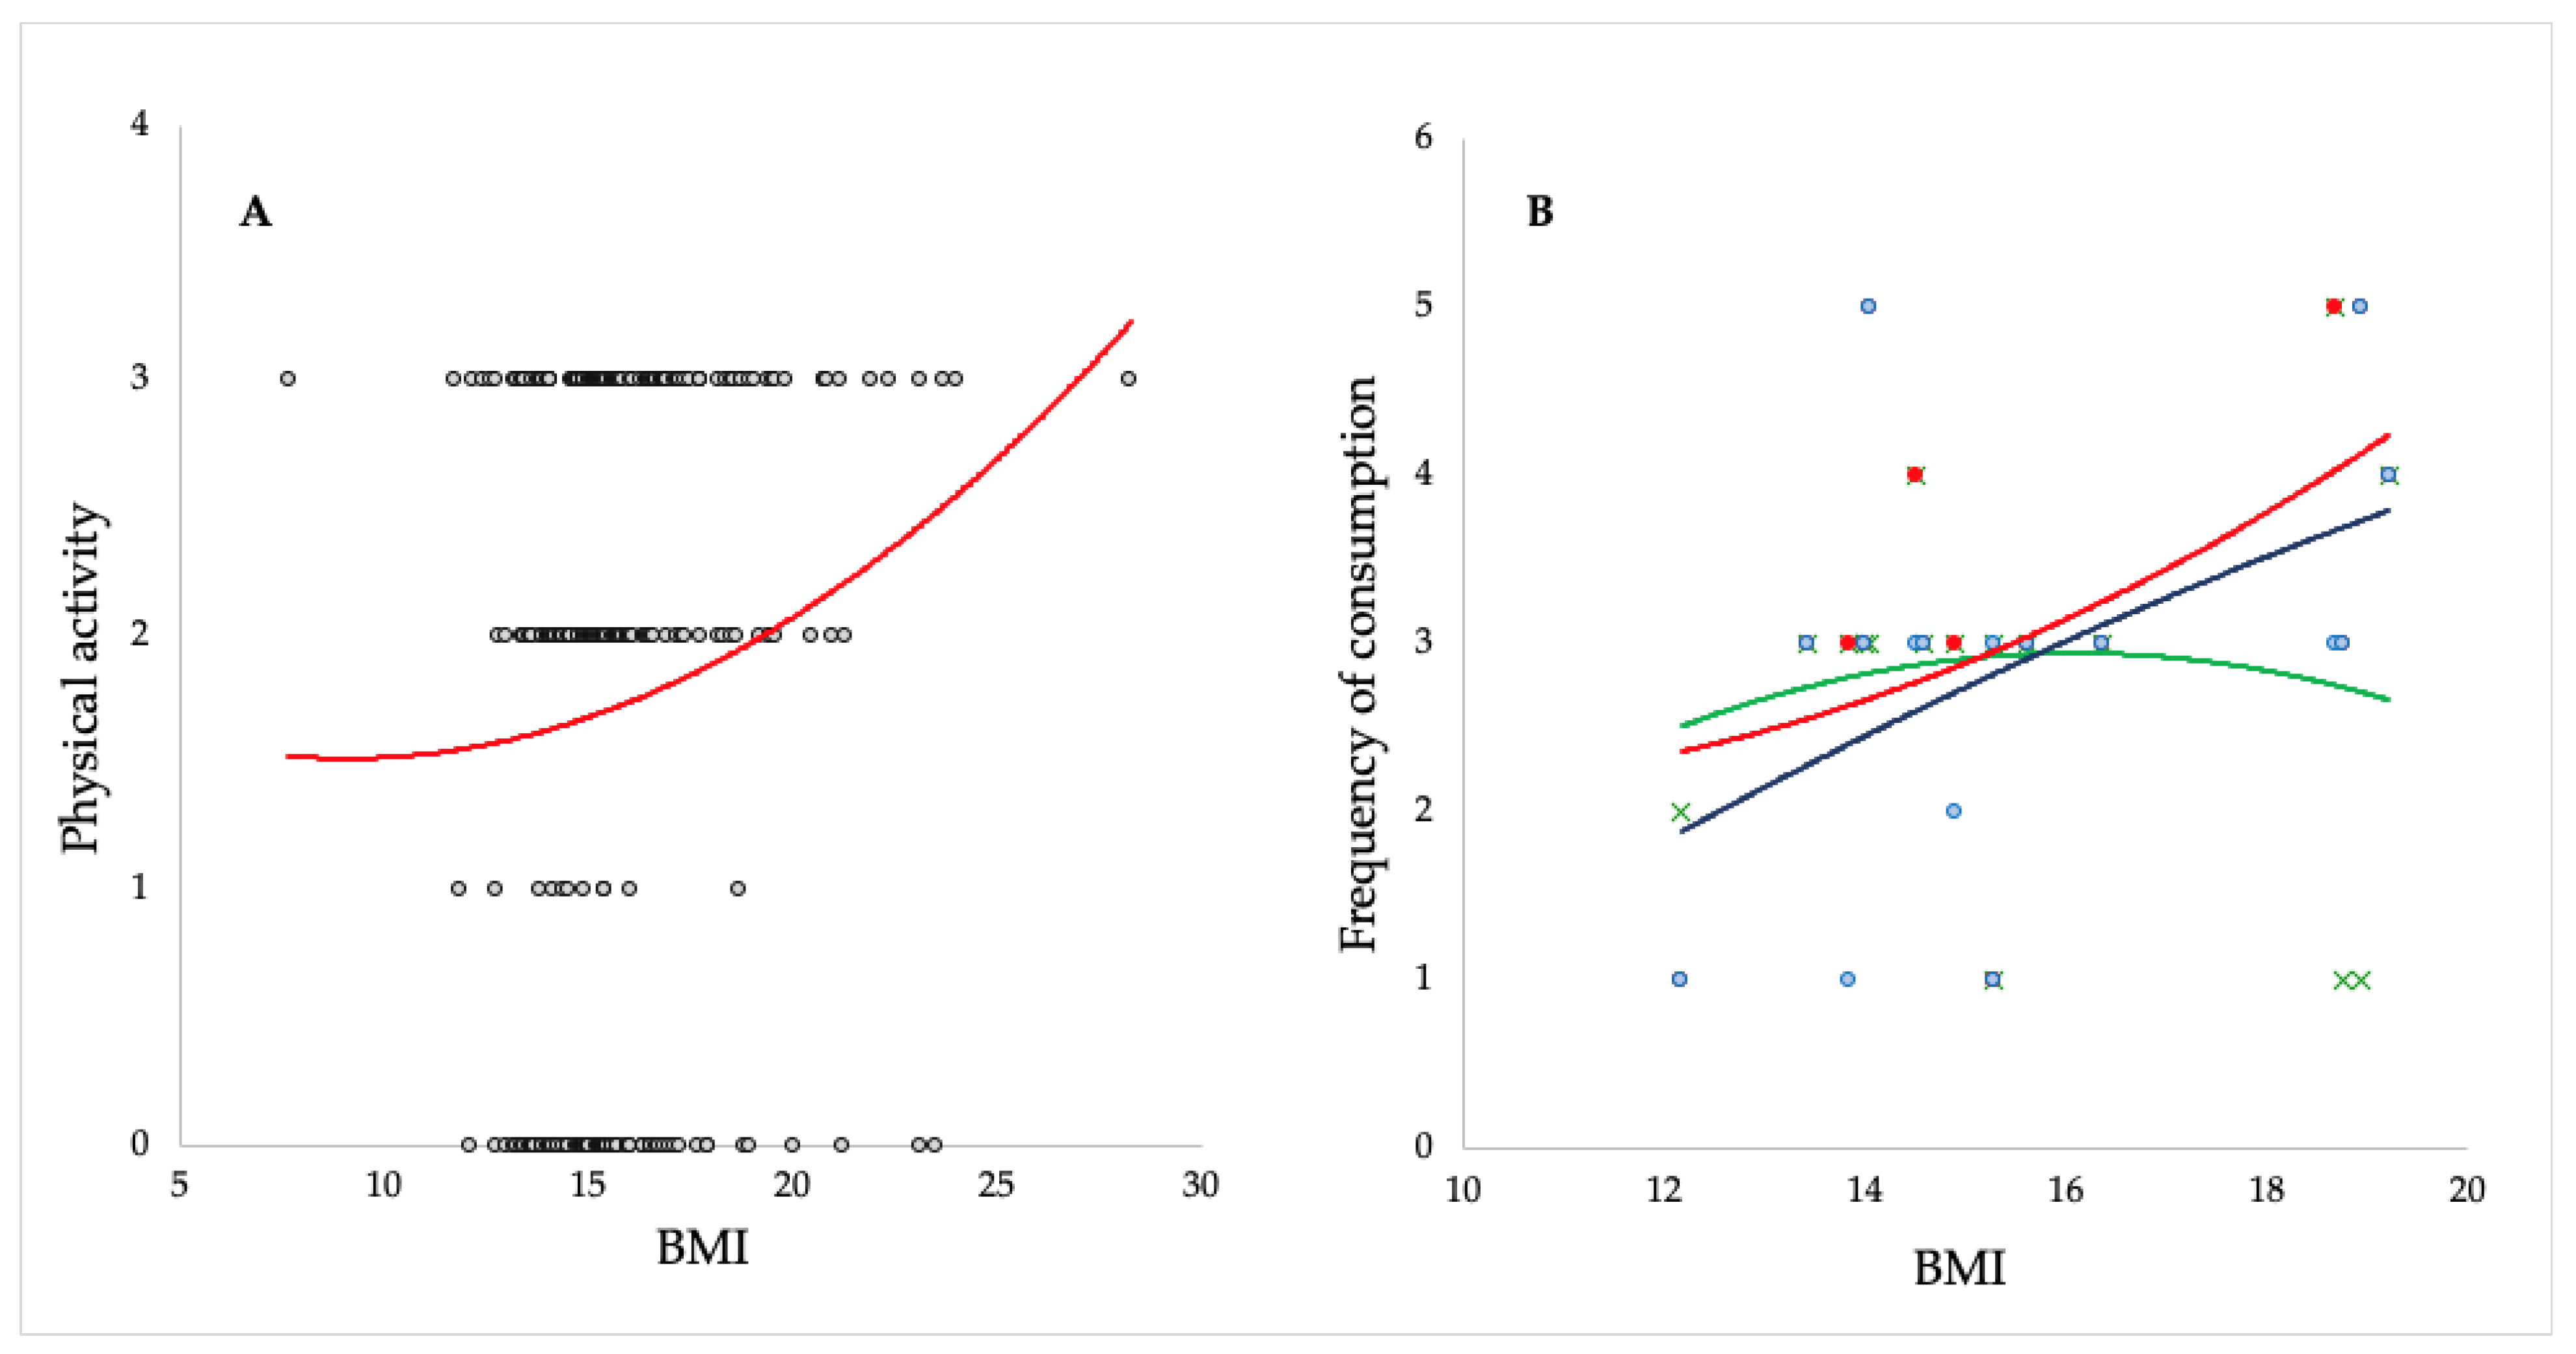
| Sports activities | Not | 100 | 14 | p < 0.05 |
| Yes, 1 time a week | 11 | 2 | ||
| Yes, 2 times a week | 67 | 17 | ||
| Yes, 3 or more times a week | 72 | 40 | ||
| Number of common meals | 0 | 0 | 2 | p = 0.113 |
| 1 | 30 | 10 | ||
| 2 | 108 | 28 | ||
| 3 | 60 | 19 | ||
| More than 3 | 52 | 14 | ||
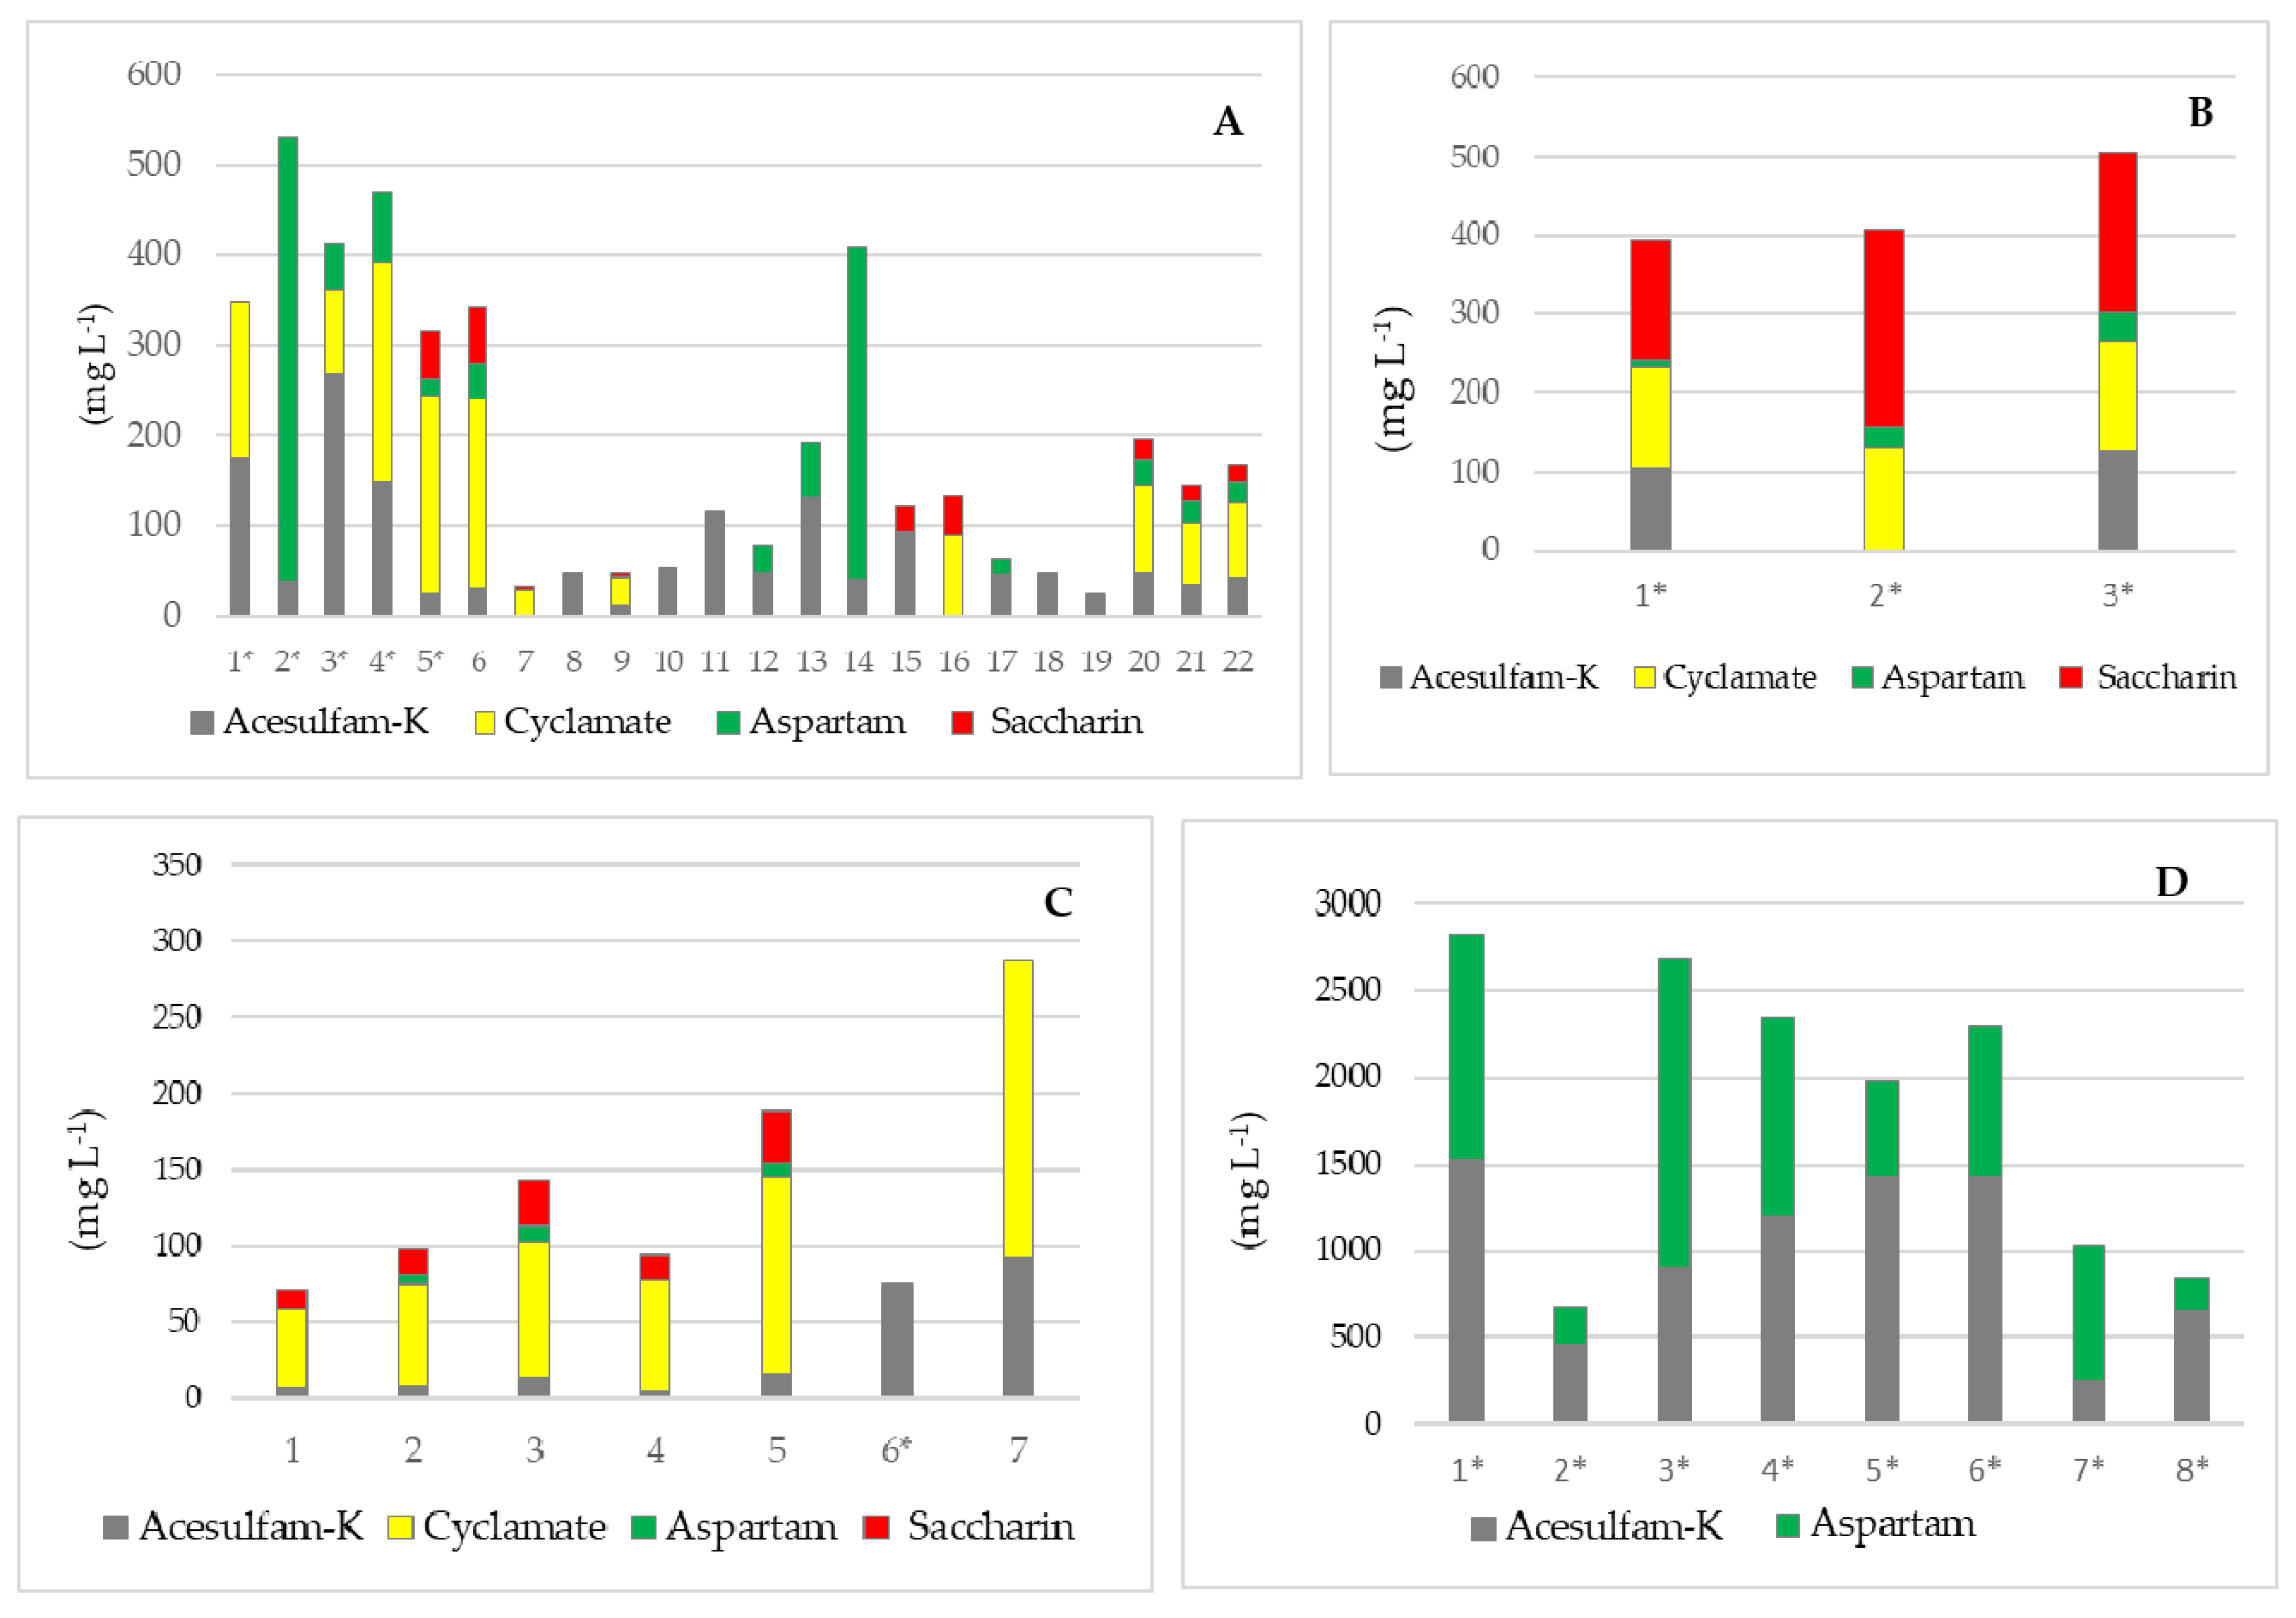
| Sample | Soft Drinks | Juices/Nectars | Syrups | Instant Drinks | Milk Protein Drinks | Chewing Gums | |
|---|---|---|---|---|---|---|---|
| No. of samples | 35 | 33 | 3 | 5 | 2 | 12 | |
| Acesulfame K | Med (mg L−1) | 18.1 | <LOQ | 116.7 | <LOQ | <LOQ | 557.2 |
| Conc. range (mg L−1) | <LOQ–268.7 | <LOQ–92.5 | 106.0–127.4 | <LOQ–172.7 | <LOQ–122.6 | <LOQ–1520.4 | |
| Cyclamate | Med (mg L−1) | <LOQ | <LOQ | 131.3 | <LOQ | <LOQ | <LOQ |
| Conc. range (mg L−1) | <LOQ–241.0 | <LOQ–195.0 | 125.6–138.2 | - | - | - | |
| Aspartame | Med (mg L−1) | <LOQ | <LOQ | 25.2 | <LOQ | <LOQ | 558.3 |
| Conc. range (mg L−1) | <LOQ–493.0 | <LOQ–10.2 | 10.4–37.1 | - | - | <LOQ–1791.5 | |
| Saccharin | Med (mg kg−1) | <LOQ | <LOQ | 202.1 | <LOQ | <LOQ | <LOQ |
| Conc. range (mg kg−1) | <LOQ–63.1 | <LOQ–33.9 | 150.5–250.4 | <LOQ–622.7 | <LOQ | - |
Disclaimer/Publisher’s Note: The statements, opinions and data contained in all publications are solely those of the individual author(s) and contributor(s) and not of MDPI and/or the editor(s). MDPI and/or the editor(s) disclaim responsibility for any injury to people or property resulting from any ideas, methods, instructions or products referred to in the content. |
© 2024 by the authors. Licensee MDPI, Basel, Switzerland. This article is an open access article distributed under the terms and conditions of the Creative Commons Attribution (CC BY) license (https://creativecommons.org/licenses/by/4.0/).
Share and Cite
Jurcevic Zidar, B.; Luetic, S.; Jurcic, K.; Knezovic, Z.; Sutlovic, D. Intake of Artificial Sweeteners through Soft Drinks in the Preschool- and School-Aged Population. Nutrients 2024, 16, 2278. https://doi.org/10.3390/nu16142278
Jurcevic Zidar B, Luetic S, Jurcic K, Knezovic Z, Sutlovic D. Intake of Artificial Sweeteners through Soft Drinks in the Preschool- and School-Aged Population. Nutrients. 2024; 16(14):2278. https://doi.org/10.3390/nu16142278
Chicago/Turabian StyleJurcevic Zidar, Branka, Sanja Luetic, Katarina Jurcic, Zlatka Knezovic, and Davorka Sutlovic. 2024. "Intake of Artificial Sweeteners through Soft Drinks in the Preschool- and School-Aged Population" Nutrients 16, no. 14: 2278. https://doi.org/10.3390/nu16142278