
Post-COVID-19 Changes in Appetite—An Exploratory Study

 ,
,  , ,
, ,  , ,
, ,  , , and
Abstract
1. Introduction
2. Materials and Methods
2.1. Study Design and Study Subjects
2.2. Assessments and Data Collection
2.3. Hunger, Desire to Eat, Fullness Sensation and Eating Behavior Assessment
2.4. fMRI Image Acquisition, Preprocessing and Analysis
2.5. Statistical Analysis
3. Results
3.1. Demographic and Clinical Characteristics
3.2. Eating Behavior and Appetite
3.3. Correlation Analysis of Appetite-Related Data with Resting-State fMRI
4. Discussion
5. Conclusions
Author Contributions
Funding
Institutional Review Board Statement
Informed Consent Statement
Data Availability Statement
Conflicts of Interest
References
- Rothan, H.A.; Byrareddy, S.N. The epidemiology and pathogenesis of coronavirus disease (COVID-19) outbreak. J. Autoimmun. 2020, 109, 102433. [Google Scholar] [CrossRef] [PubMed]
- Tang, Y.; Liu, J.; Zhang, D.; Xu, Z.; Ji, J.; Wen, C. Cytokine Storm in COVID-19: The Current Evidence and Treatment Strategies. Front. Immunol. 2020, 11, 1708. [Google Scholar] [CrossRef] [PubMed]
- Qin, C.; Zhou, L.; Hu, Z.; Zhang, S.; Yang, S.; Tao, Y.; Xie, C.; Ma, K.; Shang, K.; Wang, W.; et al. Dysregulation of Immune Response in Patients with Coronavirus 2019 (COVID-19) in Wuhan, China. Clin. Infect. Dis. 2020, 71, 762–768. [Google Scholar] [CrossRef] [PubMed]
- Chen, G.; Wu, D.; Guo, W.; Cao, Y.; Huang, D.; Wang, H.; Wang, T.; Zhang, X.; Chen, H.; Yu, H.; et al. Clinical and immunological features of severe and moderate coronavirus disease 2019. J. Clin. Investig. 2020, 130, 2620–2629. [Google Scholar] [CrossRef] [PubMed]
- Chaaban, N.; Høier, A.T.Z.B.; Andersen, B.V. A Detailed Characterisation of Appetite, Sensory Perceptional, and Eating-Behavioural Effects of COVID-19: Self-Reports from the Acute and Post-Acute Phase of Disease. Foods 2021, 10, 892. [Google Scholar] [CrossRef]
- Campos, A.; Port, J.D.; Acosta, A. Integrative Hedonic and Homeostatic Food Intake Regulation by the Central Nervous System: Insights from Neuroimaging. Brain Sci. 2022, 12, 431. [Google Scholar] [CrossRef] [PubMed]
- Müller, T.D.; Nogueiras, R.; Andermann, M.L.; Andrews, Z.B.; Anker, S.D.; Argente, J.; Batterham, R.L.; Benoit, S.C.; Bowers, C.Y.; Broglio, F.; et al. Ghrelin. Mol. Metab. 2015, 4, 437–460. [Google Scholar] [CrossRef]
- Mathur, N.; Mehdi, S.F.; Anipindi, M.; Aziz, M.; Khan, S.A.; Kondakindi, H.; Lowell, B.; Wang, P.; Roth, J. Ghrelin as an Anti-Sepsis Peptide: Review. Front. Immunol. 2021, 11, 610363. [Google Scholar] [CrossRef]
- Kuliczkowska-Płaksej, J.; Jawiarczyk-Przybyłowska, A.; Zembska, A.; Kolačkov, K.; Syrycka, J.; Kałużny, M.; Polowczyk-Kawałko, B.; Kubicka, E.; Bolanowski, M. Ghrelin and Leptin Concentrations in Patients after SARS-CoV2 Infection. J. Clin. Med. 2023, 12, 3551. [Google Scholar] [CrossRef]
- Ma, Y.; Zhang, H.; Guo, W.; Yu, L. Potential role of ghrelin in the regulation of inflammation. FASEB J. 2022, 36, e22508. [Google Scholar] [CrossRef]
- Baatar, D.; Patel, K.; Taub, D.D. The effects of ghrelin on inflammation and the immune system. Mol. Cell. Endocrinol. 2011, 340, 44–58. [Google Scholar] [CrossRef] [PubMed]
- Yorulmaz, H.; Ozkok, E.; Ates, G.; Tamer, S. Investigation of the effectiveness of ghrelin treatment in lung tissue of rats with sepsis. Bratisl. Lek. Listy 2017, 118, 585–590. [Google Scholar] [CrossRef] [PubMed]
- Hakami, N.Y.; Alhazmi, W.A.; Taibah, E.O.; Sindi, M.M.; Alotaibi, O.F.; Al-Otaibi, H.M.; Alhadrami, H.A. The Effect of COVID-19 Infection on Human Blood Ghrelin Hormone: A Pilot Study. J. Pharm. Res. Int. 2021, 33, 33–38. [Google Scholar] [CrossRef]
- Bakuradze, T.; Montoya Parra, G.A.; Riedel, A.; Somoza, V.; Lang, R.; Dieminger, N.; Hofmann, T.; Winkler, S.; Hassmann, U.; Marko, D.; et al. Four-week coffee consumption affects energy intake, satiety regulation, body fat, and protects DNAintegrity. Food Res. Int. 2014, 63, 420–427. [Google Scholar] [CrossRef]
- Muñoz, J.S.G.; Cañavate, R.; Hernández, C.M.; Cara-Salmerón, V.; Morante, J.J.H. The association among chronotype, timing of food intake and food preferences depends on body mass status. Eur. J. Clin. Nutr. 2017, 71, 736–742. [Google Scholar] [CrossRef] [PubMed]
- Yeomans, M.R. Alcohol, appetite and energy balance: Is alcohol intake a risk factor for obesity? Physiol. Behav. 2010, 100, 82–89. [Google Scholar] [CrossRef] [PubMed]
- Spitzer, R.L.; Kroenke, K.; Williams, J.B.; Löwe, B. A brief measure for assessing generalized anxiety disorder: The GAD-7. Arch. Intern. Med. 2006, 166, 1092–1097. [Google Scholar] [CrossRef] [PubMed]
- Kroenke, K.; Spitzer, R.L.; Williams, J.B. The PHQ-9: Validity of a brief depression severity measure. J. Gen. Intern. Med. 2001, 16, 606–613. [Google Scholar] [CrossRef]
- Cotiga, A.C.; Zanfirescu, S.A.; Iliescu, D.; Ciumageanu, M.; Gotca, I.; Popa, C.O. Psychometric Characteristics of the Romanian Adaptation of the GAD-7. J. Psychopathol. Behav. Assess. 2023, 45, 691–701. [Google Scholar] [CrossRef]
- Murray, A.L.; Hemady, C.L.; Do, H.; Dunne, M.; Foley, S.; Osafo, J.; Sikander, S.; Madrid, B.; Baban, A.; Taut, D.; et al. Measuring antenatal depressive symptoms across the world: A validation and cross-country invariance analysis of the Patient Health Questionnaire-9 (PHQ-9) in eight diverse low-resource settings. Psychol. Assess. 2022, 34, 993–1007. [Google Scholar] [CrossRef]
- Nechifor, R.E.; Ciobanu, D.; Vonica, C.L.; Popita, C.; Roman, G.; Bala, C.; Mocan, A.; Inceu, G.; Craciun, A.; Rusu, A. Social jetlag and sleep deprivation are associated with altered activity in the reward-related brain areas: An exploratory resting-state fMRI study. Sleep Med. 2020, 72, 12–19. [Google Scholar] [CrossRef] [PubMed]
- Flint, A.; Raben, A.; Blundell, J.E.; Astrup, A. Reproducibility, power and validity of visual analogue scales in assessment of appetite sensations in single test meal studies. Int. J. Obes. Relat. Metab. Disord. 2000, 24, 38–48. [Google Scholar] [CrossRef] [PubMed]
- Roman, G.; Bala, C.; Creteanu, G.; Graur, M.; Morosanu, M.; Popa, A.; Pircalaboiu, L.; Radulian, G.; Timar, R.; Achimas Cadariu, A. Obesity and Health-Related Lifestyle Factors in the General Population in Romania: A Cross Sectional Study. Acta Endocrinol. 2015, 11, 64–72. [Google Scholar] [CrossRef]
- Karlsson, J.; Persson, L.O.; Sjöström, L.; Sullivan, M. Psychometric properties and factor structure of the Three-Factor Eating Questionnaire (TFEQ) in obese men and women. Results from the Swedish Obese Subjects (SOS) study. Int. J. Obes. Relat. Metab. Disord. 2000, 24, 1715–1725. [Google Scholar] [CrossRef] [PubMed]
- Chao-Gan, Y.; Yu-Feng, Z. DPARSF: A MATLAB Toolbox for “Pipeline” Data Analysis of Resting-State fMRI. Front. Syst. Neurosci. 2010, 4, 13. [Google Scholar] [CrossRef] [PubMed]
- Yan, C.G.; Cheung, B.; Kelly, C.; Colcombe, S.; Craddock, R.C.; Di Martino, A.; Li, Q.; Zuo, X.N.; Castellanos, F.X.; Milham, M.P. A comprehensive assessment of regional variation in the impact of head micromovements on functional connectomics. Neuroimage 2013, 76, 183–201. [Google Scholar] [CrossRef] [PubMed]
- Yan, C.G.; Craddock, R.C.; Zuo, X.N.; Zang, Y.F.; Milham, M.P. Standardizing the intrinsic brain: Towards robust measurement of inter-individual variation in 1000 functional connectomes. Neuroimage 2013, 80, 246–262. [Google Scholar] [CrossRef] [PubMed]
- Ashburner, J. A fast diffeomorphic image registration algorithm. Neuroimage 2007, 38, 95–113. [Google Scholar] [CrossRef] [PubMed]
- Jenkinson, M.; Bannister, P.; Brady, M.; Smith, S. Improved optimization for the robust and accurate linear registration and motion correction of brain images. Neuroimage 2002, 17, 825–841. [Google Scholar] [CrossRef]
- Jiang, L.; Zuo, X.N. Regional Homogeneity: A Multimodal, Multiscale Neuroimaging Marker of the Human Connectome. Neuroscientist 2016, 22, 486–505. [Google Scholar] [CrossRef]
- Zuo, X.N.; Ehmke, R.; Mennes, M.; Imperati, D.; Castellanos, F.X.; Sporns, O.; Milham, M.P. Network centrality in the human functional connectome. Cereb. Cortex 2012, 22, 1862–1875. [Google Scholar] [CrossRef]
- Yan, C.G.; Wang, X.D.; Zuo, X.N.; Zang, Y.F. DPABI: Data Processing & Analysis for (Resting-State) Brain Imaging. Neuroinformatics 2016, 14, 339–351. [Google Scholar] [CrossRef]
- Kojima, M.; Hosoda, H.; Date, Y.; Nakazato, M.; Matsuo, H.; Kangawa, K. Ghrelin is a growth-hormone-releasing acylated peptide from stomach. Nature 1999, 402, 656–660. [Google Scholar] [CrossRef]
- Korbonits, M.; Goldstone, A.P.; Gueorguiev, M.; Grossman, A.B. Ghrelin—A hormone with multiple functions. Front. Neuroendocrinol. 2004, 25, 27–68. [Google Scholar] [CrossRef]
- Lee, H.M.; Wang, G.; Englander, E.W.; Kojima, M.; Greeley, G.H., Jr. Ghrelin, a new gastrointestinal endocrine peptide that stimulates insulin secretion: Enteric distribution, ontogeny, influence of endocrine, and dietary manipulations. Endocrinology 2002, 143, 185–190. [Google Scholar] [CrossRef]
- Masuda, Y.; Tanaka, T.; Inomata, N.; Ohnuma, N.; Tanaka, S.; Itoh, Z.; Hosoda, H.; Kojima, M.; Kangawa, K. Ghrelin stimulates gastric acid secretion and motility in rats. Biochem. Biophys. Res. Commun. 2000, 276, 905–908. [Google Scholar] [CrossRef]
- Nagaya, N.; Kojima, M.; Uematsu, M.; Yamagishi, M.; Hosoda, H.; Oya, H.; Hayashi, Y.; Kangawa, K. Hemodynamic and hormonal effects of human ghrelin in healthy volunteers. Am. J. Physiol. Regul. Integr. Comp. Physiol. 2001, 280, R1483–R1487. [Google Scholar] [CrossRef]
- Seminara, R.S.; Jeet, C.; Biswas, S.; Kanwal, B.; Iftikhar, W.; Sakibuzzaman, M.; Rutkofsky, I.H. The Neurocognitive Effects of Ghrelin-induced Signaling on the Hippocampus: A Promising Approach to Alzheimer’s Disease. Cureus 2018, 10, e3285. [Google Scholar] [CrossRef]
- Dixit, V.D.; Schaffer, E.M.; Pyle, R.S.; Collins, G.D.; Sakthivel, S.K.; Palaniappan, R.; Lillard, J.W.; Taub, D.D. Ghrelin inhibits leptin- and activation-induced proinflammatory cytokine expression by human monocytes and T cells. J. Clin. Investig. 2004, 114, 57–66. [Google Scholar] [CrossRef]
- Sato, T.; Nakamura, Y.; Shiimura, Y.; Ohgusu, H.; Kangawa, K.; Kojima, M. Structure, regulation and function of ghrelin. J. Biochem. 2012, 151, 119–128. [Google Scholar] [CrossRef]
- Tanaka, M.; Yamada, S.; Watanabe, Y. The Role of Neuropeptide Y in the Nucleus Accumbens. Int. J. Mol. Sci. 2021, 22, 7287. [Google Scholar] [CrossRef]
- Yi, M.; Li, H.; Wu, Z.; Yan, J.; Liu, Q.; Ou, C.; Chen, M. A Promising Therapeutic Target for Metabolic Diseases: Neuropeptide Y Receptors in Humans. Cell. Physiol. Biochem. 2018, 45, 88–107. [Google Scholar] [CrossRef]
- Beck, B. Neuropeptide Y in normal eating and in genetic and dietary-induced obesity. Philos. Trans. R. Soc. Lond. B Biol. Sci. 2006, 361, 1159–1185. [Google Scholar] [CrossRef]
- Kalra, S.P.; Kalra, P.S. Neuropeptide Y. A Physiological Orexigen Modulated by the Feedback Action of Ghrelin and Leptin. Endocrine 2003, 22, 49–56. [Google Scholar] [CrossRef]
- van Meer, F.; van der Laan, L.N.; Adan, R.A.; Viergever, M.A.; Smeets, P.A. What you see is what you eat: An ALE meta-analysis of the neural correlates of food viewing in children and adolescents. Neuroimage 2015, 104, 35–43. [Google Scholar] [CrossRef]
- Little, T.J.; McKie, S.; Jones, R.B.; D’Amato, M.; Smith, C.; Kiss, O.; Thompson, D.G.; McLaughlin, J.T. Mapping glucose-mediated gut-to-brain signalling pathways in humans. Neuroimage 2014, 96, 1–11. [Google Scholar] [CrossRef]
- Stopyra, M.A.; Friederich, H.C.; Lavandier, N.; Mönning, E.; Bendszus, M.; Herzog, W.; Simon, J.J. Homeostasis and food craving in obesity: A functional MRI study. Int. J. Obes. 2021, 45, 2464–2470. [Google Scholar] [CrossRef]

| COVID-19 N = 28 | Non-COVID-19 N = 27 | p-Value | |
|---|---|---|---|
| Women, n (%) | 18 (64.3%) | 19 (70.4%) | 0.631 |
| Men, n (%) | 10 (35.7%) | 8 (29.6%) | |
| Age, years | 28.0 (26.0; 29.0) | 29.0 (27.0; 34.5) | 0.140 |
| University education, n (%) | 25 (92.6%) | 27 (100.0%) | 0.150 |
| Hypertension, n (%) | 1 (3.6%) | 0 | - |
| Never smokers, n (%) | 21 (75.0%) | 21 (18.577.8%) | 0.579 |
| Alcohol portions/week | 0.3 (0.0; 1.5) | 0.0 (0.0; 2.0) | - |
| BMI, kg/m2 | 18.4 (16.9; 21.6) | 18.1 (16.2; 20.3) | 0.391 |
| Waist circumference, cm | 72.5 (70.0; 90.5) | 76.0 (70.0; 82.0) | 0.980 |
| SBP, mmHg | 119.5 (101.3; 129.0) | 111.0 (100.0; 123.0) | 0.192 |
| DBP, mmHg | 72.5 (68.0; 82.0) | 72.0 (66.5; 79.5) | 0.866 |
| Fasting glycemia, mg/dL | 77.0 (72.0; 82.5) | 82.5 (78.0; 86.0) | 0.037 |
| AST, UI/L | 20.5 (18.0; 26.0) | 19.5 (17.0; 23.5) | 0.627 |
| ALT, UI/L | 19.5 (13.0; 31.3) | 13.5 (10.8; 21.5) | 0.044 |
| Creatinine, mg/dL | 0.8 (0.7; 0.9) | 0.7 (0.6; 0.8) | 0.143 |
| Total time spent being sedentary/day, hours | 8.3 (5.5; 10.0) | 6.0 (4.3; 8.0) | 0.035 |
| GAD score | 2.0 (1.0; 4.0) | 3.0 (1.5; 4.0) | 0.798 |
| PHQ-9 score | 3.0 (1.0; 4.0) | 2.0 (2.0; 6.0) | 0.458 |
| Time since the last COVID-19 episode, months | 13.0 (11.0; 15.0) | - | - |
| COVID-19 N = 28 | Non-COVID-19 N = 27 | p-Value | |
|---|---|---|---|
| Eating 3 meals/day, n (%) | 0.882 | ||
| Daily | 10 (35.7%) | 8 (29.6%) | |
| Most of the days | 10 (35.7%) | 11 (40.7%) | |
| Having breakfast daily | 14 (51.9%) | 16 (59.3%) | 0.584 |
| Main meal of the day, n (%) | 0.105 | ||
| Breakfast | 1 (3.6%) | 6 (22.2%) | |
| Lunch | 19 (67.9%) | 16 (59.3%) | |
| Dinner | 8 (28.6%) | 5 (18.5%) | |
| Eating during night, n (%) | 1 (3.6%) | 0 | - |
| Eating dinner after 21:00 daily or most of the times, n (%) | 4 (14.8%) | 4 (14.8%) | - |
| Eating while watching TV, n (%) | 19 (67.9%) | 15 (55.6%) | 0.348 |
| COVID-19 N = 28 | Non-COVID-19 N = 27 | p-Value | |
|---|---|---|---|
| Hunger sensation | 4.0 (2.0; 5.0) | 5.0 (2.0; 7.5) | 0.206 |
| Fullness sensation | 5.0 (3.0; 5.5) | 5.0 (3.0; 5.5) | 0.769 |
| Desire to eat | 1.0 (0.5; 3.0) | 2.0 (1.0; 3.0) | 0.477 |
| Cognitive restraint | 12.5 (9.5; 16.0) | 12.0 (9.5; 13.0) | 0.374 |
| Uncontrolled eating | 18.0 (15.5; 21.0) | 16.0 (14.5; 19.0) | 0.118 |
| Emotional eating | 6.0 (5.0; 7.0) | 5.0 (3.0; 6.5) | 0.102 |
| Ghrelin, pg/mL | 197.5 (121.3; 274.9) | 67.1 (55.9; 80.4) | <0.001 |
| NPY, pg/mL | 128.0 (106.7; 164.6) | 84.5 (67.9; 134.0) | 0.005 |
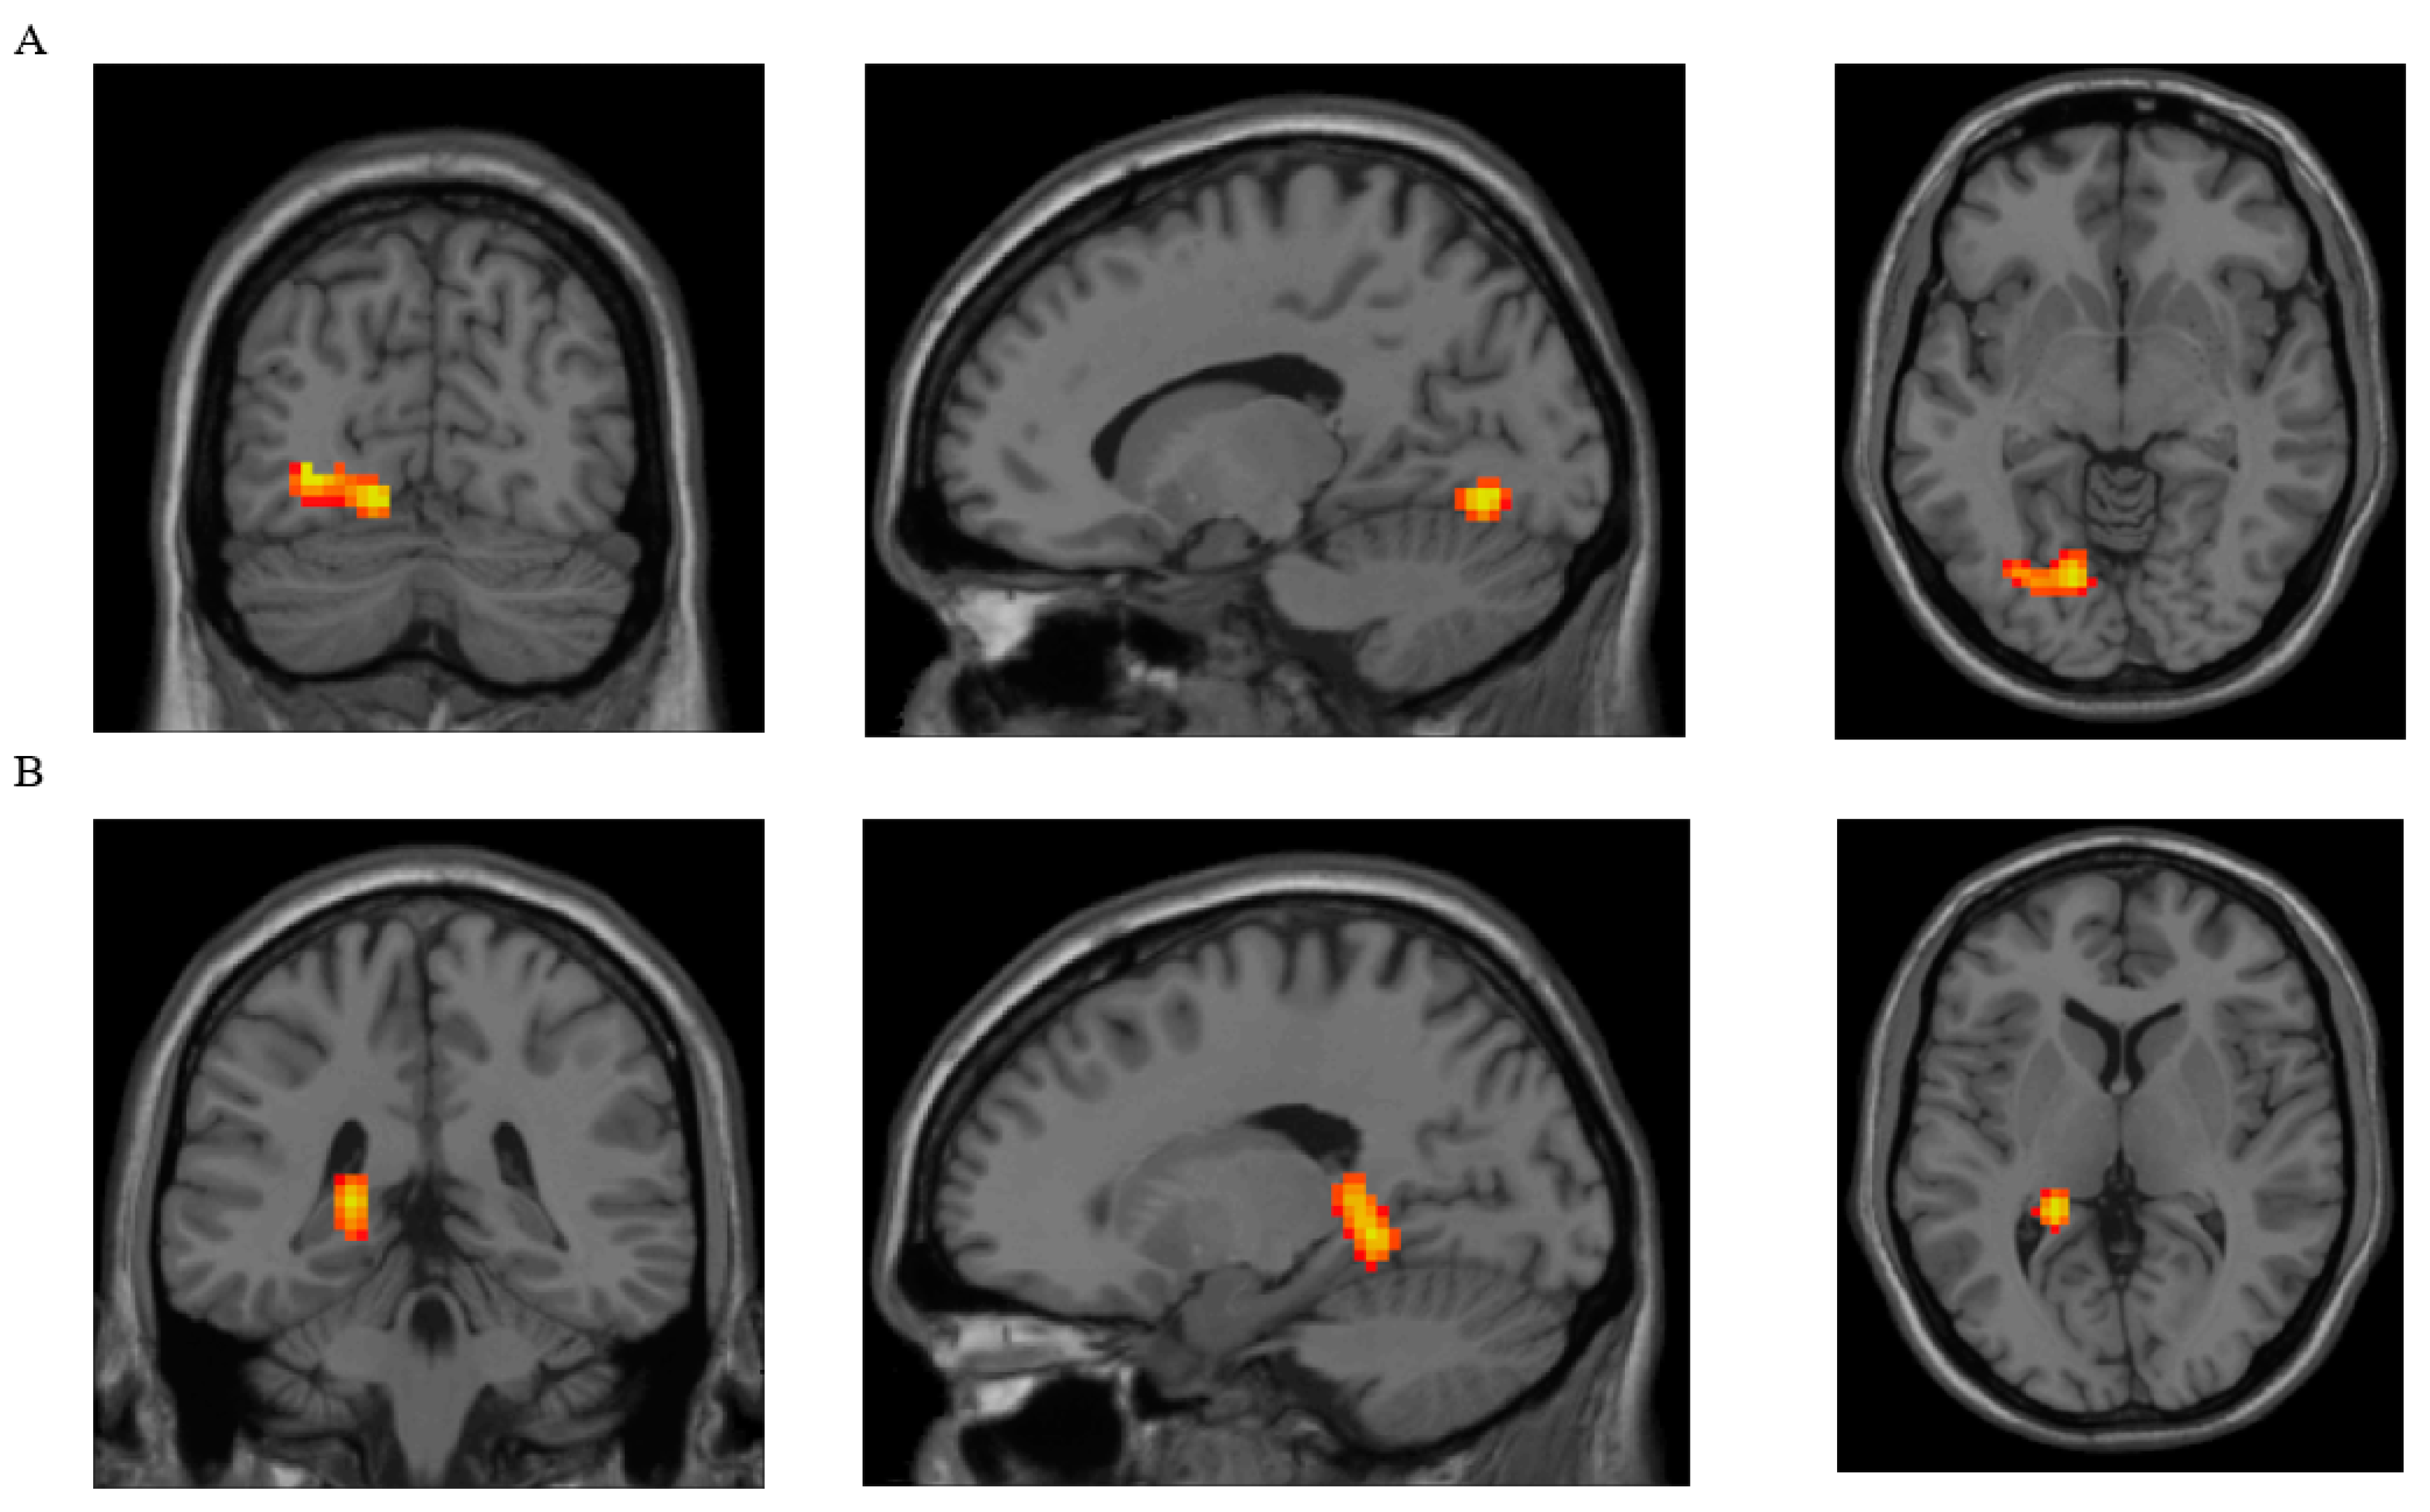
| Parameter | Brain Region with Clusters That Showed Significant Differences between Groups | Brodmann Area | Peak MNI Coordinates of the Cluster | Cluster Size (Voxels) | ||
|---|---|---|---|---|---|---|
| x | y | z | ||||
| DC | Lingual, L | 18 L | −15 | −72 | −6 | 102 |
| ReHo | Lingual, L | 37 L | −21 | −42 | −6 | 163 |
Disclaimer/Publisher’s Note: The statements, opinions and data contained in all publications are solely those of the individual author(s) and contributor(s) and not of MDPI and/or the editor(s). MDPI and/or the editor(s) disclaim responsibility for any injury to people or property resulting from any ideas, methods, instructions or products referred to in the content. |
© 2024 by the authors. Licensee MDPI, Basel, Switzerland. This article is an open access article distributed under the terms and conditions of the Creative Commons Attribution (CC BY) license (https://creativecommons.org/licenses/by/4.0/).
Share and Cite
Inceu, G.; Nechifor, R.E.; Rusu, A.; Ciobanu, D.M.; Draghici, N.C.; Pop, R.M.; Craciun, A.E.; Porojan, M.; Negrut, M.; Roman, G.; et al. Post-COVID-19 Changes in Appetite—An Exploratory Study. Nutrients 2024, 16, 2349. https://doi.org/10.3390/nu16142349
Inceu G, Nechifor RE, Rusu A, Ciobanu DM, Draghici NC, Pop RM, Craciun AE, Porojan M, Negrut M, Roman G, et al. Post-COVID-19 Changes in Appetite—An Exploratory Study. Nutrients. 2024; 16(14):2349. https://doi.org/10.3390/nu16142349
Chicago/Turabian StyleInceu, Georgeta, Ruben Emanuel Nechifor, Adriana Rusu, Dana Mihaela Ciobanu, Nicu Catalin Draghici, Raluca Maria Pop, Anca Elena Craciun, Mihai Porojan, Matei Negrut, Gabriela Roman, and et al. 2024. "Post-COVID-19 Changes in Appetite—An Exploratory Study" Nutrients 16, no. 14: 2349. https://doi.org/10.3390/nu16142349
APA StyleInceu, G., Nechifor, R. E., Rusu, A., Ciobanu, D. M., Draghici, N. C., Pop, R. M., Craciun, A. E., Porojan, M., Negrut, M., Roman, G., Fodor, A., & Bala, C. (2024). Post-COVID-19 Changes in Appetite—An Exploratory Study. Nutrients, 16(14), 2349. https://doi.org/10.3390/nu16142349