
Influence of Long-Term Soccer Training on the Fatty Acid Profile of the Platelet Membrane and Intra-Platelet Antioxidant Vitamins

 , , and
Abstract
:1. Introduction
2. Materials and Methods
2.1. Participants
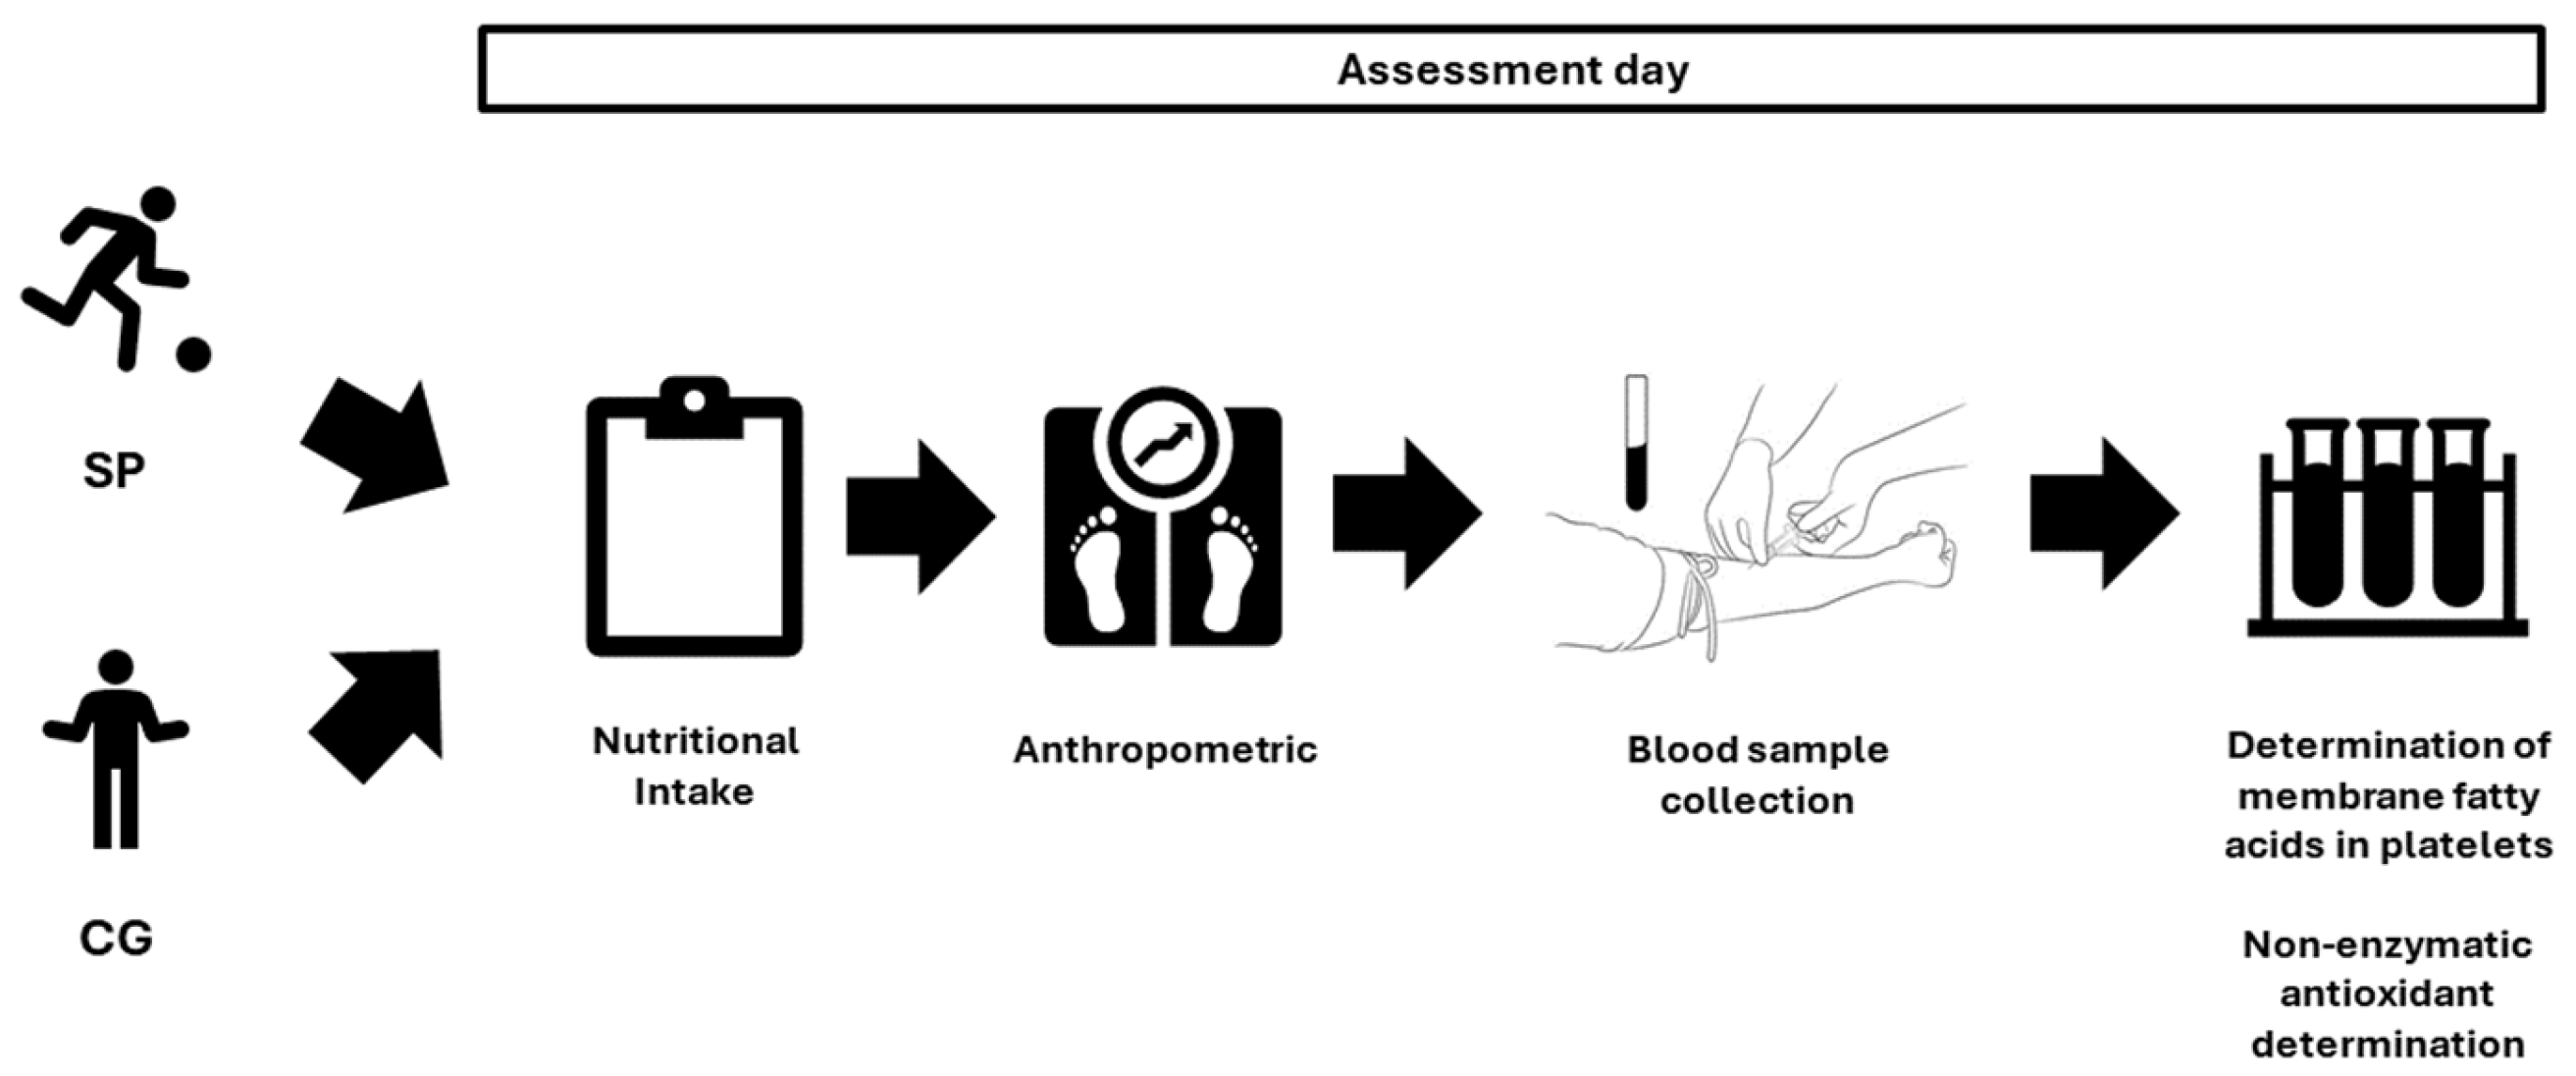
2.2. Study Design
2.3. Nutritional Intake
2.4. Anthropometric
2.5. Determination of Membrane Fatty Acids in Platelets
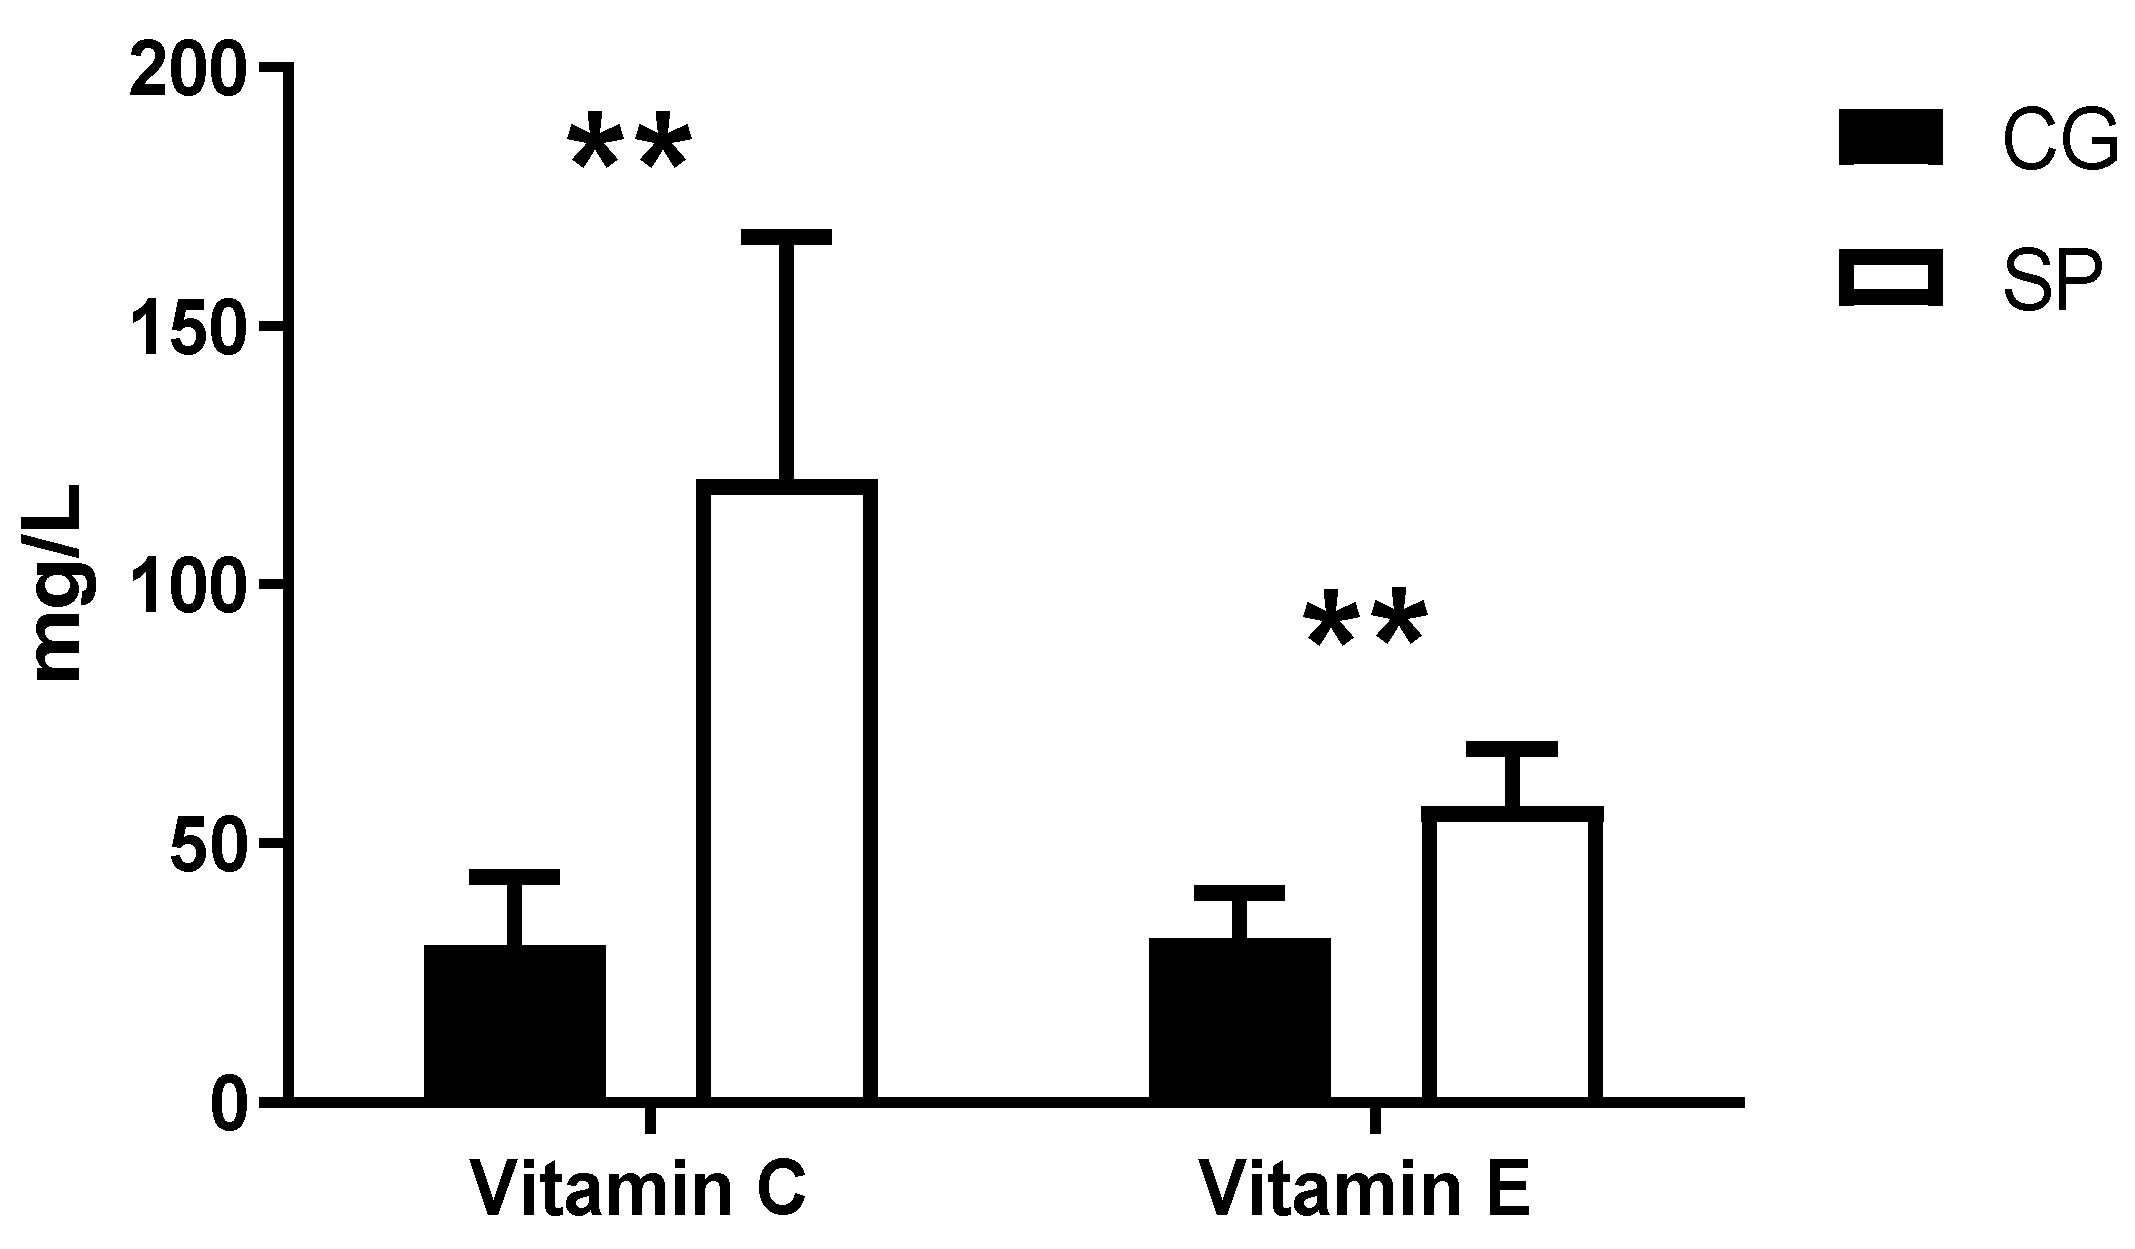
2.6. Non-Enzymatic Antioxidant Determination
2.7. Statistical Analysis
3. Results
4. Discussion
5. Conclusions
Author Contributions
Funding
Institutional Review Board Statement
Informed Consent Statement
Data Availability Statement
Conflicts of Interest
References
- De Carvalho, C.C.C.R.; Caramujo, M.J. The various roles of fatty acids. Molecules 2018, 23, 2583. [Google Scholar] [CrossRef]
- Alberts, B.; Johnson, A.; Lewis, J.; Raff, M.; Roberts, K.; Walter, P. The lipid bilayer. In Molecular Biology of the Cell, 4th ed.; Garland Science: New York, NY, USA, 2002. [Google Scholar]
- Catalá, A. Lipid peroxidation of membrane phospholipids generates hydroxy-alkenals and oxidized phospholipids active in physiological and/or pathological conditions. Chem. Phys. Lipids 2009, 157, 1–11. [Google Scholar] [CrossRef]
- Sies, H.; Cadenas, E. Oxidative stress: Damage to intact cells and organs. Philos. Trans. R. Soc. Lond. B Biol. Sci. 1985, 311, 617–631. [Google Scholar]
- Lamprecht, M. Antioxidants in Sport Nutrition; CRC Press/Taylor & Francis: Boca Raton, FL, USA, 2014; ISBN 978-1-4665-67597-3. [Google Scholar]
- Jerlich, A.; Pitt, A.R.; Schaur, R.J.; Spickett, C.M. Pathways of phospholipid oxidation by HOCl in human LDL detected by LC-MS. Free Radic. Biol. Med. 2000, 28, 673–682. [Google Scholar] [CrossRef] [PubMed]
- Yoshida, Y.; Umeno, A.; Shichiri, M. Lipid peroxidation biomarkers for evaluating oxidative stress and assessing antioxidant capacity in vivo. J. Clin. Biochem. Nutr. 2012, 52, 9–16. [Google Scholar] [CrossRef] [PubMed]
- Buettner, G.R. The pecking order of free radicals and antioxidants: Lipid peroxidation, α-tocopherol, and ascorbate. Arch. Biochem. Biophys. 1993, 300, 535–543. [Google Scholar] [CrossRef] [PubMed]
- Nigam, S.; Schewe, T. Phospholipase A2s and lipid peroxidation. Biochim. Biophys. Acta (BBA)-Mol. Cell Biol. Lipids 2000, 1488, 167–181. [Google Scholar] [CrossRef]
- Gomez-Cabrera, M.-C.; Domenech, E.; Viña, J. Moderate exercise is an antioxidant: Upregulation of antioxidant genes by training. Free Radic. Biol. Med. 2008, 44, 126–131. [Google Scholar] [CrossRef]
- Clarkson, P.M.; Thompson, H.S. Antioxidants: What role do they play in physical activity and health? Am. J. Clin. Nutr. 2000, 72, 637S–646S. [Google Scholar] [CrossRef]
- Valko, M.; Rhodes, C.; Moncol, J.; Izakovic, M.M.; Mazur, M. Free radicals, metals and antioxidants in oxidative stress-induced cancer. Chem. Biol. Interact. 2006, 160, 1–40. [Google Scholar] [CrossRef]
- Sacheck, J.M.; Milbury, P.E.; Cannon, J.G.; Roubenoff, R.; Blumberg, J.B. Effect of vitamin E and eccentric exercise on selected biomarkers of oxidative stress in young and elderly men. Free Radic. Biol. Med. 2003, 34, 1575–1588. [Google Scholar] [CrossRef]
- Mena, P.; Maynar, M.; Gutierrez, J.M.; Maynar, J.; Timon, J.; Campillo, J.E. Erythrocyte free radical scavenger enzymes in bicycle professional racers. Adaptation to training. Int. J. Sports Med. 1991, 12, 563–566. [Google Scholar] [CrossRef] [PubMed]
- Bouzid, M.A.; Filaire, E.; Matran, R.; Robin, S.; Fabre, C. Lifelong voluntary exercise modulates age-related changes in oxidative stress. Int. J. Sports Med. 2018, 40, 21–28. [Google Scholar] [CrossRef] [PubMed]
- Yavari, A.; Javadi, M.; Mirmiran, P.; Bahadoran, Z. Exercise-induced oxidative stress and dietary antioxidants. Asian J. Sports Med. 2015, 6, e24898. [Google Scholar] [CrossRef] [PubMed]
- Arsić, A.; Vučić, V.; Tepšić, J.; Mazić, S.; Djelić, M.; Glibetić, M. Altered plasma and erythrocyte phospholipid fatty acid profile in elite female water polo and football players. Appl. Physiol. Nutr. Metab. 2011, 37, 40–47. [Google Scholar] [CrossRef] [PubMed]
- Tepsic, J.; Vucic, V.; Arsic, A.; Blazencic-Mladenovic, V.; Mazic, S.; Glibetic, M. Plasma and erythrocyte phospholipid fatty acid profile in professional basketball and football players. Eur. J. Appl. Physiol. 2009, 107, 359–365. [Google Scholar] [CrossRef] [PubMed]
- Raclot, T.; Langin, D.; Lafontan, M.; Groscolas, R. Selective release of human adipocyte fatty acids according to molecular structure. Biochem. J. 1997, 324, 911–915. [Google Scholar] [CrossRef] [PubMed]
- Abbott, S.K.; Else, P.L.; Atkins, T.A.; Hulbert, A.J. Fatty acid composition of membrane bilayers: Importance of diet polyunsaturated fat balance. Biochim. Biophys. Acta (BBA)-Biomembr. 2012, 1818, 1309–1317. [Google Scholar] [CrossRef]
- Bentley, D.J.; Ackerman, J.; Clifford, T.; Slattery, K.S. Acute and chronic effects of antioxidant supplementation on exercise performance. In Antioxidants in Sport Nutrition; Lamprecht, M., Ed.; CRC Press/Taylor & Francis: Boca Raton, FL, USA, 2015; Volume 125. [Google Scholar]
- Tomaiuolo, M.; Brass, L.F.; Stalker, T.J. Regulation of platelet activation and coagulation and its role in vascular injury and arterial thrombosis. Interv. Cardiol. Clin. 2017, 6, 1. [Google Scholar] [CrossRef]
- Dayton, S.; Hashimoto, S.; Dixon, W.; Pearce, M.L. Composition of lipids in human serum and adipose tissue during prolonged feeding of a diet high in unsaturated fat. J. Lipid Res. 1966, 7, 103–111. [Google Scholar] [CrossRef]
- Arab, L. Biomarkers of fat and fatty acid intake. J. Nutr. 2003, 133, 925S–932S. [Google Scholar] [CrossRef] [PubMed]
- Harker, L.A. The kinetics of platelet production and destruction in man. Clin. Haematol. 1977, 6, 671–693. [Google Scholar] [CrossRef] [PubMed]
- Bikulčienė, I.; Golubevaitė, O.; Žėkas, V.; Radzevičius, M.; Karčiauskaitė, D.; Matuzevičienė, R.; Hendrixson, V.; Mažeikienė, A.; Burokienė, N.; Kaminskas, A. Association of platelet membrane fatty acid composition with markers of oxidative stress in healthy men. Med. Sci. Monit. Int. Med. J. Exp. Clin. Res. 2019, 25, 6405. [Google Scholar] [CrossRef] [PubMed]
- Bikulčienė, I.; Garjonytė, N.; Žėkas, V.; Matuzevičienė, R.; Žymantienė, Ž.; Baublytė, A.; Hendrixson, V.; Karčiauskaitė, D.; Utkus, A.; Kaminskas, A. Relationship Between Composition of Fatty Acid in Platelet Phospholipid Membrane and Markers of Oxidative Stress in Healthy Men and Men After a Myocardial Infarction. Med. Sci. Monit. Basic Res. 2021, 27, e929634-1. [Google Scholar] [CrossRef] [PubMed]
- de Castro, J.; Hernández-Hernández, A.; Rodríguez, M.C.; Llanillo, M.; Sánchez-Yagüe, J. Comparison of changes in erythrocyte and platelet fatty acid composition and protein oxidation in advanced non-small cell lung cancer. Cancer Investig. 2006, 24, 339–345. [Google Scholar] [CrossRef] [PubMed]
- Hagströmer, M.; Oja, P.; Sjöström, M. The International Physical Activity Questionnaire (IPAQ): A study of concurrent and construct validity. Public Health Nutr. 2006, 9, 755–762. [Google Scholar] [CrossRef] [PubMed]
- Moreiras, O.; Carbajal, A.; Cabrera, L.; Cuadrado, C. Tabla de Composición de Alimentos, 16th ed.; Editorial Pirámide: Madrid, Spain, 2013. [Google Scholar]
- Porta, J.; Galiano, D.; Tejedo, A.; González, J.M. Valoración de la composición corporal. Utopías y realidades. In Manual de Cineantropometría; Esparza Ros, F., Ed.; Grupo Español de Cineantropometría: Madrid, Spain, 1993; pp. 113–170. [Google Scholar]
- Muñoz, D.; Barrientos, G.; Alves, J.; Grijota, F.; Robles, M.; Maynar, M. Oxidative stress, lipid peroxidation indexes and antioxidant vitamins in long and middle distance athletes during a sport season. J. Sports Med. Phys. Fitness 2018, 58, 1713–1719. [Google Scholar]
- Iglesias, P.J.; Muñoz, D.; Llerena, F.; Grijota, F.J.; Bartolome, I.; Maynar, M. Long-Term Adaptations to Aerobic-Anaerobic Physical Training in the Erythrocyte Membrane Fatty Acids Profile. Int. J. Sport. Exerc. Med. 2017, 3, 63. [Google Scholar] [CrossRef]
- Lepage, G.; Roy, C.C. Direct transesterification of all classes of lipids in a one-step reaction. J. Lipid Res. 1986, 27, 114–120. [Google Scholar] [CrossRef]
- Halliwell, B.; Gutteridge, J.M.C. Free Radicals in Biology and Medicine; Oxford University Press: Cary, NC, USA, 1985; ISBN 0198717482. [Google Scholar]
- Dise, C.A.; Goodman, D.B.; Rasmussen, H. Definition of the pathway for membrane phospholipid fatty acid turnover in human erythrocytes. J. Lipid Res. 1980, 21, 292–300. [Google Scholar] [CrossRef]
- Manoharan, M.; Schwille, P.O. Measurement of ascorbic acid in human plasma and urine by high-performance liquid chromatography results in healthy subjects and patients with idiopathic calcium urolithiasis. J. Chromatogr. B Biomed. Sci. Appl. 1994, 654, 134–139. [Google Scholar] [CrossRef] [PubMed]
- Lim, C.K. HPLC of Small Molecules: A Practical Approach; IRL Press: Oxford, WA, USA, 1986; ISBN 0947946772. [Google Scholar]
- Pallant, J. SPSS Survival Manual: A Step by Step Guide to Data Analysis Using IBM SPSS, 7th ed.; Pallant, J., Ed.; Routledge: London, UK, 2020; ISBN 1003117457. [Google Scholar]
- Peña, N.; Amézaga, J.; Marrugat, G.; Landaluce, A.; Viar, T.; Arce, J.; Larruskain, J.; Lekue, J.; Ferreri, C.; Ordovás, J.M. Competitive season effects on polyunsaturated fatty acid content in erythrocyte membranes of female football players. J. Int. Soc. Sports Nutr. 2023, 20, 2245386. [Google Scholar] [CrossRef] [PubMed]
- Tepsic, J.; Vucic, V.; Arsic, A.; Mazic, S.; Djelic, M.; Glibetic, M. Unfavourable plasma and erythrocyte phospholipid fatty acid profile in elite amateur boxers. Eur. J. Sport Sci. 2013, 13, 414–421. [Google Scholar] [CrossRef] [PubMed]
- Alves Vas, F.J.; Grijota Pérez, F.J.; Toro-Román, V.; Sánchez, I.B.; Maynar Mariño, M.; Barrientos Vicho, G. Changes in the Fatty Acid Profile in Erythrocytes in High-Level Endurance Runners during a Sports Season. Nutrients 2024, 16, 1895. [Google Scholar] [CrossRef] [PubMed]
- Alves-Vas, F.J.; Toro-Román, V.; Sánchez, I.B.; Pérez, F.J.G.; Maynar-Mariño, M.; Vicho, G.B. Erythrocyte Phospholipid Fatty Acid Profile in High-Level Endurance Runners. Appl. Sci. 2024, 14, 3965. [Google Scholar] [CrossRef]
- Drenowatz, C.; Hand, G.A.; Sagner, M.; Shook, R.P.; Burgess, S.; Blair, S.N. The prospective association between different types of exercise and body composition. Med. Sci. Sports Exerc. 2015, 47, 2535. [Google Scholar] [CrossRef] [PubMed]
- Eun-Ju, C.; Wi-Young, S.; Jeong, T. Effects of the crossfit exercise data analysis on body composition and blood profiles. Iran. J. Public Health 2017, 46, 1193–1203. [Google Scholar]
- Costill, D.L.; Kenney, W.L.; Wilmore, J. Physiology of Sport and Exercise; Human Kinetics: Champaign, IL, USA, 2008; Volume 448. [Google Scholar]
- Martin, W.H. Effects of acute and chronic exercise on fat metabolism. Exerc. Sport Sci. Rev. 1996, 24, 203–232. [Google Scholar] [CrossRef] [PubMed]
- Helge, J.W.; Wu, B.J.; Willer, M.; Daugaard, J.R.; Storlien, L.H.; Kiens, B. Training affects muscle phospholipid fatty acid composition in humans. J. Appl. Physiol. 2001, 90, 670–677. [Google Scholar] [CrossRef]
- Di Marino, L.; Maffettone, A.; Cipriano, P.; Sacco, M.; Di Palma, R.; Amato, B.; Quarto, G.; Riccardi, G.; Rivellese, A.A. Is the erythrocyte membrane fatty acid composition a valid index of skeletal muscle membrane fatty acid composition? Metabolism 2000, 49, 1164–1166. [Google Scholar] [CrossRef]
- O’Donnell, V.B.; Murphy, R.C.; Watson, S.P. Platelet lipidomics: Modern day perspective on lipid discovery and characterization in platelets. Circ. Res. 2014, 114, 1185–1203. [Google Scholar] [CrossRef]
- Berlin, E.; Matusik, E.J.; Young, C. Effect of dietary fat on the fluidity of platelet membranes. Lipids 1980, 15, 604–608. [Google Scholar] [CrossRef] [PubMed]
- Sanders, T.A.B.; Younger, K.M. The effect of dietary supplements of ω3 polyunsaturated fatty acids on the fatty acid composition of platelets and plasma choline phosphoglycerides. Br. J. Nutr. 1981, 45, 613–616. [Google Scholar] [CrossRef]
- Bärtsch, P. Platelet activation with exercise and risk of cardiac events. Lancet 1999, 354, 1747–1748. [Google Scholar] [CrossRef]
- Garai, B.; Chatterjee, S.; Mondal, S.; Mondal, T. Effect of exercise on platelet variables: An overview. Int. J. Sport Stud. Health 2017, 4, 506–510. [Google Scholar]
- Gonzales, F.; Manas, M.; Seiquer, I.; Quiles, J.; Mataix, F.J.; Huertas, J.R.; Martinez-Victoria, E. Blood platelet function in healthy individuals of different ages. Effects of exercise and exercise conditioning. J. Sports Med. Phys. Fitness 1996, 36, 112–116. [Google Scholar]
- Niebauer, J.; Cooke, J.P. Cardiovascular effects of exercise: Role of endothelial shear stress. J. Am. Coll. Cardiol. 1996, 28, 1652–1660. [Google Scholar] [CrossRef]
- Haynes, A.; Linden, M.D.; Robey, E.; Naylor, L.H.; Ainslie, P.N.; Cox, K.L.; Lautenschlager, N.T.; Green, D.J. Beneficial impacts of regular exercise on platelet function in sedentary older adults: Evidence from a randomized 6-mo walking trial. J. Appl. Physiol. 2018, 125, 401–408. [Google Scholar] [CrossRef] [PubMed]
- Wang, J.-S.; Yang, C.F.; Wong, M.-K.; Chow, S.-E.; Chen, J.-K. Effect of strenuous arm exercise on oxidized-LDL-potentiated platelet activation in individuals with spinal cord injury. Thromb. Haemost. 2000, 84, 118–123. [Google Scholar]
- Guillou, H.; Zadravec, D.; Martin, P.G.P.; Jacobsson, A. The key roles of elongases and desaturases in mammalian fatty acid metabolism: Insights from transgenic mice. Prog. Lipid Res. 2010, 49, 186–199. [Google Scholar] [CrossRef]
- Beaudoin, F.; Michaelson, L.V.; Hey, S.J.; Lewis, M.J.; Shewry, P.R.; Sayanova, O.; Napier, J.A. Heterologous reconstitution in yeast of the polyunsaturated fatty acid biosynthetic pathway. Proc. Natl. Acad. Sci. USA 2000, 97, 6421–6426. [Google Scholar] [CrossRef] [PubMed]
- Drexler, H.; Spiekermann, P.; Meyer, A.; Domergue, F.; Zank, T.; Sperling, P.; Abbadi, A.; Heinz, E. Metabolic engineering of fatty acids for breeding of new oilseed crops: Strategies, problems and first results. J. Plant Physiol. 2003, 160, 779–802. [Google Scholar] [CrossRef] [PubMed]
- Crescente, M.; Menke, L.; Chan, M.V.; Armstrong, P.C.; Warner, T.D. Eicosanoids in platelets and the effect of their modulation by aspirin in the cardiovascular system (and beyond). Br. J. Pharmacol. 2019, 176, 988–999. [Google Scholar] [CrossRef] [PubMed]
- Holinstat, M. Normal platelet function. Cancer Metastasis Rev. 2017, 36, 195–198. [Google Scholar] [CrossRef] [PubMed]
- Coates, P.M.; Paul, M.C.; Blackman, M.; Blackman, M.R.; Cragg, G.M.; Levine, M.; White, J.D.; Moss, J. Omega-3 Fatty Acids. In Encyclopedia of Dietary Supplements; CRC Press: Boca Raton, FL, USA, 2004; pp. 513–524. [Google Scholar]
- Klvanova, J.; Beno, I.; Ondreicka, R.; Volkovova, K.; Staruchova, M.; Grancicova, E.; Bobek, P.; Tatara, M. Relation between fatty acid composition, vitamin E and malondialdehyde levels, and activity of antioxidant enzymes in the blood. Bratisl. Lek. Listy 1998, 99, 245–249. [Google Scholar] [PubMed]
- Lone, A.M.; Taskén, K. Proinflammatory and immunoregulatory roles of eicosanoids in T cells. Front. Immunol. 2013, 4, 130. [Google Scholar] [CrossRef] [PubMed]
- Astudillo, A.M.; Balboa, M.A.; Balsinde, J. Selectivity of phospholipid hydrolysis by phospholipase A2 enzymes in activated cells leading to polyunsaturated fatty acid mobilization. Biochim. Biophys. Acta (BBA) Mol. Cell Biol. Lipids 2019, 1864, 772–783. [Google Scholar] [CrossRef]
- Brites, F.; Evelson, P.; Christiansen, M.; Nicol, M.; Basílico, M.; Wikinski, R.; Llesuy, S. Soccer players under regular training show oxidative stress but an improved plasma antioxidant status. Clin. Sci. 1999, 96, 381–385. [Google Scholar] [CrossRef]
- Siquier Coll, J.; Muñoz Marín, D.; Grijota Pérez, F.; Bartolomé Sánchez, I.; Robles Gil, M.; Montero Arroyo, J.; Maynar Mariño, M. Influence of soccer training on parameters of oxidative stress in erythrocytes. Nutr. Hosp. 2019, 36, 926–930. [Google Scholar]
- Muñoz, D.; Olcina, G.; Timón, R.; Robles, M.C.; Caballero, M.J.; Maynar, M. Effect of different exercise intensities on oxidative stress markers and antioxidant response in trained cyclists. J. Sports Med. Phys. Fitness 2010, 50, 93. [Google Scholar]
- Simioni, C.; Zauli, G.; Martelli, A.M.; Vitale, M.; Sacchetti, G.; Gonelli, A.; Neri, L.M. Oxidative stress: Role of physical exercise and antioxidant nutraceuticals in adulthood and aging. Oncotarget 2018, 9, 17181. [Google Scholar] [CrossRef]


| SFAs | 12:0 (lauric acid) + 14:0 (myristic acid) + 16:0 (palmitic acid) + 18:0 (stearic acid) + 24:0 (lignoceric acid) |
| MUFAs | 16:1 (palmitoleic acid) + 18:1C (oleic acid) + 18:1T (elaidic acid) + 24:1 (nervonic acid) |
| PUFAs ω6 | 18:2:6 (linoleic acid) + 18:3:6 (gamma-linolenic acid) + 20:3:6 (eicosadienoic acid) + 20:4:6 (arachidonic acid) |
| PUFAs ω3 | 18:3:3 (alpha-linolenic acid) + 20:5:3 (eicosapentaenoic acid) + 22:5:3 (docosapentaenoic acid) + 22:6:3 (docosahexaenoic acid) |
| PUFAs | PUFAs ω6 + PUFAs ω3 |
| ω6/ω3 index | PUFAs ω6/PUFAs ω3 |
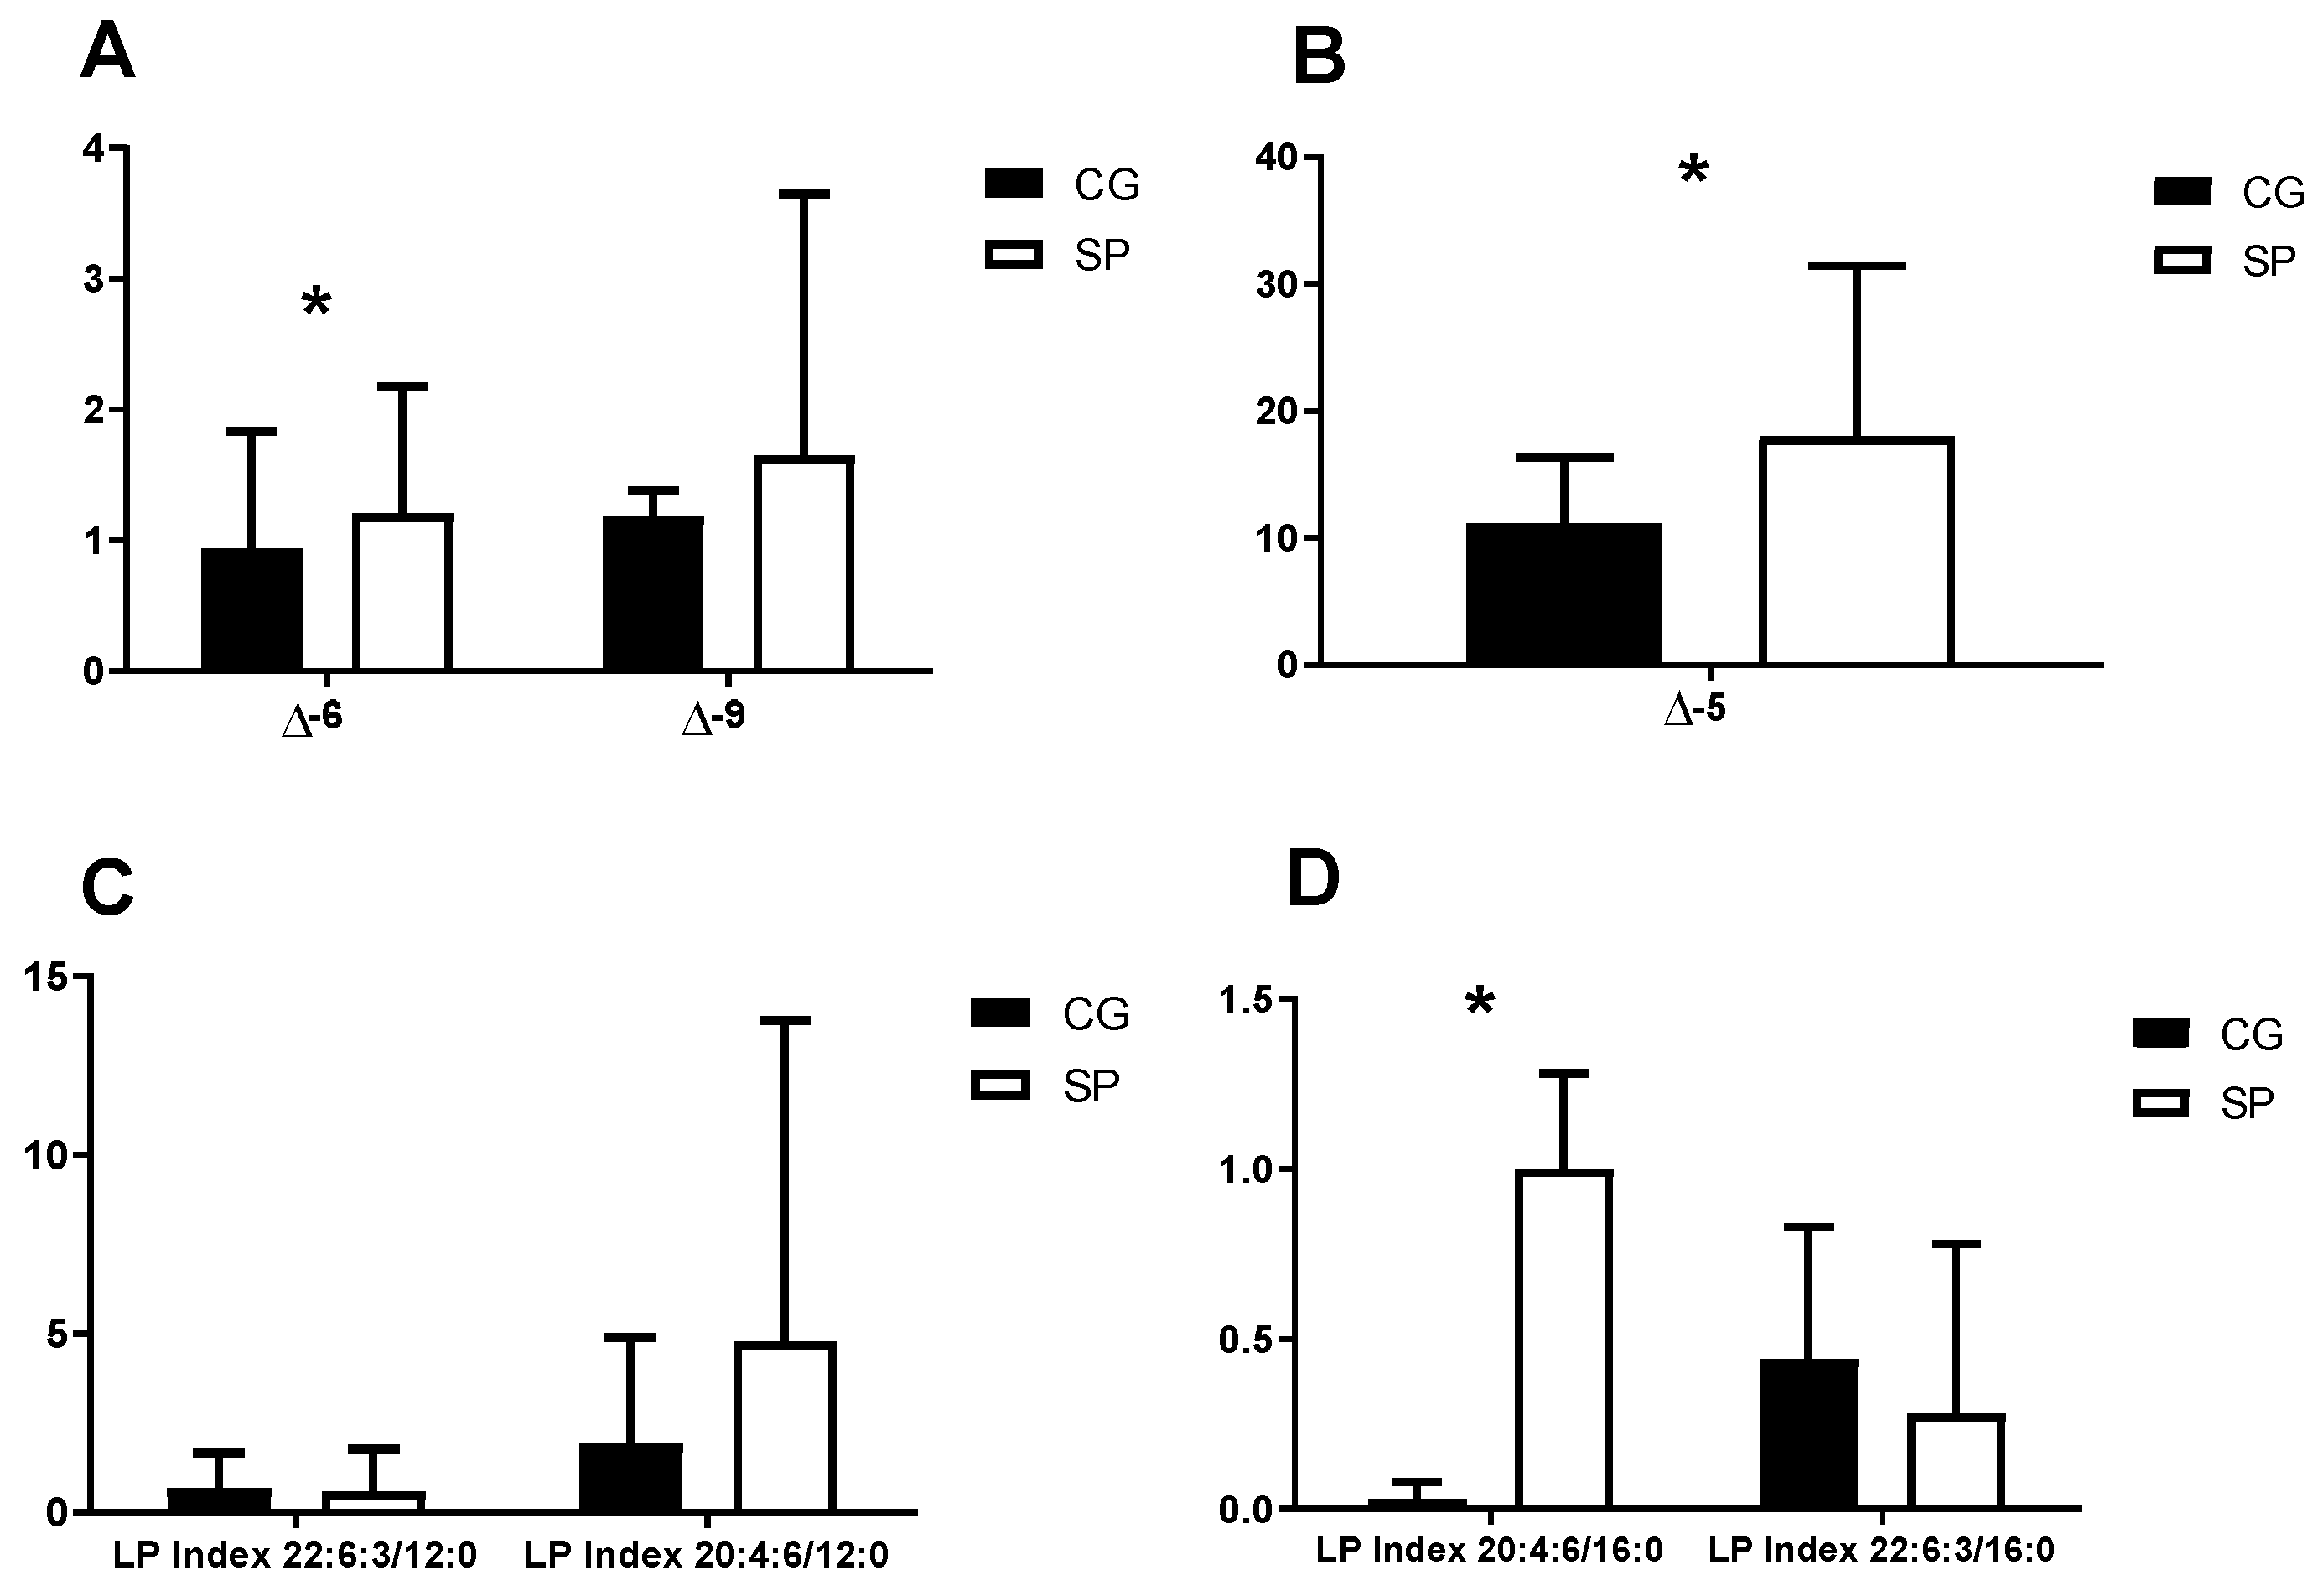
| Desaturation index ∆9 | 18:1/18:0 |
| Desaturation index ∆6 | 18:2/18:1 |
| Desaturation index ∆5 | 20:4:6/20:3:6 |
| Lipid peroxidation index 1 | 22:6:3/12:0 |
| Lipid peroxidation index 2 | 20:4:6/12:0 |
| Lipid peroxidation index 3 | 22:6:3/16:0 |
| Lipid peroxidation index 4 | 20:4:6/16:0 |
| SP | CG | |
|---|---|---|
| Abdominal skinfold (mm) | 12.03 ± 3.03 | 19.01 ± 8.48 ** |
| Suprailiac skinfold (mm) | 8.45 ± 2.07 | 15.77 ± 6.73 ** |
| Subscapular skinfold (mm) | 10.09 ± 1.98 | 14.26 ± 5.87 * |
| Tricipital skinfold (mm) | 9.01 ± 2.82 | 23.84 ± 38.79 ** |
| Thigh skinfold (mm) | 12.55 ± 3.92 | 15.90 ± 5.51 |
| Gastrocnemius skinfold (mm) | 8.43 ± 3.01 | 9.86 ± 4.06 |
| Arm Perimeter (cm) | 27.05 ± 2.00 | 29.68 ± 2.10 |
| Leg perimeter (cm) | 36.87 ± 1.75 | 35.97 ± 4.65 |
| Fat percentage (%) | 9.43 ± 1.08 | 14.40 ± 6.23 |
| Muscle Percentage (%) | 48.05 ± 0.84 | 44.95 ± 0.85 |
| Bone Percentage (%) | 18.42 ± 1.43 | 17.55 ± 0.57 |
| Parameters | SP | CG |
|---|---|---|
| Energy (kcal/d) | 1796.01 ± 420.37 | 1504.67 ± 573.21 * |
| Carbohydrates (g/d) | 231.06 ± 69.1 | 197.24 ± 72.14 |
| Proteins (g/d) | 106.13 ± 25.55 | 87.56 ± 33.12 |
| Fat (g/d) | 54.81 ± 19.14 | 56.56 ± 33.46 |
| Vitamin C (ug/d) | 104.95 ± 64.97 | 102.66 ± 57.14 |
| Vitamin E (ug/d) | 8.74 ± 8.72 | 8.91 ± 7.33 |
| 14:0 (myristic acid) (g/d) | 1.78 ± 1.13 | 1.85 ± 1.28 |
| 16:0 (palmitic acid) (g/d) | 9.75 ± 4.28 | 10.77 ± 5.10 |
| 18:0 (stearic acid) (g/d) | 3.74 ± 2.29 | 4.01 ± 3.21 |
| 16:1 (palmitoleic acid) (g/d) | 1.28 ± 0.56 | 1.33 ± 0.87 |
| 18:1:C (oleic acid) (g/d) | 16.12 ± 6.22 | 16.56 ± 6.35 |
| 18:3:6 (gamma-linolenic acid) (g/d) | 6.95 ± 4.50 | 7.14 ± 5.01 |
| 18:3:3 (alpha-linolenic acid) (g/d) | 0.90 ± 0.88 | 0.87 ± 0.92 |
| 20:4:6 (arachidonic acid) (g/d) | 0.08 ± 0.05 | 0.09 ± 0.06 |
| 20:5:3 (eicosapentaenoic acid) (g/d) | 0.25 ± 0.30 | 0.23 ± 0.27 |
| 22:5:3 (docosapentaenoic acid) (g/d) | 0.08 ± 0.11 | 0.08 ± 0.12 |
| 22:6:3 (docosahexaenoic acid) (g/d) | 0.53 ± 0.65 | 0.50 ± 0.59 |
| Parameters (%) | SP | CG | p |
|---|---|---|---|
| 12:0 (lauric acid) | 4.43 ± 8.04 | 1.32 ± 2.61 | 0.09 |
| 14:0 (myristic acid) | 0.82 ± 1.04 | 0.42 ± 0.29 | 0.09 |
| 16:0 (palmitic acid) | 14.19 ± 3.26 | 12.46 ± 3.83 | 0.11 |
| 18:0 (stearic acid) | 11.17 ± 3.35 | 11.35 ± 3.32 | 0.86 |
| 24:0 (lignoceric acid) | 1.81 ± 1.41 | 4.63 ± 3.97 | <0.001 |
| 16:1 (palmitoleic acid) | 0.40 ± 0.28 | 0.27 ± 0.10 | 0.04 |
| 18:1:C (oleic acid) | 13.38 ± 4.05 | 13.41 ± 3.93 | 0.98 |
| 18:1:T (elaidic acid) | 1.06 ± 2.48 | 0.28 ± 0.38 | 0.15 |
| 24:1 (nervonic acid) | 4.97 ± 10.02 | 5.58 ± 3.07 | 0.79 |
| 18:6 (linoleic acid) | 16.21 ± 6.06 | 12.71 ± 4.06 | 0.03 |
| 18:3:6 (gamma-linolenic acid) | 0.73 ± 1.79 | 0.30 ± 0.20 | 0.27 |
| 20:3:6 (eicosadienoic acid) | 1.32 ± 0.61 | 1.96 ± 0.72 | <0.001 |
| 20:4:6 (arachidonic acid) | 17.83 ± 5.11 | 18.46 ± 3.07 | 0.62 |
| 18:3:3 (alpha-linolenic acid) | 0.76 ± 0.44 | 1.35 ± 0.50 | <0.001 |
| 20:5:3 (eicosapentaenoic acid) | 0.96 ± 2.62 | 2.40 ± 2.67 | 0.04 |
| 22:5:3 (docosapentaenoic acid) | 4.06 ± 9.82 | 4.84 ± 3.84 | 0.73 |
| 22:6:3 (docosahexaenoic acid) | 2.94 ± 4.15 | 4.11 ± 2.35 | 0.04 |
| SFAs | 32.43 ± 9.16 | 30.19 ± 4.07 | 0.30 |
| MUFAs | 19.81 ± 9.44 | 19.55 ± 2.81 | 0.90 |
| PUFAs | 44.82 ± 9.33 | 46.15 ± 3.76 | 0.54 |
| PUFAs ω6 | 36.10 ± 10.28 | 33.44 ± 6.13 | 0.22 |
| PUFAs ω3 | 8.72 ± 12.65 | 12.71 ± 8.28 | 0.04 |
| PUFA ω6/ω3 | 9.97 ± 9.00 | 4.56 ± 3.50 | 0.01 |
| Pearson Correlation (r) | p | |
|---|---|---|
| 12:0 (lauric acid) | 0.26 | 0.09 |
| 14:0 (myristic acid) | 0.26 | 0.09 |
| 16:0 (palmitic acid) | 0.24 | 0.11 |
| 18:0 (stearic acid) | 0.03 | 0.86 |
| 24:0 (lignoceric acid) | −0.44 | <0.001 |
| 16:1 (palmitoleic acid) | −0.31 | 0.04 |
| 18:1:C (oleic acid) | 0.01 | 0.98 |
| 18:1:T (elaidic acid) | 0.22 | 0.15 |
| 24:1 (nervonic acid) | −0.04 | 0.79 |
| 18:6 (linoleic acid) | 0.25 | 0.12 |
| 18:3:6 (gamma-linolenic acid) | 0.17 | 0.27 |
| 20:3:6 (eicosadienoic acid) | −0.44 | <0.001 |
| 20:4:6 (arachidonic acid) | 0.08 | 0.62 |
| 18:3:3 (alpha-linolenic acid) | −0.54 | <0.001 |
| 20:5:3 (eicosapentaenoic acid) | −0.27 | 0.08 |
| 22:5:3 (docosapentaenoic acid) | −0.05 | 0.73 |
| 22:6:3 (docosahexaenoic acid) | −0.18 | 0.25 |
| SFAs MUFAs | 0.16 0.02 | 0.30 0.90 |
| PUFAs PUFAs ω6 PUFAs ω3 | −0.10 0.16 −0.19 | 0.54 0.30 0.22 |
| ω6/ω3 index | 0.38 | 0.02 |
| Desaturation index ∆5 | 0.33 | 0.03 |
| Desaturation index ∆6 | 0.24 | 0.06 |
| Desaturation index ∆9 | 0.15 | 0.32 |
| LP Index 22:6:3/12:0 | −0.04 | 0.82 |
| LP Index 20:4:6/12:0 LP Index 22:6:3/16:0 LP Index 20:4:6/16:0 Vitamin C Vitamin E | 0.21 −0.14 0.35 0.80 0.79 | 0.18 0.35 0.02 <0.001 <0.001 |
Disclaimer/Publisher’s Note: The statements, opinions and data contained in all publications are solely those of the individual author(s) and contributor(s) and not of MDPI and/or the editor(s). MDPI and/or the editor(s) disclaim responsibility for any injury to people or property resulting from any ideas, methods, instructions or products referred to in the content. |
© 2024 by the authors. Licensee MDPI, Basel, Switzerland. This article is an open access article distributed under the terms and conditions of the Creative Commons Attribution (CC BY) license (https://creativecommons.org/licenses/by/4.0/).
Share and Cite
Toro-Román, V.; Siquier-Coll, J.; Bartolomé, I.; Maynar-Mariño, M.; Grijota, F.J. Influence of Long-Term Soccer Training on the Fatty Acid Profile of the Platelet Membrane and Intra-Platelet Antioxidant Vitamins. Nutrients 2024, 16, 2391. https://doi.org/10.3390/nu16152391
Toro-Román V, Siquier-Coll J, Bartolomé I, Maynar-Mariño M, Grijota FJ. Influence of Long-Term Soccer Training on the Fatty Acid Profile of the Platelet Membrane and Intra-Platelet Antioxidant Vitamins. Nutrients. 2024; 16(15):2391. https://doi.org/10.3390/nu16152391
Chicago/Turabian StyleToro-Román, Víctor, Jesús Siquier-Coll, Ignacio Bartolomé, Marcos Maynar-Mariño, and Francisco J. Grijota. 2024. "Influence of Long-Term Soccer Training on the Fatty Acid Profile of the Platelet Membrane and Intra-Platelet Antioxidant Vitamins" Nutrients 16, no. 15: 2391. https://doi.org/10.3390/nu16152391