
Association of Beverage Consumption during Pregnancy with Adverse Maternal and Offspring Outcomes
 ,
,
Abstract
:1. Introduction
2. Method
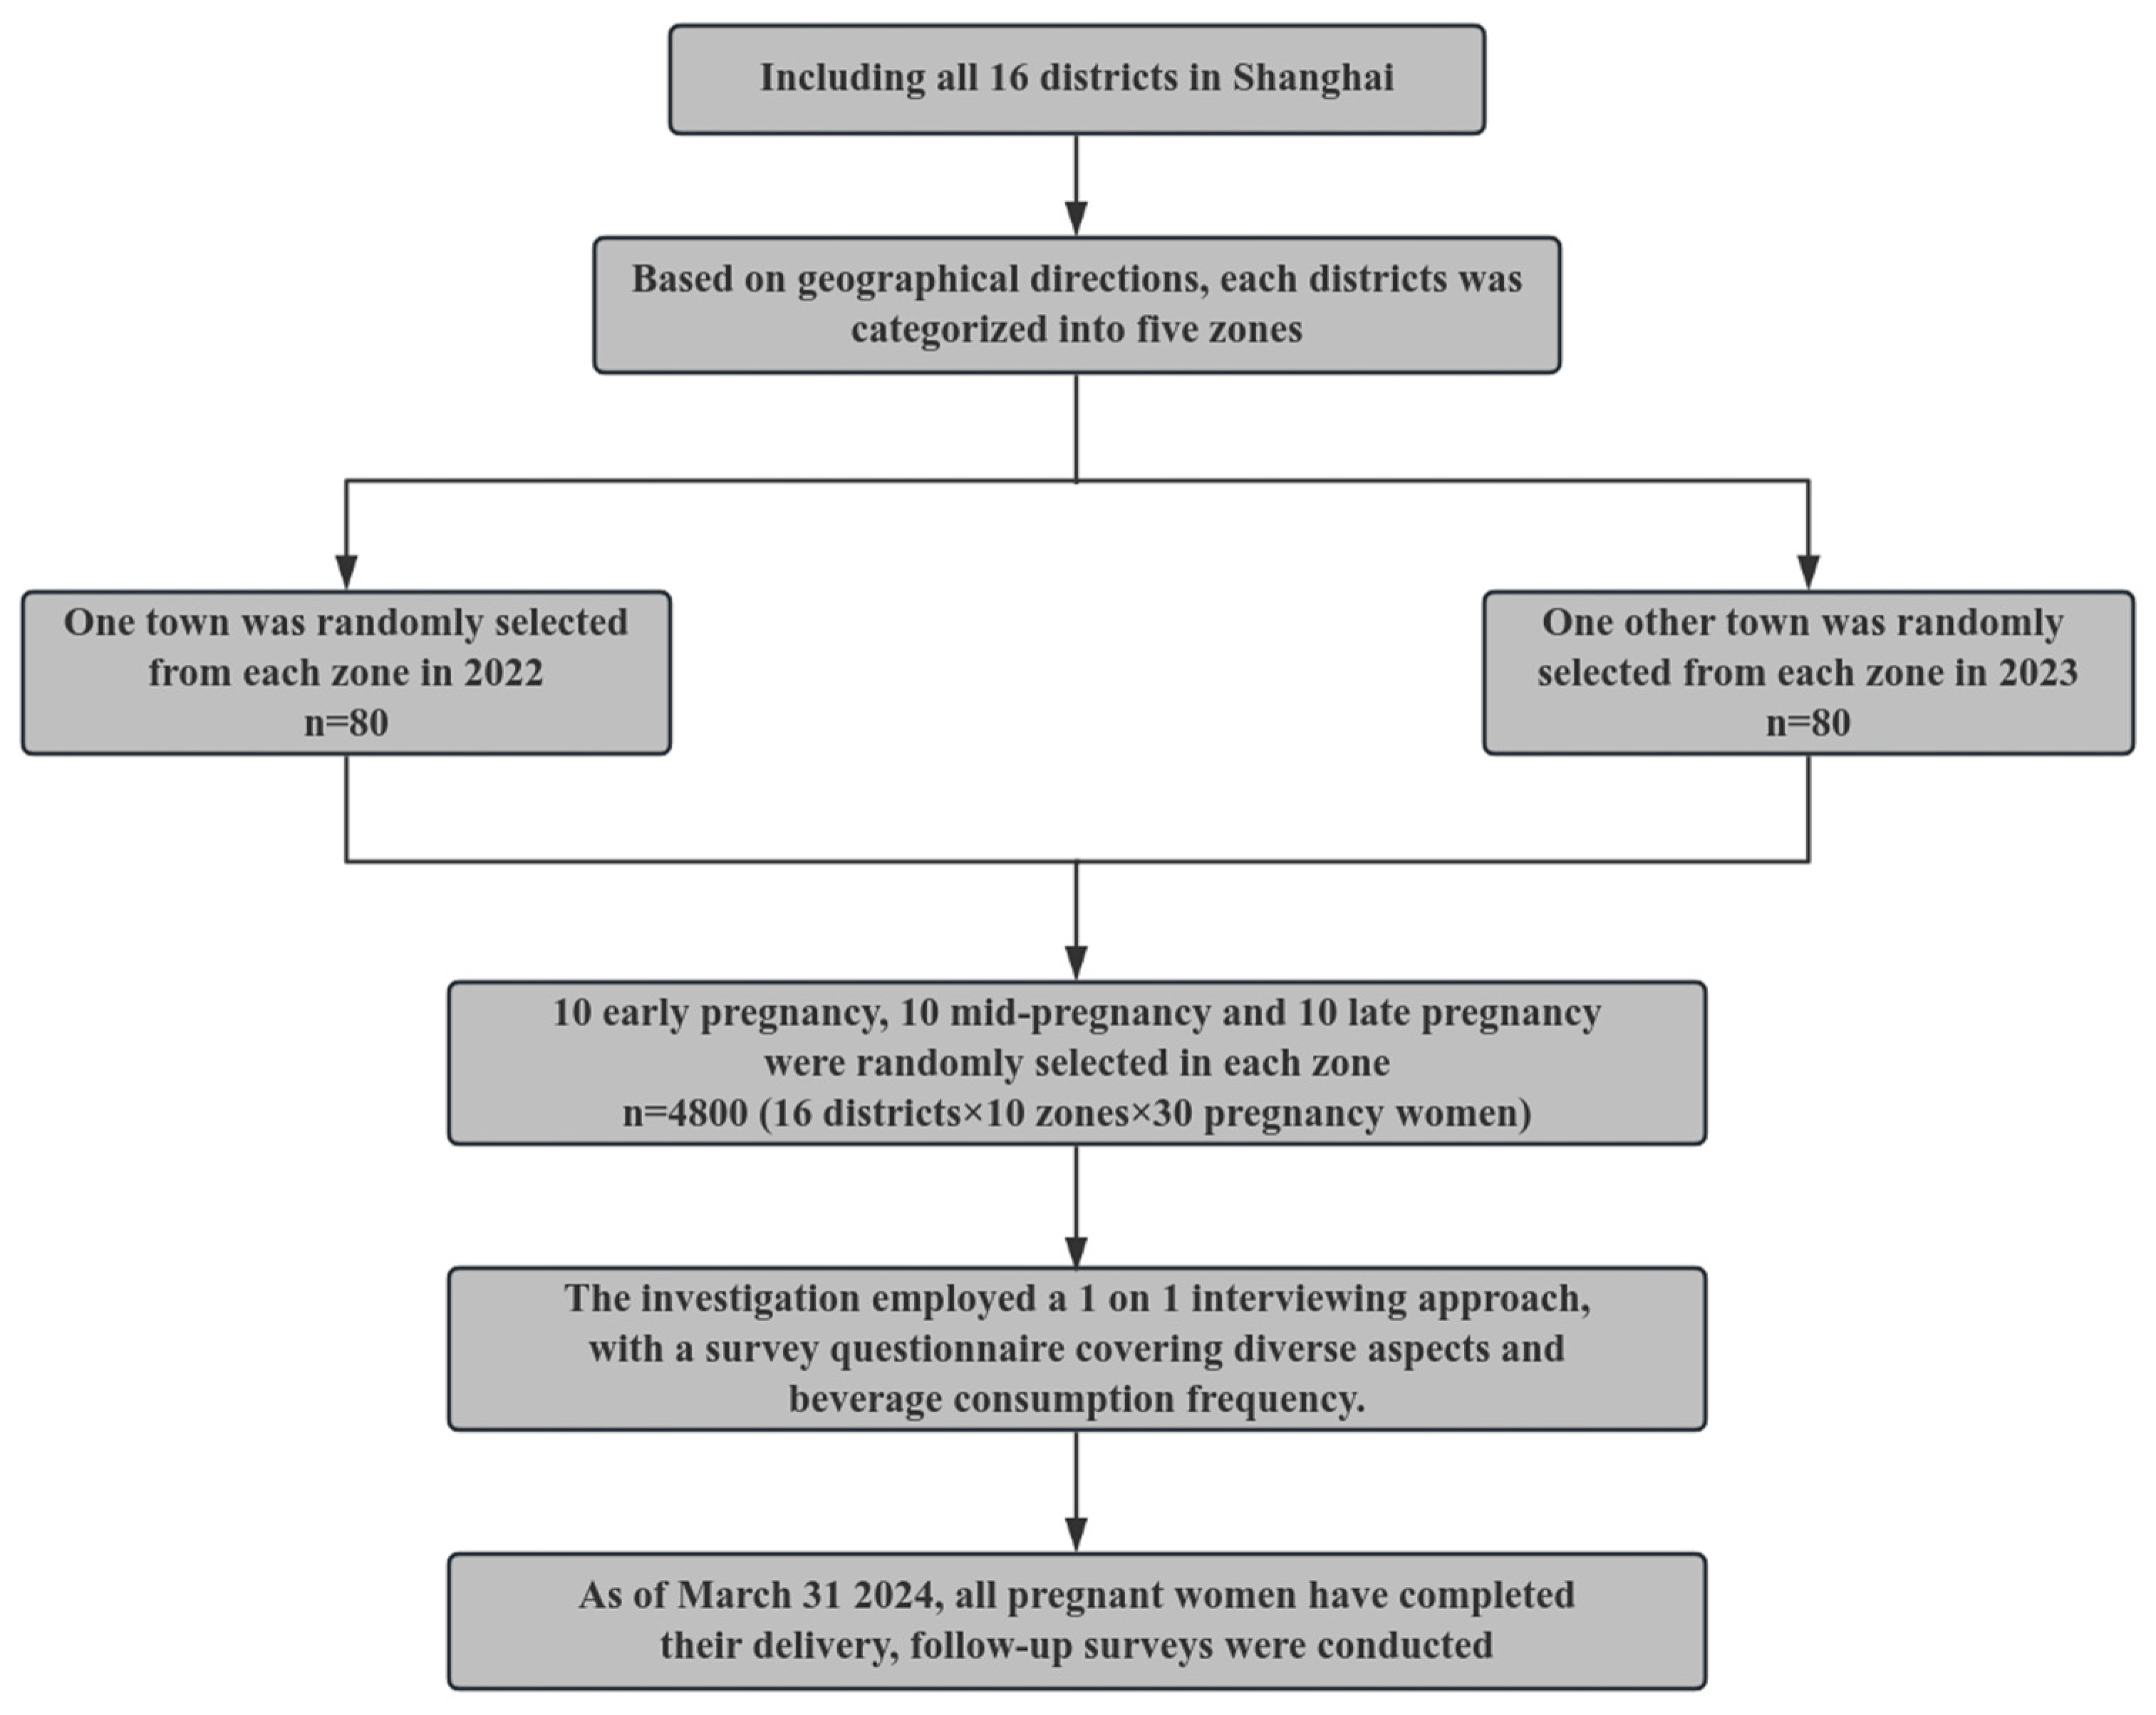
2.1. Participants
2.2. Baseline Data Collection
2.3. Follow-Up Data Collection
2.4. Covariates and Categorization
2.5. Mass Control during Project Implementation
2.6. Statistical Analysis
3. Results
3.1. Socio-Demographic Profile and Health Behaviours of Pregnant Women across Different Pregnancy Stages
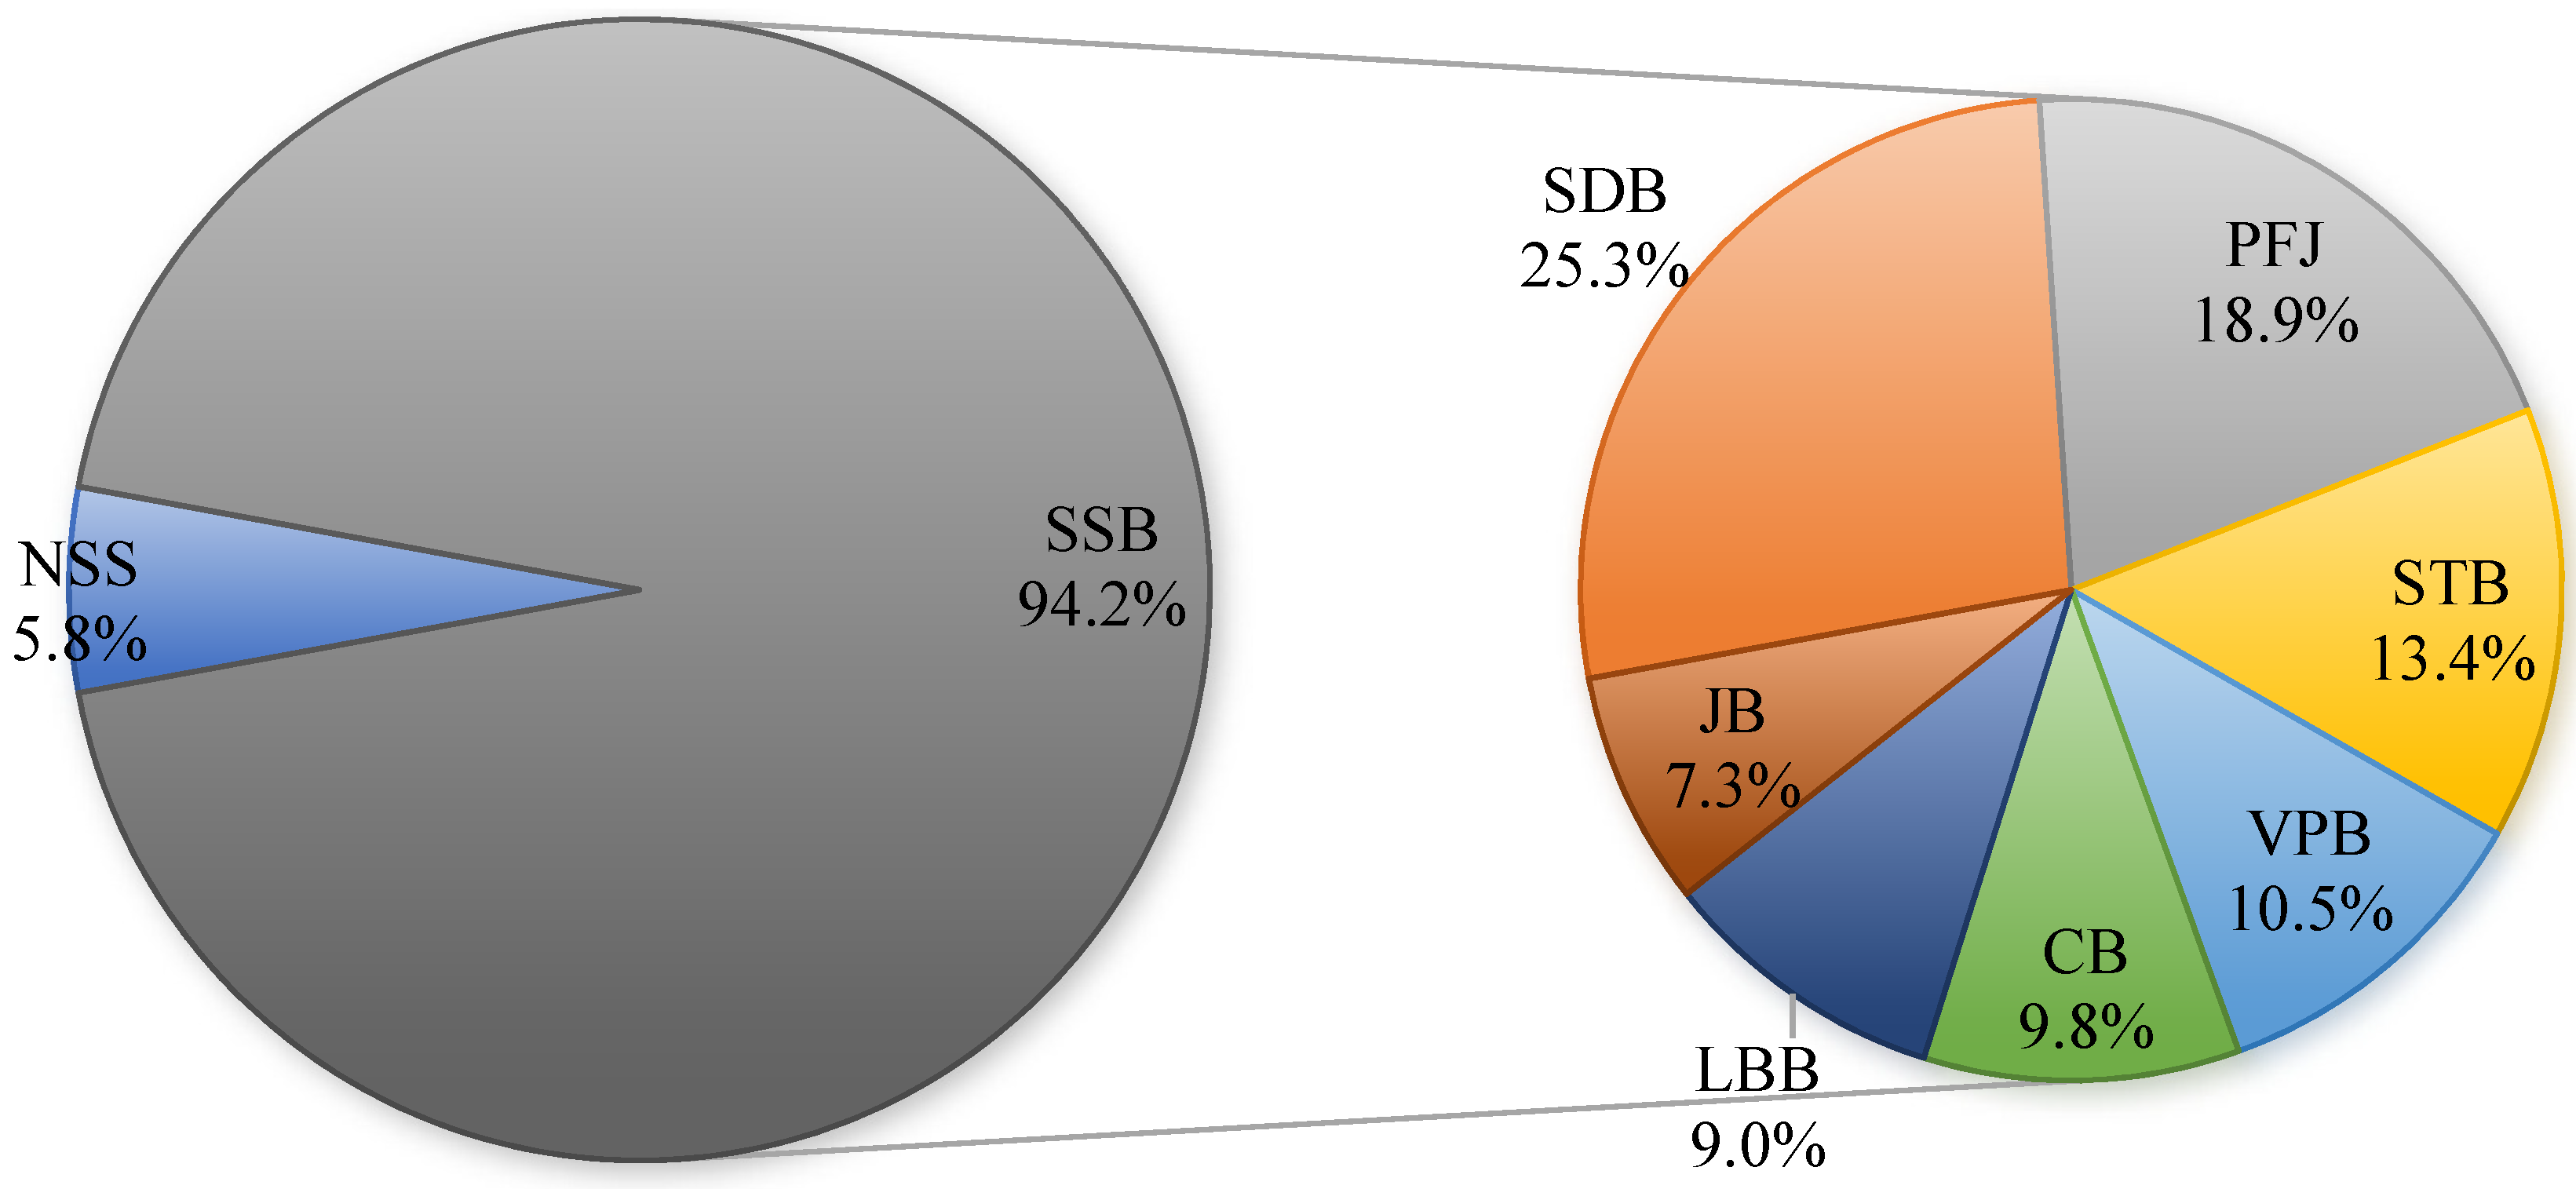
3.2. Frequency and Volume of Consumption of Different Types of Beverages
3.3. Beverage Consumption Effect of Pregnancy Outcomes and Offspring Health
3.4. Logistic Analysis of the Relationship between Beverage Consumption Frequency and the Risk of Adverse Maternal and Offspring Outcomes
4. Discussion
5. Conclusions
Author Contributions
Funding
Institutional Review Board Statement
Informed Consent Statement
Data Availability Statement
Acknowledgments
Conflicts of Interest
References
- Popkin, B.M.; Hawkes, C. Sweetening of the global diet, particularly beverages: Patterns, trends, and policy responses. Lancet Diabetes Endocrinol. 2016, 4, 174–186. [Google Scholar] [CrossRef] [PubMed]
- Singh, G.M.; Micha, R.; Khatibzadeh, S.; Shi, P.; Lim, S.; Andrews, K.G.; Engell, R.E.; Ezzati, M.; Mozaffarian, D.; Global Burden of Diseases Nutrition and Chronic Diseases Expert Group (NutriCoDE). Global, Regional, and National Consumption of Sugar-Sweetened Beverages, Fruit Juices, and Milk: A Systematic Assessment of Beverage Intake in 187 Countries. PLoS ONE 2015, 10, e0124845. [Google Scholar] [CrossRef] [PubMed]
- Lara-Castor, L.; Micha, R.; Cudhea, F.; Miller, V.; Shi, P.; Zhang, J.; Sharib, J.R.; Erndt-Marino, J.; Cash, S.B.; Mozaffarian, D.; et al. Sugar-sweetened beverage intakes among adults between 1990 and 2018 in 185 countries. Nat. Commun. 2023, 14, 5957. [Google Scholar] [CrossRef] [PubMed]
- National Bureau of Statistics [EB/OL]. (2023-12-31). National Bureau of Statistics of China (stats.gov.cn). 2024.2. Available online: https://data.stats.gov.cn/easyquery.htm?cn=A01&zb=A02090C&sj=202311 (accessed on 20 April 2024).
- Zhang, N.; Morin, C.; Guelinckx, I.; Moreno, L.A.; Kavouras, S.A.; Gandy, J.; Martinez, H.; Salas-Salvadó, J.; Ma, G. Fluid intake in urban China: Results of the 2016 Liq.In 7 national cross-sectional surveys. Eur. J. Nutr. 2018; 57, (Suppl. S3), 77–88. [Google Scholar]
- Liu, Y.J.; Shi, M.; Pan, F.; Li, G.; Luan, D.; Liu, A.D.; Li, N.; Li, J.W. The content of total free sugars in commercial sugary beverages in China. Chin. J. Food Hyg. 2021, 33, 93–96. [Google Scholar]
- Huang, Y.; Chen, Z.; Chen, B.; Li, J.; Yuan, X.; Li, J.; Wang, W.; Dai, T.; Chen, H.; Wang, Y.; et al. Dietary sugar consumption and health: Umbrella review. BMJ 2023, 381, e071609. [Google Scholar] [CrossRef] [PubMed]
- Malik, V.S.; Hu, F.B. The role of sugar-sweetened beverages in the global epidemics of obesity and chronic diseases. Nat. Rev. Endocrinol. 2022, 18, 205–218. [Google Scholar] [CrossRef]
- World Health Organization. Guideline: Sugars Intake for Adults and Children. WHO Guideline. Available online: https://iris.who.int/bitstream/handle/10665/149782/9789241549028_eng.pdf?sequence=1 (accessed on 14 July 2024).
- Borgen, I.; Aamodt, G.; Harsem, N.; Haugen, M.; Meltzer, H.M.; Brantsæter, A.L. Maternal sugar consumption and risk of preeclampsia in nulliparous Norwegian women. Eur. J. Clin. Nutr. 2012, 66, 920–925. [Google Scholar] [CrossRef] [PubMed]
- Gao, R.; Liu, X.; Li, X.; Zhang, Y.; Wei, M.; Sun, P.; Zhang, J.; Cai, L. Association between maternal sugar-sweetened beverage consumption and the social-emotional development of child before 1 year old: A prospective cohort study. Front. Nutr. 2022, 9, 966271. [Google Scholar] [CrossRef]
- Casas, R.; Castro Barquero, S.; Estruch, R. Impact of Sugary Food Consumption on Pregnancy: A Review. Nutrients 2020, 12, 3574. [Google Scholar] [CrossRef]
- Goran, M.I.; Plows, J.F.; Ventura, E.E. Effects of consuming sugars and alternative sweeteners during pregnancy on maternal and child health: Evidence for a secondhand sugar effect. Proc. Nutr. Soc. 2019, 78, 262–271. [Google Scholar] [CrossRef]
- China Chain Store and Franchise Association. The Freshly Made and Sold Tea Beverage Research Report in 2023; China Chain Store and Franchise Association: Shanghai, China, 2023. [Google Scholar]
- Shi, Z.; Sun, Z.; Song, Q.; Qu, M.; Wang, Z.; Zang, J. Nutrient content of 122 kinds of retail handcrafted milk tea products in Shanghai. J. Environ. Occup. Med. 2023, 40, 756–760, 768. [Google Scholar]
- TIMON. China’s Sugar-Free Beverage Industry Research Report in 2022; TIMON: Shanghai, China, 2023. [Google Scholar]
- Belzer, L.M.; Smulian, J.C.; Lu, S.E.; Tepper, B.J. Food cravings and intake of sweet foods in healthy pregnancy and mild gestational diabetes mellitus. A prospective study. Appetite 2010, 55, 609–615. [Google Scholar] [CrossRef] [PubMed]
- Robinson, R.; Walker, K.F.; White, V.A.; Bugg, G.J.; Snell, K.I.E.; Jones, N.W. The test accuracy of antenatal ultrasound definitions of fetal macrosomia to predict birth injury: A systematic review. Eur. J. Obstet. Gynecol. Reprod. Biol. 2020, 246, 79–85. [Google Scholar] [CrossRef]
- Larkin, J.C.; Speer, P.D.; Simhan, H.N. A customized standard of large size for gestational age to predict intrapartum morbidity. Am. J. Obstet. Gynecol. 2011, 204, 499.e1–499.e10. [Google Scholar] [CrossRef]
- World Health Organization. WHO Recommendations for Care of the Preterm or Low-Birth-Weight Infant. WHO Guideline. Available online: https://iris.who.int/bitstream/handle/10665/363697/9789240058262-eng.pdf?sequence=1 (accessed on 14 July 2024).
- Schlaudecker, E.P.; Munoz, F.M.; Bardají, A.; Boghossian, N.S.; Khalil, A.; Mousa, H.; Nesin, M.; Nisar, M.I.; Pool, V.; Spiegel, H.M.L.; et al. Small for gestational age: Case definition & guidelines for data collection, analysis, and presentation of maternal immunisation safety data. Vaccine 2017, 35 Pt A, 6518–6528. [Google Scholar]
- Lundeen, E.A.; Park, S.; Woo Baidal, J.A.; Sharma, A.J.; Blanck, H.M. Sugar-Sweetened Beverage Intake Among Pregnant and Non-pregnant Women of Reproductive Age. Matern. Child Health J. 2020, 24, 709–717. [Google Scholar] [CrossRef] [PubMed]
- Zhang, Y.; Wu, X.; Wang, Q.; Zong, Q.; Wang, R.; Li, T.; Tao, S.; Tao, F. The Relationship Between Sugar-Sweetened Beverages, Takeaway Dietary Pattern, and Psychological and Behavioral Problems Among Children and Adolescents in China. Front. Psychiatry 2021, 12, 573168. [Google Scholar] [CrossRef] [PubMed]
- Donazar-Ezcurra, M.; Lopez-Del Burgo, C.; Martinez-Gonzalez, M.A.; Basterra-Gortari, F.J.; de Irala, J.; Bes-Rastrollo, M. Soft drink consumption and gestational diabetes risk in the SUN project. Clin. Nutr. 2018, 37, 638–645. [Google Scholar] [CrossRef] [PubMed]
- Aizawa, M.; Murakami, K.; Yonezawa, Y.; Takahashi, I.; Onuma, T.; Noda, A.; Ueno, F.; Matsuzaki, F.; Ishikuro, M.; Obara, T.; et al. Associations between sugar-sweetened beverages before and during pregnancy and offspring overweight/obesity in Japanese women: The TMM BirThree Cohort Study. Public Health Nutr. 2023, 26, 1222–1229. [Google Scholar] [CrossRef]
- Barbosa, J.M.A.; Silva, A.A.M.D.; Kac, G.; Simões, V.M.F.; Bettiol, H.; Cavalli, R.C.; Barbieri, M.A.; Ribeiro, C.C.C. Is soft drink consumption associated with gestational hypertension? Results from the BRISA cohort. Braz. J. Med. Biol. Res. 2021, 54, e10162. [Google Scholar] [CrossRef]
- Hedrick, V.E.; Nieto, C.; Grilo, M.F.; Sylvetsky, A.C. Non-sugar sweeteners: Helpful or harmful? The challenge of developing intake recommendations with the available research. BMJ 2023, 383, e075293. [Google Scholar] [CrossRef]
- World Health Organization. Use of Non-Sugar Sweeteners: WHO Guideline. Available online: https://iris.who.int/bitstream/handle/10665/367660/9789240073616-eng.pdf?sequence=1 (accessed on 15 May 2023).
- Günther, J.; Hoffmann, J.; Spies, M.; Meyer, D.; Kunath, J.; Stecher, L.; Rosenfeld, E.; Kick, L.; Rauh, K.; Hauner, H. Associations between the Prenatal Diet and Neonatal Outcomes-A Secondary Analysis of the Cluster-Randomised GeliS Trial. Nutrients 2019, 11, 1889. [Google Scholar] [CrossRef]
- Ornoy, A.; Becker, M.; Weinstein-Fudim, L.; Ergaz, Z. Diabetes during Pregnancy: A Maternal Disease Complicating the Course of Pregnancy with Long-Term Deleterious Effects on the Offspring. A Clinical Review. Int. J. Mol. Sci. 2021, 22, 2965. [Google Scholar] [CrossRef]
- Zeng, M.; He, Y.; Li, M.; Yang, L.; Zhu, Q.; Liu, J.; Mao, Y.; Chen, Q.; Du, J.; Zhou, W. Association between maternal pregestational glucose level and adverse pregnancy outcomes: A population-based retrospective cohort study. BMJ Open 2021, 11, e048530. [Google Scholar] [CrossRef]
- Zhao, D.; Liu, D.; Shi, W.; Shan, L.; Yue, W.; Qu, P.; Yin, C.; Mi, Y. Association between Maternal Blood Glucose Levels during Pregnancy and Birth Outcomes: A Birth Cohort Study. Int. J. Environ. Res. Public Health 2023, 20, 2102. [Google Scholar] [CrossRef]
- Gamba, R.J.; Leung, C.W.; Petito, L.; Abrams, B.; Laraia, B.A. Sugar sweetened beverage consumption during pregnancy is associated with lower diet quality and greater total energy intake. PLoS ONE 2019, 14, e0215686. [Google Scholar] [CrossRef] [PubMed]
- Julian, V.; Ciba, I.; Olsson, R.; Dahlbom, M.; Furthner, D.; Gomahr, J.; Maruszczak, K.; Morwald, K.; Pixner, T.; Schneider, A.; et al. Association between Metabolic Syndrome Diagnosis and the Physical Activity-Sedentary Profile of Adolescents with Obesity: A Complementary Analysis of the Beta-JUDO Study. Nutrients 2021, 14, 60. [Google Scholar] [CrossRef] [PubMed]
- Mousa, A.; Naqash, A.; Lim, S. Macronutrient and Micronutrient Intake during Pregnancy: An Overview of Recent Evidence. Nutrients 2019, 11, 443. [Google Scholar] [CrossRef] [PubMed]
- Modzelewska, D.; Bellocco, R.; Elfvin, A.; Brantsæter, A.L.; Meltzer, H.M.; Jacobsson, B.; Sengpiel, V. Caffeine exposure during pregnancy, small for gestational age birth and neonatal outcome—Results from the Norwegian Mother and Child Cohort Study. BMC Pregnancy Childbirth 2019, 19, 80. [Google Scholar] [CrossRef]
- Pusdekar, Y.V.; Patel, A.B.; Kurhe, K.G.; Bhargav, S.R.; Thorsten, V.; Garces, A.; Goldenberg, R.L.; Goudar, S.S.; Saleem, S.; Esamai, F.; et al. Rates and risk factors for preterm birth and low birthweight in the global network sites in six low- and low middle-income countries. Reprod. Health 2020, 17 (Suppl. S3), 187. [Google Scholar] [CrossRef]
- Ratnasiri, A.W.G.; Parry, S.S.; Arief, V.N.; DeLacy, I.H.; Halliday, L.A.; DiLibero, R.J.; Basford, K.E. Recent trends, risk factors, and disparities in low birth weight in California, 2005-2014: A retrospective study. Matern. Health Neonatol. Perinatol. 2018, 4, 15. [Google Scholar] [CrossRef] [PubMed]
- Louise, J.; Poprzeczny, A.J.; Deussen, A.R.; Vinter, C.; Tanvig, M.; Jensen, D.M.; Bogaerts, A.; Devlieger, R.; McAuliffe, F.M.; Renault, K.M.; et al. The effects of dietary and lifestyle interventions among pregnant women with overweight or obesity on early childhood outcomes: An individual participant data meta-analysis from randomised trials. BMC Med. 2021, 19, 128. [Google Scholar] [CrossRef] [PubMed]
- Aşcı, Ö.; Rathfisch, G. Effect of lifestyle interventions of pregnant women on their dietary habits, lifestyle behaviors, and weight gain: A randomized controlled trial. J. Health Popul. Nutr. 2016, 35, 7. [Google Scholar] [CrossRef]
- Brixval, C.S.; Axelsen, S.F.; Lauemøller, S.G.; Andersen, S.K.; Due, P.; Koushede, V. The effect of antenatal education in small classes on obstetric and psycho-social outcomes—A systematic review. Syst. Rev. 2015, 4, 20. [Google Scholar] [CrossRef] [PubMed]

| Total | Early Pregnancy | Mid-Pregnancy | Late Pregnancy | p | |
|---|---|---|---|---|---|
| Characteristics | N (%) | N (%) | N (%) | N (%) | |
| Total numble | 4824 | 1638 | 1618 | 1568 | /* |
| Age | |||||
| <35 | 3966 (82.2) | 1370 (83.6) | 1339 (82.8) | 1257 (80.2) | <0.05 |
| ≥35 | 858 (17.8) | 268 (16.4) | 279 (17.2) | 311 (19.8) | |
| Education Level | |||||
| Specialty or lower | 2012 (41.7) | 661 (40.4) | 688 (42.5) | 663 (42.3) | 0.587 |
| Undergraduate | 2162 (44.8) | 741 (45.2) | 719 (44.4) | 702 (44.8) | |
| Postgraduate | 650 (13.5) | 236 (14.4) | 211 (13.0) | 203 (12.9) | |
| Marital status | |||||
| Unmarried, divorced or separated | 57 (1.2) | 26 (1.6) | 19 (1.2) | 12 (0.8) | 0.098 |
| Married or cohabiting | 4767 (98.8) | 1612 (98.4) | 1599 (98.8) | 1556 (99.2) | |
| Employment status | |||||
| Mental Labour | 2328 (48.3) | 800 (48.8) | 747 (46.2) | 781 (49.8) | 0.128 |
| Physical Labour | 912 (18.9) | 323 (19.7) | 316 (19.5) | 273 (17.4) | |
| Others | 1584 (32.8) | 515 (31.4) | 555 (34.3) | 514 (32.8) | |
| Per capita income | |||||
| Below average | 2368 (49.1) | 755 (46.1) | 817 (50.5) | 796 (50.8) | 0.012 |
| Over average | 2456 (50.9) | 883 (53.9) | 801 (49.5) | 772 (49.2) | |
| Alcohol consumption prior to pregnancy | |||||
| Yes | 319 (6.6) | 133 (8.1) | 95 (5.9) | 91 (5.8) | 0.010 |
| No | 4505 (93.4) | 1505 (91.9) | 1523 (94.1) | 1477 (94.2) | |
| Taking nutritional supplement | |||||
| Yes | 3085 (64.0) | 965 (58.9) | 1077 (66.6) | 1043 (66.5) | <0.001 |
| No | 1739 (36.0) | 673 (41.1) | 541 (33.4) | 525 (33.5) | |
| BMI Before pregnancy | |||||
| Underweight | 477 (9.9) | 157 (9.6) | 165 (10.2) | 155 (9.9) | 0.473 |
| Normal weight | 3273 (67.8) | 1092 (66.7) | 1100 (68.0) | 1081 (68.9) | |
| Overweight and obesity | 1074 (22.3) | 389 (23.7) | 353 (21.8) | 332 (21.2) | |
| Consumption Frequency (%) | p | Consumption Volume (mL) Median (P25, P75) | p | |||||
|---|---|---|---|---|---|---|---|---|
| Characteristic | Never | 1–3 Times Per Month | 1–3 Times Per Week | 4–7 Times Per Week | >1 Per Day | |||
| TB | 26.8 | 10.4 | 32.6 | 17.6 | 12.5 | 66.7 (26.7, 146.7) | ||
| Early pregnancy | 24.8 | 10.6 | 34.9 | 17.5 | 12.1 | 0.034 | 66.7 (26.7, 140.0) | 0.755 |
| Mid-pregnancy | 26.6 | 9.3 | 33.3 | 18.1 | 12.7 | 66.7 (30.0, 140.0) | ||
| Late pregnancy | 29.0 | 11.5 | 29.6 | 17.2 | 12.8 | 66.7 (26.7, 150.0) | ||
| SSB | 27.2 | 11.2 | 32.7 | 17.1 | 11.8 | 65.0 (26.7, 133.3) | ||
| Early pregnancy | 25.4 | 11.2 | 35.2 | 16.7 | 11.5 | 0.052 | 60.0 (26.7, 133.3) | 0.702 |
| Mid-pregnancy | 26.8 | 10.3 | 33.3 | 17.6 | 12.1 | 66.7 (26.7, 133.3) | ||
| Late pregnancy | 29.4 | 12.0 | 29.6 | 17.1 | 11.9 | 60.0 (26.7, 146.7) | ||
| CB | 70.7 | 23.2 | 5.0 | 1.0 | 0.2 | 13.3 (6.7, 26.7) | ||
| Early pregnancy | 70.6 | 24.1 | 4.3 | 0.9 | 0.2 | 0.127 | 13.3 (8.0, 26.7) | 0.166 |
| Mid-pregnancy | 69.1 | 23.6 | 5.9 | 1.3 | 0.1 | 16.7 (10.0, 26.7) | ||
| Late pregnancy | 72.4 | 21.9 | 4.8 | 0.7 | 0.3 | 13.3 (6.7, 26.7) | ||
| PFJ | 59.1 | 28.7 | 9.4 | 2.2 | 0.6 | 16.7 (13.3, 40.0) | ||
| Early pregnancy | 56.6 | 31.9 | 8.9 | 2.0 | 0.7 | 0.008 | 16.7 (13.3, 33.3) | 0.831 |
| Mid-pregnancy | 59.1 | 27.8 | 10.6 | 1.9 | 0.6 | 16.7 (13.3, 53.3) | ||
| Late pregnancy | 61.7 | 26.2 | 8.7 | 2.8 | 0.6 | 16.7 (13.3, 53.3) | ||
| FJ | 78.9 | 16.9 | 3.0 | 1.0 | 0.3 | 13.3 (6.7, 26.7) | ||
| Early pregnancy | 77.8 | 17.7 | 3.1 | 1.1 | 0.4 | 0.784 | 13.3 (6.7, 33.3) | 0.202 |
| Mid-pregnancy | 79.7 | 16.1 | 3.0 | 0.8 | 0.4 | 13.3 (6.7, 25.0) | ||
| Late pregnancy | 79.2 | 16.7 | 2.9 | 1.1 | 0.1 | 13.3 (6.7, 20.0) | ||
| VPB | 79.0 | 13.0 | 5.4 | 1.9 | 0.7 | 16.7 (13.3, 53.3) | ||
| Early pregnancy | 77.5 | 14.1 | 5.6 | 1.8 | 1.0 | 0.059 | 16.7 (13.3, 53.3) | 0.108 |
| Mid-pregnancy | 79.1 | 11.9 | 6.2 | 2.3 | 0.6 | 16.7 (13.3, 53.3) | ||
| Late pregnancy | 80.6 | 12.9 | 4.3 | 1.7 | 0.5 | 16.7 (13.3, 50.0) | ||
| SDB | 61.0 | 16.4 | 14.0 | 6.2 | 2.4 | 26.7 (13.3, 66.7) | ||
| Early pregnancy | 59.5 | 18.3 | 113.9 | 5.8 | 2.5 | 0.124 | 26.7 (13.3, 66.7) | 0.105 |
| Mid-pregnancy | 61.5 | 15.9 | 14.8 | 5.7 | 2.1 | 26.7 (13.3, 66.7) | ||
| Late pregnancy | 61.9 | 15.1 | 13.1 | 7.1 | 2.7 | 26.7 (13.3, 76.7) | ||
| LBB | 72.5 | 17.4 | 7.7 | 1.7 | 0.7 | 13.3 (6.7, 26.7) | ||
| Early pregnancy | 72.5 | 18.3 | 7.1 | 1.5 | 0.7 | 0.325 | 13.3 (6.7, 26.7) | 0.314 |
| Mid-pregnancy | 71.8 | 18.2 | 7.8 | 1.4 | 0.8 | 13.3 (6.7, 26.7) | ||
| Late pregnancy | 73.2 | 15.8 | 8.2 | 2.2 | 0.7 | 13.3 (6.7, 26.7) | ||
| STB | 68.3 | 24.1 | 6.7 | 0.7 | 0.2 | 20.0 (13.3, 33.3) | ||
| Early pregnancy | 67.3 | 24.1 | 7.4 | 0.9 | 0.4 | 0.253 | 20.0 (13.3, 33.3) | 0.494 |
| Mid-pregnancy | 69.7 | 23.2 | 6.3 | 0.7 | 0.1 | 20.0 (13.3, 33.3) | ||
| Late pregnancy | 68.1 | 24.9 | 6.3 | 0.6 | 0.1 | 20.0 (13.3, 33.3) | ||
| NSS | 86.5 | 10.3 | 2.5 | 0.3 | 0.4 | 16.7 (10.0, 33.3) | ||
| Early pregnancy | 84.9 | 11.8 | 2.6 | 0.2 | 0.5 | 0.119 | 13.3 (6.7, 33.3) | 0.297 |
| Mid-pregnancy | 87.1 | 10.0 | 2.1 | 0.5 | 0.3 | 16.7 (10.0, 33.3) | ||
| Late pregnancy | 87.7 | 9.0 | 2.8 | 0.3 | 0.3 | 20.0 (13.3, 33.3) | ||
| Factors | GDM | GH | Miscarriage | PTB | LBW | Macrosomia | SGA | LGA | Birth Weight | |||||||||
|---|---|---|---|---|---|---|---|---|---|---|---|---|---|---|---|---|---|---|
| N (%) | p | N (%) | p | N (%) | p | N (%) | p | N (%) | p | N (%) | p | N (%) | p | N (%) | p | g (Mean ± SD) | p | |
| Total | 815 (17.6) | 197 (4.2) | 231 (8.4) | 189 (5.2) | 140 (3.8) | 175 (4.8) | 291 (8.0) | 441 (12.1) | 3264 ± 461 | |||||||||
| TB (SSB and NSS) | ||||||||||||||||||
| Yes | 664 (19.6) | <0.001 | 166 (4.9) | <0.001 | 176 (8.6) | 0.488 | 125 (4.6) | 0.039 | 91 (3.5) | 0.118 | 140 (5.2) | 0.106 | 207 (7.7) | 0.297 | 347 (12.8) | 0.043 | 3236 ± 500 | 0.066 |
| No | 151 (12.2) | 31 (2.5) | 55 (7.8) | 64 (6.8) | 49 (4.9) | 35 (3.7) | 84 (9.0) | 94 (10.0) | 3274 ± 446 | |||||||||
| SSB | ||||||||||||||||||
| Yes | 660 (19.6) | <0.001 | 165 (4.9) | <0.001 | 176 (8.7) | 0.391 | 125 (4.6) | 0.052 | 91 (3.4) | 0.064 | 139 (5.1) | 0.130 | 203 (7.5) | 0.181 | 346 (12.9) | 0.036 | 3234 ± 500 | 0.046 |
| No | 155 (12.3) | 32 (2.5) | 55 (7.7) | 64 (6.7) | 49 (5.1) | 36 (3.8) | 88 (9.2) | 95 (10.0) | 3274 + 445 | |||||||||
| NSS | ||||||||||||||||||
| Yes | 142 (22.8) | 0.001 | 41 (6.6) | 0.008 | 30 (7.2) | 0.334 | 21 (3.8) | 0.123 | 14 (2.5) | 0.078 | 43 (7.8) | 0.013 | 43 (7.8) | 0.872 | 84 (15.1) | 0.068 | 3259 ± 453 | 0.169 |
| No | 673 (16.8) | 156 (3.9) | 201 (8.6) | 168 (5.4) | 126 (4.1) | 132 (4.3) | 248 (8.0) | 457 (11.6) | 3294 ± 502 | |||||||||
| TB Consumption Frequency | Total | Early Pregnancy | Mid- Pregnancy | Late Pregnancy | ||||||||
|---|---|---|---|---|---|---|---|---|---|---|---|---|
| OR | p | 95% CI | OR | p | 95% CI | OR | p | 95%CI | OR | p | 95%CI | |
| GDM | ||||||||||||
| 0 | Reference | Reference | Reference | Reference | ||||||||
| low-frequency | 1.384 | 0.002 | 1.129–1.696 | 1.642 | 0.010 | 1.129–2.389 | 1.965 | <0.001 | 1.348–2.832 | 0.923 | 0.0640 | 0.661–1.291 |
| high-frequency | 2.543 | <0.001 | 2.064–3.314 | 3.693 | <0.001 | 2.516–5.421 | 2.811 | <0.001 | 1.909–4.138 | 1.748 | <0.001 | 1.246–2.452 |
| GH | ||||||||||||
| 0 | Reference | Reference | Reference | Reference | ||||||||
| low-frequency | 1.706 | 0.011 | 1.130–2.575 | 2.201 | 0.088 | 0.889–5.450 | 2.878 | 0.008 | 1.321–6.273 | 1.056 | 0.860 | 0.575–1.942 |
| high-frequency | 2.693 | <0.001 | 1.773–4.091 | 4.117 | 0.002 | 1.656–10.232 | 3.150 | 0.006 | 1.399–7.092 | 2.010 | 0.022 | 1.108–3.648 |
| Miscarriage | ||||||||||||
| 0 | Reference | Reference | Reference | Reference | ||||||||
| low-frequency | 1.202 | 0.288 | 0.856–1.689 | 1.395 | 0.231 | 0.809–2.405 | 0.830 | 0.521 | 0.469–1.467 | 1.189 | 0.646 | 0.568–2.492 |
| high-frequency | 0.836 | 0.369 | 0.566–1.235 | 0.848 | 0.611 | 0.448–1.604 | 0.727 | 0.329 | 0.383–1.379 | 0.919 | 0.839 | 0.404–2.088 |
| PTB | ||||||||||||
| 0 | Reference | Reference | Reference | Reference | ||||||||
| low-frequency | 0.683 | 0.078 | 0.447–1.043 | 0.544 | 0.086 | 0.272–1.089 | 0.723 | 0.397 | 0.342–1.530 | 0.752 | 0.475 | 0.344–1.644 |
| high-frequency | 0.816 | 0.381 | 0.517–1.287 | 0.580 | 0.181 | 0.261–1.288 | 0.837 | 0.671 | 0.369–1.900 | 1.065 | 0.875 | 0.486–2.335 |
| LBW | ||||||||||||
| 0 | Reference | Reference | Reference | Reference | ||||||||
| low-frequency | 0.714 | 0.166 | 0.443–1.151 | 1.128 | 0.774 | 0.496–2.565 | 0.538 | 0.233 | 0.194–1.490 | 0.525 | 0.107 | 0.240–1.149 |
| high-frequency | 0.690 | 0.177 | 0.403–1.182 | 1.307 | 0.562 | 0.528–3.235 | 0.521 | 0.276 | 0.162–1.682 | 0.435 | 0.068 | 0.177–1.064 |
| Macrosomia | ||||||||||||
| 0 | Reference | Reference | Reference | Reference | ||||||||
| low-frequency | 0.961 | 0.879 | 0.573–1.610 | 3.791 | 0.080 | 0.852–16.875 | 0.489 | 0.114 | 0.202–1.187 | 0.891 | 0.777 | 0.401–1.981 |
| high-frequency | 2.143 | 0.003 | 1.304–3.522 | 10.063 | 0.002 | 2.296–44.104 | 1.156 | 0.734 | 0.500–2.673 | 1.819 | 0.129 | 0.839–3.941 |
| SGA | ||||||||||||
| 0 | Reference | Reference | Reference | Reference | ||||||||
| low-frequency | 0.821 | 0.266 | 0.581–1.162 | 0.633 | 0.154 | 0.337–1.187 | 0.998 | 0.995 | 0.527–1.891 | 0.812 | 0.467 | 0.464–1.423 |
| high-frequency | 0.786 | 0.224 | 0.533–1.159 | 0.74 | 0.394 | 0.371–1.478 | 0.552 | 0.149 | 0.246–1.237 | 0.952 | 0.870 | 0.527–1.720 |
| LGA | ||||||||||||
| 0 | Reference | Reference | Reference | Reference | ||||||||
| low-frequency | 1.160 | 0.36 | 0.844–1.593 | 3.26 | 0.009 | 1.339–7.938 | 0.979 | 0.938 | 0.568–1.685 | 0.922 | 0.734 | 0.577–1.473 |
| high-frequency | 1.695 | 0.002 | 1.219–2.356 | 7.153 | <0.001 | 2.917–17.539 | 1.134 | 0.674 | 0.631–2.036 | 1.205 | 0.459 | 0.736–1.972 |
| SSB Consumption Frequency | Total | Early Pregnancy | Mid- Pregnancy | Late Pregnancy | ||||||||
|---|---|---|---|---|---|---|---|---|---|---|---|---|
| OR | p | 95% CI | OR | p | 95% CI | OR | p | 95%CI | OR | p | 95%CI | |
| GDM | ||||||||||||
| 0 | Reference | Reference | Reference | Reference | ||||||||
| low-frequency | 1.478 | <0.001 | 1.199–1.822 | 1.788 | 0.003 | 1.221–2.618 | 2.094 | <0.001 | 1.411–3.107 | 0.984 | 0.928 | 0.700–1.383 |
| high-frequency | 2.578 | <0.001 | 2.064–3.222 | 3.450 | <0.001 | 2.296–5.184 | 3.275 | <0.001 | 2.160–4.965 | 1.756 | 0.002 | 1.225–2.516 |
| GH | ||||||||||||
| 0 | Reference | Reference | Reference | Reference | ||||||||
| low-frequency | 1.789 | 0.008 | 1.164–2.750 | 2.852 | 0.034 | 1.081–7.524 | 2.738 | 0.018 | 1.189–6.306 | 1.062 | 0.851 | 0.568–1.987 |
| high-frequency | 2.797 | <0.001 | 1.788–4.376 | 4.218 | 0.006 | 1.525–11.665 | 3.004 | 0.014 | 1.245–7.249 | 2.381 | 0.006 | 1.278–4.434 |
| Miscarriage | ||||||||||||
| 0 | Reference | Reference | Reference | Reference | ||||||||
| low-frequency | 1.234 | 0.229 | 0.876–1.738 | 1.432 | 0.198 | 0.829–2.475 | 0.922 | 0.782 | 0.520–1.634 | 1.082 | 0.837 | 0.510–2.297 |
| high-frequency | 0.944 | 0.781 | 0.632–1.412 | 0.94 | 0.854 | 0.485–1.822 | 0.854 | 0.637 | 0.443–1.645 | 1.030 | 0.946 | 0.445–2.383 |
| PTB | ||||||||||||
| 0 | Reference | Reference | Reference | Reference | ||||||||
| low-frequency | 0.728 | 0.141 | 0.476–1.112 | 0.578 | 0.124 | 0.288–1.162 | 0.734 | 0.423 | 0.344–1.565 | 0.843 | 0.664 | 0.390–1.824 |
| high-frequency | 0.885 | 0.615 | 0.550–1.423 | 0.808 | 0.609 | 0.358–1.827 | 0.813 | 0.636 | 0.345–1.918 | 1.079 | 0.857 | 0.472–2.468 |
| LBW | ||||||||||||
| 0 | Reference | Reference | Reference | Reference | ||||||||
| low-frequency | 0.669 | 0.100 | 0.415–1.080 | 1.044 | 0.916 | 0.469–2.323 | 0.386 | 0.076 | 0.135–1.104 | 0.569 | 0.160 | 0.259–1.251 |
| high-frequency | 0.767 | 0.343 | 0.444–1.326 | 1.413 | 0.459 | 0.565–3.533 | 0.489 | 0.232 | 0.151–1.582 | 0.612 | 0.287 | 0.248–1.511 |
| Macrosomia | ||||||||||||
| 0 | Reference | Reference | Reference | Reference | ||||||||
| low-frequency | 1.060 | 0.823 | 0.636–1.766 | 4.234 | 0.057 | 0.957–18.728 | 0.548 | 0.180 | 0.227–1.320 | 0.991 | 0.982 | 0.453–2.169 |
| high-frequency | 1.678 | 0.057 | 0.984–2.861 | 8.278 | 0.006 | 1.821–37.627 | 0.819 | 0.678 | 0.320–2.100 | 1.484 | 0.351 | 0.647–3.404 |
| SGA | ||||||||||||
| 0 | Reference | Reference | Reference | Reference | ||||||||
| low-frequency | 0.740 | 0.091 | 0.522–1.049 | 0.576 | 0.087 | 0.307–1.083 | 0.779 | 0.444 | 0.412–1.475 | 0.822 | 0.497 | 0.468–1.445 |
| high-frequency | 0.814 | 0.310 | 0.547–1.211 | 0.766 | 0.465 | 0.375–1.566 | 0.523 | 0.116 | 0.233–1.173 | 1.095 | 0.772 | 0.593–2.020 |
| LGA | ||||||||||||
| 0 | Reference | Reference | Reference | Reference | ||||||||
| low-frequency | 1.250 | 0.168 | 0.910–1.716 | 3.777 | 0.003 | 1.558–9.156 | 1.02 | 0.944 | 0.589–1.768 | 0.981 | 0.936 | 0.615–1.564 |
| high-frequency | 1.476 | 0.029 | 1.041–2.094 | 6.02 | <0.001 | 2.387–15.182 | 1.002 | 0.996 | 0.538–1.867 | 1.084 | 0.764 | 0.641–1.831 |
| NSS Consumption Frequency | Total | Early Pregnancy | Mid- Pregnancy | Late Pregnancy | ||||||||
|---|---|---|---|---|---|---|---|---|---|---|---|---|
| OR | p | 95% CI | OR | p | 95% CI | OR | p | 95%CI | OR | p | 95%CI | |
| GDM | ||||||||||||
| 0 | Reference | Reference | Reference | Reference | ||||||||
| low-frequency | 1.181 | 0.134 | 0.950–1.469 | 1.178 | 0.365 | 0.826–1.680 | 1.176 | 0.409 | 0.800–1.728 | 1.18 | 0.424 | 0.787–1.770 |
| high-frequency | 1.771 | 0.130 | 0.844–3.712 | 3.970 | 0.022 | 1.222–12.895 | 0.599 | 0.511 | 0.130–2.76 | 2.123 | 0.317 | 0.486–9.285 |
| GH | ||||||||||||
| 0 | Reference | Reference | Reference | Reference | ||||||||
| low-frequency | 1.283 | 0.201 | 0.875–1.880 | 1.057 | 0.886 | 0.495–2.256 | 1.828 | 0.052 | 0.996–3.356 | 1.028 | 0.936 | 0.527–2.005 |
| high-frequency | 2.381 | 0.115 | 0.810–6.997 | 4.791 | 0.057 | 0.957–23.996 | 1.571 | 0.675 | 0.191–12.923 | 1.264 | 0.834 | 0.141–11.333 |
| Miscarriage | ||||||||||||
| 0 | Reference | Reference | Reference | Reference | ||||||||
| low-frequency | 0.808 | 0.315 | 0.533–1.225 | 0.869 | 0.647 | 0.477–1.584 | 0.515 | 0.12 | 0.224–1.188 | 1.207 | 0.66 | 0.522–2.788 |
| high-frequency | 0.365 | 0.329 | 0.048–2.760 | 0.68 | 0.719 | 0.083–5.585 | /* | /* | /* | /* | /* | /* |
| PTB | ||||||||||||
| 0 | Reference | Reference | Reference | Reference | ||||||||
| low-frequency | 0.838 | 0.544 | 0.474–1.483 | 0.516 | 0.231 | 0.175–1.524 | 1.231 | 0.663 | 0.484–3.133 | 0.827 | 0.71 | 0.303–2.253 |
| high-frequency | /* | /* | /* | /* | /* | /* | /* | /* | /* | /* | /* | /* |
| LBW | ||||||||||||
| 0 | Reference | Reference | Reference | Reference | ||||||||
| low-frequency | 0.655 | 0.246 | 0.320–1.339 | 0.67 | 0.43 | 0.248–1.812 | 1.721 | 0.425 | 0.454–6.526 | 0.195 | 0.114 | 0.026–1.481 |
| high-frequency | /* | /* | /* | /* | /* | /* | /* | /* | /* | /* | /* | /* |
| Macrosomia | ||||||||||||
| 0 | Reference | Reference | Reference | Reference | ||||||||
| low-frequency | 1.122 | 0.674 | 0.657–1.917 | 1.181 | 0.699 | 0.508–2.743 | 0.562 | 0.448 | 0.127–2.486 | 1.459 | 0.37 | 0.639–3.330 |
| high-frequency | 6.581 | <0.001 | 2.796–13.824 | 6.191 | 0.002 | 2.505–12.478 | 17.924 | <0.001 | 4.188–74.016 | 6.427 | 0.117 | 0.629–65.638 |
| SGA | ||||||||||||
| 0 | Reference | Reference | Reference | Reference | ||||||||
| low-frequency | 1.050 | 0.822 | 0.685–1.609 | 1.097 | 0.802 | 0.532–2.265 | 1.257 | 0.580 | 0.558–2.833 | 0.819 | 0.585 | 0.399–1.679 |
| high-frequency | 0.446 | 0.434 | 0.059–3.364 | 0.992 | 0.994 | 0.118–8.332 | /* | /* | /* | /* | /* | /* |
| LGA | ||||||||||||
| 0 | Reference | Reference | Reference | Reference | ||||||||
| low-frequency | 1.031 | 0.866 | 0.726–1.464 | 1.052 | 0.871 | 0.571–1.936 | 0.725 | 0.398 | 0.344–1.529 | 1.223 | 0.469 | 0.709–2.109 |
| high-frequency | 7.554 | <0.001 | 3.372–16.921 | 7.253 | 0.002 | 2.010–26.171 | 16.746 | <0.001 | 3.847–72.893 | 1.759 | 0.617 | 0.192–16.145 |
Disclaimer/Publisher’s Note: The statements, opinions and data contained in all publications are solely those of the individual author(s) and contributor(s) and not of MDPI and/or the editor(s). MDPI and/or the editor(s) disclaim responsibility for any injury to people or property resulting from any ideas, methods, instructions or products referred to in the content. |
© 2024 by the authors. Licensee MDPI, Basel, Switzerland. This article is an open access article distributed under the terms and conditions of the Creative Commons Attribution (CC BY) license (https://creativecommons.org/licenses/by/4.0/).
Share and Cite
Wang, Z.; Cui, X.; Yu, H.; Chan, E.-M.; Shi, Z.; Shi, S.; Shen, L.; Sun, Z.; Song, Q.; Lu, W.; et al. Association of Beverage Consumption during Pregnancy with Adverse Maternal and Offspring Outcomes. Nutrients 2024, 16, 2412. https://doi.org/10.3390/nu16152412
Wang Z, Cui X, Yu H, Chan E-M, Shi Z, Shi S, Shen L, Sun Z, Song Q, Lu W, et al. Association of Beverage Consumption during Pregnancy with Adverse Maternal and Offspring Outcomes. Nutrients. 2024; 16(15):2412. https://doi.org/10.3390/nu16152412
Chicago/Turabian StyleWang, Zhengyuan, Xin Cui, Huiting Yu, Ee-Mien Chan, Zehuan Shi, Shuwen Shi, Liping Shen, Zhuo Sun, Qi Song, Wei Lu, and et al. 2024. "Association of Beverage Consumption during Pregnancy with Adverse Maternal and Offspring Outcomes" Nutrients 16, no. 15: 2412. https://doi.org/10.3390/nu16152412