

Diagnostic Accuracy of IgA Anti-Transglutaminase Assessed by Chemiluminescence: A Systematic Review and Meta-Analysis

 ,
, 

Highlights
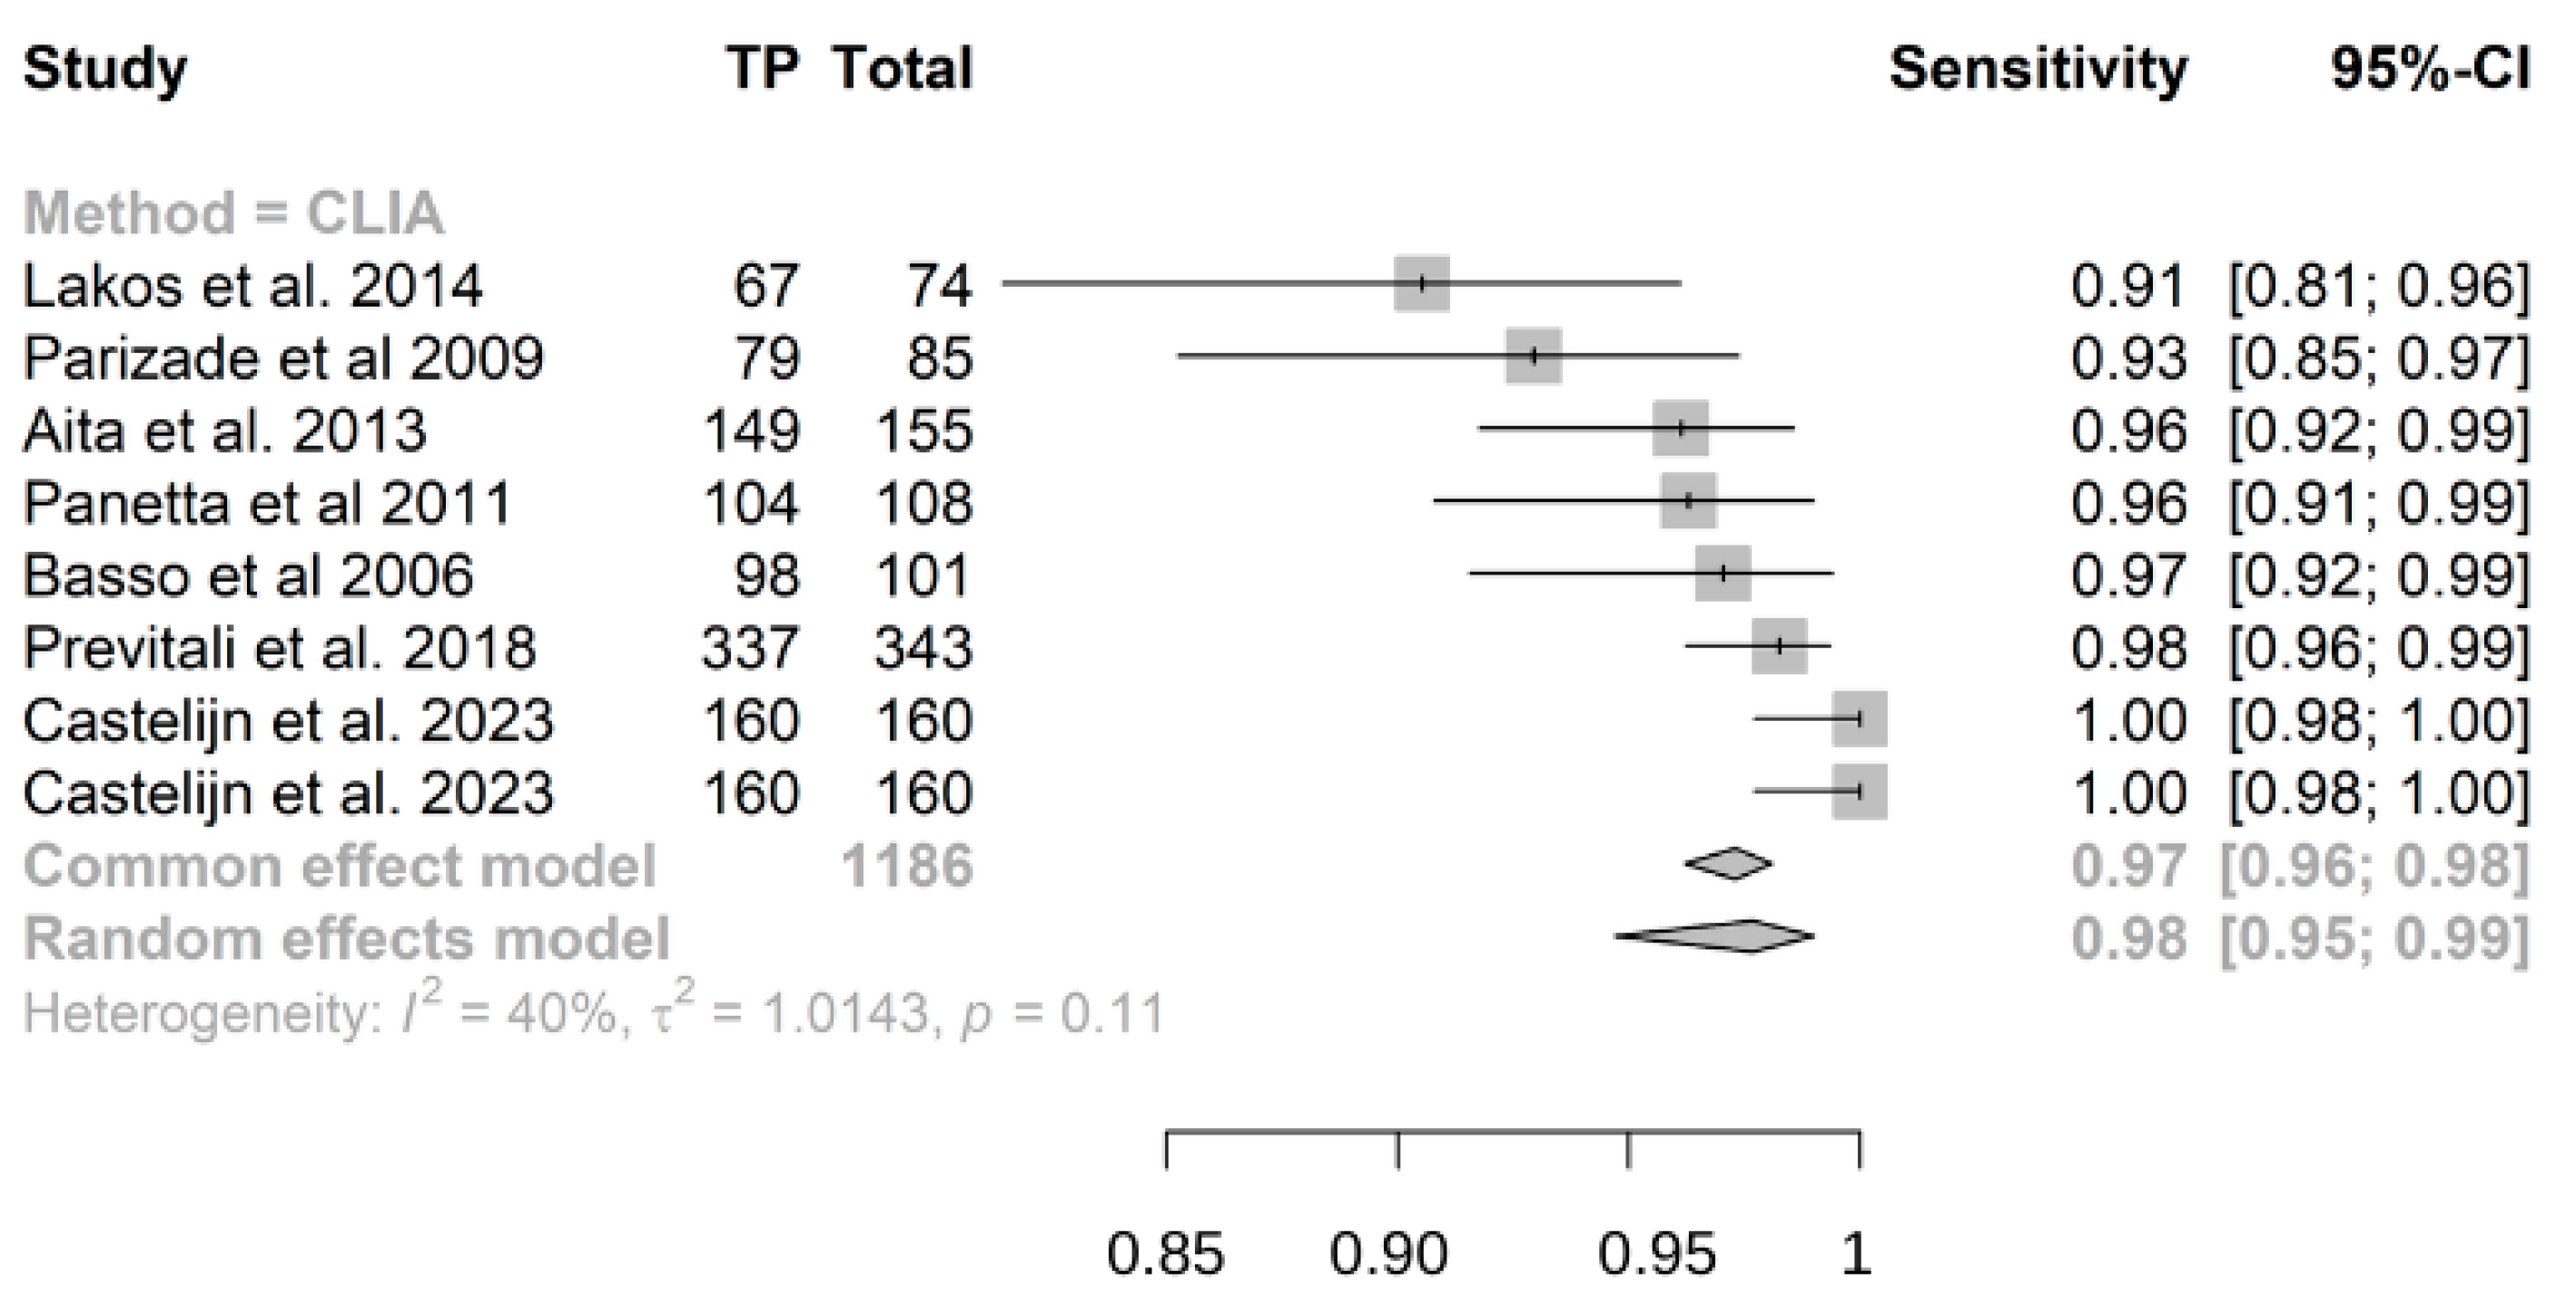
- Chemiluminescence immunoassay (CLIA) exhibits high sensitivity (0.98) and specificity (0.97) for detecting IgA anti-transglutaminase (atTG IgA) in celiac disease (CD) diagnosis.
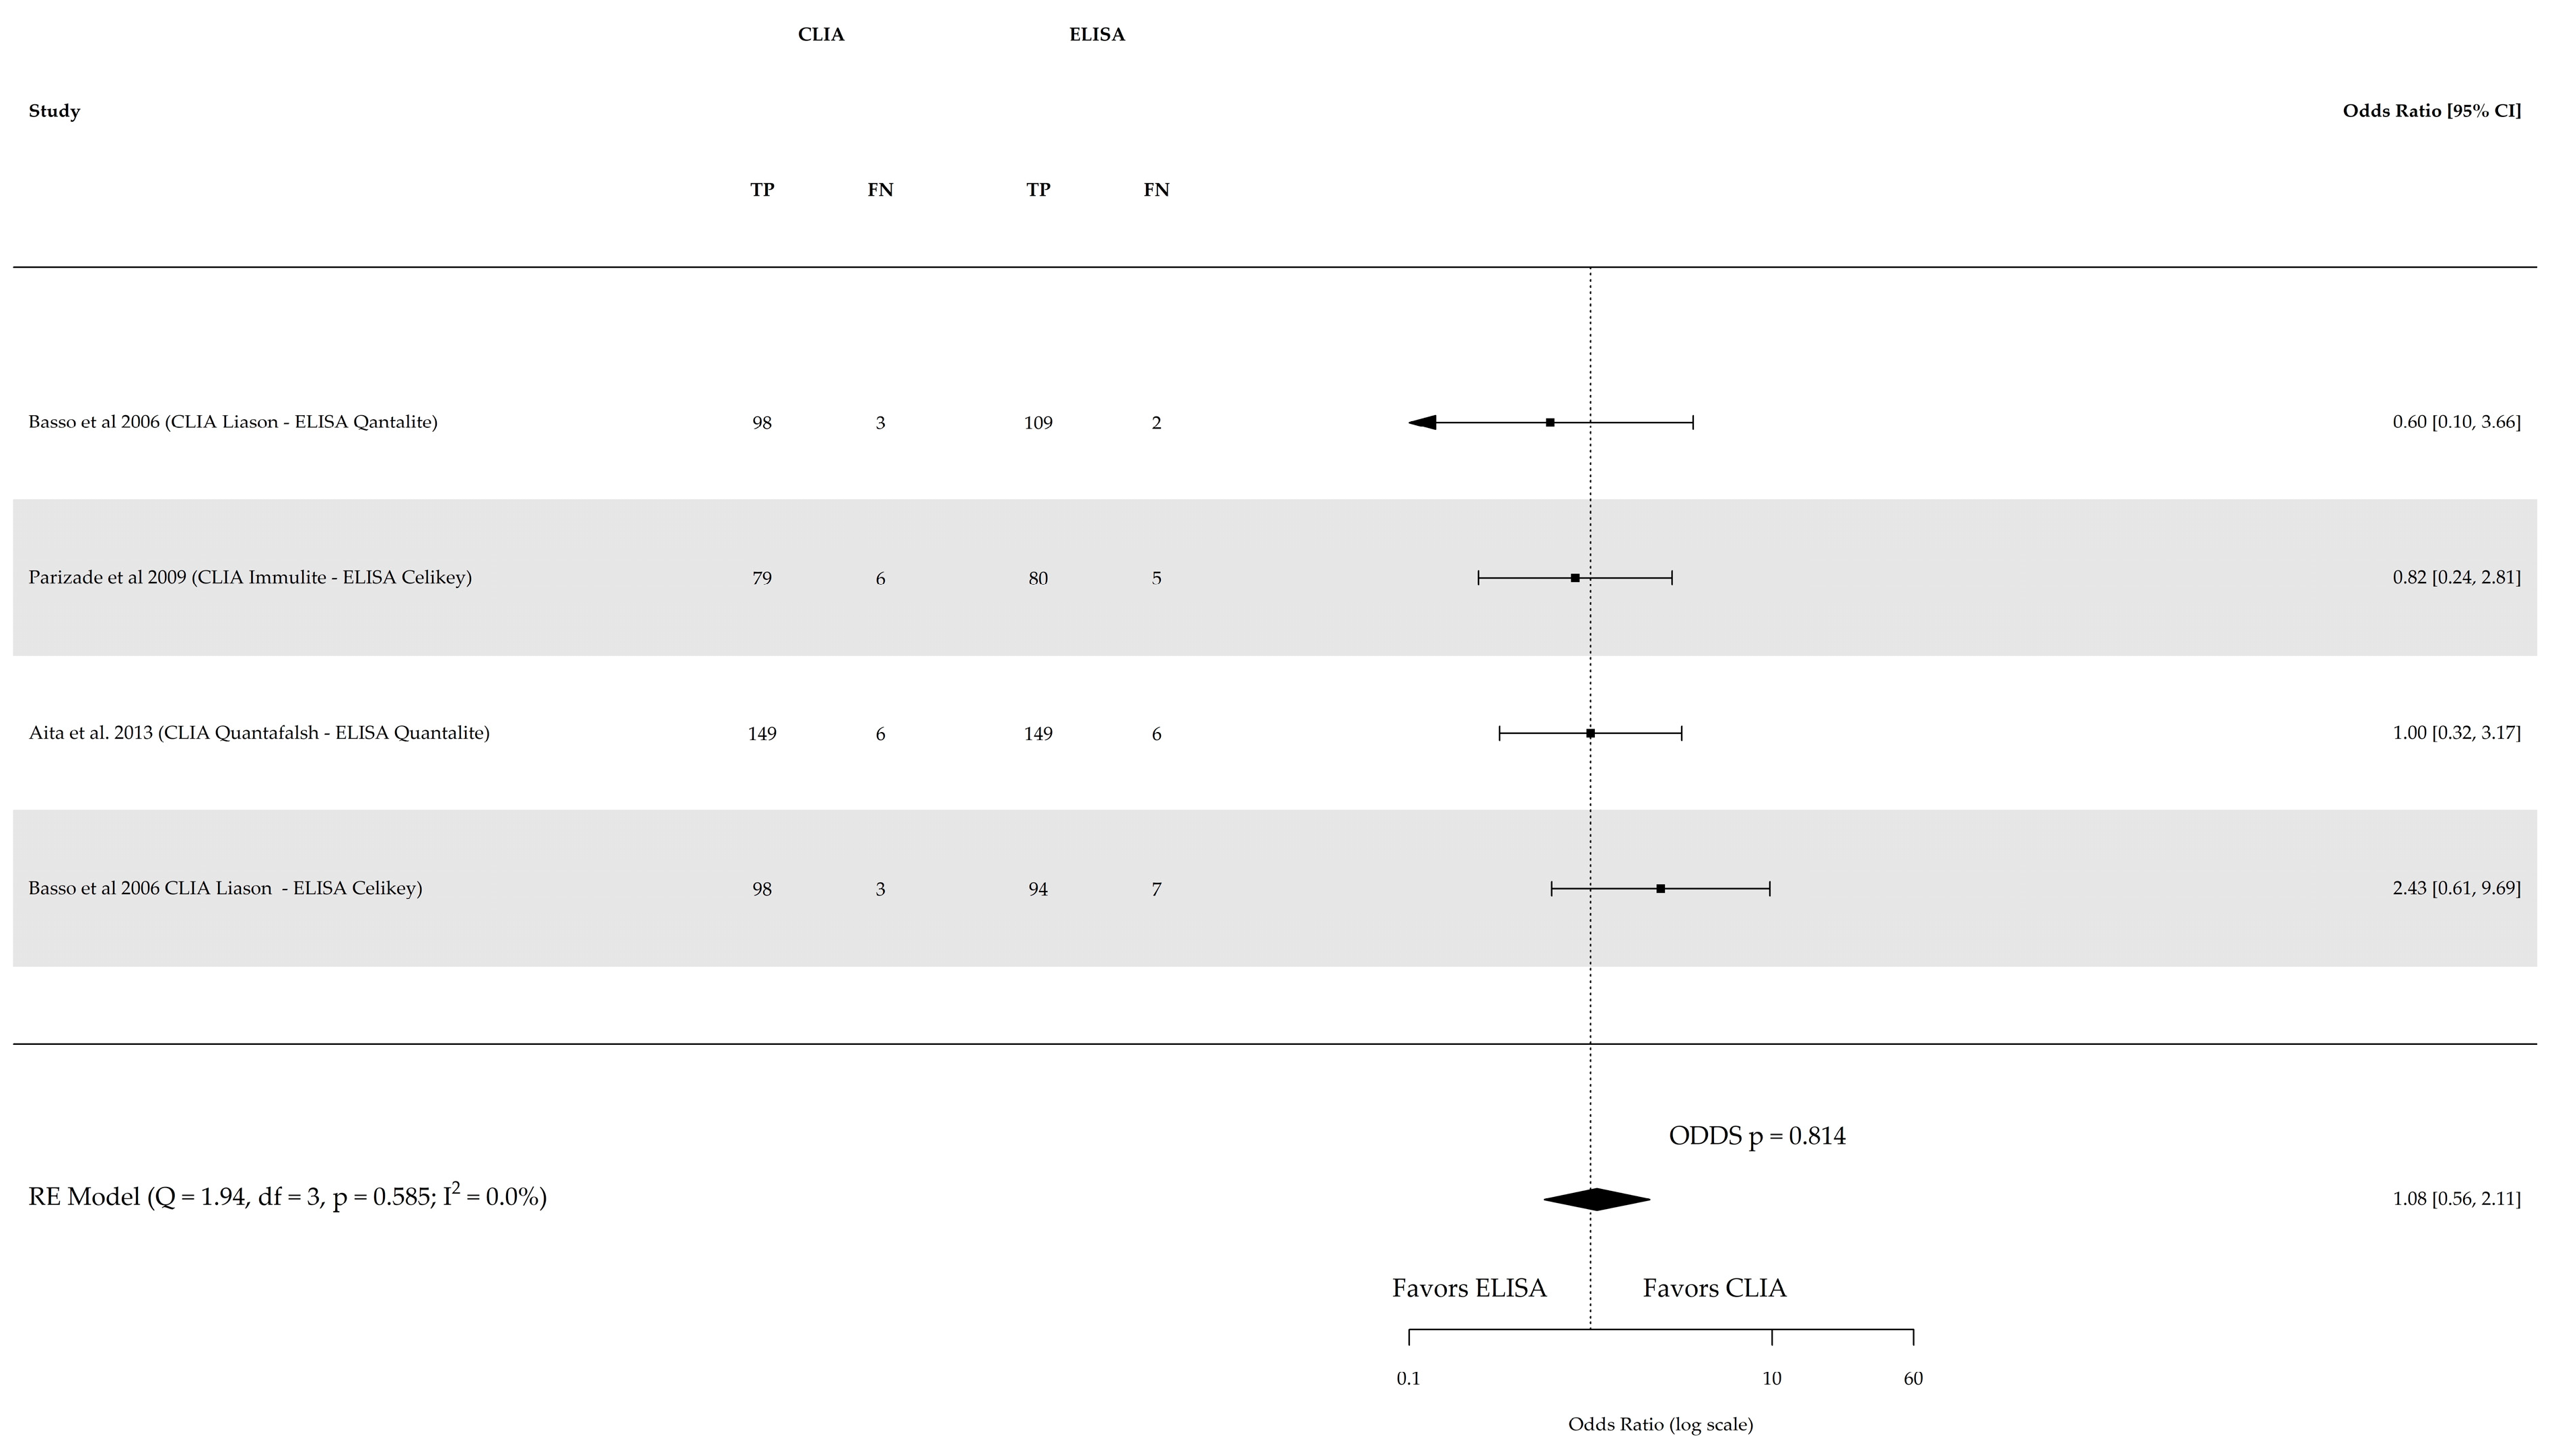
- There is no statistically significant difference in diagnostic sensitivity for celiac disease between the CLIA, enzyme-linked immunosorbent assay (ELISA), and fluorescence enzyme immunoassay (FEIA) methods when detecting atTG IgA. However, FEIA demonstrates higher specificity compared to CLIA for the same purpose.
- The study found conflicting conclusions regarding the effectiveness of using a 10x upper limit of normal antibody cut-off value to determine the need for biopsy.
- The authors suggest a potential need to revise existing guidelines to standardize atTG IgA assays and minimize misdiagnosis risk.
Abstract
1. Introduction
2. Materials and Methods
2.1. Protocol
2.2. Eligibility Criteria
2.3. Information Sources and Search
2.4. Study Selection
2.5. Data Collection Process
2.6. Definitions for Data Extraction
2.7. Risk of Bias and Applicability
2.8. Diagnostic Accuracy Measures
2.9. Meta-Analysis
3. Results
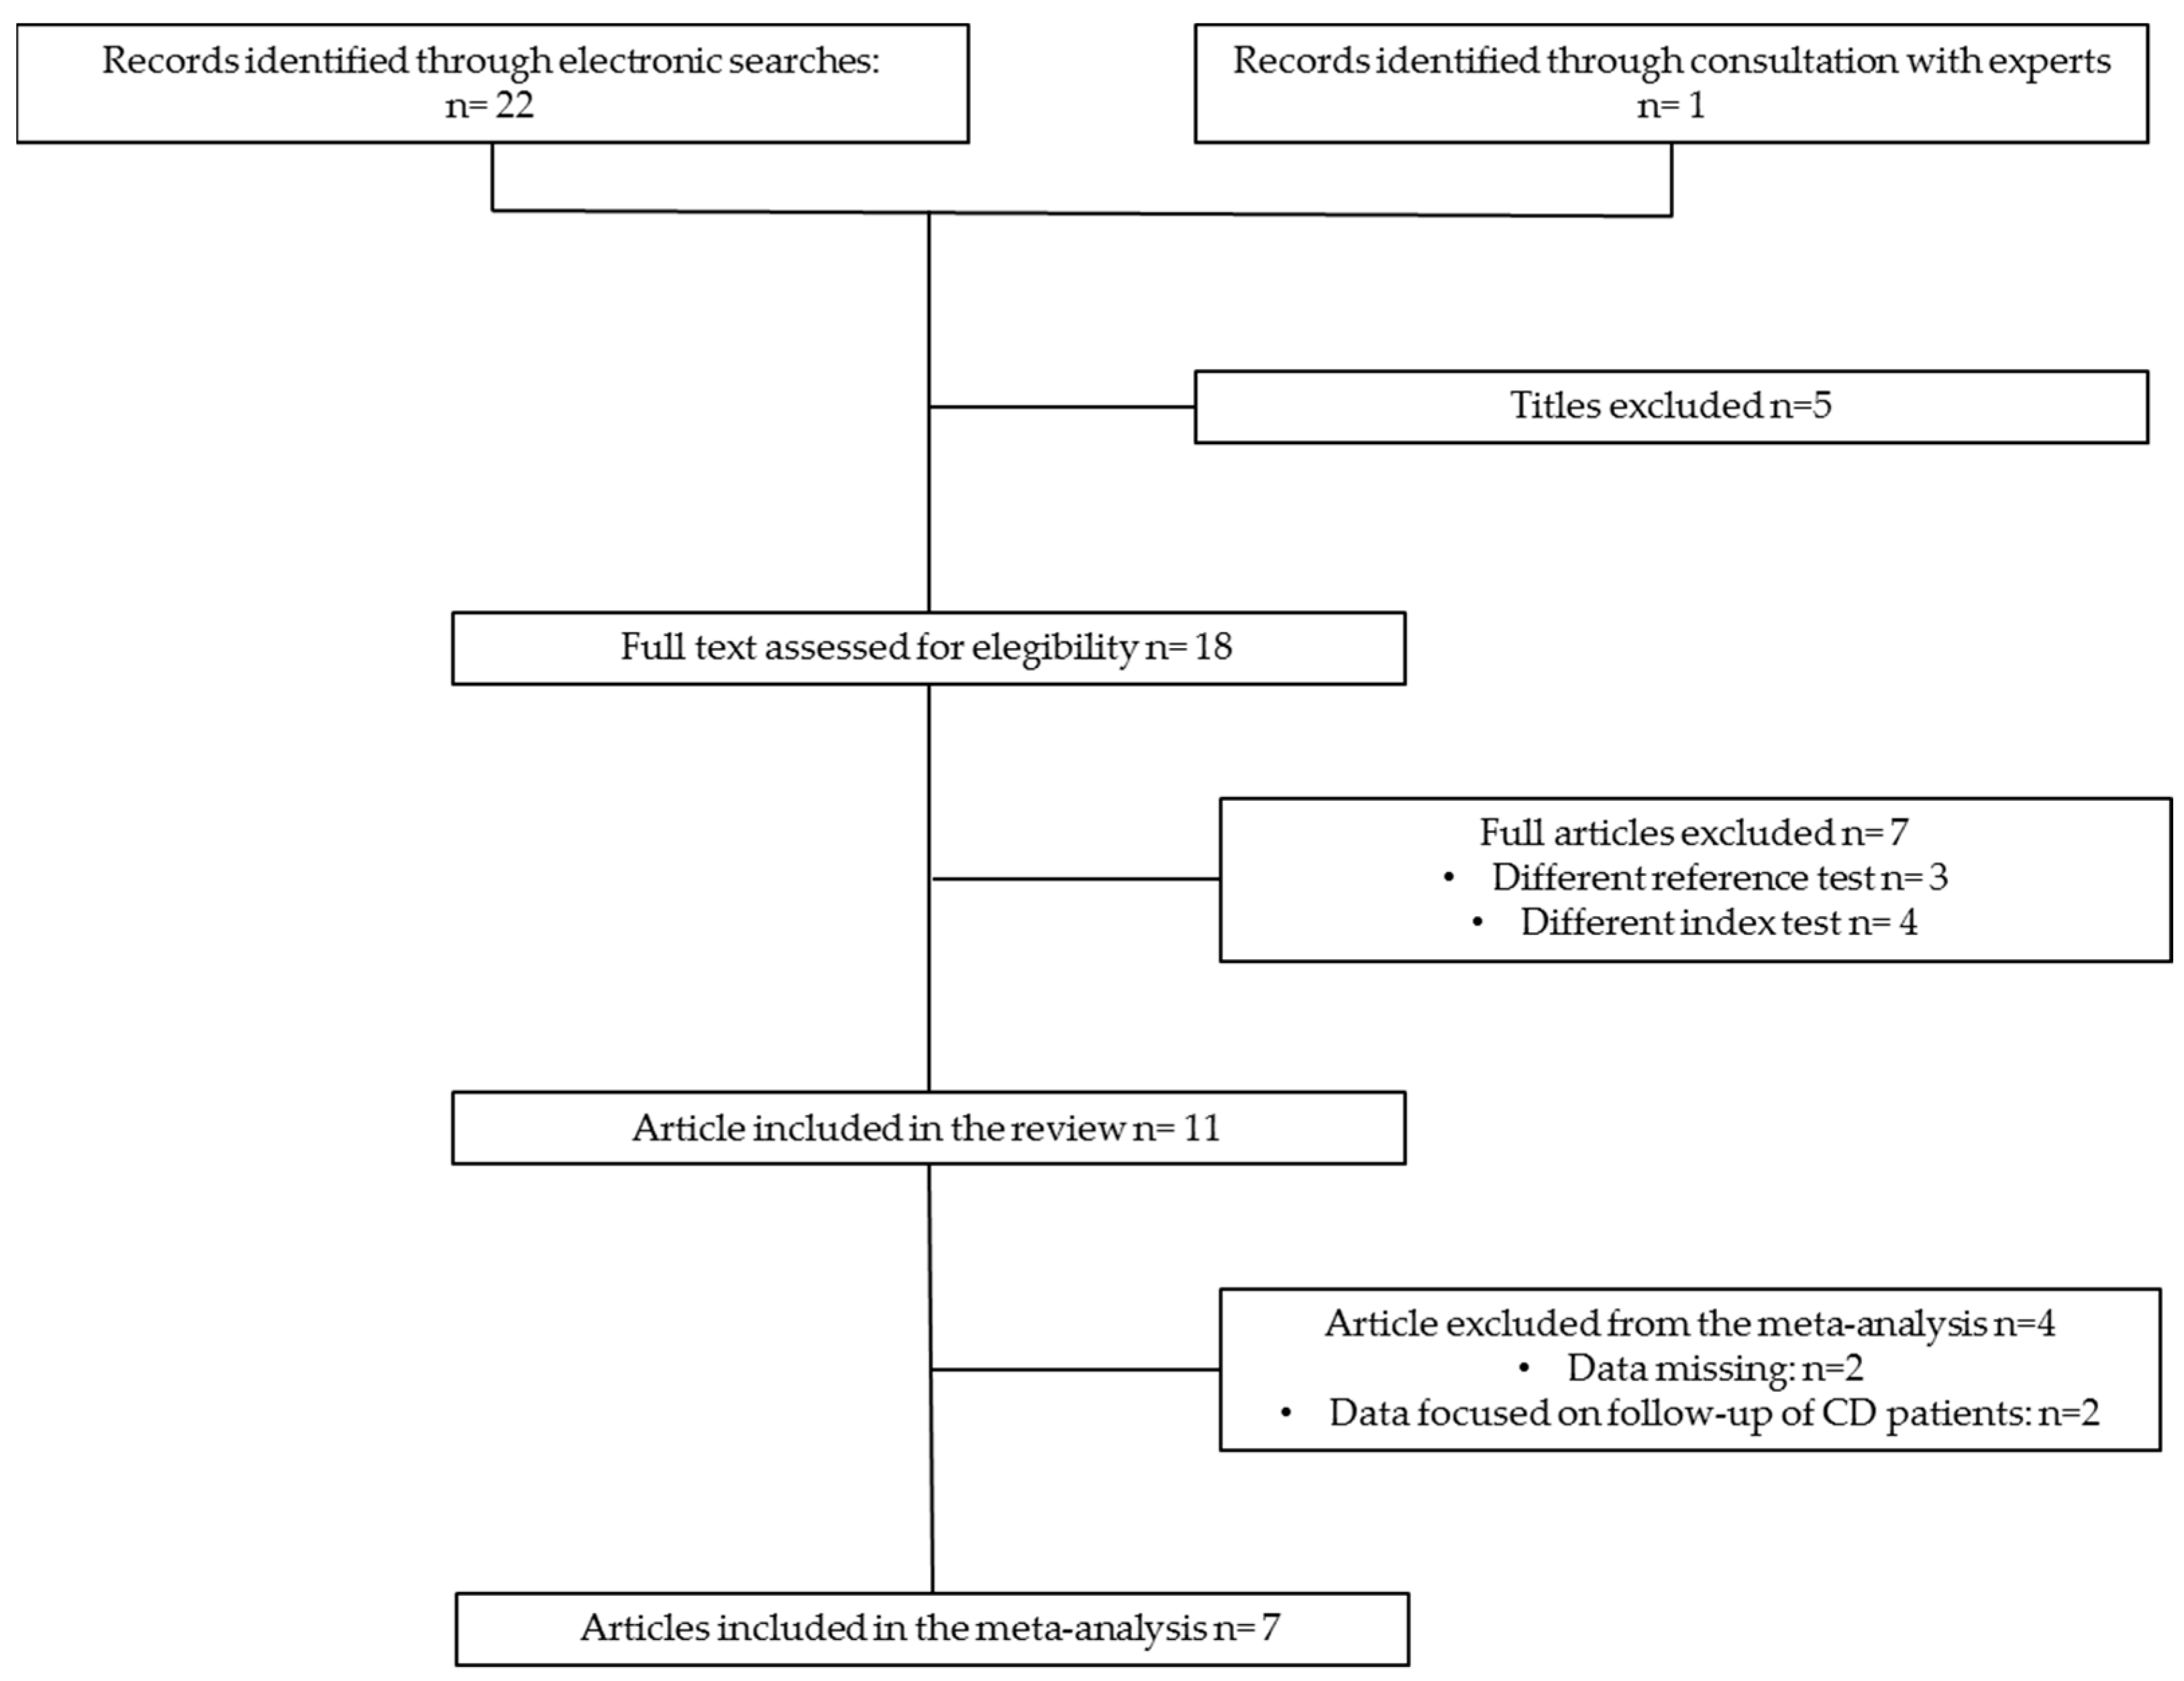
3.1. Study Selection
3.2. Study Characteristics
3.3. Results of Single Studies
4. Discussion
5. Conclusions
Supplementary Materials
Author Contributions
Funding
Data Availability Statement
Conflicts of Interest
References
- Catassi, C.; Verdu, E.F.; Bai, J.C.; Lionetti, E. Coeliac Disease. Lancet 2022, 399, 2413–2426. [Google Scholar] [CrossRef] [PubMed]
- Karell, K.; Louka, A.S.; Moodie, S.J.; Ascher, H.; Clot, F.; Greco, L.; Ciclitira, P.J.; Sollid, L.M.; Partanen, J. Hla Types in Celiac Disease Patients Not Carrying the DQA1*05-DQB1*02 (DQ2) Heterodimer: Results from the European Genetics Cluster on Celiac Disease. Hum. Immunol. 2003, 64, 469–477. [Google Scholar] [CrossRef] [PubMed]
- Ramakrishna, B.S.; Makharia, G.K.; Chetri, K.; Dutta, S.; Mathur, P.; Ahuja, V.; Amarchand, R.; Balamurugan, R.; Chowdhury, S.D.; Daniel, D.; et al. Prevalence of Adult Celiac Disease in India: Regional Variations and Associations. Am. J. Gastroenterol. 2016, 111, 115–123. [Google Scholar] [CrossRef] [PubMed]
- Levinson-Castiel, R.; Eliakim, R.; Shinar, E.; Perets, T.-T.; Layfer, O.; Levhar, N.; Schvimer, M.; Marderfeld, L.; Ben-Horin, S.; Shamir, R. Rising Prevalence of Celiac Disease Is Not Universal and Repeated Testing Is Needed for Population Screening. United Eur. Gastroenterol. J. 2019, 7, 412–418. [Google Scholar] [CrossRef] [PubMed]
- Fukunaga, M.; Ishimura, N.; Fukuyama, C.; Izumi, D.; Ishikawa, N.; Araki, A.; Oka, A.; Mishiro, T.; Ishihara, S.; Maruyama, R.; et al. Celiac Disease in Non-Clinical Populations of Japan. J. Gastroenterol. 2018, 53, 208–214. [Google Scholar] [CrossRef] [PubMed]
- Lebwohl, B.; Rubio-Tapia, A. Epidemiology, Presentation, and Diagnosis of Celiac Disease. Gastroenterology 2021, 160, 63–75. [Google Scholar] [CrossRef] [PubMed]
- Therrien, A.; Kelly, C.P.; Silvester, J.A. Celiac Disease: Extraintestinal Manifestations and Associated Conditions. J. Clin. Gastroenterol. 2020, 54, 8–21. [Google Scholar] [CrossRef] [PubMed]
- Aljada, B.; Zohni, A.; El-Matary, W. The Gluten-Free Diet for Celiac Disease and Beyond. Nutrients 2021, 13, 3993. [Google Scholar] [CrossRef]
- Comino, I.; Sousa, C. Advances in Celiac Disease and Gluten-Free Diet. Nutrients 2022, 14, 570. [Google Scholar] [CrossRef] [PubMed]
- Catassi, G.N.; Pulvirenti, A.; Monachesi, C.; Catassi, C.; Lionetti, E. Diagnostic Accuracy of IgA Anti-Transglutaminase and IgG Anti-Deamidated Gliadin for Diagnosis of Celiac Disease in Children under Two Years of Age: A Systematic Review and Meta-Analysis. Nutrients 2021, 14, 7. [Google Scholar] [CrossRef]
- Dieterich, W.; Ehnis, T.; Bauer, M.; Donner, P.; Volta, U.; Riecken, E.O.; Schuppan, D. Identification of Tissue Transglutaminase as the Autoantigen of Celiac Disease. Nat. Med. 1997, 3, 797–801. [Google Scholar] [CrossRef] [PubMed]
- Giersiepen, K.; Lelgemann, M.; Stuhldreher, N.; Ronfani, L.; Husby, S.; Koletzko, S.; Korponay-Szabó, I.R.; ESPGHAN Working Group on Coeliac Disease Diagnosis. Accuracy of Diagnostic Antibody Tests for Coeliac Disease in Children: Summary of an Evidence Report. J. Pediatr. Gastroenterol. Nutr. 2012, 54, 229–241. [Google Scholar] [CrossRef]
- Mahler, M.; Radice, A.; Yang, W.; Bentow, C.; Seaman, A.; Bianchi, L.; Sinico, R.A. Development and Performance Evaluation of Novel Chemiluminescence Assays for Detection of Anti-PR3 and Anti-MPO Antibodies. Clin. Chim. Acta 2012, 413, 719–726. [Google Scholar] [CrossRef]
- Horton, R.K.; Hagen, C.E.; Snyder, M.R. Pediatric Celiac Disease: A Review of Diagnostic Testing and Guideline Recommendations. J. Appl. Lab. Med. 2022, 7, 294–304. [Google Scholar] [CrossRef]
- Mahler, M.; Bentow, C.; Serra, J.; Fritzler, M.J. Detection of Autoantibodies Using Chemiluminescence Technologies. Immunopharmacol. Immunotoxicol. 2016, 38, 14–20. [Google Scholar] [CrossRef] [PubMed]
- Ma, T.; Zhang, M.; Wan, Y.; Cui, Y.; Ma, L. Preparation of an Acridinium Ester-Labeled Antibody and Its Application in GoldMag Nanoparticle-Based, Ultrasensitive Chemiluminescence Immunoassay for the Detection of Human Epididymis Protein 4. Micromachines 2017, 8, 149. [Google Scholar] [CrossRef]
- Parizade, M.; Bujanover, Y.; Weiss, B.; Nachmias, V.; Shainberg, B. Performance of Serology Assays for Diagnosing Celiac Disease in a Clinical Setting. Clin. Vaccine Immunol. 2009, 16, 1576–1582. [Google Scholar] [CrossRef]
- Husby, S.; Koletzko, S.; Korponay-Szabó, I.; Kurppa, K.; Mearin, M.L.; Ribes-Koninckx, C.; Shamir, R.; Troncone, R.; Auricchio, R.; Castillejo, G.; et al. European Society Paediatric Gastroenterology, Hepatology and Nutrition Guidelines for Diagnosing Coeliac Disease 2020. J. Pediatr. Gastroenterol. Nutr. 2020, 70, 141–156. [Google Scholar] [CrossRef]
- Salameh, J.-P.; Bossuyt, P.M.; McGrath, T.A.; Thombs, B.D.; Hyde, C.J.; Macaskill, P.; Deeks, J.J.; Leeflang, M.; Korevaar, D.A.; Whiting, P.; et al. Preferred Reporting Items for Systematic Review and Meta-Analysis of Diagnostic Test Accuracy Studies (PRISMA-DTA): Explanation, Elaboration, and Checklist. BMJ 2020, 370, m2632. [Google Scholar] [CrossRef]
- Rethlefsen, M.L.; Kirtley, S.; Waffenschmidt, S.; Ayala, A.P.; Moher, D.; Page, M.J.; Koffel, J.B.; PRISMA-S Group; Blunt, H.; Brigham, T.; et al. PRISMA-S: An Extension to the PRISMA Statement for Reporting Literature Searches in Systematic Reviews. Syst. Rev. 2021, 10, 39. [Google Scholar] [CrossRef]
- Oberhuber, G.; Granditsch, G.; Vogelsang, H. The Histopathology of Coeliac Disease: Time for a Standardized Report Scheme for Pathologists. Eur. J. Gastroenterol. Hepatol. 1999, 11, 1185. [Google Scholar] [CrossRef] [PubMed]
- Whiting, P.F. QUADAS-2: A Revised Tool for the Quality Assessment of Diagnostic Accuracy Studies. Ann. Intern. Med. 2011, 155, 529. [Google Scholar] [CrossRef] [PubMed]
- Fleiss, J. Review Papers: The Statistical Basis of Meta-Analysis. Stat. Methods Med. Res. 1993, 2, 121–145. [Google Scholar] [CrossRef] [PubMed]
- Basso, D.; Guariso, G.; Fasolo, M.; Pittoni, M.; Schiavon, S.; Fogar, P.; Greco, E.; Navaglia, F.; Zambon, C.; Plebani, M. A New Indirect Chemiluminescent Immunoassay to Measure Anti–Tissue Transglutaminase Antibodies. J. Pediatr. Gastroenterol. Nutr. 2006, 43, 613–618. [Google Scholar] [CrossRef] [PubMed]
- Aita, A.; Rossi, E.; Basso, D.; Guariso, G.; Bozzato, D.; Pelloso, M.; Pescarin, M.; Zambon, C.-F.; Navaglia, F.; Greco, E.; et al. Chemiluminescence and ELISA-Based Serum Assays for Diagnosing and Monitoring Celiac Disease in Children: A Comparative Study. Clin. Chim. Acta 2013, 421, 202–207. [Google Scholar] [CrossRef] [PubMed]
- Castelijn, D.A.R.; Mulder, A.H.L.; Van Der Pol, P.; Hollander, J.C.; Kuiper, T.; Bijnens, C.; Damoiseaux, J.; Bontkes, H.J. Multicenter Study to Compare the Diagnostic Performance of CLIA vs. FEIA Transglutaminase IgA Assays for the Diagnosis of Celiac Disease. Clin. Chem. Lab. Med. CCLM 2023, 61, 1446–1454. [Google Scholar] [CrossRef] [PubMed]
- Lakos, G.; Norman, G.L.; Mahler, M.; Martis, P.; Bentow, C.; Santora, D.; Fasano, A. Analytical and Clinical Comparison of Two Fully Automated Immunoassay Systems for the Diagnosis of Celiac Disease. J. Immunol. Res. 2014, 2014, 371263. [Google Scholar] [CrossRef] [PubMed]
- Previtali, G.; Licini, L.; D’Antiga, L.; Marseglia, A.; Ravasio, R.; Nembrini, F.; Greco, S.; Sonzogni, A.; Azzarà, G.; Ravelli, P.; et al. Celiac Disease Diagnosis Without Biopsy: Is a 10× ULN Antitransglutaminase Result Suitable for a Chemiluminescence Method? J. Pediatr. Gastroenterol. Nutr. 2018, 66, 645–650. [Google Scholar] [CrossRef] [PubMed]
- Panetta, F.; Torre, G.; Colistro, F.; Ferretti, F.; Daniele, A.; Diamanti, A. Clinical Accuracy of Anti-tissue Transglutaminase as Screening Test for Celiac Disease under 2 Years. Acta Paediatr. 2011, 100, 728–731. [Google Scholar] [CrossRef]
- Belei, O.; Iacob, E.R.; Iacob, D.; Amaricai, E.; Marginean, O. Chemiluminescent Immunoassay versus Enzyme Linked Immunosorbent Assays for IgA Anti-Tissue Transglutaminase Antibodies Assessment in Celiac Disease Children. Rev. Chim. 2020, 71, 45–51. [Google Scholar] [CrossRef]
- Sansotta, N.; Alessio, M.G.; Norsa, L.; Previtali, G.; Ferrari, A.; Guerra, G.; D’Antiga, L. Trend of Antitissue Transglutaminase Antibody Normalization in Children With Celiac Disease Started on Gluten-free Diet: A Comparative Study Between Chemiluminescence and ELISA Serum Assays. J. Pediatr. Gastroenterol. Nutr. 2020, 70, 37–41. [Google Scholar] [CrossRef] [PubMed]
- Mulder, A.H.L.; Castelijn, D.A.R.; Van Der Pol, P.; Vermeer, M.; Hollander, J.C.; Kuiper, T.; Bijnens, C.; Bontkes, H.J.; Damoiseaux, J. Monitoring Patients with Celiac Disease on Gluten Free Diet: Different Outcomes Comparing Three Tissue Transglutaminase IgA Assays. Clin. Chem. Lab. Med. CCLM 2024, 62, 674–681. [Google Scholar] [CrossRef] [PubMed]
- Daves, M.; Cemin, R.; Perkmann, V.; Bernard, P.; Caprioli, G.; Platzgummer, S.; Lippi, G. Fully-Automated, Chemiluminescence IgA and IgG Anti-Tissue Transglutaminase (tTG) Antibodies Serum Assays for the Screening of Celiac Disease. J. Immunol. Methods 2016, 429, 57–59. [Google Scholar] [CrossRef]
- Mearin, M.L.; Agardh, D.; Antunes, H.; Al-toma, A.; Auricchio, R.; Castillejo, G.; Catassi, C.; Ciacci, C.; Discepolo, V.; Dolinsek, J.; et al. ESPGHAN Position Paper on Management and Follow-up of Children and Adolescents With Celiac Disease. J. Pediatr. Gastroenterol. Nutr. 2022, 75, 369–386. [Google Scholar] [CrossRef]
- Silvester, J.A.; Kurada, S.; Szwajcer, A.; Kelly, C.P.; Leffler, D.A.; Duerksen, D.R. Tests for Serum Transglutaminase and Endomysial Antibodies Do Not Detect Most Patients With Celiac Disease and Persistent Villous Atrophy on Gluten-Free Diets: A Meta-Analysis. Gastroenterology 2017, 153, 689–701.e1. [Google Scholar] [CrossRef] [PubMed]


| References | Study Type and Location | Population | Gender (% Female) | Age Range or Median Age | Reference Test | Index Test | Cutoff Values | True Positive | True Negative |
|---|---|---|---|---|---|---|---|---|---|
| Basso et al. 2006 [24] | Retrospective Italy | 204 children: 101 pediatric CD, 103 pediatric controls +31 CD on (GFD). | 61 | 1–15 years | Intestinal biopsy | ELISA (Celikey tTG IgA) | (ROC) 4.4 U/mL | 94/101 | 99/103 |
| ELISA (Quantalite tTG IgA) | (ROC) 48.0 U | 109/111 | 99/103 | ||||||
| CLIA (Liaison tTG IgA) | (ROC) 16.9 AU/mL | 98/101 | 101/103 | ||||||
| Aita et al. 2013 [25] | Retrospective Italy | 321 pediatric participants: 155 CD, 166 controls, +42 CD on (GFD) | 59 | 6 years in CD subjects 10 years in controls | Intestinal biopsy | ELISA (Quantalite tTG IgA) | (ROC) 20 U | 149/155 | 158/166 |
| CLIA (Quantaflash tTG IgA) | (ROC) 16 U | 149/155 | 161/166 | ||||||
| Castelijn et al. 2023 [26] | Retrospective Netherlands | 892 participants: 160 CD patients (95 adults, 65 children) 732 controls (479 adults, 253 children) | R | 18–85 years in adult CD and 0–16 years in pediatric CD | ESPGHAN 2012 guidelines | FEIA (Celikey tTG IgA) | (Ma) 10 U/mL | 147/160 | 731/732 |
| CLIA (Quantaflash tTG IgA) | (Ma) 20 U/mL | 160/160 | 724/732 | ||||||
| CLIA tTG IgA (Euroimmun) | (Ma) 10 U/mL | 160/160 | 721/732 | ||||||
| Lakos et al. 2014 [27] | Retrospective USA | 212 adults: 74 CD and 138 controls | 76 | 19–83 years | Intestinal biopsy | FEIA (Celikey tTG IgA) | (Ma) 7–10 U/mL | 67/74 | 137/138 |
| CLIA (Quantaflash tTG IgA) | (Ma) 20 U/mL | 67/74 | 137/138 | ||||||
| Previtali et al. 2018 [28] | Retrospective Italy | 772 participants: adults and children (343 CD and 429 controls) | 62 | 43 years in adults 9 years in children | Intestinal biopsy | CLIA (Quantaflash tTG IgA) | (Ma) 20 U/mL | 337/343 | 422/429 |
| Parizade et al. 2009 [17] | Prospective Israel | 116 children: 85 CD and 31 controls | 55 | 1–17 years | Intestinal biopsy | CLIA TG IgA (Immulite 2000) | (Ma) 4 U/mL | 79/85 | 23/31 |
| ELISA (Celikey tTG IgA) | (Ma) 5 U/mL | 80/85 | 27/31 | ||||||
| Panetta et al. 2011 [29] | Retrospective Italy | 155 children < 2 years: 108 CD 47 controls | 75 | <2 years | Intestinal biopsy | CLIA (Liason tTG IgA) | (Ma) 8 AU/mL | 104/108 | 43/47 |
| Belei et al. 2020 [30] | Prospective Romania | 75 children: 35 CD 40 controls | R | 2–18 years | Intestinal biopsy | ELISA (Immulisa tTG IgA) | (Ma) >25 EU/mL | R | R |
| CLIA TG IgA (Immulite 2500) | (Ma) >4 U/mL) | R | R | ||||||
| Sansotta et al. 2020 [31] | Retrospective Italy | 260 CD children | R | 5.1 years in ELISA group 7.7 years in CLIA group | Intestinal biopsy | ELISA (Celikey Varelisa IgA) | (Ma) 2.5 U/mL | R | R |
| CLIA (Quantaflash tTG IgA) | (Ma) 20 U/mL | R | R | ||||||
| Mulder et al. 2023 [32] | Retrospective Netherlands | 61 participants: 44 CD adults and 17 CD children | 72 | 18–72 years in adults 0–14 years in children | Intestinal biopsy and ESPGHAN guidelines | FEIA (Celikey tTG IgA) | (Ma) 7 U/mL | R | R |
| CLIA (Quantaflash tTG IgA) | (Ma) 20 U/mL | R | R | ||||||
| CLIA (Euroimmun) | (Ma) 10 U/mL | R | R | ||||||
| Daves et al. [33] | Retrospective Italy | 727 adults (26 CD patients and 701 controls) | 66 | 27 years | Anti-Endomysium antibody (EmA) | CLIA (Quantaflash tTG IgA) | (Ma) 20 U/mL | 26/26 | 698/701 |
Disclaimer/Publisher’s Note: The statements, opinions and data contained in all publications are solely those of the individual author(s) and contributor(s) and not of MDPI and/or the editor(s). MDPI and/or the editor(s) disclaim responsibility for any injury to people or property resulting from any ideas, methods, instructions or products referred to in the content. |
© 2024 by the authors. Licensee MDPI, Basel, Switzerland. This article is an open access article distributed under the terms and conditions of the Creative Commons Attribution (CC BY) license (https://creativecommons.org/licenses/by/4.0/).
Share and Cite
Pjetraj, D.; Pulvirenti, A.; Moretti, M.; Gatti, S.; Catassi, G.N.; Catassi, C.; Lionetti, E. Diagnostic Accuracy of IgA Anti-Transglutaminase Assessed by Chemiluminescence: A Systematic Review and Meta-Analysis. Nutrients 2024, 16, 2427. https://doi.org/10.3390/nu16152427
Pjetraj D, Pulvirenti A, Moretti M, Gatti S, Catassi GN, Catassi C, Lionetti E. Diagnostic Accuracy of IgA Anti-Transglutaminase Assessed by Chemiluminescence: A Systematic Review and Meta-Analysis. Nutrients. 2024; 16(15):2427. https://doi.org/10.3390/nu16152427
Chicago/Turabian StylePjetraj, Dorina, Alfredo Pulvirenti, Marco Moretti, Simona Gatti, Giulia Naspi Catassi, Carlo Catassi, and Elena Lionetti. 2024. "Diagnostic Accuracy of IgA Anti-Transglutaminase Assessed by Chemiluminescence: A Systematic Review and Meta-Analysis" Nutrients 16, no. 15: 2427. https://doi.org/10.3390/nu16152427
APA StylePjetraj, D., Pulvirenti, A., Moretti, M., Gatti, S., Catassi, G. N., Catassi, C., & Lionetti, E. (2024). Diagnostic Accuracy of IgA Anti-Transglutaminase Assessed by Chemiluminescence: A Systematic Review and Meta-Analysis. Nutrients, 16(15), 2427. https://doi.org/10.3390/nu16152427