
How Immunonutritional Markers Are Associated with Age, Sex, Body Mass Index and the Most Common Chronic Diseases in the Hospitalized Geriatric Population—A Cross Sectional Study
 , , and
Abstract
:1. Introduction
2. Materials and Methods
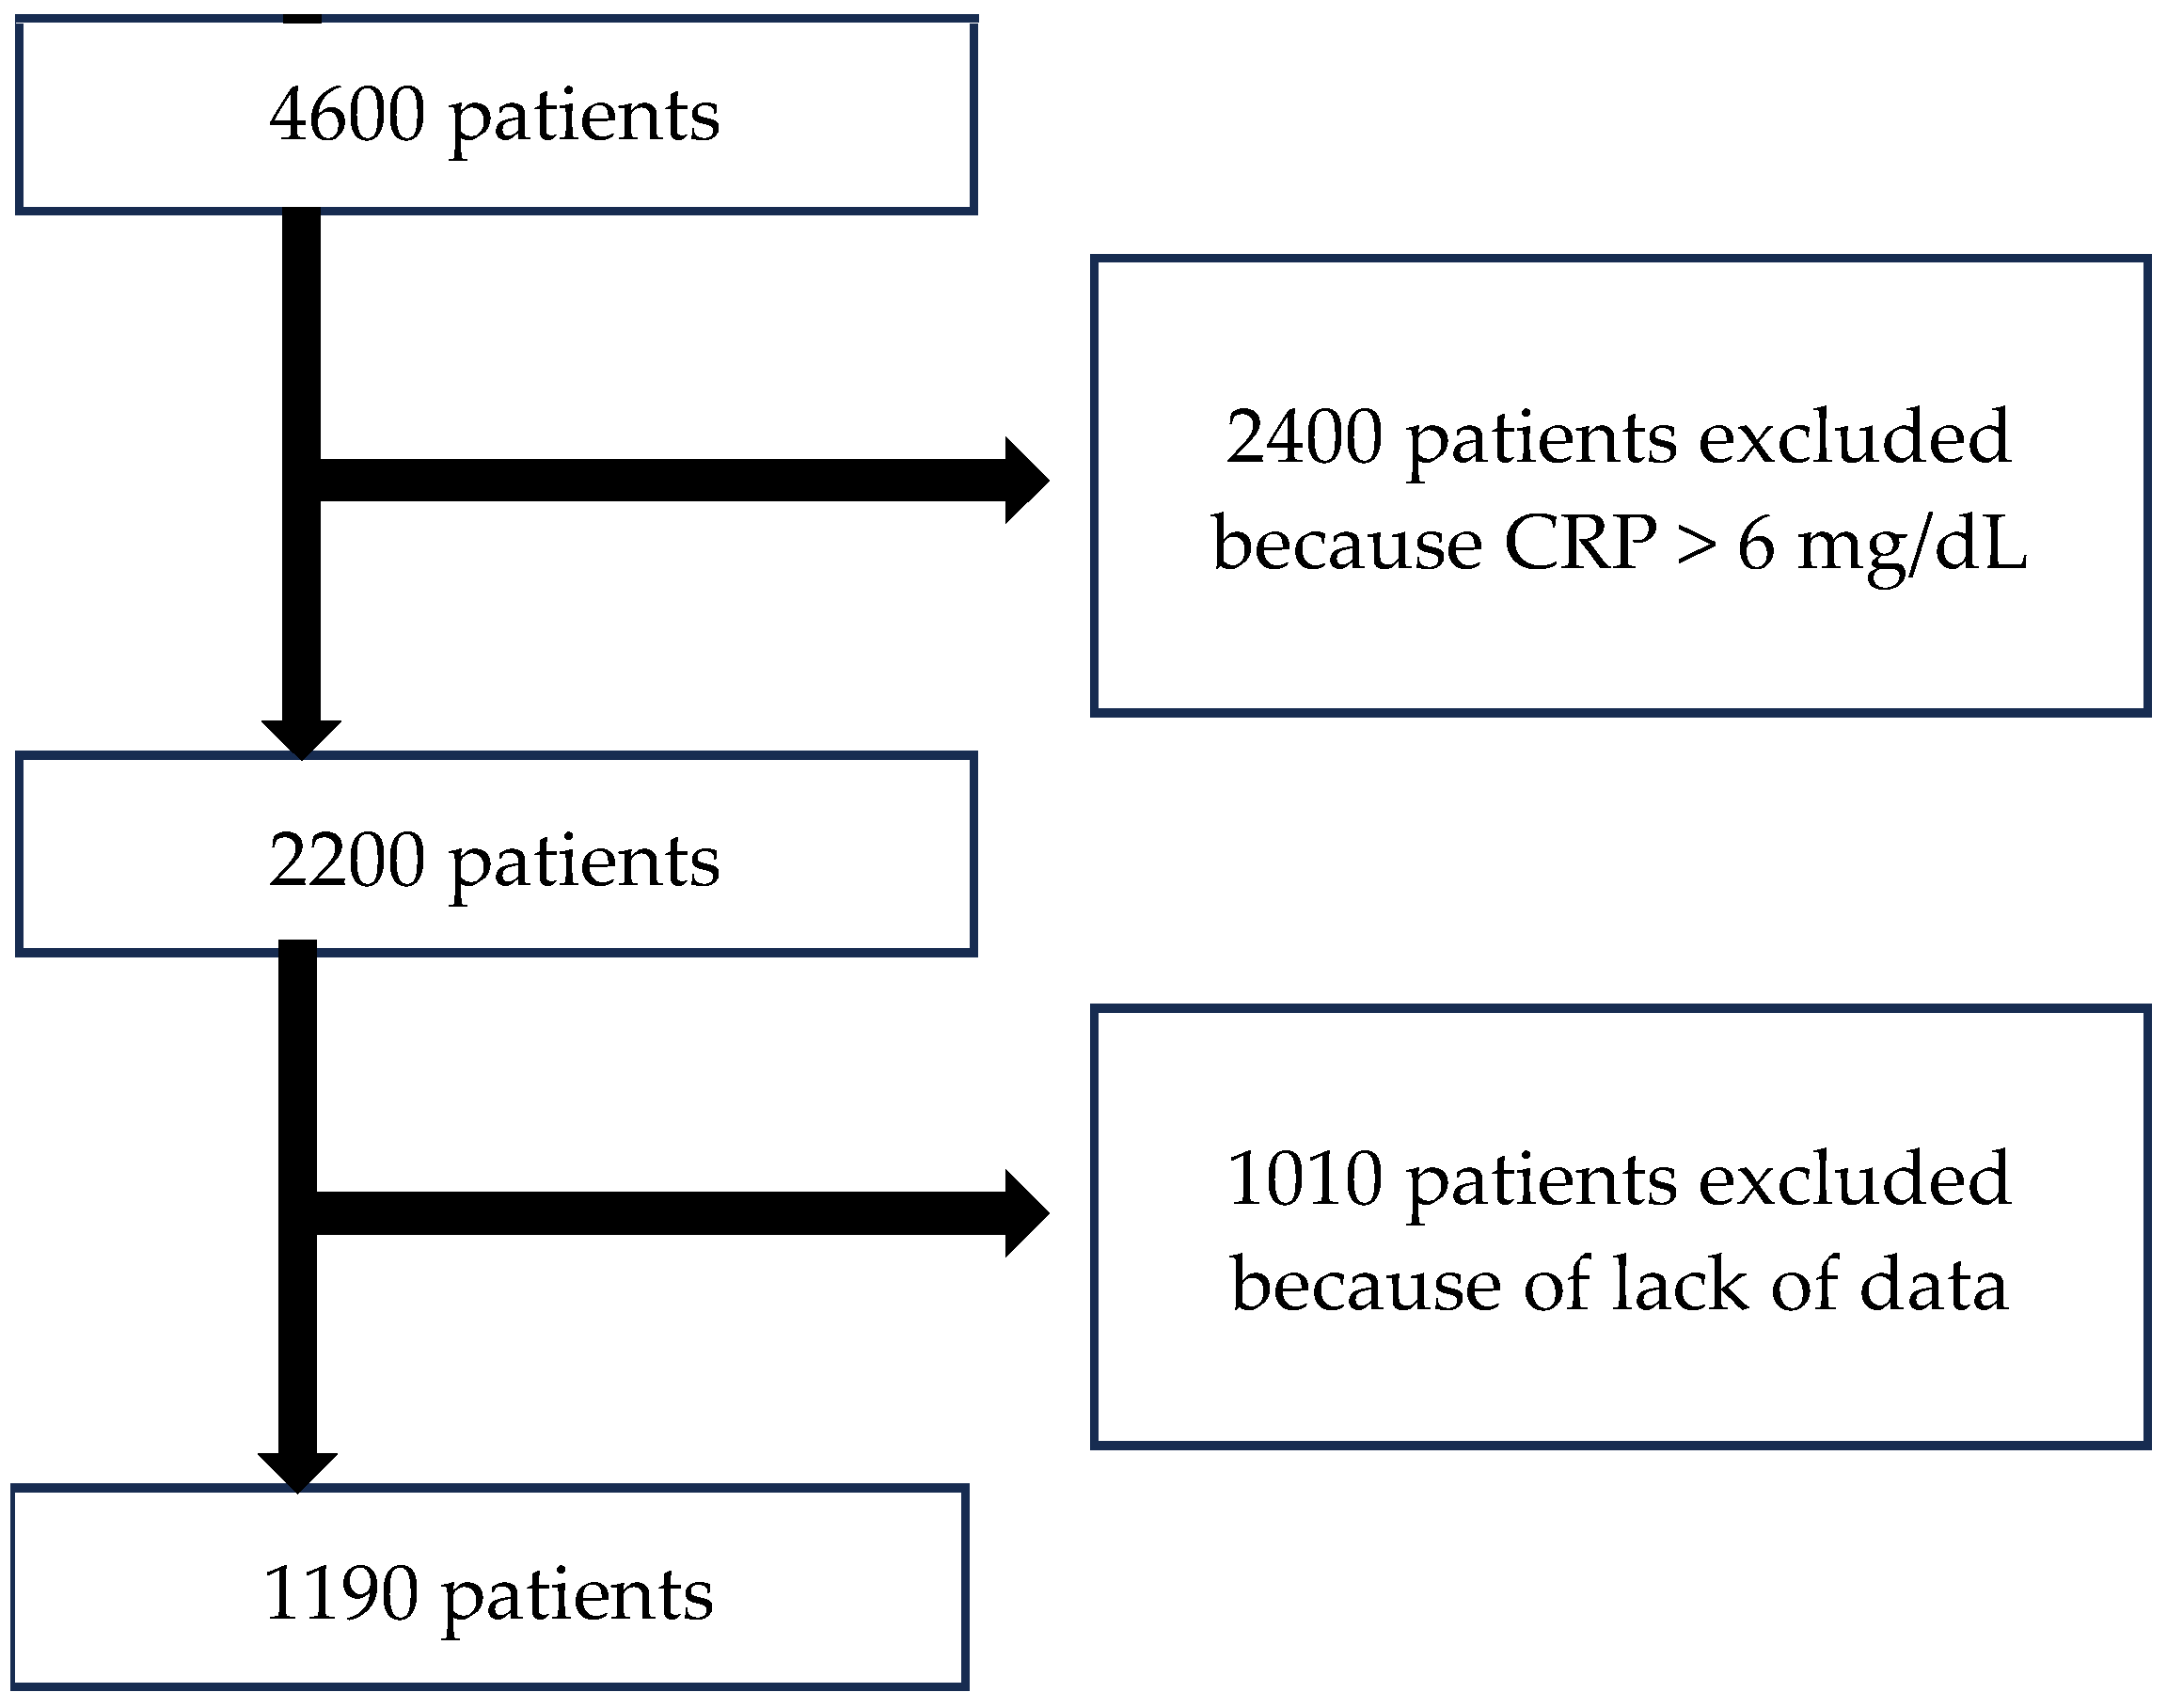
2.1. Study Design
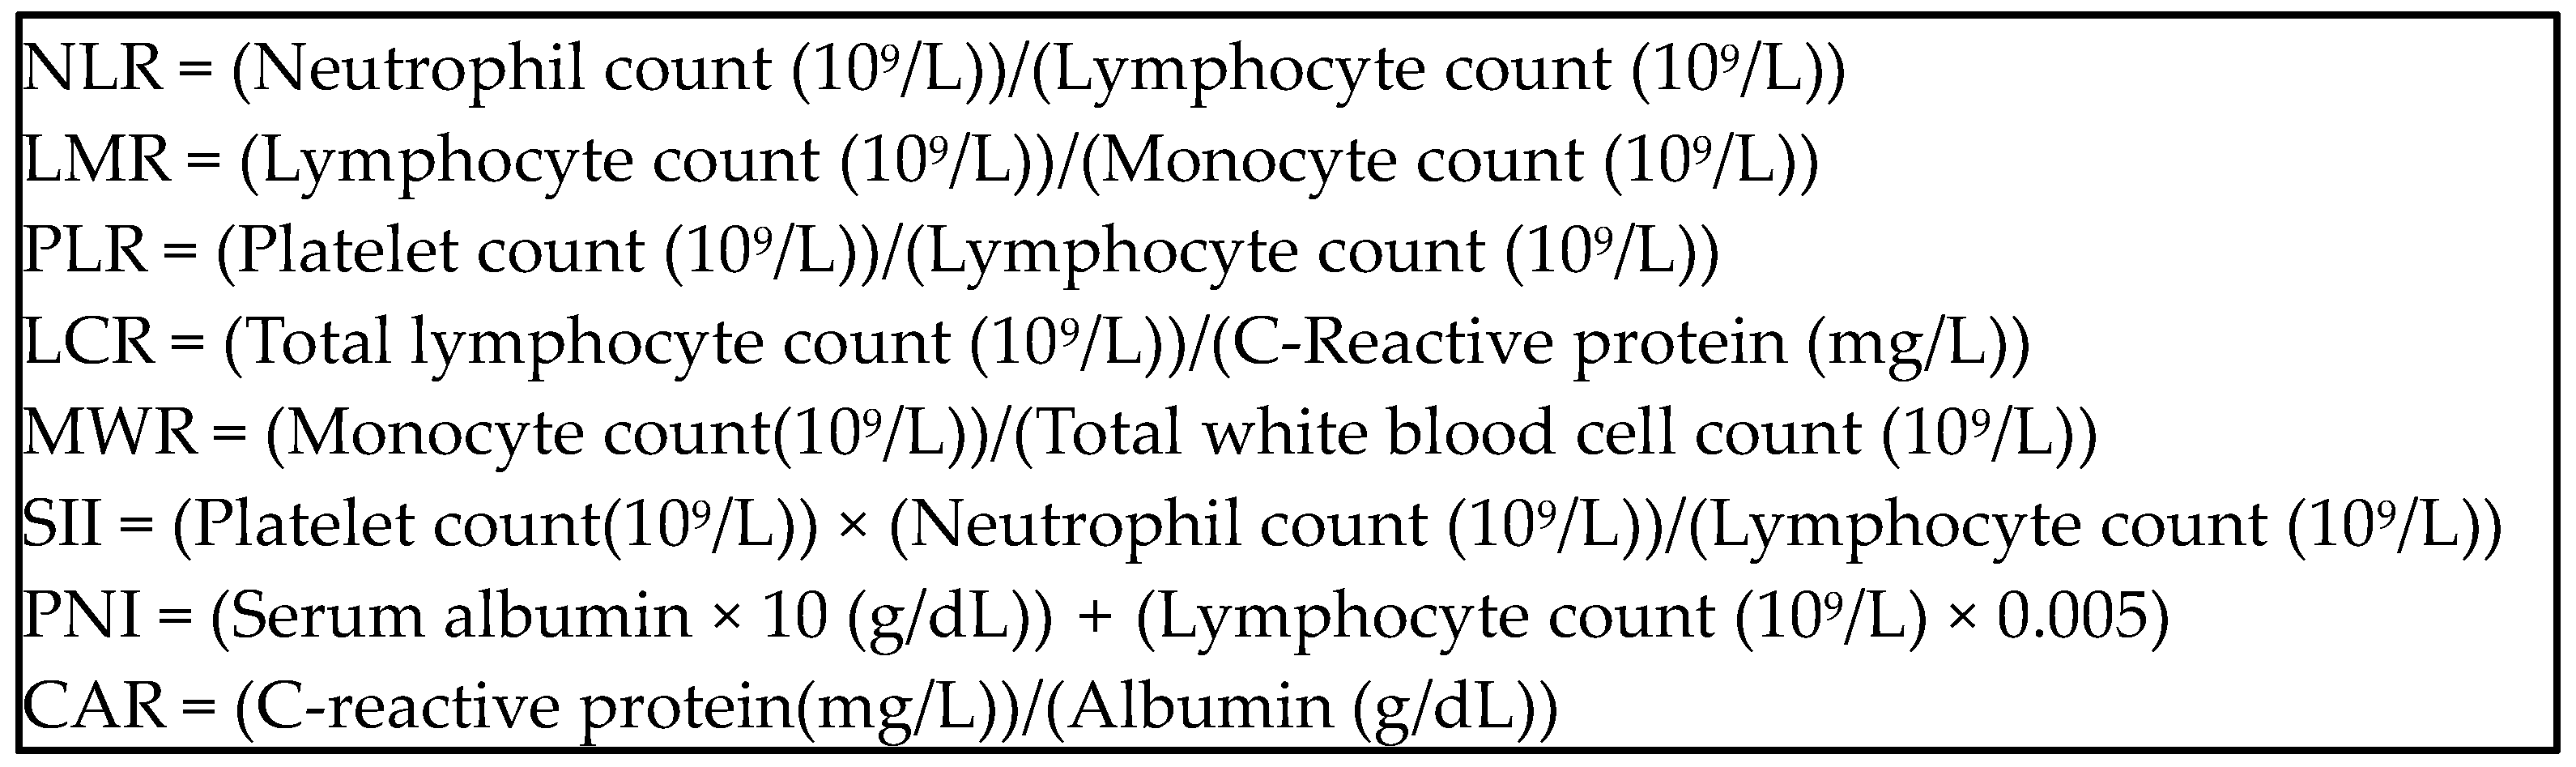
2.2. Data Collection and Laboratory Tests
2.3. Concomitant Diseases
2.4. Statistical Analysis
2.5. Ethical Certification
3. Results
4. Discussion
5. Conclusions
Author Contributions
Funding
Institutional Review Board Statement
Informed Consent Statement
Data Availability Statement
Conflicts of Interest
References
- Conway, J.; Certo, M.; Lord, J.M.; Mauro, C.; Duggal, N.A. Understanding the role of host metabolites in the induction of immune senescence: Future strategies for keeping the ageing population healthy. Br. J. Pharmacol. 2022, 179, 1808–1824. [Google Scholar] [CrossRef] [PubMed]
- Fried, T.R.; Tinetti, M.E.; Iannone, L. Primary care clinicians’ experiences with treatment decision making for older persons with multiple conditions. Arch. Intern. Med. 2011, 171, 75–80. [Google Scholar] [CrossRef] [PubMed]
- Zapatera, B.; Prados, A.; Gómez-Martínez, S.; Marcos, A. Immunonutrition: Methodology and applications. Nutr. Hosp. 2015, 31 (Suppl. S3), 145–154. [Google Scholar] [CrossRef] [PubMed]
- Nishijima, T.F.; Deal, A.M.; Williams, G.R.; Guerard, E.J.; Nyrop, K.A.; Muss, H.B. Frailty and inflammatory markers in older adults with cancer. Aging 2017, 9, 650–664. [Google Scholar] [CrossRef] [PubMed]
- Yamamoto, T.; Kawada, K.; Obama, K. Inflammation-Related Biomarkers for the Prediction of Prognosis in Colorectal Cancer Patients. Int. J. Mol. Sci. 2021, 22, 8002. [Google Scholar] [CrossRef]
- Rossi, S.; Basso, M.; Strippoli, A.; Schinzari, G.; D’Argento, E.; Larocca, M.; Cassano, A.; Barone, C. Are Markers of Systemic Inflammation Good Prognostic Indicators in Colorectal Cancer? Clin. Color. Cancer 2017, 16, 264–274. [Google Scholar] [CrossRef]
- Hou, P.; Xue, H.P.; Mao, X.E.; Li, Y.N.; Wu, L.F.; Liu, Y.B. Inflammation markers are associated with frailty in elderly patients with coronary heart disease. Aging 2018, 10, 2636–2645. [Google Scholar] [CrossRef]
- Luo, Y.; Deng, R.; Zhong, Q.; Luo, D.; Li, X.; Chen, X.; Tao, S.; Feng, Z.; Jiayi, L.; Huang, Y.; et al. The prognostic value of inflammation markers in postoperative gliomas with or without adjuvant treatments. Medicine 2021, 100, e26437. [Google Scholar] [CrossRef]
- Dentali, F.; Nigro, O.; Squizzato, A.; Gianni, M.; Zuretti, F.; Grandi, A.M.; Guasti, L. Impact of neutrophils to lymphocytes ratio on major clinical outcomes in patients with acute coronary syndromes: A systematic review and meta-analysis of the literature. Int. J. Cardiol. 2018, 266, 31–37. [Google Scholar] [CrossRef]
- Diem, S.; Schmid, S.; Krapf, M.; Flatz, L.; Born, D.; Jochum, W.; Templeton, A.J.; Früh, M. Neutrophil-to-Lymphocyte ratio (NLR) and Platelet-to-Lymphocyte ratio (PLR) as prognostic markers in patients with non-small cell lung cancer (NSCLC) treated with nivolumab. Lung Cancer 2017, 111, 176–181. [Google Scholar] [CrossRef]
- Köse, N.; Yıldırım, T.; Akın, F.; Yıldırım, S.E.; Altun, İ. Prognostic role of NLR, PLR, and LMR in patients with pulmonary embolism. Bosn. J. Basic Med. Sci. 2020, 20, 248–253. [Google Scholar] [CrossRef] [PubMed]
- Okugawa, Y.; Toiyama, Y.; Yamamoto, A.; Shigemori, T.; Ide, S.; Kitajima, T.; Fujikawa, H.; Yasuda, H.; Hiro, J.; Yoshiyama, S.; et al. Lymphocyte-C-reactive Protein Ratio as Promising New Marker for Predicting Surgical and Oncological Outcomes in Colorectal Cancer. Ann. Surg. 2020, 272, 342–351. [Google Scholar] [CrossRef] [PubMed]
- Wang, G.; Mivefroshan, A.; Yaghoobpoor, S.; Khanzadeh, S.; Siri, G.; Rahmani, F.; Aleseidi, S. Prognostic Value of Platelet to Lymphocyte Ratio in Sepsis: A Systematic Review and Meta-analysis. Biomed. Res. Int. 2022, 2022, 9056363. [Google Scholar] [CrossRef]
- Gong, Z.; Xin, R.; Li, L.; Lv, L.; Wu, X. Platelet-to-lymphocyte ratio associated with the clinicopathological features and prognostic value of breast cancer: A meta-analysis. Int. J. Biol. Markers 2022, 37, 339–348. [Google Scholar] [CrossRef]
- Delcea, C.; Buzea, C.A.; Vîjan, A.E.; Bădilă, E.; Dan, G.A. The platelet to lymphocyte ratio in heart failure: A comprehensive review. Rom. J. Intern. Med. 2023, 61, 84–97. [Google Scholar] [CrossRef]
- Gasparyan, A.Y.; Ayvazyan, L.; Mukanova, U.; Yessirkepov, M.; Kitas, G.D. The Platelet-to-Lymphocyte Ratio as an Inflammatory Marker in Rheumatic Diseases. Ann. Lab. Med. 2019, 39, 345–357. [Google Scholar] [CrossRef]
- Liu, J.; Li, S.; Zhang, S.; Liu, Y.; Ma, L.; Zhu, J.; Xin, Y.; Wang, Y.; Yang, C.; Cheng, Y. Systemic immune-inflammation index, neutrophil-to-lymphocyte ratio, platelet-to-lymphocyte ratio can predict clinical outcomes in patients with metastatic non-small-cell lung cancer treated with nivolumab. J. Clin. Lab. Anal. 2019, 33, e22964. [Google Scholar] [CrossRef]
- Nishi, M.; Shimada, M.; Tokunaga, T.; Higashijima, J.; Yoshikawa, K.; Kashihara, H.; Takasu, C.; Ishikawa, D.; Wada, Y.; Eto, S.; et al. Lymphocyte to C-reactive protein ratio predicts long-term outcomes for patients with lower rectal cancer. World J. Surg. Oncol. 2021, 19, 201. [Google Scholar] [CrossRef]
- Zhang, J.N.; Gao, Y.; Wang, X.T.; Li, N.N.; Du, X.; Tang, Y.J.; Lai, Q.Q.; Chen, P.F.; Yue, C.S.; Wu, J.H.; et al. Lymphocyte-C-reactive protein ratio can differentiate disease severity of COVID-19 patients and serve as an assistant screening tool for hospital and ICU admission. Front. Immunol. 2022, 13, 957407. [Google Scholar] [CrossRef] [PubMed]
- Okugawa, Y.; Toiyama, Y.; Yamamoto, A.; Shigemori, T.; Ichikawa, T.; Yin, C.; Suzuki, A.; Fujikawa, H.; Yasuda, H.; Hiro, J.; et al. Lymphocyte-to-C-reactive protein ratio and score are clinically feasible nutrition-inflammation markers of outcome in patients with gastric cancer. Clin. Nutr. 2020, 39, 1209–1217. [Google Scholar] [CrossRef]
- Jaipersad, A.S.; Lip, G.Y.; Silverman, S.; Shantsila, E. The role of monocytes in angiogenesis and atherosclerosis. J. Am. Coll. Cardiol. 2014, 63, 1–11. [Google Scholar] [CrossRef] [PubMed]
- Li, C.; Tian, W.; Zhao, F.; Li, M.; Ye, Q.; Wei, Y.; Li, T.; Xie, K. Systemic immune-inflammation index, SII, for prognosis of elderly patients with newly diagnosed tumors. Oncotarget 2018, 9, 35293–35299. [Google Scholar] [CrossRef]
- He, K.; Si, L.; Pan, X.; Sun, L.; Wang, Y.; Lu, J.; Wang, X. Preoperative Systemic Immune-Inflammation Index (SII) as a Superior Predictor of Long-Term Survival Outcome in Patients with Stage I-II Gastric Cancer after Radical Surgery. Front. Oncol. 2022, 12, 829689. [Google Scholar] [CrossRef]
- Fois, A.G.; Paliogiannis, P.; Scano, V.; Cau, S.; Babudieri, S.; Perra, R.; Ruzzittu, G.; Zinellu, E.; Pirina, P.; Carru, C.; et al. The Systemic Inflammation Index on Admission Predicts In-Hospital Mortality in COVID-19 Patients. Molecules 2020, 25, 5725. [Google Scholar] [CrossRef]
- Liu, M.; Sun, M.; Zhang, T.; Li, P.; Liu, J.; Liu, Y.; Song, Y.; Liu, S.; Yang, H.; Zhou, Z.; et al. Prognostic Nutritional Index (PNI) as a potential predictor and intervention target for perioperative ischemic stroke: A retrospective cohort study. BMC Anesthesiol. 2023, 23, 268. [Google Scholar] [CrossRef] [PubMed]
- Suzuki, E.; Kawata, N.; Shimada, A.; Sato, H.; Anazawa, R.; Suzuki, M.; Shiko, Y.; Yamamoto, M.; Ikari, J.; Tatsumi, K.; et al. Prognostic Nutritional Index (PNI) as a Potential Prognostic Tool for Exacerbation of COPD in Elderly Patients. Int. J. Chronic Obstr. Pulm. Dis. 2023, 18, 1077–1090. [Google Scholar] [CrossRef] [PubMed]
- Barutcu Atas, D.; Tugcu, M.; Asicioglu, E.; Velioglu, A.; Arikan, H.; Koc, M.; Tuglular, S. Prognostic nutritional index is a predictor of mortality in elderly patients with chronic kidney disease. Int. Urol. Nephrol. 2022, 54, 1155–1162. [Google Scholar] [CrossRef]
- Taniguchi, H.; Momiyama, Y.; Ohmori, R.; Yonemura, A.; Yamashita, T.; Tamai, S.; Nakamura, H.; Ohsuzu, F. Associations of plasma C-reactive protein levels with the presence and extent of coronary stenosis in patients with stable coronary artery disease. Atherosclerosis 2005, 178, 173–177. [Google Scholar] [CrossRef] [PubMed]
- Ranzani, O.T.; Zampieri, F.G.; Forte, D.N.; Azevedo, L.C.; Park, M. C-reactive protein/albumin ratio predicts 90-day mortality of septic patients. PLoS ONE 2013, 8, e59321. [Google Scholar] [CrossRef]
- Header, D.A.; Aboelwafa, R.A.; Elkeleny, M.R.; Bedewy, E.S.; Ellakany, A.I. C-reactive protein/albumin ratio (CAR) as a marker for detecting acute severe ulcerative colitis in Egyptian patients. Rev. Gastroenterol. Mex. 2022, 87, 447–454. [Google Scholar] [CrossRef]
- Feng, F.; Sun, L.; Zheng, G.; Liu, S.; Liu, Z.; Xu, G.; Guo, M.; Lian, X.; Fan, D.; Zhang, H. Low lymphocyte-to-white blood cell ratio and high monocyte-to-white blood cell ratio predict poor prognosis in gastric cancer. Oncotarget 2017, 8, 5281–5291. [Google Scholar] [CrossRef] [PubMed]
- Oscanoa, T.J.; Amado, J.P.; Romero-Ortuno, R.; Hidalgo, J.A. Estimation of the glomerular filtration rate in older individuals with serum creatinine-based equations: A systematic comparison between CKD-EPI and BIS1. Arch. Gerontol. Geriatr. 2018, 75, 139–145. [Google Scholar] [CrossRef]
- Yesavage, J.A.; Brink, T.L.; Rose, T.L.; Lum, O.; Huang, V.; Adey, M.; Leirer, V.O. Development and validation of a geriatric depression screening scale: A preliminary report. J. Psychiatr. Res. 1982, 17, 37–49. [Google Scholar] [CrossRef]
- Folstein, M.F.; Folstein, S.E.; McHugh, P.R. “Mini-mental state”. A practical method for grading the cognitive state of patients for the clinician. J. Psychiatr. Res. 1975, 12, 189–198. [Google Scholar] [CrossRef]
- Li, L.; Zhang, H.; Feng, G.L. Neutrophil-to-Lymphocyte Ratio Predicts in-Hospital Mortality in Intracerebral Hemorrhage. J. Stroke Cerebrovasc. Dis. 2022, 31, 106611. [Google Scholar] [CrossRef]
- Cupp, M.A.; Cariolou, M.; Tzoulaki, I.; Aune, D.; Evangelou, E.; Berlanga-Taylor, A.J. Neutrophil to lymphocyte ratio and cancer prognosis: An umbrella review of systematic reviews and meta-analyses of observational studies. BMC Med. 2020, 18, 360. [Google Scholar] [CrossRef] [PubMed]
- Afari, M.E.; Bhat, T. Neutrophil to lymphocyte ratio (NLR) and cardiovascular diseases: An update. Expert. Rev. Cardiovasc. Ther. 2016, 14, 573–577. [Google Scholar] [CrossRef]
- Tong, Z.; Zhu, J.; Wang, J.J.; Yang, Y.J.; Hu, W. The Neutrophil-Lymphocyte Ratio Is Positively Correlated with Aggression in Schizophrenia. Biomed. Res. Int. 2022, 2022, 4040974. [Google Scholar] [CrossRef]
- Forget, P.; Khalifa, C.; Defour, J.P.; Latinne, D.; Van Pel, M.C.; De Kock, M. What is the normal value of the neutrophil-to-lymphocyte ratio? BMC Res. Notes 2017, 10, 12. [Google Scholar] [CrossRef]
- Li, J.; Chen, Q.; Luo, X.; Hong, J.; Pan, K.; Lin, X.; Liu, X.; Zhou, L.; Wang, H.; Xu, Y.; et al. Neutrophil-to-Lymphocyte Ratio Positively Correlates to Age in Healthy Population. J. Clin. Lab. Anal. 2015, 29, 437–443. [Google Scholar] [CrossRef] [PubMed]
- Guo, X.W.; Zhou, J.Y.; Jiang, W.; Ji, L.; Liu, Y.C.; Yin, X.X. The Combination of Preoperative Nutritional Risk Screening-2002 and Neutrophil-to-Lymphocyte Ratio is a Useful Prognostic Marker in Patients with Esophageal Squamous Cell Carcinoma. Nutr. Cancer 2021, 73, 588–595. [Google Scholar] [CrossRef]
- Baldemir, R.; Cirik, M. Practical parameters that can be used for nutritional assessment in patients hospitalized in the intensive care unit with the diagnosis of chronic obstructive pulmonary disease: Prognostic nutritional index, neutrophil-to-lymphocyte, platelet-to-lymphocyte, and lymphocyte-to-monocyte ratio. Medicine 2022, 101, e29433. [Google Scholar] [CrossRef]
- Abe, S.; Kawai, K.; Nozawa, H.; Hata, K.; Kiyomatsu, T.; Morikawa, T.; Watanabe, T. LMR predicts outcome in patients after preoperative chemoradiotherapy for stage II-III rectal cancer. J. Surg. Res. 2018, 222, 122–131. [Google Scholar] [CrossRef]
- Mandaliya, H.; Jones, M.; Oldmeadow, C.; Nordman, I.I. Prognostic biomarkers in stage IV non-small cell lung cancer (NSCLC): Neutrophil to lymphocyte ratio (NLR), lymphocyte to monocyte ratio (LMR), platelet to lymphocyte ratio (PLR) and advanced lung cancer inflammation index (ALI). Transl. Lung Cancer Res. 2019, 8, 886–894. [Google Scholar] [CrossRef]
- Dymicka-Piekarska, V.; Dorf, J.; Milewska, A.; Łukaszyk, M.; Kosidło, J.W.; Kamińska, J.; Wolszczak-Biedrzycka, B.; Naumnik, W. Neutrophil/Lymphocyte Ratio (NLR) and Lymphocyte/Monocyte Ratio (LMR)—Risk of Death Inflammatory Biomarkers in Patients with COVID-19. J. Inflamm. Res. 2023, 16, 2209–2222. [Google Scholar] [CrossRef]
- Ren, H.; Liu, X.; Wang, L.; Gao, Y. Lymphocyte-to-Monocyte Ratio: A Novel Predictor of the Prognosis of Acute Ischemic Stroke. J. Stroke Cerebrovasc. Dis. 2017, 26, 2595–2602. [Google Scholar] [CrossRef]
- Silva, N.; Bettencourt, P.; Guimarães, J.T. The lymphocyte-to-monocyte ratio: An added value for death prediction in heart failure. Nutr. Metab. Cardiovasc. Dis. 2015, 25, 1033–1040. [Google Scholar] [CrossRef]
- Qiu, C.; Liu, S.; Li, X.; Li, W.; Hu, G.; Liu, F. Prognostic value of monocyte-to-lymphocyte ratio for 90-day all-cause mortality in type 2 diabetes mellitus patients with chronic kidney disease. Sci. Rep. 2023, 13, 13136. [Google Scholar] [CrossRef]
- Zhang, M.; Wang, K.; Zheng, H.; Zhao, X.; Xie, S.; Liu, C. Monocyte lymphocyte ratio predicts the new-onset of chronic kidney disease: A cohort study. Clin. Chim. Acta 2020, 503, 181–189. [Google Scholar] [CrossRef]
- Kutlay, Ö.; Yalım, Z.; Aktan, A.K. Inflammatory biomarkers derived from whole blood cell count in atrial fibrillation patients. Kardiologiia 2023, 63, 50–55. [Google Scholar] [CrossRef]
- Yu, Y.; Wang, S.; Wang, P.; Xu, Q.; Zhang, Y.; Xiao, J.; Xue, X.; Yang, Q.; Xi, W.; Wang, J.; et al. Predictive value of lymphocyte-to-monocyte ratio in critically Ill patients with atrial fibrillation: A propensity score matching analysis. J. Clin. Lab. Anal. 2022, 36, e24217. [Google Scholar] [CrossRef]
- Meng, X.; Chang, Q.; Liu, Y.; Chen, L.; Wei, G.; Yang, J.; Zheng, P.; He, F.; Wang, W.; Ming, L. Determinant roles of gender and age on SII, PLR, NLR, LMR and MLR and their reference intervals defining in Henan, China: A posteriori and big-data-based. J. Clin. Lab. Anal. 2018, 32, e22228. [Google Scholar] [CrossRef] [PubMed]
- Fors, M.; Ballaz, S.; Ramírez, H.; Mora, F.X.; Pulgar-Sánchez, M.; Chamorro, K.; Fernández-Moreira, E. Sex-Dependent Performance of the Neutrophil-to-Lymphocyte, Monocyte-to-Lymphocyte, Platelet-to-Lymphocyte and Mean Platelet Volume-to-Platelet Ratios in Discriminating COVID-19 Severity. Front. Cardiovasc. Med. 2022, 9, 822556. [Google Scholar] [CrossRef]
- Guan, Y.Z.; Yin, R.X.; Zheng, P.F.; Liu, C.X.; Wei, B.L.; Deng, G.X. Association of RDW, NLR, and PLR with Atrial Fibrillation in Critical Care Patients: A Retrospective Study Based on Propensity Score Matching. Dis. Markers 2022, 2022, 2694499. [Google Scholar] [CrossRef]
- Zuo, K.; Yang, X. Decreased platelet-to-lymphocyte ratio as predictor of thrombogenesis in nonvalvular atrial fibrillation. Herz 2020, 45, 684–688. [Google Scholar] [CrossRef]
- Szudy-Szczyrek, A.; Mlak, R.; Mielnik, M.; Szczyrek, M.; Nowaczyńska, A.; Homa-Mlak, I.; Zmorzyński, S.; Kuśmierczuk, K.; Sompor, J.; Filip, A.; et al. Prognostic value of pretreatment neutrophil-to-lymphocyte and platelet-to-lymphocyte ratios in multiple myeloma patients treated with thalidomide-based regimen. Ann. Hematol. 2020, 99, 2881–2891. [Google Scholar] [CrossRef]
- Balta, S.; Ozturk, C. The platelet-lymphocyte ratio: A simple, inexpensive and rapid prognostic marker for cardiovascular events. Platelets 2015, 26, 680–681. [Google Scholar] [CrossRef]
- Mathur, K.; Kurbanova, N.; Qayyum, R. Platelet-lymphocyte ratio (PLR) and all-cause mortality in general population: Insights from national health and nutrition education survey. Platelets 2019, 30, 1036–1041. [Google Scholar] [CrossRef]
- Chenciner, L.; Symonds, M.; Dissanayake, O.; Hunter, A.; Burns, F.; Miller, R.F. Lymphocyte-CRP Ratio and CRP-Albumin Ratio as Potential Inflammation Markers in Adults with HIV. J. Acquir. Immune Defic. Syndr. 2022, 91, e1–e3. [Google Scholar] [CrossRef] [PubMed]
- Li, P.; Li, H.; Ding, S.; Zhou, J. NLR, PLR, LMR and MWR as diagnostic and prognostic markers for laryngeal carcinoma. Am. J. Transl. Res. 2022, 14, 3017–3027. [Google Scholar] [PubMed]
- Shahid, F.; Rahmat, N.A.; Lip, G.Y.H.; Shantsila, E. Prognostic implication of monocytes in atrial fibrillation: The West Birmingham Atrial Fibrillation Project. PLoS ONE 2018, 13, e0200373. [Google Scholar] [CrossRef]
- Guo, Y.; Lip, G.Y.; Apostolakis, S. Inflammation in atrial fibrillation. J. Am. Coll. Cardiol. 2012, 60, 2263–2270. [Google Scholar] [CrossRef]
- Arafa, A.; Kokubo, Y.; Kashima, R.; Teramoto, M.; Sakai, Y.; Nosaka, S.; Shimamoto, K.; Kawachi, H.; Matsumoto, C.; Kusano, K. Association Between White Blood Cell Count and Atrial Fibrillation Risk—A Population-Based Prospective Cohort Study. Circ. J. 2022, 87, 41–49. [Google Scholar] [CrossRef]
- Liu, Y.; Shi, Q.; Ma, Y.; Liu, Q. The role of immune cells in atrial fibrillation. J. Mol. Cell. Cardiol. 2018, 123, 198–208. [Google Scholar] [CrossRef]
- Xia, Y.; Xia, C.; Wu, L.; Li, Z.; Li, H.; Zhang, J. Systemic Immune Inflammation Index (SII), System Inflammation Response Index (SIRI) and Risk of All-Cause Mortality and Cardiovascular Mortality: A 20-Year Follow-Up Cohort Study of 42,875 US Adults. J. Clin. Med. 2023, 12, 1128. [Google Scholar] [CrossRef]
- Guo, W.; Song, Y.; Sun, Y.; Du, H.; Cai, Y.; You, Q.; Fu, H.; Shao, L. Systemic immune-inflammation index is associated with diabetic kidney disease in Type 2 diabetes mellitus patients: Evidence from NHANES 2011–2018. Front. Endocrinol. 2022, 13, 1071465. [Google Scholar] [CrossRef]
- Tang, Y.; Peng, B.; Liu, J.; Liu, Z.; Xia, Y.; Geng, B. Systemic immune-inflammation index and bone mineral density in postmenopausal women: A cross-sectional study of the national health and nutrition examination survey (NHANES) 2007–2018. Front. Immunol. 2022, 13, 975400. [Google Scholar] [CrossRef]
- Mahemuti, N.; Jing, X.; Zhang, N.; Liu, C.; Li, C.; Cui, Z.; Liu, Y.; Chen, J. Association between Systemic Immunity-Inflammation Index and Hyperlipidemia: A Population-Based Study from the NHANES (2015–2020). Nutrients 2023, 15, 1177. [Google Scholar] [CrossRef] [PubMed]
- Huang, Y.; Chen, Y.; Zhu, Y.; Wu, Q.; Yao, C.; Xia, H.; Li, C. Postoperative Systemic Immune-Inflammation Index (SII): A Superior Prognostic Factor of Endometrial Cancer. Front. Surg. 2021, 8, 704235. [Google Scholar] [CrossRef] [PubMed]
- Bao, X.; Liu, F.; Lin, J.; Chen, Q.; Chen, L.; Chen, F.; Wang, J.; Qiu, Y.; Shi, B.; Pan, L.; et al. Nutritional assessment and prognosis of oral cancer patients: A large-scale prospective study. BMC Cancer 2020, 20, 146. [Google Scholar] [CrossRef] [PubMed]
- Sánchez, Y.; Vaca-Paniagua, F.; Herrera, L.; Oñate, L.; Herrera-Goepfert, R.; Navarro-Martínez, G.; Cerrato, D.; Díaz-Velázquez, C.; Quezada, E.M.; García-Cuellar, C.; et al. Nutritional Indexes as Predictors of Survival and Their Genomic Implications in Gastric Cancer Patients. Nutr. Cancer 2021, 73, 1429–1439. [Google Scholar] [CrossRef]
- Prausmüller, S.; Heitzinger, G.; Pavo, N.; Spinka, G.; Goliasch, G.; Arfsten, H.; Gabler, C.; Strunk, G.; Hengstenberg, C.; Hülsmann, M.; et al. Malnutrition outweighs the effect of the obesity paradox. J. Cachexia Sarcopenia Muscle 2022, 13, 1477–1486. [Google Scholar] [CrossRef]
- Bullock, A.F.; Greenley, S.L.; McKenzie, G.A.G.; Paton, L.W.; Johnson, M.J. Relationship between markers of malnutrition and clinical outcomes in older adults with cancer: Systematic review, narrative synthesis and meta-analysis. Eur. J. Clin. Nutr. 2020, 74, 1519–1535. [Google Scholar] [CrossRef]
- Aktas, G. Association between the Prognostic Nutritional Index and Chronic Microvascular Complications in Patients with Type 2 Diabetes Mellitus. J. Clin. Med. 2023, 12, 5952. [Google Scholar] [CrossRef]
- Zhang, J.; Xiao, X.; Wu, Y.; Yang, J.; Zou, Y.; Zhao, Y.; Yang, Q.; Liu, F. Prognostic Nutritional Index as a Predictor of Diabetic Nephropathy Progression. Nutrients 2022, 14, 3634. [Google Scholar] [CrossRef]
- Han, M.; Lee, H.W.; Lee, H.C.; Kim, H.J.; Seong, E.Y.; Song, S.H. Impact of nutritional index on contrast-associated acute kidney injury and mortality after percutaneous coronary intervention. Sci. Rep. 2021, 11, 7123. [Google Scholar] [CrossRef]
- Nergiz, S.; Ozturk, U. The Effect of Prognostic Nutritional Index on Infection in Acute Ischemic Stroke Patients. Medicina 2023, 59, 679. [Google Scholar] [CrossRef]
- Cai, J.; Chen, C.; Zhang, L.; Zhai, X.; Zhao, X.; Ge, J.; Chang, X.; Song, B.; Qu, X. The association between the prognostic nutritional index and 28-day mortality among atrial fibrillation patients in China over 80 years of age. Nutr. Metab. Cardiovasc. Dis. 2022, 32, 1493–1501. [Google Scholar] [CrossRef]
- Tarar, M.Y.; Khalid, A.; Choo, X.Y.; Khurshid, S.; Tumeh, H.; Muhammad, K. Use of the C-Reactive Protein (CRP)/Albumin Ratio as a Severity Tool in Acute Pancreatitis: Systematic Review. Cureus 2022, 14, e29243. [Google Scholar] [CrossRef]
- Donlon, N.E.; Mohan, H.; Free, R.; Elbaghir, B.; Soric, I.; Fleming, C.; Balasubramanian, I.; Ivanovski, I.; Schmidt, K.; Mealy, K. Predictive value of CRP/albumin ratio in major abdominal surgery. Ir. J. Med. Sci. 2020, 189, 1465–1470. [Google Scholar] [CrossRef] [PubMed]
- Gomes de Lima, K.V.; Maio, R. Nutritional status, systemic inflammation and prognosis of patients with gastrointestinal cancer. Nutr. Hosp. 2012, 27, 707–714. [Google Scholar] [CrossRef] [PubMed]
- Arakawa, Y.; Miyazaki, K.; Yoshikawa, M.; Yamada, S.; Saito, Y.; Ikemoto, T.; Imura, S.; Morine, Y.; Shimada, M. Value of the CRP-albumin ratio in patients with resectable pancreatic cancer. J. Med. Investig. 2021, 68, 244–255. [Google Scholar] [CrossRef] [PubMed]
- Kalyan, S.; Goshtesabi, A.; Sarray, S.; Joannou, A.; Almawi, W.Y. Assessing C reactive protein/albumin ratio as a new biomarker for polycystic ovary syndrome: A case-control study of women from Bahraini medical clinics. BMJ Open 2018, 8, e021860. [Google Scholar] [CrossRef]
- Karabacak, K.; Kubat, E.; Akyol, F.B.; Kadan, M.; Erol, G.; Doğancı, S.; Yıldırım, V.; Bolcal, C. The C-reactive protein/albumin ratio as a new predictor for postoperative atrial fibrillation after coronary artery bypass graft surgery. J. Card. Surg. 2020, 35, 2747–2753. [Google Scholar] [CrossRef]
- Kelesoglu, S.; Yilmaz, Y.; Ozkan, E.; Calapkorur, B.; Dursun, Z.B.; Ulu-Kilic, A.; Elcık, D. Usefulness of C-reactive protein/albumin ratio as a predictor of new-onset atrial fibrillation in SARS-CoV-2. Biomark. Med. 2021, 15, 1167–1175. [Google Scholar] [CrossRef]
- Bayrak, M. Predictive value of C-Reactive Protein/Albumin ratio in patients with chronic complicated diabetes mellitus. Pak. J. Med. Sci. 2019, 35, 1616–1621. [Google Scholar] [CrossRef]


| Variable | Women n = 883 mean ± SD (Median and Quartiles) | Men n = 307 Mean ± SD (Median and Quartiles) | p-Value |
|---|---|---|---|
| Age [years] | 81.94 ± 7.98 83 (77–87) | 80.79 ± 7.98 82 (75–87) | 0.02 |
| BMI [kg/m2] | 26 ± 5.40 26 (23–30) | 26.40 ± 4.27 25 (23–28) | 0.39 |
| Body mass [kg] | 65 ± 14.2 64 (55–74) | 76 ± 13.68 75 (67–84) | <0.001 |
| NLR | 3.15 ± 2.55 2.5 (1.8–3.6) | 3.31 ± 2.69 2.7 (2.0–3.9) | 0.05 |
| LMR | 3.10 ± 1.29 2.8 (2.2–3.8) | 2.7 ± 1.08 2.6 (1.9–3.4) | <0.001 |
| PLR | 164 ± 93 145 (108–193) | 144 ± 71 132 (98–169) | <0.001 |
| LCR | 1.3 ± 1.4 0.8 (0.4–1.6) | 1.4 ± 1.5 0.8 (0.4–1.9) | 0.53 |
| MWR | 0.08 ± 0.02 0.08 (0.06–0.09) | 0.09 ± 0.02 0.08 (0.07–0.10) | <0.001 |
| SII | 775 ± 776 591 (391–908) | 683 ± 571 524 (355–814) | 0.02 |
| PNI | 406 ± 42 412 (384–433) | 407 ± 41 414 (382–436) | 0.66 |
| CAR | 0.05 ± 0.04 0.04 (0.02–0.08) | 0.05 ± 0.04 0.04 (0.01–0.08) | 0.17 |
| Arterial hypertension; n (%) | 763 (86.41%) | 241 (78.50%) | 0.001 |
| Diabetes mellitus; n (%) | 281 (31.86%) | 115 (37.46%) | 0.07 |
| Lipid disorders; n (%) | 482 (54.59%) | 133 (43.32%) | <0.001 |
| Previous stroke; n (%) | 142 (16.08%) | 49 (15.96%) | 0.96 |
| Coronary artery disease; n (%) | 307 (34.77%) | 108 (35.18%) | 0.89 |
| Previous myocardial infarction; n (%) | 68 (7.70%) | 48 (15.64%) | 0.0005 |
| Atrial fibrillation; n (%) | 191 (21.63%) | 69 (22.48%) | 0.75 |
| Heart failure; n (%) | 451 (51.08%) | 133 (43.32%) | 0.019 |
| Chronic kidney disease (%) | 405 (45.92%) | 122 (39.74%) | 0.06 |
| Obstructive lung diseases; n (%) | 97 (10.99%) | 35 (11.40%) | 0.84 |
| Osteoarthritis; n (%) | 395 (44.73%) | 98 (31.92%) | <0.001 |
| Osteoporosis; n (%) | 271 (30.69%) | 38 (12.38%) | <0.001 |
| Fractures; n (%) | 144 (16.33%) | 26 (8.47%) | <0.001 |
| Gastrointestinal diseases; n (%) | 200 (22.65%) | 90 (29.32%) | 0.019 |
| Neoplastic diseases; n (%) | 121 (13.70%) | 57 (18.57%) | 0.03 |
| Depression; n (%) | 386 (43.71%) | 94 (30.62%) | 0.001 |
| Dementia; n (%) | 361 (40.88%) | 106 (34.53%) | 0.04 |
| Parkinson’s disease, n (%) | 33 (3.74%) | 28 (9.12%) | <0.001 |
| Variable | Sex | Age | BMI | ||
|---|---|---|---|---|---|
| rho | p | rho | p | ||
| NLR | All | 0.13 | <0.001 | −0.08 | 0.01 |
| Women | 0.14 | <0.001 | −0.07 | 0.04 | |
| Men | 0.12 | 0.04 | −0.10 | 0.09 | |
| LMR | All | −0.19 | <0.001 | 0.09 | 0.004 |
| Women | −0.20 | <0.001 | 0.08 | 0.02 | |
| Men | −0.23 | <0.001 | 0.11 | 0.06 | |
| PLR | All | 0.03 | 0.3 | −0.13 | <0.001 |
| Women | 0.05 | 0.14 | −0.13 | <0.001 | |
| Men | −0.04 | 0.47 | −0.15 | 0.01 | |
| LCR | All | −0.03 | 0.3 | −0.15 | <0.001 |
| Women | −0.01 | 0.84 | −0.18 | <0.001 | |
| Men | −0.09 | 0.12 | −0.02 | 0.65 | |
| MWR | All | 0.11 | <0.001 | −0.06 | 0.04 |
| Women | 0.14 | <0.001 | −0.06 | 0.08 | |
| Men | 0.07 | 0.23 | −0.05 | 0.41 | |
| SII | All | 0.07 | 0.02 | −0.08 | 0.008 |
| Women | 0.08 | 0.03 | −0.07 | 0.039 | |
| Men | 0.03 | 0.61 | −0.11 | 0.06 | |
| PNI | All | −0.28 | <0.001 | 0.11 | 0.001 |
| Women | −0.25 | <0.001 | 0.12 | 0.001 | |
| Men | −0.35 | <0.001 | 0.06 | 0.32 | |
| CAR | All | 0.06 | 0.04 | 0.16 | <0.001 |
| Women | 0.04 | 0.30 | 0.19 | <0.001 | |
| Men | 0.12 | 0.049 | 0.06 | 0.30 | |
| Sex | Diabetes Mellitus | Lipid Disorder | Previous Stroke | Atrial Fibrillation | Chronic Heart Failure | Chronic Kidney Disease | Obstructive Lung Disease | Osteoarthritis | Osteoporosis | Gastrointestinal Diseases | Dementia | Parkinson’s Disease | |
|---|---|---|---|---|---|---|---|---|---|---|---|---|---|
| NLR | All | ↑z = 2.06 | ↓z = −2.47 | ↑z = 2.05 | ↑z = 2.23 | ↓z = −1.96 | |||||||
| p = 0.03 | p = 0.013 | ns | ns | p = 0.04 | p = 0.02 | ns | ns | ns | p = 0.04 | ns | ns | ||
| Women | ↑z = −2.33 | ↑z = 2.04 | ↑z = 1.96 | ||||||||||
| ns | ns | p = 0.02 | ns | p = 0.04 | p = 0.04 | ns | ns | ns | ns | ns | ns | ||
| Men | ↓z = −2.35 | ↑z = 2.05 | ↑z = 2.04 | ||||||||||
| ns | p = 0.01 | ns | ns | p = 0.04 | ns | ns | ns | ns | ns | ns | p = 0.04 | ||
| LMR | All | ↑z = 3.7 | ↓z = 2.04 | ↓z = −4.20 | ↓z = −2.91 | ↓z = −3.11 | ↓z = −2.46 | ||||||
| ns | p = 0.001 | p = 0.04 | p < 0.001 | p < 0.001 | p = 0.001 | p = 0.01 | ns | ns | ns | ns | ns | ||
| Women | ↑z = 1.99 | ↓z = 3.02 | ↓z = −3.13 | ↓z = −3.27 | ↓z = −2.50 | ↓z = −2.46 | |||||||
| ns | p = 0.04 | p = 0.002 | p = 0.001 | p < 0.001 | p = 0.01 | p = 0.01 | ns | ns | ns | ns | ns | ||
| Men | ↑z = 3.26 | ↓z = −3.09 | ↓z = −2.91 | ↓z = −2.47 | |||||||||
| ns | p = 0.001 | ns | p = 0.001 | p = 0.003 | p = 0.01 | ns | ns | ns | ns | ns | ns | ||
| PLR | All | ↓z = −3.13 | ↓z = −2.04 | ↑z = 2.37 | |||||||||
| p = 0.001 | ns | ns | p = 0.04 | ns | ns | ns | ns | p < 0.001 | ns | ns | ns | ||
| Women | ↓z = −2.73 | ↓z = −2.00 | |||||||||||
| p = 0.001 | ns | ns | p = 0.04 | ns | ns | ns | ns | ns | ns | ns | ns | ||
| Men | ↑z = 2.24 | ||||||||||||
| ns | ns | ns | ns | ns | ns | ns | ns | ns | ns | ns | p = 0.02 | ||
| LCR | All | ↑z = 1.96 | ↓z = −3.88 | ↓z = −2.19 | ↓z = −2.52 | ↑z = 2.36 | ↑z = 2.90 | ||||||
| ns | p = 0.04 | ns | p < 0.001 | p < 0.03 | p = 0.005 | ns | ns | p < 0.01 | p = 0.003 | ns | ns | ||
| Women | ↓z = −3.41 | ↓z = −2.90 | ↓z = −2.40 | ↓z = −2.58 | ↑z = 2.54 | ↑z = 2.36 | |||||||
| ns | ns | ns | p < 0.001 | p < 0.003 | p = 0.01 | ns | p = 0.009 | p < 0.01 | p = 0.01 | ns | ns | ||
| Men | ↑z = 3.09 | ↓z = −2.19 | ↑z = 2.14 | ||||||||||
| ns | p = 0.001 | ns | ns | p = 0.02 | ns | ns | p = 0.03 | ns | ns | ns | ns | ||
| MWR | All | ↓z = −3.15 | ↑z = 4.53 | ↑z = 2.71 | ↑z = 2.19 | ↓z = −2.24 | |||||||
| p = 0.001 | ns | ns | p < 0.001 | ns | ns | p = 0.006 | ns | ns | p = 0.02 | p = 0.02 | ns | ||
| Women | ↓z = −3.20 | ↑z = 3.06 | ↑z = 2.32 | ↑z = 2.41 | |||||||||
| p < 0.001 | ns | ns | p = 0.002 | p = 0.02 | ns | p = 0.01 | ns | ns | ns | ns | ns | ||
| Men | ↑z = 3.84 | ||||||||||||
| ns | ns | ns | p < 0.001 | ns | ns | ns | ns | ns | ns | ns | ns | ||
| SII | All | ↓z = −2.18 | |||||||||||
| ns | ns | ns | p = 0.02 | ns | ns | ns | ns | ns | ns | ns | ns | ||
| Women | ↓z = −1.97 | ||||||||||||
| ns | ns | ns | p = 0.04 | ns | ns | ns | ns | ns | ns | ns | ns | ||
| Men | |||||||||||||
| ns | ns | ns | ns | ns | ns | ns | ns | ns | ns | ns | ns | ||
| PNI | All | ↑z = 6.69 | ↓z = −4.74 | ↓z = −5.15 | ↓z = −3.82 | ↓z = −4.19 | ↑z = 3.22 | z | ↓z = −7.28 | ||||
| ns | p < 0.001 | p < 0.001 | p < 0.001 | p < 0.001 | p < 0.001 | ns | p = 0.001 | ns | ns | p < 0.001 | ns | ||
| Women | ↑z = 5.02 | ↓z = −4.38 | ↓z = −4.48 | ↓z = −3.60 | ↓z = −3.10 | ↑z = 2.55 | ↑z = 2.12 | ↓z = −6.24 | |||||
| ns | p < 0.001 | p < 0.001 | p < 0.001 | p < 0.001 | p = 0.001 | ns | p = 0.01 | p = 0.03 | ns | p < 0.001 | ns | ||
| Men | ↑z = −4.81 | ↓z = −2.55 | ↓z = −3.82 | ↓z = −2.95 | ↑z = 2.21 | ↓z = −3.71 | |||||||
| ns | p < 0.001 | ns | p = 0.01 | p < 0.001 | p = 0.003 | ns | p = 0.02 | ns | p < 0.001 | ns | |||
| CAR | All | ↑z = 3.87 | ↑z = 3.84 | ↑z = 3.504 | ↑z = 3.04 | ↓z = −3.09 | ↓z = −2.36 | ||||||
| p < 0.001 | ns | ns | p < 0.001 | p < 0.002 | p = 0.002 | ns | ns | p < 0.001 | p = 0.01 | ns | ns | ||
| Women | ↑z = 3.40 | ↑z = 3.64 | ↑z = 3.30 | ↑z = 2.69 | ↑z = 2.31 | ↓z = −3.30 | ↓z = −2.08 | ||||||
| p < 0.001 | ns | ns | p < 0.001 | p < 0.001 | p = 0.007 | ns | p = 0.02 | p < 0.001 | ns | ns | p = 0.03 | ||
| Men | ↑z = 1.99 | ↓z = −2.16 | ↑z = 2.1 | ↓z = −2.06 | ↑z = 2.04 | ||||||||
| p = 0.04 | p = 0.03 | ns | ns | ns | ns | p = 0.03 | p = 0.03 | ns | ns | p = 0.04 | ns |
| General Linear Model | R2 | p |
|---|---|---|
| NLR = −0.63 + 0.047 × Age [years] | 0.15 | <0.001 |
| LMR = 5.32 − 0.03 × Age [years] − 0.08 [if present heart failure] − 0.08 [if present atrial fibrillation] − 0.2 [if man] | 0.26 | <0.001 |
| PLR = 211.75 − 2.38 × BMI [kg/m2] − 6.67 [if present atrial fibrillation] − 10.5 [if man] | 0.18 | <0.001 |
| LCR = 2.44 − 0.04 × BMI [kg/m2] | 0.13 | <0.001 |
| MWR = 0.06 + 0.0003 × Age [years] + 0.003 [if man] − 0.002 [if present diabetes mellitus] + 0.004 [if present atrial fibrillation] − 0.002 [if present dementia] | 0.13 | <0.001 |
| SII = 1040.61 − 11.48 × BMI [kg/m2] | 0.05 | <0.001 |
| PNI = 504.73 − 1.28 × Age [years] + 5.90 [if present lipid disorders] − 5.48 [if present previous stroke] − 3.39 [if present atrial fibrillation] − 4.95 [if present dementia] + 2.66 [ if present osteoarthritis] | 0.15 | <0.001 |
| CAR = −0.013 + 0.0004 × Age [years] + 0.0012 × BMI [kg/m2] + 0.003 [if present diabetes mellitus] + 0.005 [if present atrial fibrillation] − 0.003 [if present osteoporosis] | 0.24 | <0.001 |
Disclaimer/Publisher’s Note: The statements, opinions and data contained in all publications are solely those of the individual author(s) and contributor(s) and not of MDPI and/or the editor(s). MDPI and/or the editor(s) disclaim responsibility for any injury to people or property resulting from any ideas, methods, instructions or products referred to in the content. |
© 2024 by the authors. Licensee MDPI, Basel, Switzerland. This article is an open access article distributed under the terms and conditions of the Creative Commons Attribution (CC BY) license (https://creativecommons.org/licenses/by/4.0/).
Share and Cite
Stephenson, S.S.; Kravchenko, G.; Korycka-Błoch, R.; Kostka, T.; Sołtysik, B.K. How Immunonutritional Markers Are Associated with Age, Sex, Body Mass Index and the Most Common Chronic Diseases in the Hospitalized Geriatric Population—A Cross Sectional Study. Nutrients 2024, 16, 2464. https://doi.org/10.3390/nu16152464
Stephenson SS, Kravchenko G, Korycka-Błoch R, Kostka T, Sołtysik BK. How Immunonutritional Markers Are Associated with Age, Sex, Body Mass Index and the Most Common Chronic Diseases in the Hospitalized Geriatric Population—A Cross Sectional Study. Nutrients. 2024; 16(15):2464. https://doi.org/10.3390/nu16152464
Chicago/Turabian StyleStephenson, Serena S., Ganna Kravchenko, Renata Korycka-Błoch, Tomasz Kostka, and Bartłomiej K. Sołtysik. 2024. "How Immunonutritional Markers Are Associated with Age, Sex, Body Mass Index and the Most Common Chronic Diseases in the Hospitalized Geriatric Population—A Cross Sectional Study" Nutrients 16, no. 15: 2464. https://doi.org/10.3390/nu16152464