
Effectiveness of Resistance Training Program on Body Composition in Adults Following Vegan Diet versus Omnivorous Diet; Developed in Mobile Health Modality

 , ,
, ,  ,
,  and
and 
Abstract
:1. Introduction
2. Materials and Methods
2.1. Study Design
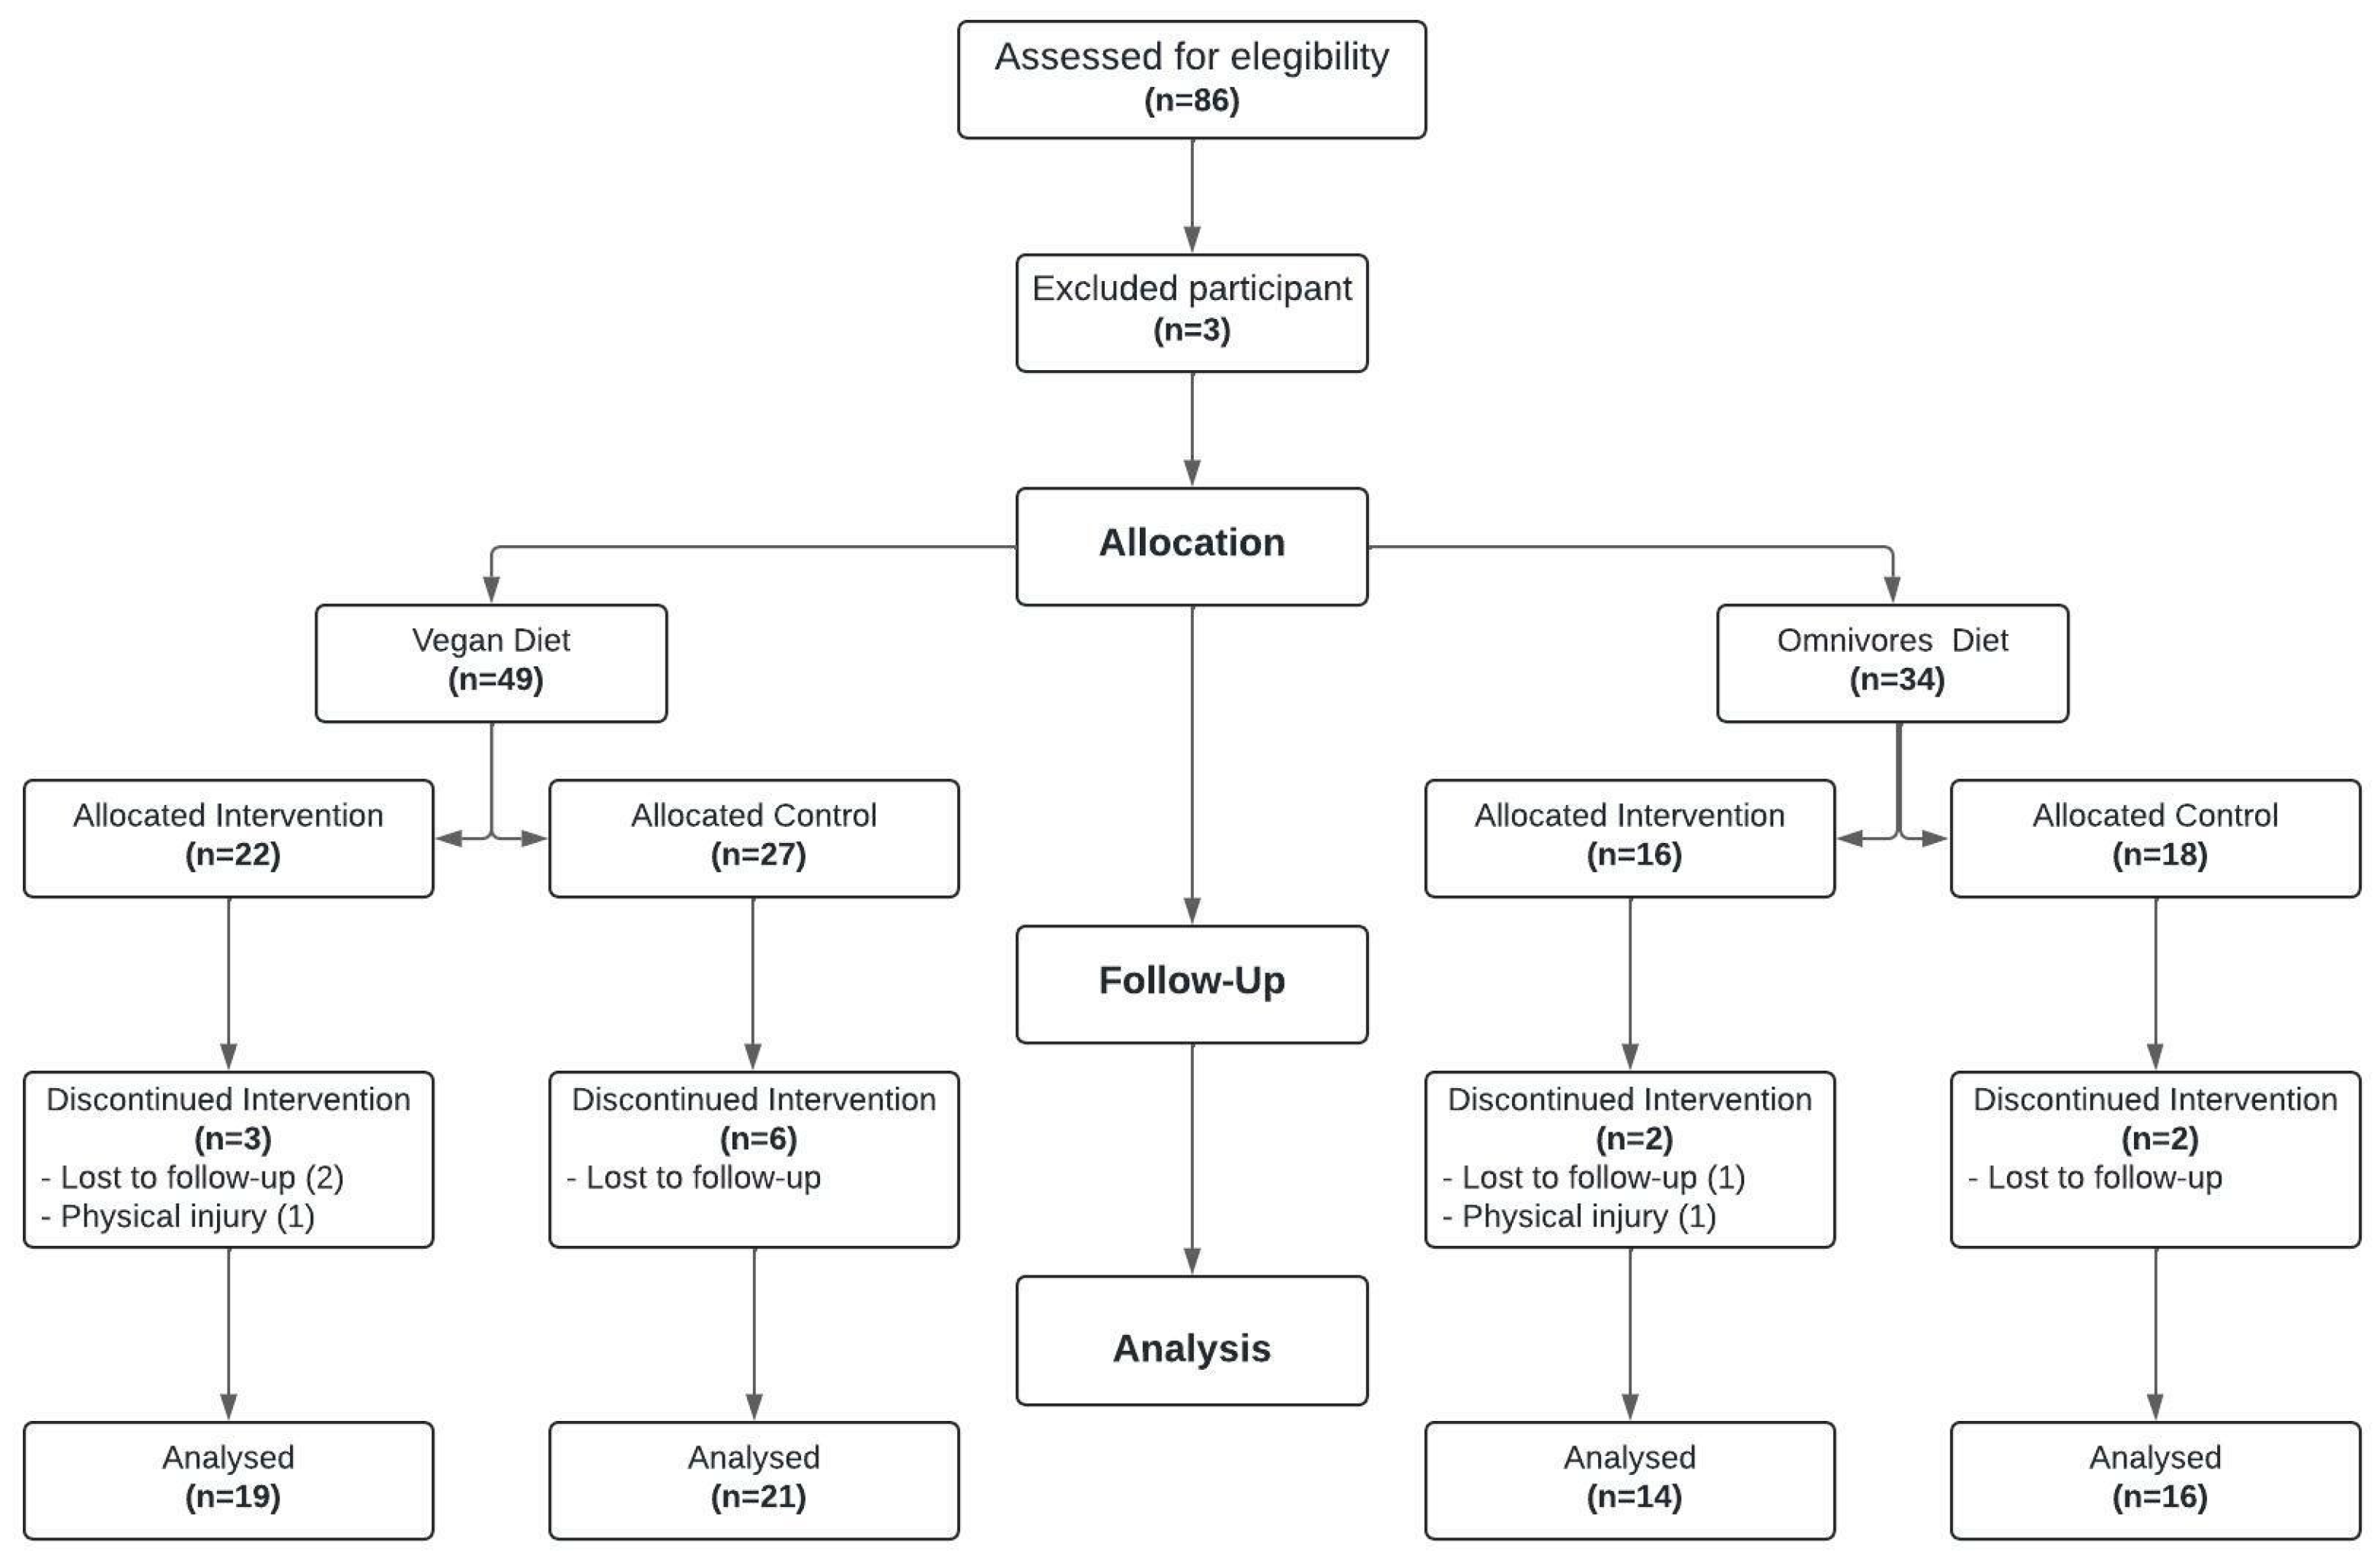
2.2. Participants
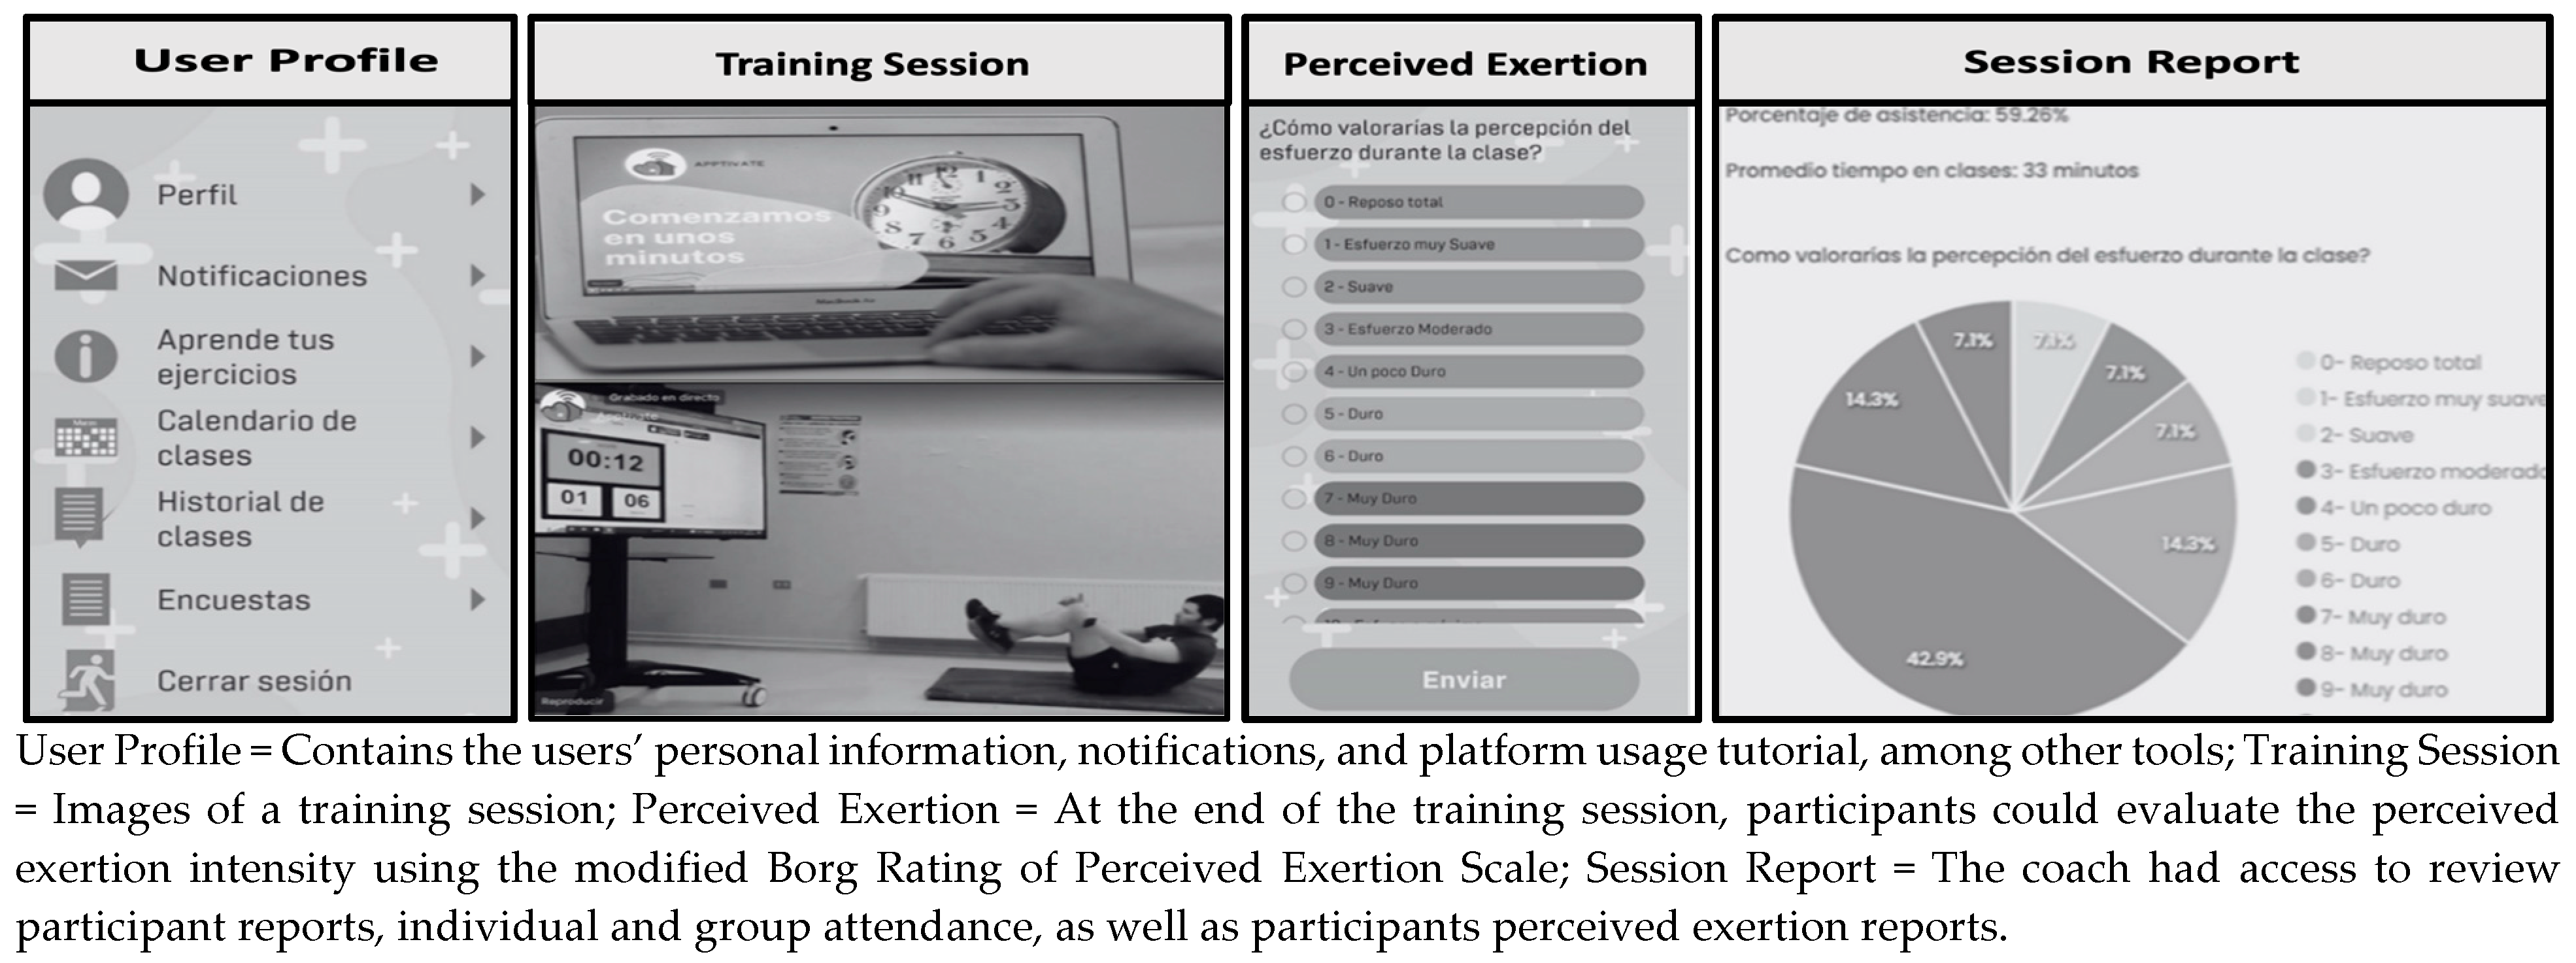
2.3. Intervention
2.4. Anthropometric and Body Composition Measures
2.5. Statistical Analysis
3. Results
3.1. Baseline Data
3.2. Post-Intervention Results
3.2.1. Effect of the Intervention on Variables by Group
3.2.2. Comparison of Pre–Post Intervention Differentials Across All Groups
3.2.3. Linear Regression of the Variable % Fat Mass Difference
4. Discussion
4.1. Body Fat Mass
4.2. Musculoskeletal Mass
4.3. Limitations of the Study
5. Conclusions
Supplementary Materials
Author Contributions
Funding
Institutional Review Board Statement
Informed Consent Statement
Data Availability Statement
Conflicts of Interest
References
- Yokoyama, Y.; Levin, S.M.; Barnard, N.D. Association between plant-based diets and plasma lipids: A systematic review and meta-analysis. Nutr. Rev. 2017, 75, 683–698. [Google Scholar] [CrossRef] [PubMed]
- Hauner, H. Vegetarian/vegan diet—Reasonable or dangerous? MMW Fortschr. Med. 2015, 157, 41–43. [Google Scholar] [CrossRef] [PubMed]
- Isenmann, E.; Eggers, L.; Havers, T.; Schalla, J.; Lesch, A.; Geisler, S. Change to a Plant-Based Diet Has No Effect on Strength Performance in Trained Persons in the First 8 Weeks—A 16-Week Controlled Pilot Study. Int. J. Environ. Res. 2023, 20, 1856. [Google Scholar] [CrossRef] [PubMed]
- Kahleova, H.; Fleeman, R.; Hlozkova, A.; Holubkov, R.; Barnard, N.D. A plant-based diet in overweight individuals in a 16-week randomized clinical trial: Metabolic benefits of plant protein. Nutr. Diabetes 2018, 8, 58. [Google Scholar] [CrossRef]
- Crosby, L.; Rembert, E.; Levin, S.; Green, A.; Ali, Z.; Jardine, M.; Nguyen, M.; Elliott, P.; Goldstein, D.; Freeman, A.; et al. Changes in Food and Nutrient Intake and Diet Quality on a Low-Fat Vegan Diet Are Associated with Changes in Body Weight, Body Composition, and Insulin Sensitivity in Overweight Adults: A Randomized Clinical Trial. J. Acad. Nutr. Diet. 2022, 122, 1922–1939. [Google Scholar] [CrossRef] [PubMed]
- Kahleova, H.; Petersen, K.F.; Shulman, G.I.; Alwarith, J.; Rembert, E.; Tura, A.; Hill, M.; Holubkov, R.; Barnard, N.D. Effect of a Low-Fat Vegan Diet on Body Weight, Insulin Sensitivity, Postprandial Metabolism, and Intramyocellular and Hepatocellular Lipid Levels in Overweight Adults. JAMA Network Open. 2020, 3, e2025454. [Google Scholar] [CrossRef] [PubMed]
- Hemler, E.C.; Hu, F.B. Plant-Based Diets for Personal, Population, and Planetary Health. Adv. Nutr. 2019, 10, S275–S283. [Google Scholar] [CrossRef] [PubMed]
- Rogerson, D. Vegan diets: Practical advice for athletes and exercisers. J. Int. Soc. Sports Nutr. 2017, 14, 36. [Google Scholar] [CrossRef] [PubMed]
- Eveleigh, E.; Coneyworth, L.; Welham, S. Systematic review and meta-analysis of iodine nutrition in modern vegan and vegetarian diets. Br. J. Nutr. 2023, 130, 1580–1594. [Google Scholar] [CrossRef]
- Dressler, J.; Storz, M.A.; Müller, C.; Kandil, F.I.; Kessler, C.S.; Michalsen, A.; Jeitler, M. Does a Plant-Based Diet Stand Out for Its Favorable Composition for Heart Health? Dietary Intake Data from a Randomized Controlled Trial. Nutrients 2022, 14, 4597. [Google Scholar] [CrossRef]
- Barnard, N.D.; Goldman, D.M.; Loomis, J.F.; Kahleova, H.; Levin, S.M.; Neabore, S.; Batts, T.C. Plant-Based Diets for Cardiovascular Safety and Performance in Endurance Sports. Nutrients 2019, 11, 130. [Google Scholar] [CrossRef] [PubMed]
- Bakaloudi, D.R.; Halloran, A.; Rippin, H.L.; Oikonomidou, A.C.; Dardavesis, T.I.; Williams, J.; Wickramasinghe, K.; Breda, J.; Chourdakis, M. Intake and adequacy of the vegan diet. A systematic review of the evidence. Clin. Nutr. 2020, 40, 3503–3521. [Google Scholar] [CrossRef]
- Pohl, A.; Schünemann, F.; Bersiner, K.; Gehlert, S. The Impact of Vegan and Vegetarian Diets on Physical Performance and Molecular Signaling in Skeletal Muscle. Nutrients 2021, 13, 3884. [Google Scholar] [CrossRef]
- Pinckaers, P.J.M.; Trommelen, J.; Snijders, T.; van Loon, L.J.C. The Anabolic Response to Plant-Based Protein Ingestion. Sports Med. 2021, 51, 59–74. [Google Scholar] [CrossRef]
- McGlory, C.; van Vliet, S.; Stokes, T.; Mittendorfer, B.; Phillips, S.M. The impact of exercise and nutrition on the regulation of skeletal muscle mass. Physiol. J. 2019, 597, 1251–1258. [Google Scholar] [CrossRef]
- Nilsson, M.I.; Mikhail, A.; Lan, L.; Di Carlo, A.; Hamilton, B.; Barnard, K.; Hettinga, B.P.; Hatcher, E.; Tarnopolsky, M.G.; Nederveen, J.P.; et al. A Five-Ingredient Nutritional Supplement and Home-Based Resistance Exercise Improve Lean Mass and Strength in Free-Living Elderly. Nutrients 2020, 12, 2391. [Google Scholar] [CrossRef] [PubMed]
- Distefano, G.; Goodpaster, B.H. Effects of Exercise and Aging on Skeletal Muscle. Cold Spring Harb. 2017, 8, a029785. [Google Scholar] [CrossRef]
- Directrices de la OMS Sobre Actividad Física y Hábitos Sedentarios. Available online: https://iris.who.int/bitstream/handle/10665/337004/9789240014817-spa.pdf?sequence=1 (accessed on 5 May 2024).
- Encuesta Nacional de Salud 2016–2017 Primeros Resultados 2017. Available online: https://www.minsal.cl/wp-content/uploads/2017/11/ENS-2016-17_PRIMEROS-RESULTADOS.pdf (accessed on 7 May 2024).
- Goni Mateos, L.; Aray Miranda, M.; Martínez, H.A.; Cuervo Zapatel, M. Validación de un cuestionario de frecuencia de consumo de grupos de alimentos basado en un sistema de intercambios. Nutr Hosp. 2016, 33, 1391–1399. [Google Scholar] [CrossRef]
- Duncan, M.J.; Rosenkranz, R.R.; Vandelanotte, C.; Caperchione, C.M.; Rebar, A.L.; Maeder, A.J.; Tague, R.; Savage, T.N.; van Itallie, A.; Mummery, W.K.; et al. What is the impact of obtaining medical clearance to participate in a randomised controlled trial examining a physical activity intervention on the socio-demographic and risk factor profiles of included participants? Trials 2016, 17, 580. [Google Scholar] [CrossRef]
- Craig, C.L.; Marshall, A.L.; Sjöström, M.; Bauman, A.E.; Booth, M.L.; Ainsworth, B.E.; Pratt, M.; Ekelund, U.L.; Yngve, A.; Sallis, J.F.; et al. International Physical Activity Questionnaire: 12-Country Reliability and Validity. Med. Sci. Sports Exerc. 2003, 35, 1381–1395. [Google Scholar] [CrossRef]
- Reyes-Molina, D.; Nazar, G.; Cigarroa, I.; Marín, F.C.; Regla, R.C.; Pardo, K.R.; Martorell, M.; Ochoa, C.; Ulloa, N.; Zapata-Lamana, R. Motivación, barreras y beneficios para la práctica de ejercicio físico en una intervención mobile health en adultos del Biobío, Chile. Retos 2023, 43, 623–631. [Google Scholar] [CrossRef]
- Whittaker, R.L.; Sonne, M.W.; Potvin, J.R. Ratings of perceived fatigue predict fatigue induced declines in muscle strength during tasks with different distributions of effort and recovery. J. Electromyogr. Kinesiol. 2019, 47, 88–95. [Google Scholar] [CrossRef] [PubMed]
- Alomia León, R.; Peña, S.E.; Hernandez Mosqueira, C.; Espinoza Cortez, J. Comparación de los métodos de antropometría y bioimpedancia eléctrica a través de la determinación de la composición corporal en estudiantado universitario. Mhsalud Rev. En Cienc. Mov. Hum. Salud 2022, 19, 1–10. [Google Scholar] [CrossRef]
- Callaway, C.W.; Chumlea, W.C.; Bouchard, C.; Himes, J.H.; Lohman, T.G.; Martin, A.D. Circumferences. In Anthropometric Standardization Reference Manual; Lohman, T.G., Roche, A.F., Martorell, R., Eds.; Human Kinetics: Champaign, IL, USA, 1991; pp. 44–45. ISBN 9780873221214. [Google Scholar]
- BMJ. Correlation and Regression. Available online: https://www.bmj.com/about-bmj/resources-readers/publications/statistics-square-one/11-correlation-and-regression (accessed on 9 July 2024).
- Barnard, N.D.; Scialli, A.R.; Turner-McGrievy, G.; Lanou, A.J.; Glass, J. The effects of a low-fat, plant-based dietary intervention on body weight, metabolism, and insulin sensitivity. Am. J. Med. 2005, 118, 991–997. [Google Scholar] [CrossRef]
- Boutros, G.H.; Landry-Duval, M.-A.; Garzon, M.; Karelis, A.D. Is a vegan diet detrimental to endurance and muscle strength? Eur. J. Clin. Nutr. 2020, 74, 1550–1555. [Google Scholar] [CrossRef]
- Kahleova, H.; McCann, J.; Alwarith, J.; Rembert, E.; Tura, A.; Holubkov, R.; Barnard, N.D. A plant-based diet in overweight adults in a 16-week randomized clinical trial: The role of dietary acid load. Clin. Nutr. ESPE 2021, 44, 150–158. [Google Scholar] [CrossRef] [PubMed]
- Zwierzchowska, A.; Rosołek, B.; Sikora, M.; Celebańska, D. Forced Sedentariness and Sports Activity as Factors Differentating Anthropometric Characteristics, Indices, and Body Composition in People with Disabilities. Biology 2022, 11, 906. [Google Scholar] [CrossRef]
- Zhang, X.M.; Liu, C.; Sun, X.; Jiao, J.; Wu, X.; Xie, X. Comment on “global prevalence of sarcopenic obesity in older adults: A systematic review and meta-analysis”. Clin. Nutr. 2022, 41, 1451–1453. [Google Scholar] [CrossRef] [PubMed]
- Egan, B.; Zierath Juleen, R. Exercise Metabolism and the Molecular Regulation of Skeletal Muscle Adaptation. Cell Metab. 2013, 17, 162–184. [Google Scholar] [CrossRef]
- Hevia-Larraín, V.; Gualano, B.; Longobardi, I.; Gil, S.; Fernandes, A.L.; Costa, L.A.R.; Pereira, R.M.R.; Artioli, G.G.; Phillips, S.M.; Roschel, H. High-Protein Plant-Based Diet Versus a Protein-Matched Omnivorous Diet to Support Resistance Training Adaptations: A Comparison Between Habitual Vegans and Omnivores. Sports Med. 2021, 51, 1317–1330. [Google Scholar] [CrossRef] [PubMed]
- Garber, C.E.; Blissmer, B.; Deschenes, M.R.; Franklin, B.A.; Lamonte, M.J.; Lee, I.-M.; Nieman, D.C.; Swain, D.P. Quantity and Quality of Exercise for Developing and Maintaining Cardiorespiratory, Musculoskeletal, and Neuromotor Fitness in Apparently Healthy Adults. Med. Sci. Sports Exerc. 2011, 43, 1334–1359. [Google Scholar] [CrossRef] [PubMed]
- Page, J.; Erskine, R.M.; Hopkins, N.D. Skeletal muscle properties and vascular function do not differ between healthy, young vegan and omnivorous men. Eur. J. Sport Sci. 2021, 22, 559–568. [Google Scholar] [CrossRef] [PubMed]
- Witard, O.C.; McGlory, C.; Hamilton, D.L.; Phillips, S.M. Growing older with health and vitality: A nexus of physical activity, exercise and nutrition. Biogerontology 2016, 17, 529–546. [Google Scholar] [CrossRef] [PubMed]

| Total (n = 70) | VEGD-RTP (n = 19) | VEGD-C (n = 21) | OMND-RTP (n = 14) | OMND-C (n = 16) | p | |
|---|---|---|---|---|---|---|
| Sociodemographics | ||||||
| Women (n, %) | 47 (67.1%) | 10 (52.6%) | 4 (19%) | 10 (71.4%) | 11 (68.8%) | 0.154 a |
| Males (n, %) | 23 (32.9%) | 9 (47.4%) | 17 (81%) | 4 (28.6%) | 5 (31.2%) | |
| Age (Mean, SD) | 30.13 (±8.6) | 27.53 (±4.1) ≠ = | 26.81 (±5.0) = | 33.10 (±11.0) = | 35.00 (±11.1) ≠ = | 0.030 w |
| CD (n, %) Yes | 12 (17.1%) | 1 (5.3%) | 4 (19%) | 4 (28.6%) | 3 (18.8%) | 0.251 w |
| CD (n, %) No | 58 (82%) | 18 (94.7%) | 17 (581%) | 10 (71.4%) | 13 (81.3%) | |
| PNC (n, %) Yes | 48 (68.6%) | 16 (84.2%) | 17 (81%) | 7 (50%) | 8 (50%) | 0.173 w |
| PNC (n, %) No | 22 (31.4%) | 3 (15.8%) | 4 (19%) | 7 (50%) | 8 (50%) | |
| Anthropometry | ||||||
| Weight (Mean, SD) | 69.11 (±15.2) | 62.00 (±8.8) ≠ = | 72.51 (±18.6) = | 68.34 (±11.9) = | 73.80 (±16.7) ≠ = | 0.080 a |
| Height (Mean, SD) | 164.72 (±8.1) | 164.83 (±8.6) | 165.41 (±9.2) | 164.00 (±3.6) | 164.40 (±7.6) | 0.960 a |
| BMI (Mean, SD) | 25.44 (±5.1) | 22.73 (±2.0) ≠ = | 26.61 (±6.7) = | 25.40 (±3.6) = | 27.20 (±5.3) ≠ = | 0.030 w |
| WC (Mean, SD) | 80.90 (±12.7) | 76.45 (±7.6) | 80.31 (±12.0) | 81.20 (±12.8) | 86.60 (±16.7) | 0.141 w |
| %FM (Mean, SD) | 31.10 (±9.6) | 26.30 (±9.2) | 32.19 (±11.6) | 32.20 (±6.4) | 34.40 (±7.5) | 0.060 w |
| KFM (Mean, SD) | 22.05 (±10.4) | 16.33 (±6.1) ≠ = | 24.51 (±14.0) = | 22.03 (±6.5) = | 25.62 (±9.5) ≠ = | 0.010 w |
| KLM (Mean, SD) | 26.10 (±5.8) | 25.19 (±5.3) | 26.58 (±5.8) | 25.80 (±5.3) | 26.71 (±7.0) | 0.850 a |
| Basal | Post-I | Effect Size (r) | p | |
|---|---|---|---|---|
| VEGD-RTP-I (n = 19) | ||||
| Weight | 61.40 [53.10; 70.20] | 59.90 [55.60; 67.10] | 0.092 | 0.687 |
| BMI | 23.00 [21.40; 24.00] | 22.70 [20.90; 23.40] | 0.179 | 0.434 |
| WC | 78.00 [71.50; 80.50] | 74.00 [72.00; 80.00] | 0.336 | 0.143 |
| %FM | 26.60 [19.00; 33.50] | 26.50 [14.40; 33.80] | 0.554 | 0.016 * |
| KFM | 16.30 [10.30; 21.60] | 15.40 [7.90; 20.20] | 0.480 | 0.036 * |
| KLM | 25.10 [21.10; 29.60] | 24.70 [21.00; 29.70] | 0.365 | 0.111 |
| VEGD-C (n = 21) | ||||
| Weight | 68.80 [60.20; 80.60] | 70.00 [59.40; 82.55] | 0.414 | 0.058 * |
| BMI | 25.10 [21.30; 31.35] | 24.60 [21.85; 31.65] | 0.418 | 0.056 * |
| WC | 77.00 [69.50; 89.50] | 77.50 [70.25; 91.00] | 0.474 | 0.030 * |
| %FM | 29.60 [21.95; 43.15] | 29.00 [24.10; 43.25] | 0.023 | 0.917 |
| KFM | 21.30 [14.40; 32.60] | 19.90 [15.15; 33.40] | 0.330 | 0.130 |
| KLM | 24.20 [22.50; 31.25] | 25.40 [22.90; 31.15] | 0.376 | 0.085 |
| OMND-RTP (n = 14) | ||||
| Weight | 67.40 [59.78; 73.30] | 68.60 [59.60; 74.98] | 0.178 | 0.506 |
| BMI | 24.50 [22.50; 27.10] | 25.10 [22.80; 27.78] | 0.310 | 0.247 |
| WC | 78.50 [73.38; 84.25] | 79.00 [75.00; 84.00] | 0.118 | 0.658 |
| %FM | 33.55 [27.88; 36.95] | 33.70 [27.80; 35.88] | 0.210 | 0.432 |
| KFM | 20.05 [17.75; 24.03] | 20.50 [15.95; 27.30] | 0.109 | 0.683 |
| KLM | 24.75 [21.00; 30.93] | 24.75 [21.18; 30.85] | 0.357 | 0.182 |
| OMND-C (n = 16) | ||||
| Weight | 67.70 [61.23; 88.3] | 71.20 [62.53; 91.75] | 0.590 | 0.018 * |
| BMI | 26.1 [23.78; 30.60] | 27.05 [25.03; 31.28] | 0.554 | 0.027 * |
| WC | 81.75 [72.63; 104.63] | 82.75 [75.50; 100.50] | 0.563 | 0.024 * |
| %FM | 33.05 [27.98; 39.95] | 34.80 [28.68; 43.60] | 0.731 | 0.003 * |
| KFM | 24.4 [19.2; 27.6] | 26.65 [21.36; 30.25] | 0.705 | 0.005 * |
| KLM | 24.3 [21.2; 31.7] | 24.50 [20.63; 34.50 | 0.117 | 0.640 |
| VEGD-RTP (n = 19) | VEGD-C (n = 21) | OMND-RTP (n = 14) | OMND-C (n = 16) | ||||||
|---|---|---|---|---|---|---|---|---|---|
| Diferential | r | Diferential | r | Diferential | r | Diferential | r | p | |
| Weight | −0.20 [−1.80; 1.90] | 0.092 | 1.30 [−0.40; 2.35] | 0.414 | 0.40 [−0.93; 1.80] | 0.178 | 2.35 [0.27; 3.43] | 0.590 | 0.087 |
| BMI | −0.20 [−0.80; 0.70] | 0.179 | 0.50 [−0.20; 0.95] | 0.418 | 0.15 [−0.23; 0.80] | 0.310 | 0.85 [−0.15; 1.30] | 0.554 | 0.054 |
| WC | −1.00 [3.00; 1.50] | 0.336 | 1.00 [0.50; 2.50] | 0.474 | 1.00 [−1.25; 1.62] | 0.118 | 1.00 [0.50; 2.38] | 0.563 | 0.064 |
| %FM | −1.20 [−4.00; 0.40] ≠ = | 0.554 | −0.20 [−1.55; 1.10] = | 0.023 | −0.90 [−2.82; 1.45] = | 0.210 | 1.50 [0.35; 3.13] ≠ = | 0.731 | <0.001 * |
| KFM | −0.70 [−2.80; 0.40] ≠ = | 0.480 | 0.60 [−0.55; 2.00] = | 0.330 | −0.50 [−2.05; 1.40] = | 0.109 | 1.65 [0.95; 3.22] ≠ = | 0.705 | <0.001 * |
| KLM | 0.40 [−0.40; 0.90] | 0.365 | 0.20 [−0.20; 0.90] | 0.376 | 0.25 [−0.22; 0.58] | 0.357 | −0.30 [−0.90; 0.85] | 0.117 | 0.510 |
| (Unadjusted) Analysis | (Adjusted) Analysis | |||||||
|---|---|---|---|---|---|---|---|---|
| % Fat Mass Difference | Coef | SE | CI 95% | p | Coef | SE | CI 95% | p |
| Age | 0.035 | 0.35 | −0.035–0.106 | 0.322 | −0.006 | 0.034 | −0.075–0.063 | 0.861 |
| VEGD-RTP | −3.564 | 0.756 | −5−074–−2.054 | <0.001 * | −3.610 | 0.804 | −5.220–−2.003 | <0.001 * |
| VEGD-C | −1.797 | 0.740 | −3.274–−0.327 | 0.018 * | −1.850 | 0.800 | −3.440–−0.260 | 0.024 * |
| OMND-RTP | −2.321 | 0.816 | −3.950–−0.692 | 0.006 * | −2.33 | 0.82 | −4.00–−0.69 | 0.001 * |
Disclaimer/Publisher’s Note: The statements, opinions and data contained in all publications are solely those of the individual author(s) and contributor(s) and not of MDPI and/or the editor(s). MDPI and/or the editor(s) disclaim responsibility for any injury to people or property resulting from any ideas, methods, instructions or products referred to in the content. |
© 2024 by the authors. Licensee MDPI, Basel, Switzerland. This article is an open access article distributed under the terms and conditions of the Creative Commons Attribution (CC BY) license (https://creativecommons.org/licenses/by/4.0/).
Share and Cite
Cárcamo-Regla, R.; Zapata-Lamana, R.; Ochoa-Rosales, C.; Martorell, M.; Carrasco-Marín, F.; Molina-Recio, G. Effectiveness of Resistance Training Program on Body Composition in Adults Following Vegan Diet versus Omnivorous Diet; Developed in Mobile Health Modality. Nutrients 2024, 16, 2539. https://doi.org/10.3390/nu16152539
Cárcamo-Regla R, Zapata-Lamana R, Ochoa-Rosales C, Martorell M, Carrasco-Marín F, Molina-Recio G. Effectiveness of Resistance Training Program on Body Composition in Adults Following Vegan Diet versus Omnivorous Diet; Developed in Mobile Health Modality. Nutrients. 2024; 16(15):2539. https://doi.org/10.3390/nu16152539
Chicago/Turabian StyleCárcamo-Regla, Richar, Rafael Zapata-Lamana, Carolina Ochoa-Rosales, Miquel Martorell, Fernanda Carrasco-Marín, and Guillermo Molina-Recio. 2024. "Effectiveness of Resistance Training Program on Body Composition in Adults Following Vegan Diet versus Omnivorous Diet; Developed in Mobile Health Modality" Nutrients 16, no. 15: 2539. https://doi.org/10.3390/nu16152539