
Evaluating the Quality and Comparative Validity of Manual Food Logging and Artificial Intelligence-Enabled Food Image Recognition in Apps for Nutrition Care
 , , , ,
  and
and
Abstract
1. Introduction
2. Materials and Methods
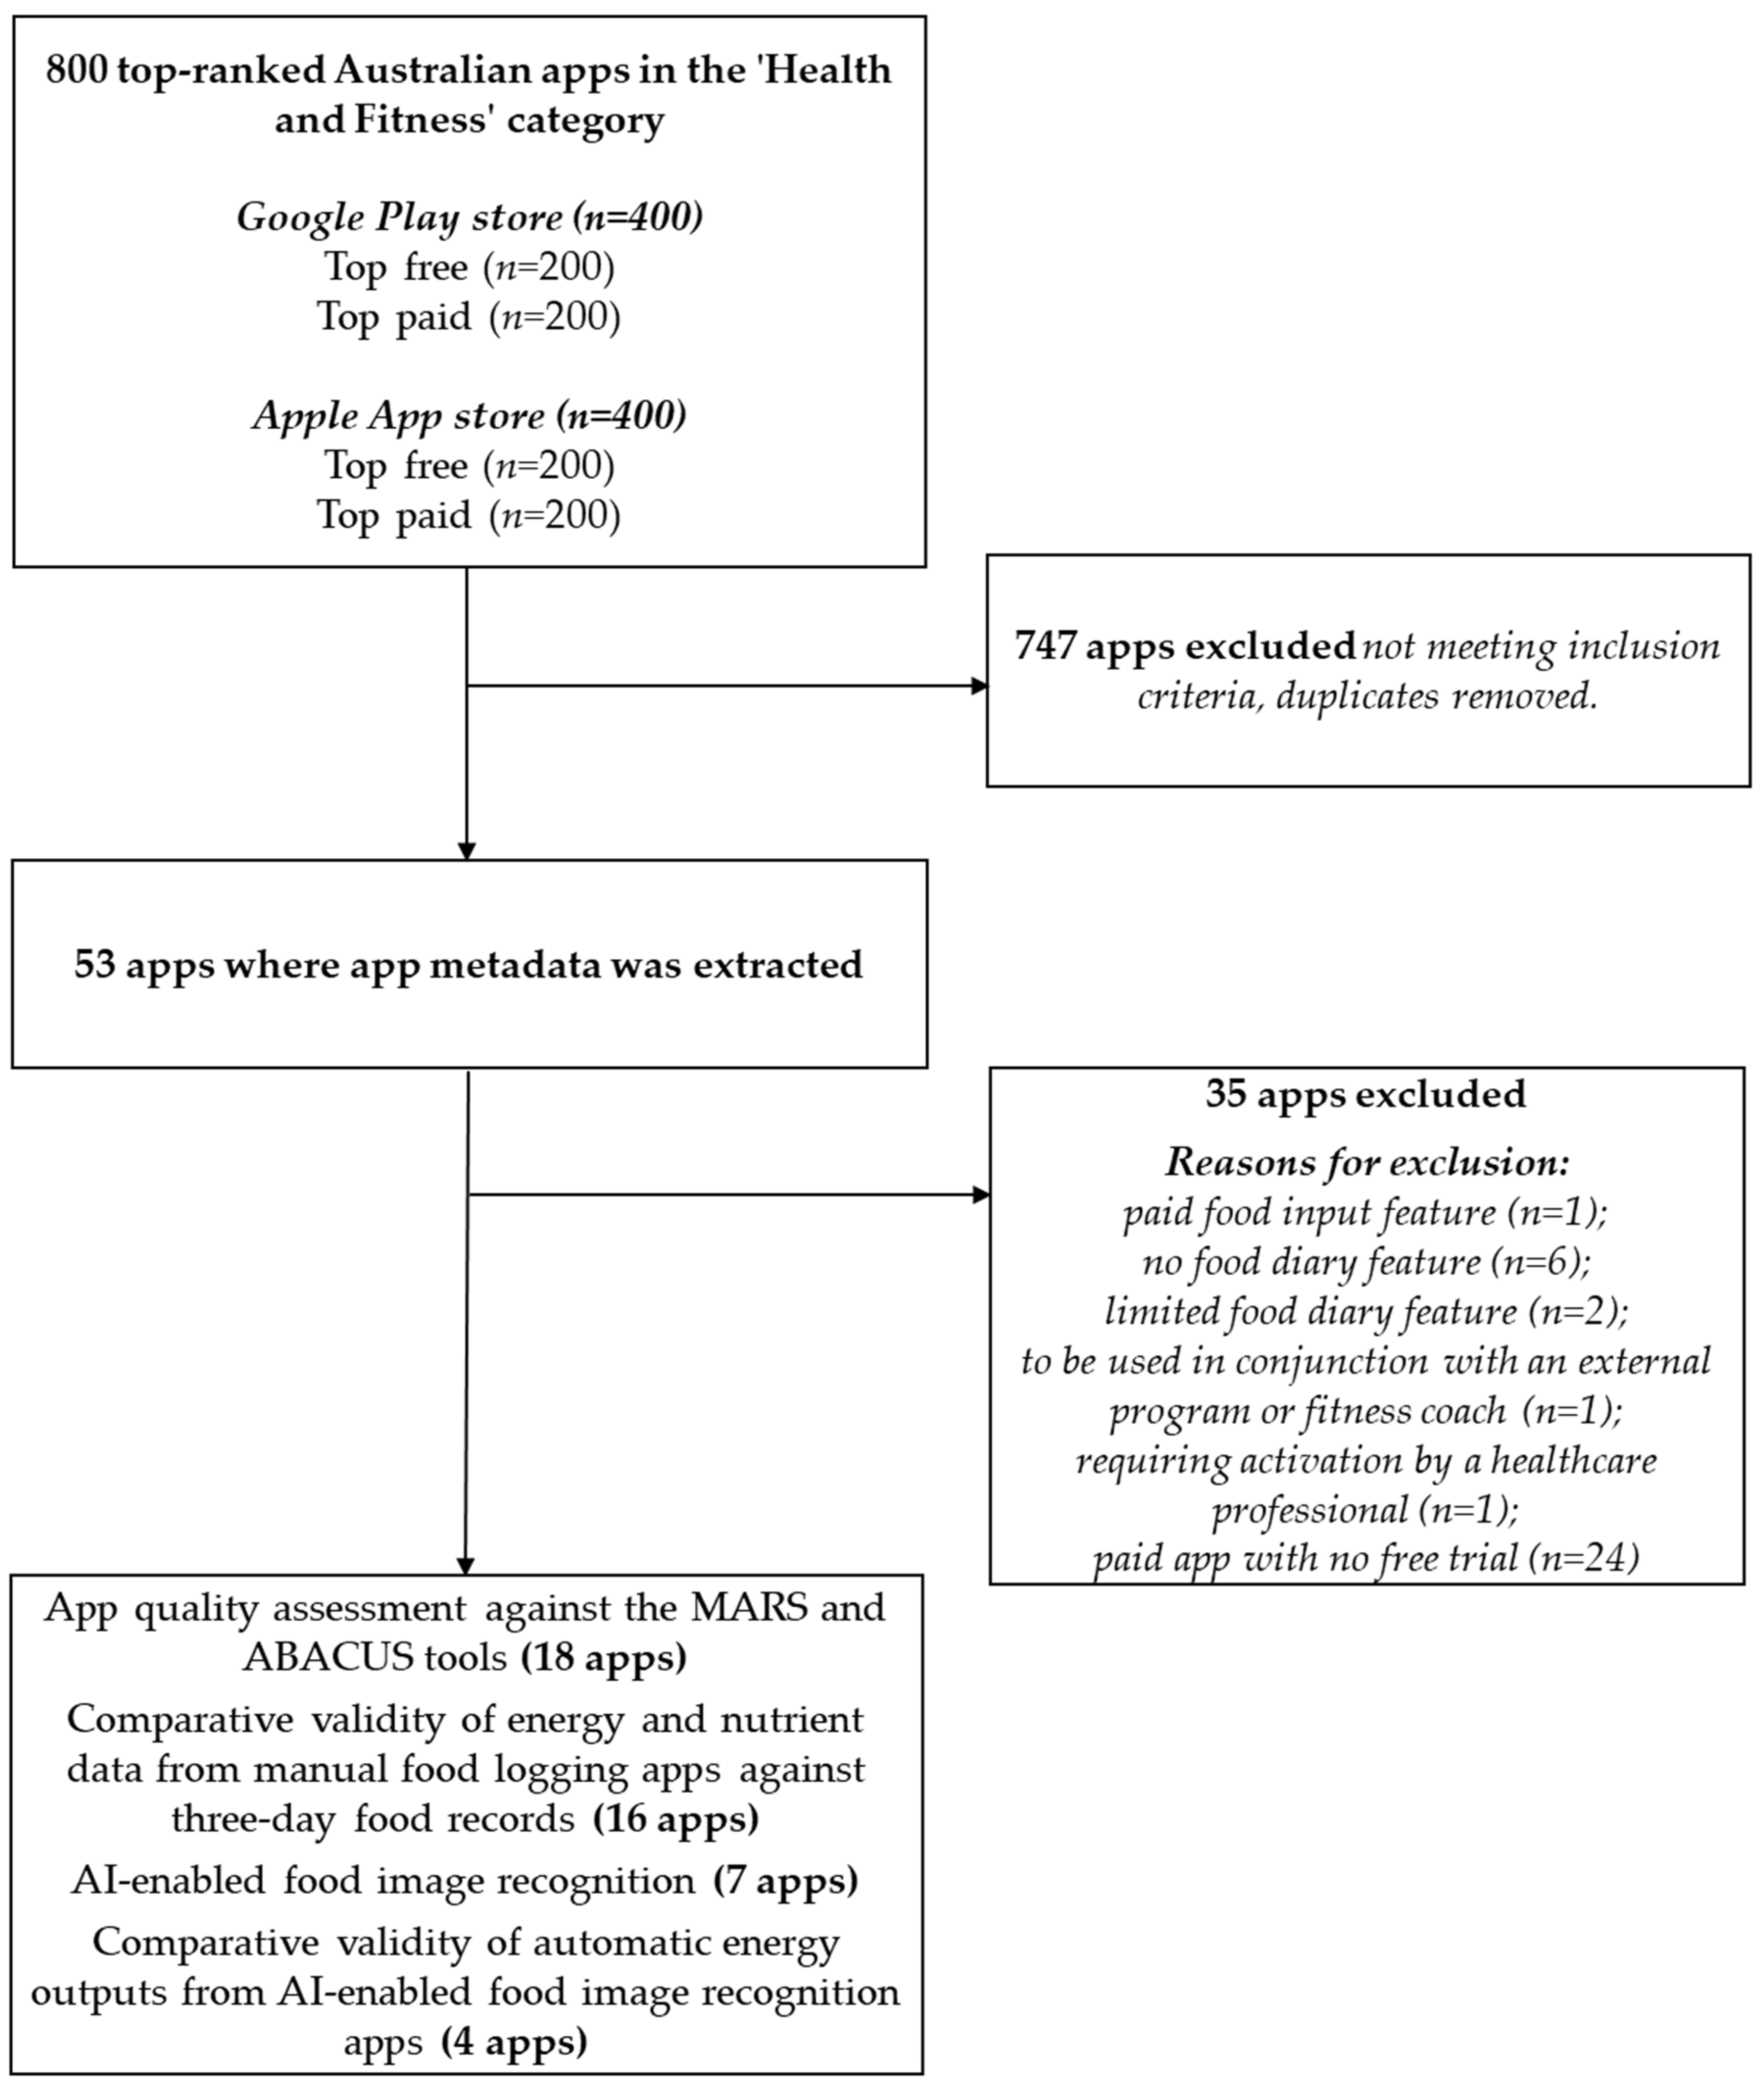
2.1. Eligibility Criteria
2.2. Data Extraction
2.2.1. App Metadata and Features
2.2.2. App Quality Assessment Using the MARS and ABACUS Tools
2.2.3. Comparative Validity of Nutritional Output from Manual Food-Logging Apps
2.2.4. AI-Enabled Food Image Recognition and Comparative Validity of Automatic Energy Outputs
2.3. Data Analysis
2.3.1. App Metadata and Features
2.3.2. App Quality Assessment Using the MARS and ABACUS Tools
2.3.3. Comparative Validity of Dietary Assessment from Manual Food-Logging Apps
2.3.4. AI-Enabled Food Image Recognition and Comparative Validity of Automatic Energy Outputs
3. Results
3.1. App Metadata and Features
3.1.1. Sample Characteristics
3.1.2. App Metadata
3.1.3. App Features
3.2. App Quality Assessment
3.2.1. Inter-Rater Reliability
3.2.2. MARS Tool
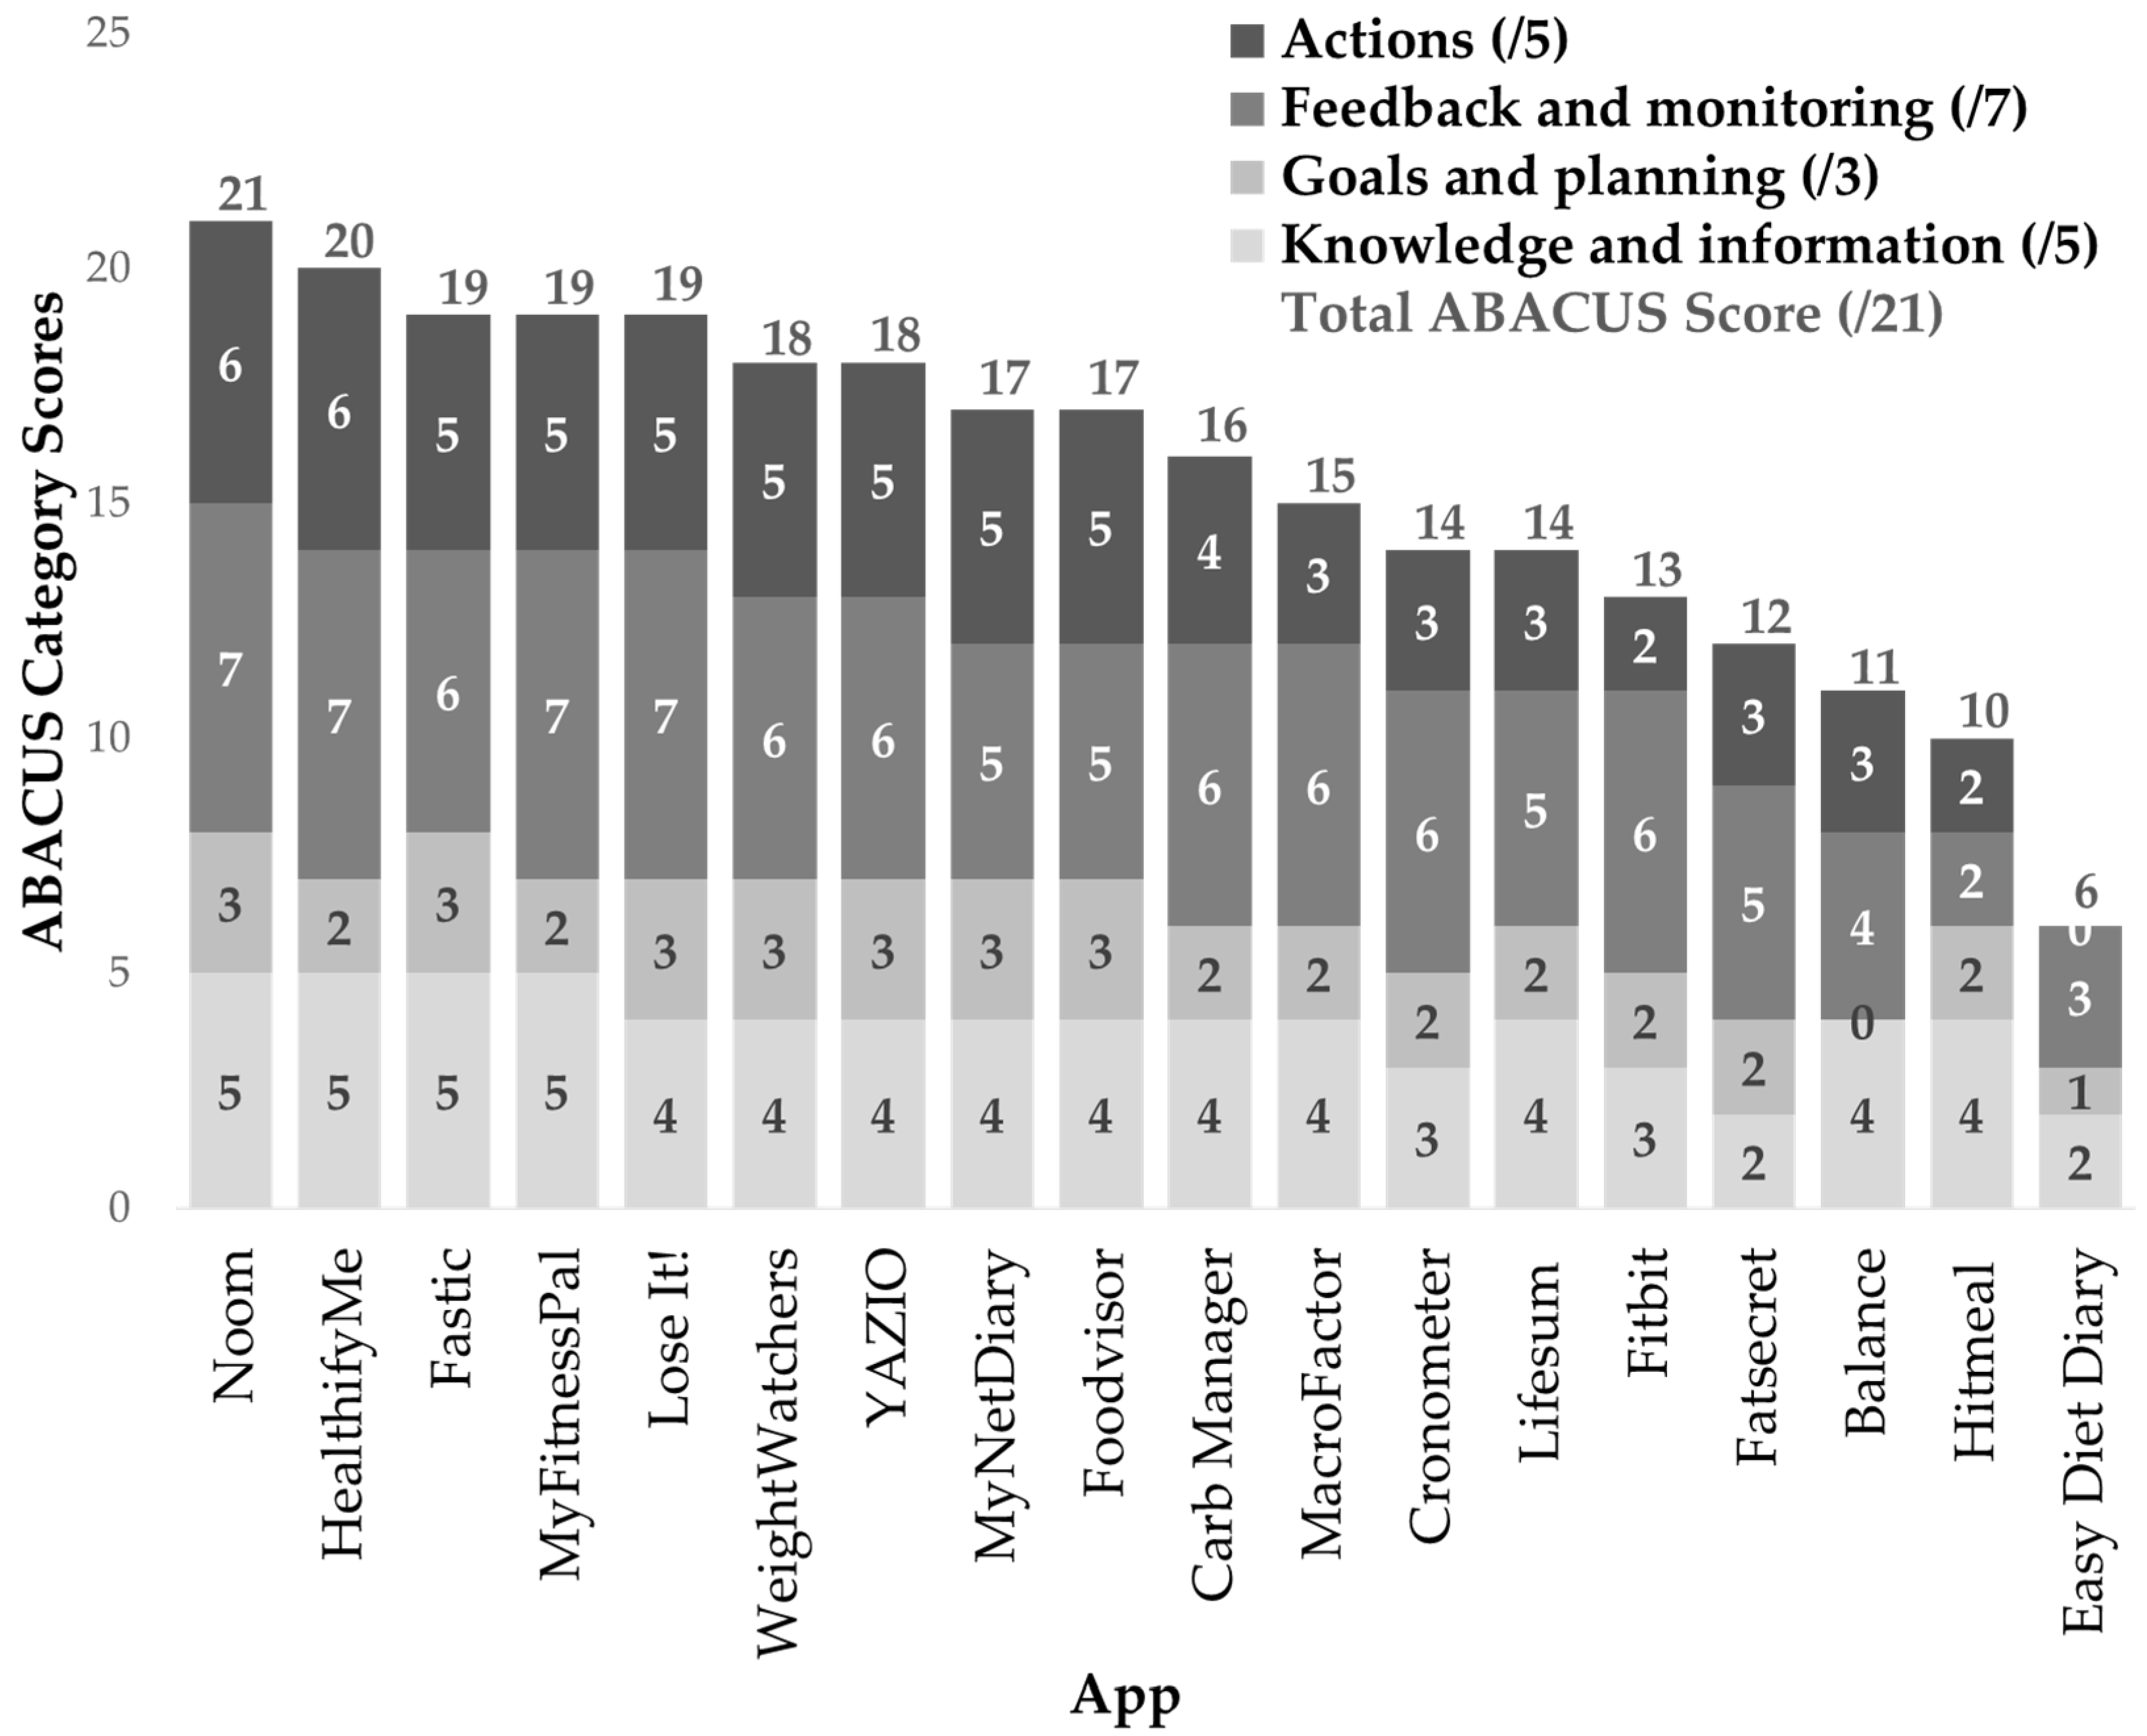
3.2.3. ABACUS Tool
3.3. Comparative Validity of Dietary Assessment from Manual Food-Logging Apps
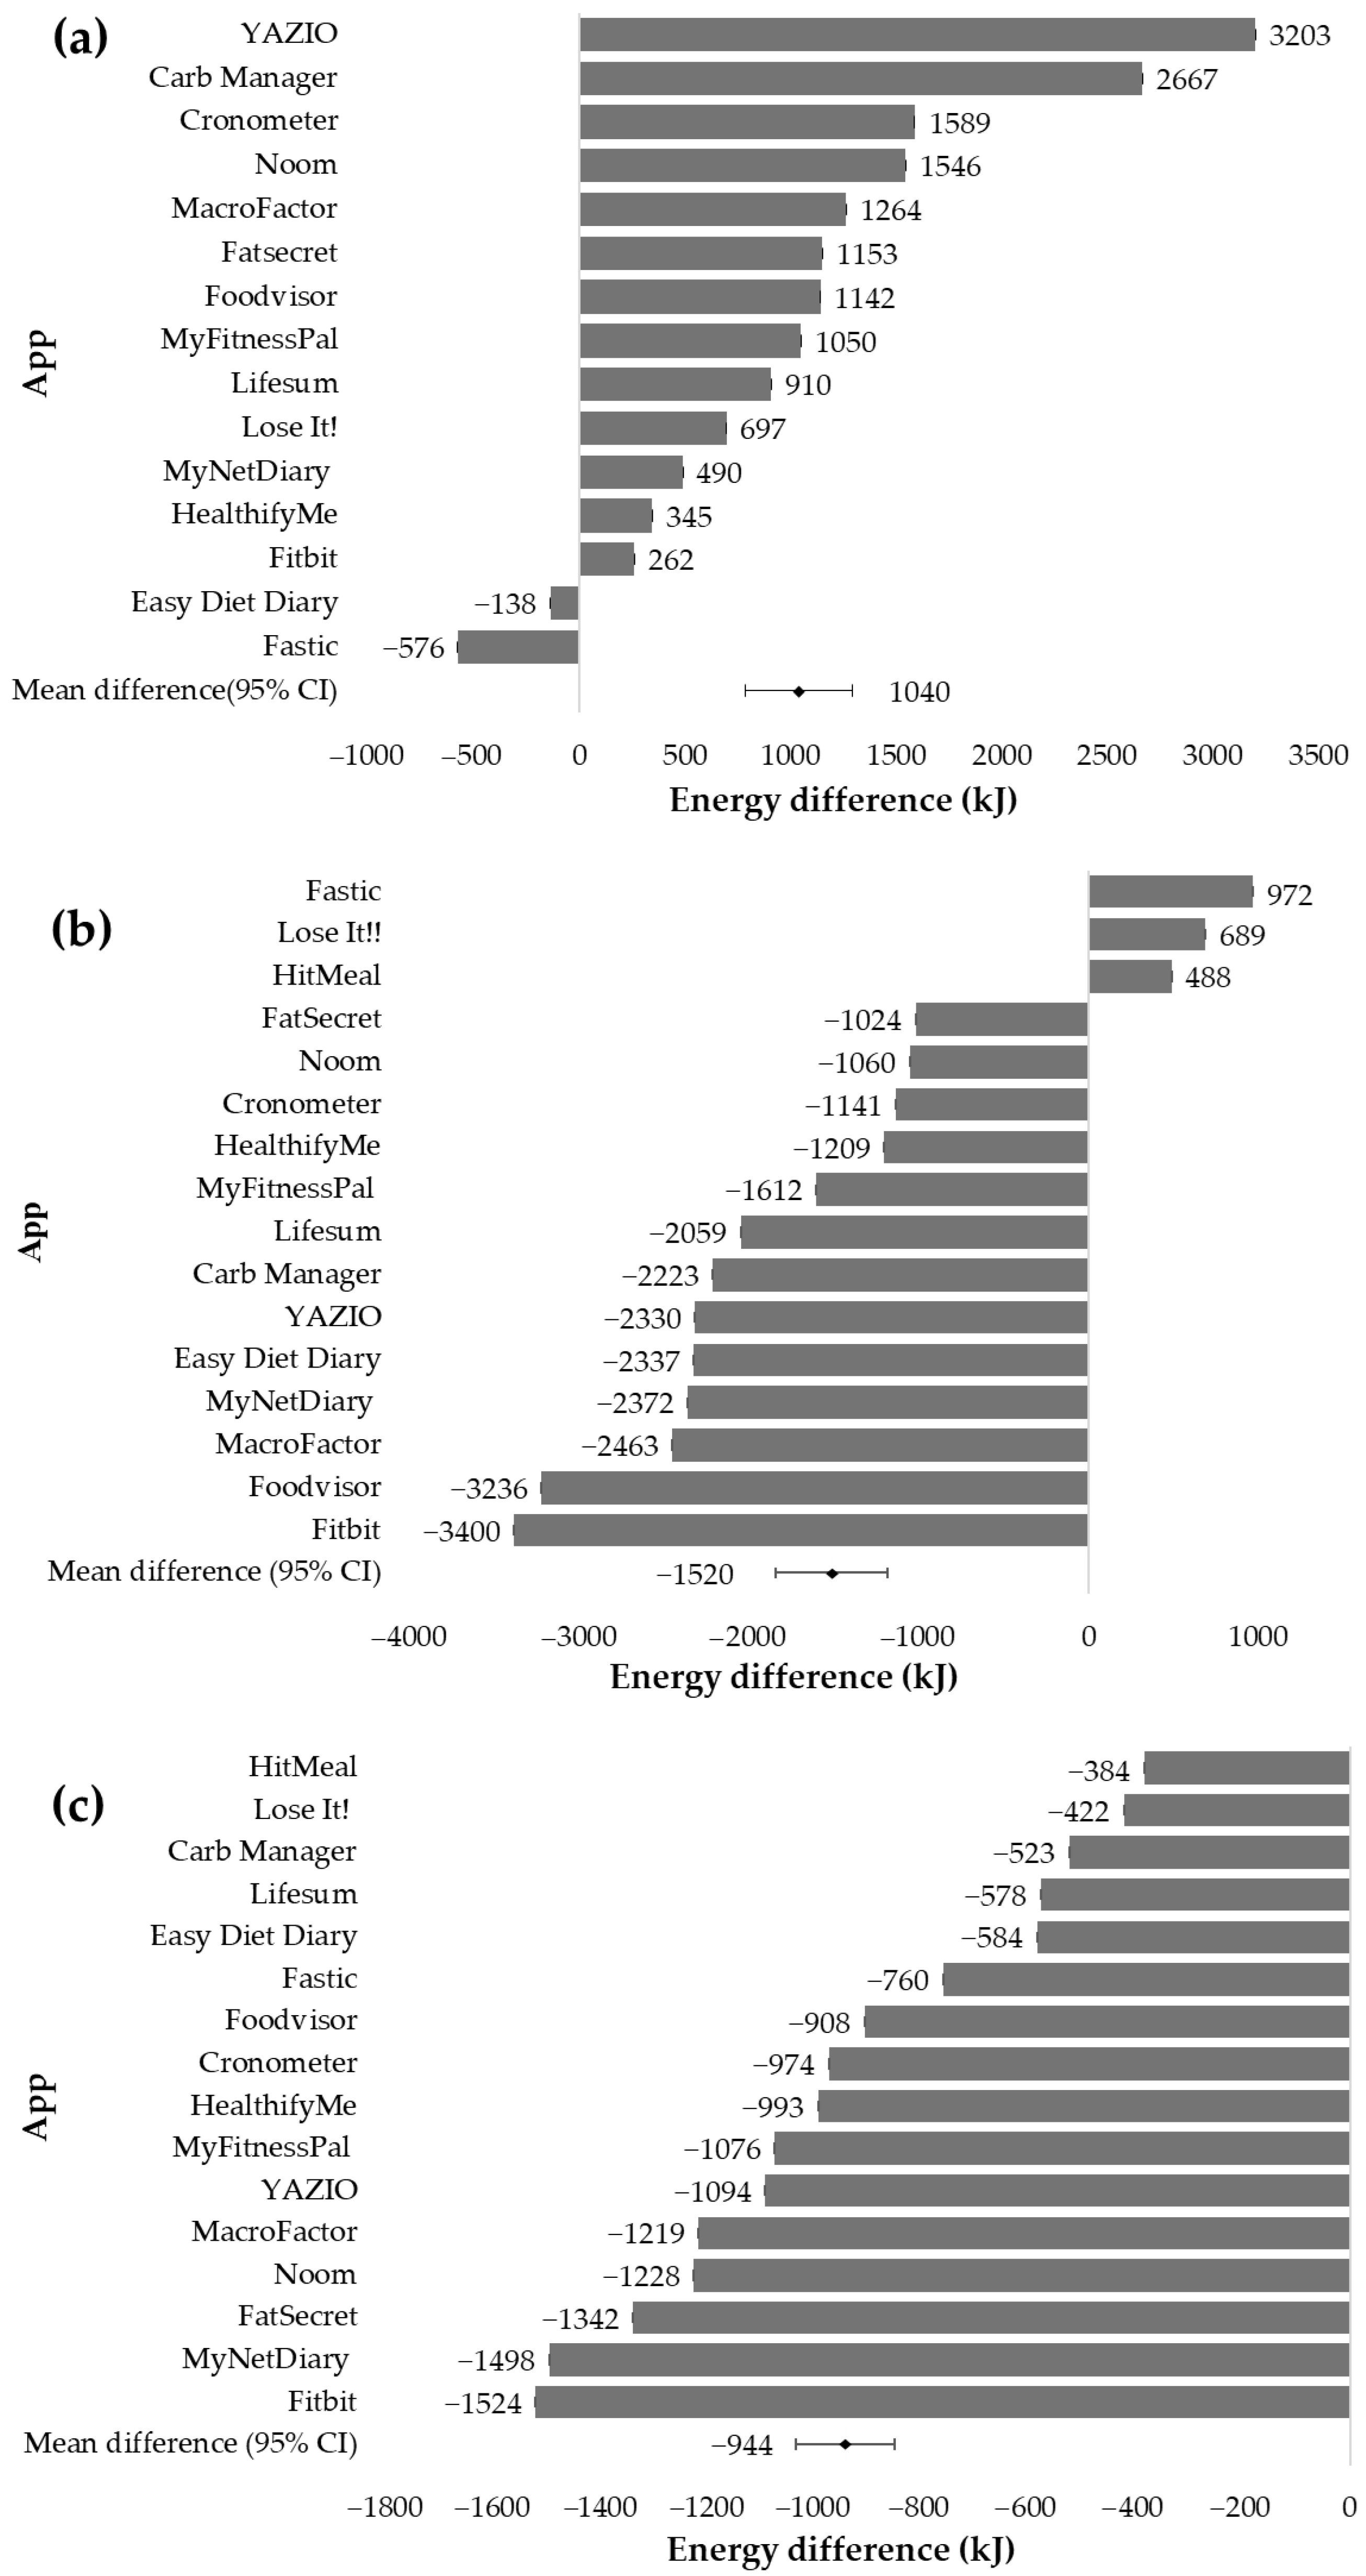
3.3.1. Energy
3.3.2. Macronutrients
3.3.3. Micronutrients
3.4. AI-Enabled Food Image Recognition
3.4.1. Food Image Recognition and Identification Accuracy of Food Components and Mixed Dishes
3.4.2. Comparative Validity of Automatic Energy Outputs from AI-Enabled Food Image Recognition Apps
4. Discussion
4.1. Strengths and Limitations
4.2. Practice Implications and Future Directions
- -
- Dietitians can provide professional guidance, evidence-based recommendations, and counselling that complements the behaviour change techniques offered in apps.
- -
- Dietitians may need to prescribe patients more accurate manual food-logging apps for self-monitoring specific macronutrients and micronutrients and ensure patients are well trained in thorough food record entry.
- -
- Consider incorporating more behaviour change techniques into nutrition-related apps.
- -
- App developers should be more transparent about the exact extent of dietitian involvement in app development and content creation.
- -
- Include in-app tutorials on how to capture images for more accurate food image analysis in AI-enabled food image recognition apps.
- -
- mHealth apps are not governed by any specific regulatory body. Government health departments could play a role in the governance of these apps and undertake reviews to ensure the quality and safety of use by the public.
- -
- Dietetic associations can undertake reviews of apps and advocate for app integration into dietetic practice to ensure acceptance across the profession.
5. Conclusions
Supplementary Materials
Author Contributions
Funding
Institutional Review Board Statement
Informed Consent Statement
Data Availability Statement
Acknowledgments
Conflicts of Interest
References
- Chen, J.; Lieffers, J.; Bauman, A.; Hanning, R.; Allman-Farinelli, M. The use of smartphone health apps and other mobile health (mHealth) technologies in dietetic practice: A three country study. J. Hum. Nutr. Diet. 2017, 30, 439–452. [Google Scholar] [CrossRef] [PubMed]
- Vasiloglou, M.F.; Christodoulidis, S.; Reber, E.; Stathopoulou, T.; Lu, Y.; Stanga, Z.; Mougiakakou, S. What Healthcare Professionals Think of “Nutrition & Diet” Apps: An International Survey. Nutrients 2020, 12, 2214. [Google Scholar] [CrossRef] [PubMed]
- Vasiloglou, M.F.; Christodoulidis, S.; Reber, E.; Stathopoulou, T.; Lu, Y.; Stanga, Z.; Mougiakakou, S. Perspectives and Preferences of Adult Smartphone Users Regarding Nutrition and Diet Apps: Web-Based Survey Study. JMIR Mhealth Uhealth 2021, 9, e27885. [Google Scholar] [CrossRef] [PubMed]
- Chen, J.; Gemming, L.; Hanning, R.; Allman-Farinelli, M. Smartphone apps and the nutrition care process: Current perspectives and future considerations. Patient Educ. Couns. 2018, 101, 750–757. [Google Scholar] [CrossRef] [PubMed]
- Fakih El Khoury, C.; Karavetian, M.; Halfens, R.J.G.; Crutzen, R.; Khoja, L.; Schols, J.M.G.A. The Effects of Dietary Mobile Apps on Nutritional Outcomes in Adults with Chronic Diseases: A Systematic Review and Meta-Analysis. J. Acad. Nutr. Diet. 2019, 119, 626–651. [Google Scholar] [CrossRef] [PubMed]
- Villinger, K.; Wahl, D.R.; Boeing, H.; Schupp, H.T.; Renner, B. The effectiveness of app-based mobile interventions on nutrition behaviours and nutrition-related health outcomes: A systematic review and meta-analysis. Obes. Rev. 2019, 20, 1465–1484. [Google Scholar] [CrossRef] [PubMed]
- Paramastri, R.; Pratama, S.A.; Ho, D.K.N.; Purnamasari, S.D.; Mohammed, A.Z.; Galvin, C.J.; Hsu, Y.-H.E.; Tanweer, A.; Humayun, A.; Househ, M.; et al. Use of mobile applications to improve nutrition behaviour: A systematic review. Comput. Methods Programs Biomed. 2020, 192, 105459. [Google Scholar] [CrossRef] [PubMed]
- Ghelani, D.P.; Moran, L.J.; Johnson, C.; Mousa, A.; Naderpoor, N. Mobile Apps for Weight Management: A Review of the Latest Evidence to Inform Practice. Front. Endocrinol. 2020, 11, 412. [Google Scholar] [CrossRef] [PubMed]
- Scarry, A.; Rice, J.; O’Connor, E.M.; Tierney, A.C. Usage of Mobile Applications or Mobile Health Technology to Improve Diet Quality in Adults. Nutrients 2022, 14, 2437. [Google Scholar] [CrossRef]
- Allman-Farinelli, M. Digital dietetics and the era of artificial intelligence. Nutr. Diet. 2023, 80, 334–337. [Google Scholar] [CrossRef]
- Bond, A.; McCay, K.; Lal, S. Artificial intelligence & clinical nutrition: What the future might have in store. Clin. Nutr. ESPEN 2023, 57, 542–549. [Google Scholar] [CrossRef] [PubMed]
- Pettit, R.W.; Fullem, R.; Cheng, C.; Amos, C.I. Artificial intelligence, machine learning, and deep learning for clinical outcome prediction. Emerg. Top. Life Sci. 2021, 5, 729–745. [Google Scholar] [CrossRef] [PubMed]
- Barengo, N.C.; Biggs, S.; Haapala, I.; Manninen, P.; Surakka, L. Weight loss by mobile phone: A 1-year effectiveness study. Public Health Nutr. 2009, 12, 2382–2391. [Google Scholar] [CrossRef]
- Mendi, E.; Ozyavuz, O.; Pekesen, E.; Bayrak, C. Food intake monitoring system for mobile devices. In Proceedings of the 5th IEEE International Workshop on Advances in Sensors and Interfaces IWASI, Bari, Italy, 13–14 June 2013; pp. 31–33. [Google Scholar]
- Tahir, G.A.; Loo, C.K. A Comprehensive Survey of Image-Based Food Recognition and Volume Estimation Methods for Dietary Assessment. Healthcare 2021, 9, 1676. [Google Scholar] [CrossRef] [PubMed]
- Liang, Y.; Xiao, R.; Huang, F.; Lin, Q.; Guo, J.; Zeng, W.; Dong, J. AI nutritionist: Intelligent software as the next generation pioneer of precision nutrition. Comput. Biol. Med. 2024, 178, 108711. [Google Scholar] [CrossRef] [PubMed]
- Zhang, W.; Yu, Q.; Siddiquie, B.; Divakaran, A.; Sawhney, H. “Snap-n-Eat”: Food Recognition and Nutrition Estimation on a Smartphone. J. Diabetes Sci. Technol. 2015, 9, 525–533. [Google Scholar] [CrossRef] [PubMed]
- Nguyen, P.H.; Tran, L.M.; Hoang, N.T.; Koch, B.; McCloskey, P.; Gangupantulu, R.; Folson, G.; Bannerman, B.; Braga, B.C.; Gelli, A. Validation of mobile AI-technology assisted dietary assessment in adolescent girls in Vietnam. Ann. Nutr. Metab. 2023, 79, 302. [Google Scholar] [CrossRef]
- Boushey, C.J.; Spoden, M.; Zhu, F.M.; Delp, E.J.; Kerr, D.A. New mobile methods for dietary assessment: Review of image-assisted and image-based dietary assessment methods. Proc. Nutr. Soc. 2017, 76, 283–294. [Google Scholar] [CrossRef] [PubMed]
- Phanich, M.; Pholkul, P.; Phimoltares, S. Food Recommendation System Using Clustering Analysis for Diabetic Patients. In Proceedings of the 2010 International Conference on Information Science and Applications, Seoul, Republic of Korea, 21–23 April 2010; pp. 1–8. [Google Scholar]
- Oh, Y.J.; Zhang, J.; Fang, M.L.; Fukuoka, Y. A systematic review of artificial intelligence chatbots for promoting physical activity, healthy diet, and weight loss. Int. J. Behav. Nutr. Phys. Act. 2021, 18, 160. [Google Scholar] [CrossRef]
- Chen, J.; Cade, J.E.; Allman-Farinelli, M. The Most Popular Smartphone Apps for Weight Loss: A Quality Assessment. JMIR mHealth uHealth 2015, 3, e104. [Google Scholar] [CrossRef]
- Franco, R.Z.; Fallaize, R.; Lovegrove, J.A.; Hwang, F. Popular Nutrition-Related Mobile Apps: A Feature Assessment. JMIR Mhealth Uhealth 2016, 4, e85. [Google Scholar] [CrossRef] [PubMed]
- Ferrara, G.; Kim, J.; Lin, S.; Hua, J.; Seto, E. A Focused Review of Smartphone Diet-Tracking Apps: Usability, Functionality, Coherence with Behavior Change Theory, and Comparative Validity of Nutrient Intake and Energy Estimates. JMIR Mhealth Uhealth 2019, 7, e9232. [Google Scholar] [CrossRef] [PubMed]
- Samad, S.; Ahmed, F.; Naher, S.; Kabir, M.A.; Das, A.; Amin, S.; Islam, S.M.S. Smartphone apps for tracking food consumption and recommendations: Evaluating artificial intelligence-based functionalities, features and quality of current apps. Intell. Syst. Appl. 2022, 15, 200103. [Google Scholar] [CrossRef]
- Stoyanov, S.R.; Hides, L.; Kavanagh, D.J.; Zelenko, O.; Tjondronegoro, D.; Mani, M. Mobile app rating scale: A new tool for assessing the quality of health mobile apps. JMIR Mhealth Uhealth 2015, 3, e27. [Google Scholar] [CrossRef] [PubMed]
- McKay, F.H.; Slykerman, S.; Dunn, M. The App Behavior Change Scale: Creation of a Scale to Assess the Potential of Apps to Promote Behavior Change. JMIR Mhealth Uhealth 2019, 7, e11130. [Google Scholar] [CrossRef] [PubMed]
- Xyris Pty Ltd. Foodworks.Online, V1.0 Professional; Xyris Pty Ltd.: Brisbane, Australia, 2021; Available online: https://foodworks.online/ (accessed on 22 April 2024).
- Wellard-Cole, L.; Chen, J.; Davies, A.; Wong, A.; Huynh, S.; Rangan, A.; Allman-Farinelli, M. Relative Validity of the Eat and Track (EaT) Smartphone App for Collection of Dietary Intake Data in 18-to-30-Year Olds. Nutrients 2019, 11, 621. [Google Scholar] [CrossRef] [PubMed]
- Bardus, M.; van Beurden, S.B.; Smith, J.R.; Abraham, C. A review and content analysis of engagement, functionality, aesthetics, information quality, and change techniques in the most popular commercial apps for weight management. Int. J. Behav. Nutr. Phys. Act. 2016, 13, 35. [Google Scholar] [CrossRef] [PubMed]
- Mandracchia, F.; Llauradó, E.; Tarro, L.; Valls, R.M.; Solà, R. Mobile Phone Apps for Food Allergies or Intolerances in App Stores: Systematic Search and Quality Assessment Using the Mobile App Rating Scale (MARS). JMIR Mhealth Uhealth 2020, 8, e18339. [Google Scholar] [CrossRef] [PubMed]
- Choi, J.; Chung, C.; Woo, H. Diet-Related Mobile Apps to Promote Healthy Eating and Proper Nutrition: A Content Analysis and Quality Assessment. Int. J. Environ. Res. Public Health 2021, 18, 3496. [Google Scholar] [CrossRef]
- Carter, M.C.; Burley, V.J.; Nykjaer, C.; Cade, J.E. Adherence to a Smartphone Application for Weight Loss Compared to Website and Paper Diary: Pilot Randomized Controlled Trial. J. Med. Internet Res. 2013, 15, e32. [Google Scholar] [CrossRef]
- Carter, M.C.; Burley, V.J.; Nykjaer, C.; Cade, J.E. ‘My Meal Mate’ (MMM): Validation of the diet measures captured on a smartphone application to facilitate weight loss. Br. J. Nutr. 2013, 109, 539–546. [Google Scholar] [CrossRef] [PubMed]
- Laing, B.Y.; Mangione, C.M.; Tseng, C.H.; Leng, M.; Vaisberg, E.; Mahida, M.; Bholat, M.; Glazier, E.; Morisky, D.E.; Bell, D.S. Effectiveness of a smartphone application for weight loss compared with usual care in overweight primary care patients: A randomized, controlled trial. Ann. Intern. Med. 2014, 161, S5–S12. [Google Scholar] [CrossRef] [PubMed]
- Jeon, E.; Park, H.A.; Min, Y.H.; Kim, H.Y. Analysis of the information quality of korean obesity-management smartphone applications. Healthc. Inform. Res. 2014, 20, 23–29. [Google Scholar] [CrossRef] [PubMed]
- Gan, K.O.; Allman-Farinelli, M. A scientific audit of smartphone applications for the management of obesity. Aust. N. Z. J. Public Health 2011, 35, 293–294. [Google Scholar] [CrossRef] [PubMed]
- Breton, E.R.; Fuemmeler, B.F.; Abroms, L.C. Weight loss-there is an app for that! But does it adhere to evidence-informed practices? Transl. Behav. Med. 2011, 1, 523–529. [Google Scholar] [CrossRef] [PubMed]
- Chen, J.; Lieffers, J.; Bauman, A.; Hanning, R.; Allman-Farinelli, M. Designing Health Apps to Support Dietetic Professional Practice and Their Patients: Qualitative Results from an International Survey. JMIR Mhealth Uhealth 2017, 5, e40. [Google Scholar] [CrossRef] [PubMed]
- Lieffers, J.R.L.; Vance, V.A.; Hanning, R.M. Use of Mobile Device Applications in Canadian Dietetic Practice. Can. J. Diet. Pract. Res. 2014, 75, 41–47. [Google Scholar] [CrossRef] [PubMed]
- Chen, J.; Allman-Farinelli, M. Impact of Training and Integration of Apps into Dietetic Practice on Dietitians’ Self-Efficacy with Using Mobile Health Apps and Patient Satisfaction. JMIR Mhealth Uhealth 2019, 7, e12349. [Google Scholar] [CrossRef] [PubMed]
- NHS England. Developers Invited to Add to NHS Apps Library. Available online: https://digital.nhs.uk/news/2018/developers-invited-to-add-to-nhs-apps-library (accessed on 23 July 2024).
- McKay, F.H.; Wright, A.; Shill, J.; Stephens, H.; Uccellini, M. Using Health and Well-Being Apps for Behavior Change: A Systematic Search and Rating of Apps. JMIR Mhealth Uhealth 2019, 7, e11926. [Google Scholar] [CrossRef]
- Victorian Health Promotion Foundation. Healthy Living Apps. VicHealth. Available online: https://www.vichealth.vic.gov.au/sites/default/files/Healthy-Living-Apps-poster.pdf (accessed on 23 July 2024).
- Dialogue Consulting. Guidelines for Developing Healthy Living Apps. Melbourne, Australia. Available online: https://www.vichealth.vic.gov.au/sites/default/files/Guidelines-Creating-Healthy-Living-Apps.pdf (accessed on 23 July 2024).
- National Institute for Health and Care Excellence. Evidence Standards Framework for Digital Health Technologies; NICE: London, UK, 2019; Available online: https://www.nice.org.uk/corporate/ecd7 (accessed on 23 July 2024).
- AlSlaity, A.; Suruliraj, B.; Oyebode, O.; Fowles, J.; Steeves, D.; Orji, R. Mobile Applications for Health and Wellness: A Systematic Review. Proc. ACM Hum.-Comput. Interact. 2022, 6, 171. [Google Scholar] [CrossRef]
- Samoggia, A.; Riedel, B. Assessment of nutrition-focused mobile apps’ influence on consumers’ healthy food behaviour and nutrition knowledge. Food Res. Int. 2020, 128, 108766. [Google Scholar] [CrossRef] [PubMed]
- Teixeira, V.; Voci, S.M.; Mendes-Netto, R.S.; da Silva, D.G. The relative validity of a food record using the smartphone application MyFitnessPal. Nutr. Diet. 2018, 75, 219–225. [Google Scholar] [CrossRef] [PubMed]
- Lin, A.W.; Morgan, N.; Ward, D.; Tangney, C.; Alshurafa, N.; Van Horn, L.; Spring, B. Comparative Validity of Mostly Unprocessed and Minimally Processed Food Items Differs among Popular Commercial Nutrition Apps Compared with a Research Food Database. J. Acad. Nutr. Diet. 2022, 122, 825–832.e1. [Google Scholar] [CrossRef] [PubMed]
- Ambrosini, G.L.; Hurworth, M.; Giglia, R.; Trapp, G.; Strauss, P. Feasibility of a commercial smartphone application for dietary assessment in epidemiological research and comparison with 24-h dietary recalls. Nutr. J. 2018, 17, 5. [Google Scholar] [CrossRef]
- Chen, J.; Berkman, W.; Bardouh, M.; Ng, C.Y.K.; Allman-Farinelli, M. The use of a food logging app in the naturalistic setting fails to provide accurate measurements of nutrients and poses usability challenges. Nutrition 2019, 57, 208–216. [Google Scholar] [CrossRef]
- Bzikowska-Jura, A.; Sobieraj, P.; Raciborski, F. Low Comparability of Nutrition-Related Mobile Apps against the Polish Reference Method—A Validity Study. Nutrients 2021, 13, 2868. [Google Scholar] [CrossRef] [PubMed]
- Tosi, M.; Radice, D.; Carioni, G.; Vecchiati, T.; Fiori, F.; Parpinel, M.; Gnagnarella, P. Accuracy of applications to monitor food intake: Evaluation by comparison with 3-d food diary. Nutrition 2021, 84, 111018. [Google Scholar] [CrossRef] [PubMed]
- Shinozaki, N.; Murakami, K. Evaluation of the Ability of Diet-Tracking Mobile Applications to Estimate Energy and Nutrient Intake in Japan. Nutrients 2020, 12, 3327. [Google Scholar] [CrossRef] [PubMed]
- Banal, M.G.; Bongga, D.; Angbengco, J.M.; Amarra, S.; Panlasigui, L. MyFitnessPal smartphone application: Relative validity and intercoder reliability among dietitians in assessing energy and macronutrient intakes of selected Filipino adults with obesity. BMJ Nutr. Prev. Health 2024, 7, e000770. [Google Scholar] [CrossRef]
- Vasiloglou, M.F.; Mougiakakou, S.; Aubry, E.; Bokelmann, A.; Fricker, R.; Gomes, F.; Guntermann, C.; Meyer, A.; Studerus, D.; Stanga, Z. A Comparative Study on Carbohydrate Estimation: GoCARB vs. Dietitians. Nutrients 2018, 10, 741. [Google Scholar] [CrossRef]
- Fallaize, R.; Zenun Franco, R.; Pasang, J.; Hwang, F.; Lovegrove, J.A. Popular Nutrition-Related Mobile Apps: An Agreement Assessment Against a UK Reference Method. JMIR Mhealth Uhealth 2019, 7, e9838. [Google Scholar] [CrossRef] [PubMed]
- Thompson-Felty, C.; Johnston, C.S. Adherence to Diet Applications Using a Smartphone Was Associated with Weight Loss in Healthy Overweight Adults Irrespective of the Application. J. Diabetes Sci. Technol. 2017, 11, 184–185. [Google Scholar] [CrossRef] [PubMed]
- Turner-McGrievy, G.M.; Beets, M.W.; Moore, J.B.; Kaczynski, A.T.; Barr-Anderson, D.J.; Tate, D.F. Comparison of traditional versus mobile app self-monitoring of physical activity and dietary intake among overweight adults participating in an mHealth weight loss program. J. Am. Med. Inform. Assoc. 2013, 20, 513–518. [Google Scholar] [CrossRef] [PubMed]
- Wharton, C.M.; Johnston, C.S.; Cunningham, B.K.; Sterner, D. Dietary Self-Monitoring, but Not Dietary Quality, Improves with Use of Smartphone App Technology in an 8-Week Weight Loss Trial. J. Nutr. Educ. Behav. 2014, 46, 440–444. [Google Scholar] [CrossRef] [PubMed]
- van der Haar, S.; Raaijmakers, I.; Verain, M.C.D.; Meijboom, S. Incorporating Consumers’ Needs in Nutrition Apps to Promote and Maintain Use: Mixed Methods Study. JMIR Mhealth Uhealth 2023, 11, e39515. [Google Scholar] [CrossRef] [PubMed]
- König, L.M.; Attig, C.; Franke, T.; Renner, B. Barriers to and Facilitators for Using Nutrition Apps: Systematic Review and Conceptual Framework. JMIR Mhealth Uhealth 2021, 9, e20037. [Google Scholar] [CrossRef] [PubMed]
- Martin, C.K.; Gilmore, L.A.; Apolzan, J.W.; Myers, C.A.; Thomas, D.M.; Redman, L.M. Smartloss: A Personalized Mobile Health Intervention for Weight Management and Health Promotion. JMIR Mhealth Uhealth 2016, 4, e18. [Google Scholar] [CrossRef] [PubMed]
- Van Asbroeck, S.; Matthys, C. Use of Different Food Image Recognition Platforms in Dietary Assessment: Comparison Study. JMIR Form. Res. 2020, 4, e15602. [Google Scholar] [CrossRef] [PubMed]
- Limketkai, B.N.; Mauldin, K.; Manitius, N.; Jalilian, L.; Salonen, B.R. The Age of Artificial Intelligence: Use of Digital Technology in Clinical Nutrition. Curr. Surg. Rep. 2021, 9, 20. [Google Scholar] [CrossRef]
- Gemming, L.; Utter, J.; Ni Mhurchu, C. Image-assisted dietary assessment: A systematic review of the evidence. J. Acad. Nutr. Diet. 2015, 115, 64–77. [Google Scholar] [CrossRef]
- Rollo, M.E.; Ash, S.; Lyons-Wall, P.; Russell, A.W. Evaluation of a Mobile Phone Image-Based Dietary Assessment Method in Adults with Type 2 Diabetes. Nutrients 2015, 7, 4897–4910. [Google Scholar] [CrossRef] [PubMed]
- Shen, Z.; Shehzad, A.; Chen, S.; Sun, H.; Liu, J. Machine Learning Based Approach on Food Recognition and Nutrition Estimation. Procedia Comput. Sci. 2020, 174, 448–453. [Google Scholar] [CrossRef]
- Allegra, D.; Battiato, S.; Ortis, A.; Urso, S.; Polosa, R. A review on food recognition technology for health applications. Health Psychol. Res. 2020, 8, 9297. [Google Scholar] [CrossRef] [PubMed]
- Liu, Y.-C.; Onthoni, D.D.; Mohapatra, S.; Irianti, D.; Sahoo, P.K. Deep-Learning-Assisted Multi-Dish Food Recognition Application for Dietary Intake Reporting. Electronics 2022, 11, 1626. [Google Scholar] [CrossRef]
- Doulah, A.; Ghosh, T.; Hossain, D.; Imtiaz, M.H.; Sazonov, E. “Automatic Ingestion Monitor Version 2”—A Novel Wearable Device for Automatic Food Intake Detection and Passive Capture of Food Images. IEEE J. Biomed. Health Inform. 2021, 25, 568–576. [Google Scholar] [CrossRef] [PubMed]
- Nguyen, P.H.; Tran, L.M.; Hoang, N.T.; Trương, D.T.T.; Tran, T.H.T.; Huynh, P.N.; Koch, B.; McCloskey, P.; Gangupantulu, R.; Folson, G.; et al. Relative validity of a mobile AI-technology-assisted dietary assessment in adolescent females in Vietnam. Am. J. Clin. Nutr. 2022, 116, 992–1001. [Google Scholar] [CrossRef] [PubMed]
- Sasaki, Y.; Sato, K.; Kobayashi, S.; Asakura, K. Nutrient and Food Group Prediction as Orchestrated by an Automated Image Recognition System in a Smartphone App (CALO mama): Validation Study. JMIR Form. Res. 2022, 6, e31875. [Google Scholar] [CrossRef]
- Heponiemi, T.; Kaihlanen, A.M.; Kouvonen, A.; Leemann, L.; Taipale, S.; Gluschkoff, K. The role of age and digital competence on the use of online health and social care services: A cross-sectional population-based survey. Digit. Health 2022, 8, 20552076221074485. [Google Scholar] [CrossRef]
- NutriAdmin; Magosoft Ltd.: London, UK. Available online: https://nutriadmin.com/ (accessed on 23 July 2024).
- NutritioApp. Nutritio. Available online: https://nutritioapp.com/ (accessed on 23 July 2024).


| Phase | Inclusion | Exclusion |
|---|---|---|
| (1) App metadata and features |
|
|
| (2) App quality assessment using the MARS and ABACUS tools |
|
|
| (3) Comparative validity of dietary assessment from manual food-logging apps | The inclusion criteria as above in Phase 2 as well as:
| The exclusion criteria as above in Phase 2, as well as:
|
| (4A) AI-enabled food image recognition |
|
|
| (4B) Comparative validity of automatic energy outputs from AI-enabled food image recognition apps |
|
|
| Metadata | Item | Count (n) 1 |
|---|---|---|
| Platform | Apple App Store Only Google Play Store only Both | 11 0 42 |
| Price | Free to download and use Free to download, requires payment to use Paid | 20 9 24 |
| Healthcare Professional | Dietitian/healthcare professional involvement 2 Integration with healthcare professional portal 3 | 30 11 |
| App Purpose | Food or nutrient tracker Specific nutrient tracker Fitness app (primary) Educational resource or tool Tracker, other (e.g., fasting, weight) | 29 3 5 9 7 |
| Specific Target Area | Diet Disease/disorder 4 Program/product Lifestyle Women | 2 10 4 4 3 |
| Application to Nutrition Care Process Steps | Nutrition Assessment Nutrition Diagnosis Nutrition Intervention Monitoring and Evaluation | 39 1 38 45 |
| Category | Features |
|---|---|
| Dietary | Individual food input Barcode food input Macronutrient breakdown Logging timestamps Custom food Create recipe or meal Meal plans Food diary (non-customisable or other) 1 |
| Tracking | Water tracking (separate) Weight tracking Fasting tracker Physical activity or steps tracking Tracker (other) 2 |
| Insights | Goal setting (weight or calorie) Goal setting (other) Daily/Weekly breakdown Food/nutrient analysis Food swap and/or recommendations Weight progress/trends Trends (other) 3 |
| Technical | Integration with external apps/devices Export data from app Targeted for a specific diet, disease/disorder, program/product, lifestyle or women |
| Education | Additional information and/or articles Recipes |
| Social | Community forum and support Friend and/or buddy system |
| Artificial intelligence | AI chatbot Food recognition Algorithmic calculations Other |
| App (Version No.) | Dietary | Tracking | Insights | Technical | Education | Social | Artificial Intelligence |
|---|---|---|---|---|---|---|---|
| Balance (1.7.8) | 1 | 2 | 2 | 0 | 1 | 1 | 0 |
| BMI Calculator (1.8.9) | N/A | N/A | N/A | 0 | 0 | N/A | 0 |
| BodyFast (3.35.3) | N/A | 3 | 4 | 1 | 2 | 0 | 0 |
| BodyMonitor (2.9.12) | N/A | N/A | 2 | 2 | 0 | N/A | 0 |
| Carb Manager (7.5.5) | 6 | 3 | 5 | 2 | 1 | 2 | 0 |
| Cronometer (4.19.5) | 5 | 3 | 5 | 1 | 0 | 2 | 0 |
| Easy Diet Diary (6.0.28) | 5 | 3 | 4 | 2 | 0 | 0 | 0 |
| FastEasy (1.39.2) | N/A | 4 | 3 | 0 | 2 | 0 | 0 |
| Fastic (1.165.0) | 6 | 4 | 2 | 2 | 1 | 1 | 1 |
| FatSecret (9.32) | 5 | 3 | 5 | 2 | 1 | 1 | 1 |
| Find Me Gluten Free (3.6.36) | N/A | N/A | N/A | 0 | 1 | N/A | 0 |
| Fitbit (4.13) | 4 | 4 | 4 | 3 | 0 | 2 | 0 |
| FoodSwitch (5) | N/A | N/A | 3 | 0 | 0 | N/A | 0 |
| Foodvisor (5.15.0-1) | 5 | 3 | 3 | 1 | 1 | 0 | 0 |
| HealthifyMe (11.1.0) | 3 | 4 | 4 | 2 | 1 | 0 | 1 |
| HitMeal (1.34) | 3 | 3 | 4 | 1 | 0 | 0 | 0 |
| Juniper (1.0.817) | 0 | 2 | 2 | 2 | 2 | 0 | 0 |
| Kahunas (2.1.0) | 2 | 2 | 1 | 2 | 0 | 0 | 0 |
| Keto Diet App (2.102) | 6 | 4 | 5 | 2 | 2 | 1 | 0 |
| Kic (3.3.8053) | 2 | 2 | 0 | 0 | 2 | 1 | 0 |
| Lifesum (18.3.0) | 5 | 4 | 5 | 1 | 0 | 0 | 0 |
| Lose It! (16.2.000) | 5 | 2 | 3 | 1 | 1 | 2 | 0 |
| MyFitnessPal (24.10.0) | 5 | 2 | 6 | 1 | 2 | 2 | 0 |
| MyNetDiary (9.11) | 5 | 3 | 5 | 1 | 2 | 2 | 0 |
| Nerva (29) | N/A | 1 | 1 | 1 | 1 | 0 | 0 |
| Omo (2.64.1) | 3 | 5 | 3 | 2 | 2 | 1 | 0 |
| Reverse Health (2.2.1) | 3 | 4 | 3 | 0 | 2 | 1 | 0 |
| Vitable (2.0.3) | N/A | 1 | N/A | 0 | 1 | N/A | 0 |
| WeightWatchers (10.60.0) | 3 | 4 | 6 | 2 | 2 | 1 | 1 |
| YAZIO (10.6.1) | 5 | 3 | 5 | 2 | 1 | 2 | 0 |
| Yuka (4.36) | 2 | N/A | 1 | 0 | 1 | N/A | 0 |
| Zero (5.32.0) | 2 | 4 | 4 | 2 | 1 | 0 | 0 |
| App (Version No.) | Dietary | Tracking | Insights | Technical | Education | Social | Artificial Intelligence |
|---|---|---|---|---|---|---|---|
| Balance (1.7.8) | 1 | 2 | 2 | 0 | 2 | 1 | 0 |
| Bariatric Meal Timer (1.2) | N/A | 1 | N/A | 1 | 0 | N/A | 0 |
| Blood Type Diet® (2.6.8) | 2 | 0 | 1 | 2 | 2 | 1 | 0 |
| Caffiend (3.2.2) | 3 | 2 | 3 | 2 | 0 | 0 | 0 |
| Carb Manager (7.5.5) | 6 | 5 | 7 | 2 | 2 | 2 | 1 |
| Centr (6.7.2) | 1 | 2 | 4 | 1 | 1 | 1 | 0 |
| Cronometer (4.19.5) | 6 | 4 | 7 | 2 | 0 | 2 | 0 |
| Empty Fasting (1.1.1) | 0 | 1 | 1 | 1 | 0 | 0 | 0 |
| Fast Tract Diet (2.7) | 3 | 1 | 4 | 2 | 1 | 0 | 0 |
| Fastic (1.165.0) | 6 | 4 | 6 | 2 | 2 | 1 | 3 |
| FatSecret (9.32) | 6 | 4 | 6 | 2 | 2 | 1 | 1 |
| Fitbit (4.13) | 4 | 4 | 4 | 3 | 2 | 2 | 0 |
| Fitness Buddy+ (5.410) | 2 | 3 | 5 | 2 | 2 | 0 | 0 |
| Food Additives Checker (5.1.0) | N/A | N/A | N/A | 0 | 1 | N/A | 0 |
| Foodvisor (5.15.0-1) | 5 | 3 | 7 | 1 | 2 | 0 | 1 |
| Gluten Free Ingredient List (4.0) | N/A | N/A | 1 | 0 | 1 | N/A | 0 |
| HealthifyMe (11.1.0) | 4 | 4 | 7 | 1 | 2 | 0 | 2 |
| HitMeal (1.34) | 6 | 4 | 4 | 1 | 2 | 0 | 1 |
| kJ 2 Cal (1.0.1) | N/A | N/A | N/A | 0 | 1 | N/A | 0 |
| Lifesum (18.3.0) | 6 | 5 | 7 | 1 | 1 | 0 | 0 |
| Lose It! (16.2.000) | 7 | 5 | 6 | 2 | 1 | 2 | 1 |
| MacroFactor (2.6.8) | 6 | 3 | 6 | 2 | 1 | 1 | 2 |
| My Macros+ (2024.04) | 6 | 1 | 5 | 2 | 0 | 1 | 1 |
| MyFitnessPal (24.10.0) | 7 | 5 | 6 | 2 | 2 | 2 | 1 |
| MyNetDiary (9.11) | 7 | 4 | 7 | 2 | 2 | 2 | 1 |
| mySymptoms (5.60) | 3 | 3 | 3 | 0 | 0 | 0 | 1 |
| Noom (12.9.0) | 5 | 4 | 5 | 2 | 2 | 1 | 0 |
| Phatt (1.3.39) | 1 | 2 | 3 | 2 | 2 | 1 | 0 |
| Pocket Cal/kJ Pro (2.2) | N/A | 2 | 3 | 0 | 1 | 0 | 0 |
| Potassium Counter & Tracker (2.10.6) | 5 | 2 | 3 | 2 | 1 | 0 | 1 |
| Tap & Track (8.2) | 3 | 3 | 6 | 1 | 0 | 0 | 0 |
| Virtual Gastric Band Hypnosis (3.2.4) | 1 | 2 | 3 | 1 | 1 | 1 | 0 |
| Weight Diary (13.0) | N/A | 1 | 3 | 2 | 0 | 0 | 0 |
| YAZIO (10.6.1) | 5 | 5 | 7 | 2 | 2 | 2 | 1 |
| Zero (5.32.0) | 2 | 4 | 5 | 2 | 1 | 0 | 0 |
| Western Diet | Asian Diet | Recommended Diet | |||||||||||||
|---|---|---|---|---|---|---|---|---|---|---|---|---|---|---|---|
| Source (Version No.) | Protein (% E) | Total Fat (% E) | Sat Fat (% E) | CHO (% E) | Sugar 1 (% E) | Protein (% E) | Total Fat (% E) | Sat Fat (% E) | CHO (% E) | Sugar (% E) | Protein (% E) | Total Fat (% E) | Sat Fat (% E) | CHO (% E) | Sugar (% E) |
| 3-day food records | 17 | 31 | 12 | 45 | 20 | 19 | 34 | 10 | 46 | 12 | 20 | 27 | 7 | 48 | 20 |
| Carb Manager (7.5.5) | 18 | 35 | N/A | 45 | N/A | 16 | 31 | N/A | 46 | N/A | 20 | 23 | N/A | 63 | N/A |
| Cronometer (4.19.5) | 15 | 31 | 12 | 52 | 20 | 15 | 27 | 8 | 51 | 20 | 21 | 24 | 6 | 58 | 16 |
| Easy Diet Diary (6.0.28) | 17 | 32 | 14 | 44 | 21 | 15 | 30 | 9 | 54 | 13 | 21 | 26 | 7 | 48 | 21 |
| Fastic (1.165.0) | 14 | 31 | 13 | 53 | 41 | 11 | 32 | 11 | 69 | 9 | 21 | 28 | 14 | 59 | 15 |
| FatSecret (9.32) | 17 | 36 | 12 | 44 | 15 | 15 | 26 | 8 | 60 | 15 | 20 | 27 | 8 | 55 | 19 |
| Fitbit (4.13) | 16 | 35 | 13 | 44 | 17 | 19 | 29 | 9 | 51 | 14 | 18 | 27 | 7 | 57 | 15 |
| Foodvisor (5.15.0-1) | 15 | 34 | 13 | 46 | 12 | 15 | 27 | 8 | 50 | 13 | 22 | 23 | N/A | 52 | N/A |
| HealthifyMe (11.1.0) | 15 | 33 | N/A | 47 | N/A | 14 | 32 | N/A | 52 | N/A | 21 | 24 | N/A | 55 | N/A |
| HitMeal (1.34) | 16 | 36 | N/A | 44 | N/A | 18 | 27 | N/A | 62 | N/A | 20 | 27 | N/A | 53 | N/A |
| Lifesum (18.3.0) | 15 | 37 | N/A | 41 | N/A | 19 | 24 | N/A | 57 | N/A | 20 | 21 | N/A | 60 | N/A |
| Lose It! (16.2.000) | 14 | 31 | 12 | 46 | 22 | 11 | 15 | 5 | 29 | 7 | 21 | 30 | 8 | 54 | 10 |
| MacroFactor (2.6.8) | 16 | 36 | 14 | 45 | 18 | 14 | 31 | N/A | 55 | N/A | 20 | 22 | 5 | 60 | 17 |
| MyFitnessPal (24.10.0) | 19 | 33 | 12 | 43 | 14 | 17 | 31 | 7 | 56 | 8 | 21 | 24 | 5 | 54 | 19 |
| MyNetDiary (9.11) | 16 | 37 | 13 | 45 | N/A | 17 | 23 | 8 | 53 | N/A | 20 | 23 | 6 | 58 | N/A |
| YAZIO (10.6.1) | 15 | 34 | N/A | 44 | N/A | 15 | 28 | N/A | 52 | N/A | 19 | 27 | N/A | 57 | N/A |
| Average of apps | 16 | 34 | 13 | 45 | 20 | 16 | 28 | 8 | 53 | 12 | 20 | 25 | 7 | 56 | 17 |
| Western Diet | Asian Diet | Recommended Diet | ||||||||||
|---|---|---|---|---|---|---|---|---|---|---|---|---|
| Source (Version No.) | Fibre Density | Calcium Density | Iron Density | Sodium Density | Fibre Density | Calcium Density | Iron Density | Sodium Density | Fibre Density | Calcium Density | Iron Density | Sodium Density |
| 3-day food records | 2 | 96 | 1 | 278 | 2 | 75 | 1 | 402 | 5 | 154 | 1 | 201 |
| Carb Manager (7.5.5) | 2 | N/A | N/A | N/A | 2 | N/A | N/A | N/A | 5 | N/A | N/A | N/A |
| Cronometer (4.19.5) | 2 | 75 | 1 | 876 | 2 | 75 | 1 | 875 | 5 | 140 | 1 | 159 |
| Easy Diet Diary (6.0.28) | 2 | 87 | 1 | 279 | 3 | 45 | 1 | 461 | 6 | 173 | 2 | 174 |
| Fastic (1.165.0) | 2 | 21 | 0 | 9511 | 1 | 17 | 0 | 45,524 | 5 | 36 | 0 | 107,346 |
| FatSecret (9.32) | 1 | N/A | N/A | 263 | 2 | N/A | N/A | 327 | 4 | N/A | N/A | 307 |
| Fitbit (4.13) | 1 | 67 | 21 | 318 | 2 | 41 | 22 | 549 | 4 | 71 | 29 | 464 |
| Foodvisor (5.15.0-1) | 2 | 29 | 0 | 231 | 2 | 50 | 0 | 525 | 4 | 76 | 2 | 200 |
| HealthifyMe (11.1.0) | 2 | N/A | N/A | N/A | 2 | N/A | N/A | N/A | 5 | N/A | N/A | N/A |
| Lose It! (16.2.000) | 2 | N/A | 0 | 227 | 1 | N/A | N/A | 224 | 4 | 6 | 0 | 211 |
| MacroFactor (2.6.8) | 2 | 66 | 1 | 355 | N/A | N/A | N/A | N/A | 5 | 103 | 2 | 231 |
| MyFitnessPal (24.10.0) | 1 | 8 | 3 | 243 | 2 | 126 | 1 | 416 | 4 | 258 | 1 | 153 |
| MyNetDiary (9.11) | 2 | 103 | N/A | 273 | 2 | 24 | N/A | 315 | 5 | 120 | 0 | 196 |
| App (Version No.) | Does It Automatically Estimate Calories from the Recognised Food/Drink? (Y/N) | Food Components Correctly Identified (n = 39) | Accuracy (%) |
|---|---|---|---|
| Lose It! (16.2.000) | N | 18 | 46 |
| Fatsecret (1.165.0) | N | 18 | 46 |
| Hitmeal (1.34) | N | 24 | 62 |
| Foodvisor (5.15.0-1) | Y | 34 | 87 |
| HealthifyMe (11.1.0) | Y | 35 | 90 |
| Fastic (1.165.0) | Y | 36 | 92 |
| MyFitnessPal (24.10.0) | Y | 38 | 97 |
| Food Components | Food Record Reference (kJ) | MyFitnessPal, Energy Difference (kJ) | MyFitnessPal % Energy Difference | Foodvisor, Energy Difference (kJ) | Foodvisor % Energy Difference | HealthifyMe, Energy Difference (kJ) | HealthifyMe % Energy Difference | Fastic, Energy Difference (kJ) | Fastic % Energy Difference |
|---|---|---|---|---|---|---|---|---|---|
| Instant Cup Noodles-Nongshim Shin | 1195 | N/A | N/A | N/A | N/A | 207 | 17 | 18 | 2 |
| Boiled Egg | 235 | 50 | 21 | 12 | 5 | 87 | 37 | 50 | 21 |
| Latte Coffee with Full Cream Milk | 430 | −7 | −2 | −242 | −56 | 319 | 74 | 198 | 46 |
| Pepsi Max Can | 6 | N/A | N/A | N/A | N/A | N/A | N/A | −6 | −100 |
| Potato Chips | 487 | 136 | 28 | −77 | −16 | −56 | −12 | 659 | 135 |
| Green Tea | 14 | −14 | −100 | −14 | −100 | N/A | N/A | −14 | −100 |
| Iced Tea (Black Tea) | 121 | −111 | −92 | −121 | −100 | N/A | N/A | 297 | 246 |
| Savoury Biscuit (Sakata Seaweed cracker) | 334 | N/A | N/A | N/A | N/A | N/A | N/A | 294 | 88 |
| Galbi-Korean BBQ Marinated Beef Short Ribs | 1820 | −1109 | −61 | −1176 | −65 | N/A | N/A | N/A | N/A |
| Kimchi | 29 | 65 | 224 | N/A | N/A | −12 | −42 | 34 | 116 |
| Mean energy difference against reference (SD) | −254 (480) | −3 (97) | −229 (395) | −47 (41) | −20 (316) | 8 (40) | 111 (265) | 44 (102) | |
| Name of Dish, Component | Food Record Reference (kJ) | MyFitnessPal, E Difference (kJ) | MyFitnessPal E Difference (%) | Number of Components Identified | Foodvisor, E Difference (kJ) | Foodvisor E Difference (%) | Number of Components Identified | HealthifyMe, E Difference (kJ) | HealthifyMe E Difference (%) | Number of Components Identified | Fastic, E Difference (kJ) | Fastic E Difference (%) | Number of Components Identified |
|---|---|---|---|---|---|---|---|---|---|---|---|---|---|
| Western diet mixed dishes | |||||||||||||
| Eggs on toast with butter | 1623 | −569 | −35% | −556 | −34% | 155 | 10% | −368 | −23% | ||||
| White Toast | 736 | −108 | −15% | 2/3, omitted butter | −71 | −10% | 3/3 identified | 76 | 10% | 3/3 identified | N/A | N/A | Didn’t identify individual components |
| Fried Egg (fried in oil) | 306 | 120 | 39% | −59 | −19% | 230 | 75% | N/A | N/A | ||||
| Butter, Regular fat | 581 | N/A | N/A | −426 | −73% | −150 | −26% | N/A | N/A | ||||
| Spaghetti Bolognese | 1489 | −192 | −13% | −443 | −30% | 369 | 25% | 394 | 26% | ||||
| Pasta Sauce | 111 | 182 | 164% | 3/3 identified | N/A | N/A | Didn’t identify individual components | N/A | N/A | Didn’t identify individual components | N/A | N/A | Didn’t identify individual components |
| Spaghetti pasta | 803 | 494 | 62% | −510 | −64% | N/A | N/A | N/A | N/A | ||||
| Beef (minced) | 690 | 21 | 3% | N/A | N/A | N/A | N/A | N/A | N/A | ||||
| Hamburger | 2299 | −1044 | −45% | 15 | 1% | −667 | −29% | −416 | −18% | ||||
| Bun | 836 | N/A | N/A | Didn’t identify individual components | N/A | N/A | Didn’t identify individual components | N/A | N/A | Didn’t identify individual components | N/A | N/A | Didn’t identify individual components |
| Beef Patty | 300 | N/A | N/A | N/A | N/A | N/A | N/A | N/A | N/A | ||||
| Cheese | 357 | N/A | N/A | N/A | N/A | N/A | N/A | N/A | N/A | ||||
| Lettuce | 9 | N/A | N/A | N/A | N/A | N/A | N/A | N/A | N/A | ||||
| Tomato | 22 | N/A | N/A | N/A | N/A | N/A | N/A | N/A | N/A | ||||
| Asian diet mixed dishes | |||||||||||||
| Beef and Vegetable Stir Fry | 1503 | −591 | −39% | −708 | −47% | 999 | 66% | −185 | −12% | ||||
| Beef | 519 | 192 | 37% | 4/4 identified | 418 | 81% | Identified 3/4 components, identified bok choy as green asparagus or zucchini | N/A | N/A | Didn’t identify individual components | N/A | N/A | Didn’t identify individual components |
| Bok Choy | 308 | −300 | −97% | N/A | N/A | N/A | N/A | N/A | N/A | ||||
| Carrots | 75 | 30 | 41% | 101 | 135% | N/A | N/A | N/A | N/A | ||||
| Mushrooms | 67 | 21 | 31% | 180 | 267% | N/A | N/A | N/A | N/A | ||||
| Beef Pho | 1424 | 233 | 16% | 701 | 49% | 170 | 12% | 40 | 3% | ||||
| Rice noodles | 829 | N/A | N/A | Didn’t identify individual components | N/A | N/A | Didn’t identify individual components | N/A | N/A | Didn’t identify individual components | N/A | N/A | Didn’t identify individual components |
| Beef | 330 | N/A | N/A | N/A | N/A | N/A | N/A | N/A | N/A | ||||
| Bean sprouts | 6 | N/A | N/A | N/A | N/A | N/A | N/A | N/A | N/A | ||||
| Bibimbap | 1100 | 2967 | 270% | 92 | 8% | 1373 | 125% | −54 | −5% | ||||
| Brown Rice (steamed) | 798 | N/A | N/A | Didn’t identify individual components | 173 | 22% | 3/6 components identified, didn’t identify spinach and bean sprout correctly, omits gochujang paste | N/A | N/A | Didn’t identify individual components | N/A | N/A | Identified Bibimbap as seasoned spinach salad, carrot, bean sprout and brown rice, 4/6 components identified but didn’t have energy for each individual component |
| Zucchini | 29 | N/A | N/A | 88 | 304% | N/A | N/A | N/A | N/A | ||||
| Bean sprouts | 21 | N/A | N/A | N/A | N/A | N/A | N/A | N/A | N/A | ||||
| Spinach | 16 | N/A | N/A | N/A | N/A | N/A | N/A | N/A | N/A | ||||
| Grated carrot | 102 | N/A | N/A | 3 | 3% | N/A | N/A | N/A | N/A | ||||
| Gochujang paste | 3 | N/A | N/A | N/A | N/A | N/A | N/A | N/A | N/A | ||||
| Pearl Milk Tea (Full sugar) | 2594 | −1430 | −55% | N/A | N/A | −1966 | −76% | −1264 | −49% | ||||
| Milk Tea | N/A | N/A | N/A | Didn’t identify individual components | N/A | N/A | Identified bubble tea as cappuccino or plain yoghurt | N/A | N/A | Didn’t identify individual components | N/A | N/A | Didn’t identify individual components |
| Pearls | N/A | N/A | N/A | N/A | N/A | N/A | N/A | N/A | N/A | ||||
Disclaimer/Publisher’s Note: The statements, opinions and data contained in all publications are solely those of the individual author(s) and contributor(s) and not of MDPI and/or the editor(s). MDPI and/or the editor(s) disclaim responsibility for any injury to people or property resulting from any ideas, methods, instructions or products referred to in the content. |
© 2024 by the authors. Licensee MDPI, Basel, Switzerland. This article is an open access article distributed under the terms and conditions of the Creative Commons Attribution (CC BY) license (https://creativecommons.org/licenses/by/4.0/).
Share and Cite
Li, X.; Yin, A.; Choi, H.Y.; Chan, V.; Allman-Farinelli, M.; Chen, J. Evaluating the Quality and Comparative Validity of Manual Food Logging and Artificial Intelligence-Enabled Food Image Recognition in Apps for Nutrition Care. Nutrients 2024, 16, 2573. https://doi.org/10.3390/nu16152573
Li X, Yin A, Choi HY, Chan V, Allman-Farinelli M, Chen J. Evaluating the Quality and Comparative Validity of Manual Food Logging and Artificial Intelligence-Enabled Food Image Recognition in Apps for Nutrition Care. Nutrients. 2024; 16(15):2573. https://doi.org/10.3390/nu16152573
Chicago/Turabian StyleLi, Xinyi, Annabelle Yin, Ha Young Choi, Virginia Chan, Margaret Allman-Farinelli, and Juliana Chen. 2024. "Evaluating the Quality and Comparative Validity of Manual Food Logging and Artificial Intelligence-Enabled Food Image Recognition in Apps for Nutrition Care" Nutrients 16, no. 15: 2573. https://doi.org/10.3390/nu16152573
APA StyleLi, X., Yin, A., Choi, H. Y., Chan, V., Allman-Farinelli, M., & Chen, J. (2024). Evaluating the Quality and Comparative Validity of Manual Food Logging and Artificial Intelligence-Enabled Food Image Recognition in Apps for Nutrition Care. Nutrients, 16(15), 2573. https://doi.org/10.3390/nu16152573