Abstract
Background: Obesity is commonly aggregated with indices of metabolic health. Proponents of body positivity approaches question whether body size is a determinant of health and well-being. Our objective was to conduct an exploratory factor analysis (EFA) to determine if body size measurements factor load with or independent of metabolic health measures. Methods: The EFA was conducted on n= 249 adults using baseline data from four weight loss trials (Sample 1: n = 40; Sample 2: n = 52; Sample 3: n = 53; Sample 4: n = 104). An EFA of nine items (systolic blood pressure [SBP], diastolic blood pressure [DBP], hemoglobin A1c [HbA1c], HDL-cholesterol [HDL], LDL-cholesterol [LDL], total cholesterol [TC], body mass index [BMI], body fat percent BF%], and waist circumference [WC]) was conducted with oblique rotation. Results: Three factors were retained, which produced a model explaining 87.5% of the variance. Six items loaded strongly (>0.8) under three components and were selected for retention (Factor 1: LDL and TC; Factor 2: BMI and WC; Factor 3: SBP and DBP). Conclusion: Body size measures loaded separately from measures of metabolic health and metabolic health were further split into lipid- and blood pressure-focused factors. These results support weight-neutral interventions to improve overall health and well-being.
1. Introduction
One of the hallmarks of obesity is that it increases risk of developing cardiometabolic diseases (CMD), especially type 2 diabetes (T2D) and cardiovascular disease (CVD). Altogether, CMDs were responsible for the deaths of over 4.8 million adults in the United States between 1990 and 2017 [1]. Intentional weight loss has traditionally been the first line treatment approach for reducing CMD risk in people with obesity because of its well-documented metabolic benefits [2,3]. Reducing body weight by 5–10% can yield clinically meaningful improvements in CMD risk factors, and this range of weight loss has become a widely accepted benchmark for “successful” weight loss by obesity clinicians and researchers [3,4]. Despite the established importance of weight loss to reduce the metabolic disease risk associated with obesity, proponents of weight-neutral and body positivity approaches raise questions about the utility of focusing on body weight [5,6]. It is suggested that body size is not the only determinant of health and well-being and that weight loss should be optional for people with obesity to be healthy [7].
Weight neutral approaches to obesity treatment such as Health at Every Size® (HAES, trademarked by the Association for Size Diversity and Health) encourages people of all body sizes to engage in behaviors such as self-acceptance, intuitive eating, and physical activity instead of emphasizing weight loss [8]. The paradigm also encourages deemphasizing the measure of body mass index (BMI) so that healthcare decisions are not based on body size [5]. These principles contradict traditional obesity treatment approaches and have sparked a provocative debate among the scientific community. Critics are quick to point out that weight loss is effective for preventing and managing several chronic diseases and believe that individuals have a personal responsibility to manage their health and weight [9]. HAES® supporters argue that the presumption that people with obesity have failed to take individual responsibility has led to “fatphobia” (anti-fat bias) and neglects to consider the physiological and environmental factors associated with the etiology of obesity [9].
From a critic’s perspective, an extensive body of research supports weight loss as an effective means for treating obesity-related CMD [3,10]. Moreover, a clinician may prescribe a treatment regimen (e.g., calorie restriction for weight loss), but it is up to the individual to determine if they accept the responsibility of behavior change. This reasoning suggests that long-term weight loss is achievable through behavior change if the person is determined to do so. From a weight-neutral and body positivity perspective, the traditional intervention approach of “eat less, move more” has not been effective in producing long-term results or curtailing obesity rates [11,12,13]. Also, research shows that the development and expression of obesity is multifactorial and characterized by a combination of physiological, behavioral, and environmental factors [3]. This reasoning suggests traditional obesity treatment is flawed, possibly because it is not as diverse as the factors that contribute to how obesity is developed and expressed. Considering both sides of this debate, it may be time to identify treatment modalities that do not solely focus on body size but rather expand the metrics of successful treatment to more holistic measures of health and well-being as suggested by HAES® and similar approaches.
While conceptual debate is critical to transform understanding into real-world solutions, more empirical evidence is necessary to move the debate forward. Here, we take a data-driven approach to investigate the construct(s) driving obesity and CMD. The purpose of this research is to conduct an exploratory factor analysis (EFA) to determine if measurements of body size covary with or independent of common clinical measures of cardiometabolic health to identify potential latent constructs. If these constructs are independent, further investigation into holistic obesity treatments (with or without weight loss) may be warranted. We hypothesize that obesity and CMD are multidimensional and that the EFA will reveal two distinct factors: metabolic health and body size.
2. Materials and Methods
2.1. Subjects
Baseline data from a convenience sample of 250 adults from four behavioral weight loss interventions were used for analyses. Putative measures were performed at baseline study visits, which took approximately 60 min to administer. Participants were instructed to fast for at least 8 h and stay hydrated while refraining from moderate-to-vigorous physical activity for 24 h prior to testing. Descriptions of each study can be found in Table 1.

Table 1.
Descriptions of studies used in present analysis.
2.2. Demographics
Demographic information was collected via REDCap 14.6.1 and is presented in Table 2. These data were collected at baseline through a questionnaire. The EFA included nine items of two wellness dimensions and are described below. Metabolic data were collected from either laboratory-drawn blood samples or a fingerstick blood sample analyzed by point of care (POC) devices.
Table 2.
Participant characteristics (n = 249).
2.3. Metabolic Health Measures
Laboratory-drawn blood samples and analyses: Metabolic data from trials NCT04392284 and NCT03832933 were obtained using laboratory-drawn blood samples. Fasting concentrations of total cholesterol (TC), high-density lipoprotein cholesterol (HDL-C), and low-density lipoprotein cholesterol (LDL-C) were drawn at the Laboratory of the Family and Community Medicine Clinic or Encompass Health Lakeshore Rehabilitation Hospital and transported to the CLIA-certified analytic laboratory managed by the UAB Department of Pathology (Outreach Lab, Birmingham, AL, USA).
POC fingerstick samples and analyses: Metabolic data from trials NCT04014296 and NCT04745572 were obtained from POC devices. Participants were instructed to rest for five minutes and then 40 mcg of blood was filled into a capillary tube from the tip of the ring finger of their non-dominant hand. A plunger was used to dispense the entire sample into the sample well of a cassette for analysis in the Cholestech LDX device (Cholestech Corp., San Diego, CA, USA). Analytes from the Cholestech LDX were obtained using the Lipid Profile + Glucose Cassettes that included glucose, total cholesterol (TC), high-density lipoprotein cholesterol (HDL-C), low-density lipoprotein cholesterol (LDL-C), and triglycerides (TG), and were previously found to be comparable to laboratory blood draws utilizing the National Health System (NHS) [15,16,17,18]. Glucose and TG were not used in the EFA because of their sensitivity to fasting vs. fed states. To measure hemoglobin A1c (A1c), 0.5 mcg of blood was collected into another capillary tube that was placed into another cassette and into the Alere Affinion analyzer (Alere Inc., Waltham, MA, USA) [18].
Blood pressure: Blood pressure was measured using a Welch Allyn 71WT-B Connex Spot blood pressure monitor (Hill-Rom Holdings, Inc., Skaneateles Falls, NY, USA). The participant was instructed to sit for 5–10 min prior to testing. The appropriately sized cuff (regular, long) was placed on the participant’s left bicep and measured in triplicate and averaged.
2.4. Body Size Measures
InBody S10 (InBody®, Cerritos, CA, USA) body composition analyzer: This device was used to measure BF% in trials NCT04014296, NCT04745572, and NCT04392284. Participants were instructed to remove their socks, shoes, excess clothing, and jewelry. They were asked to lay supine on a clinic bed for 10 min prior to measurement to allow for body fluid to equilibrate. Their arms and legs were spread apart to avoid contact with the trunk region. Touch-type electrodes were clipped to participants’ thumbs, middle fingers, and ankles after these areas were cleansed with the manufacturer’s body tissue wipe. Demographic parameters including weight, height, age, and sex were used for computing analyses.
Dual-energy X-ray absorptiometry (DXA): A whole-body DXA scan was completed using the GE Lunar Prodigy Primo (encore software version 15.10.046, GE Healthcare, Chicago, IL, USA) in clinical trial, NCT03832933, and used to measure BF%. A quality assurance assessment was conducted prior to use. Participants were instructed to remove jewelry and wear clothing without zippers, wires, or metal accessories and positioned in a supine position under the scanning arm according to the manufacturer’s instructions. Good agreement has been found between InBody S10 and DXA [19,20,21], especially when supine (intraclass correlation coefficient = 0.94) [22].
Waist circumference: Waist circumference was measured at the boarder of the iliac crest in accordance with National Institutes of Health [23]. Two measures were obtained consecutively, and the average was used for analyses.
Body mass index (BMI): To calculate BMI (kg/m2), weight was obtained from a platform scale (either DETECTO BRW1000, DETECTO, Webb City, MO, or Health O Meter Professional Scales, McCook, IL, USA) with an accuracy ±0.1 kg while they were dressed in lightweight clothing and without shoes. For each trial, the same scale was used at baseline and follow-up testing. Height was measured using a stadiometer to the nearest 0.5 cm.
2.5. Statistical Analysis
The EFA was conducted in n= 249 people to determine the factor structure of metabolic and body size measures. An unweighted least squares (ULS) extraction method was used because it is recommended when only few factors are expected to be retained and if communalities are high (>0.6). To allow variables to be correlated, an oblique rotation method (direct oblimin) with Kaiser normalization was used. Nine items were included in the EFA. Model fit statistics, communalities, and reproduced correlation residuals were analyzed and interpreted. Factors with eigenvalues > 1 (Kaiser’s criterion) were selected for retention and scree plots were analyzed to confirm. Items with coefficients < 0.6 were considered for removal to ensure the most parsimonious model was produced with moderate-to-high item-to-factor correlations. To measure scale reliability, Cronbach’s alpha was analyzed and values > 0.60 were considered satisfactory [24]. Internal consistency was measured by item total correlations and values > 0.20 were considered satisfactory [25]. Cases were excluded listwise to handle missing data. Statistical analyses were performed using IBM SPSS Statistics software (version 29 for Windows).
3. Results
3.1. Exploratory Factor Analysis
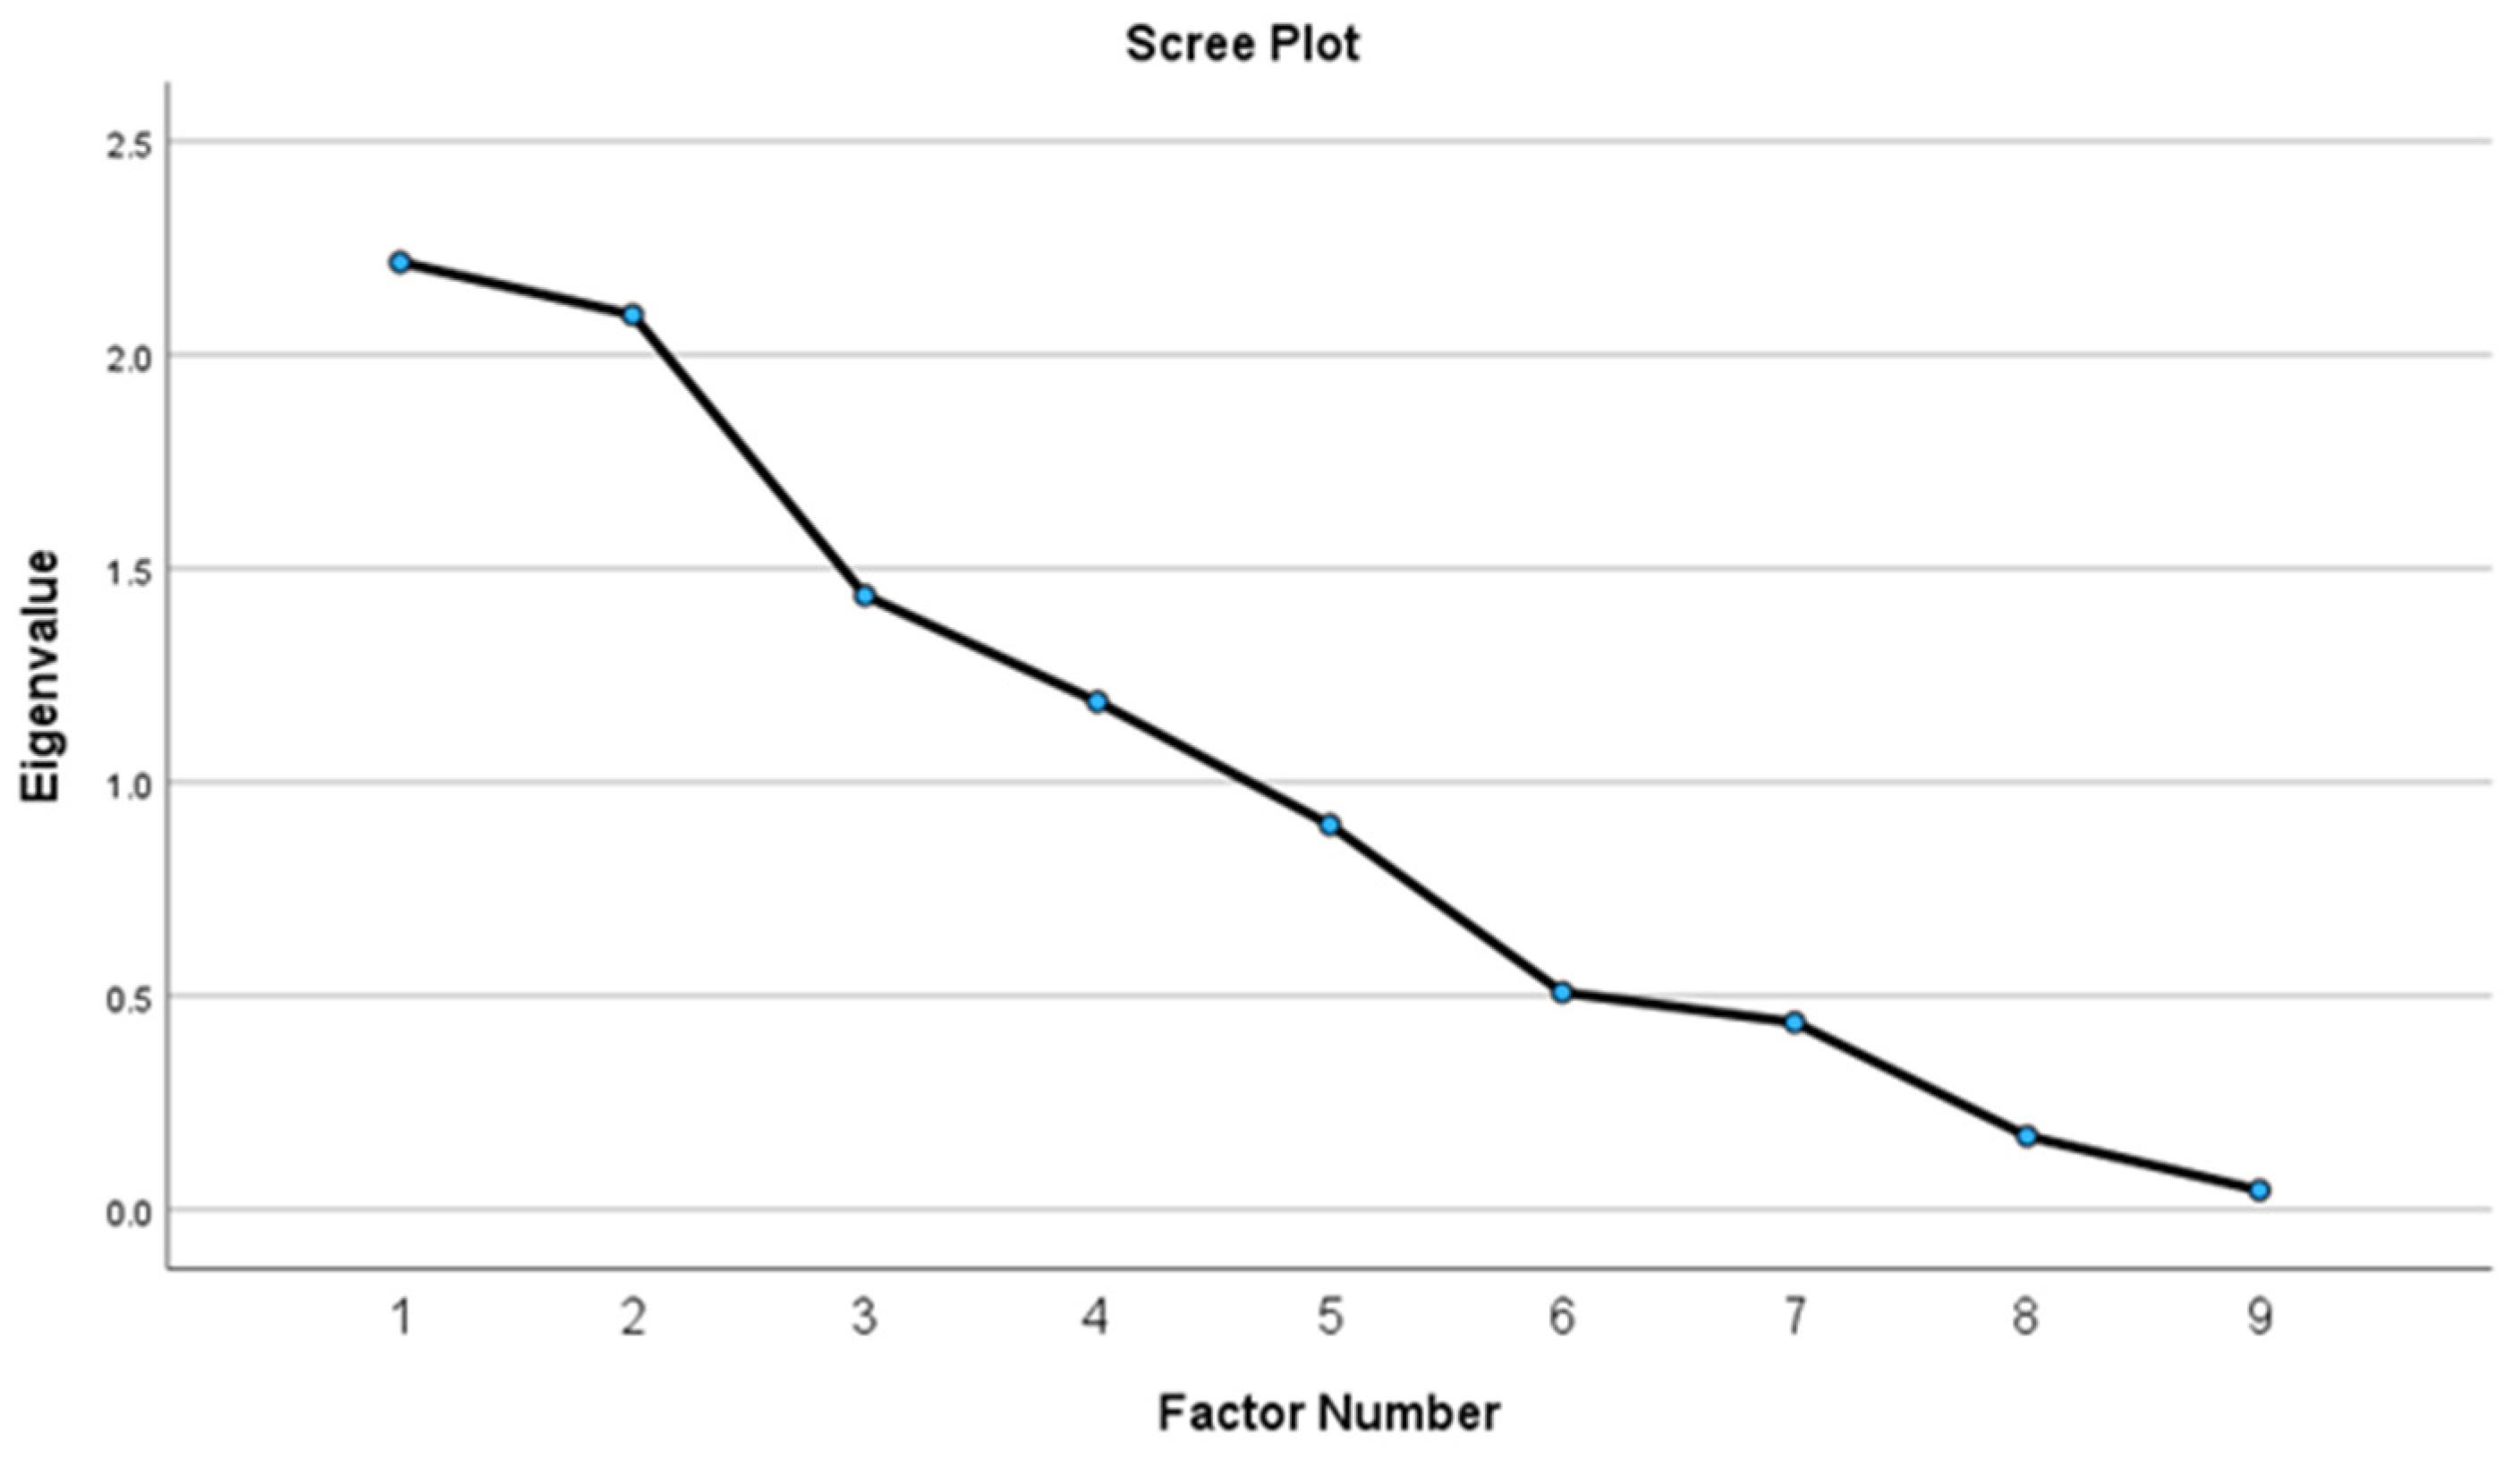
The EFA included nine items from n = 249 adults (55.7 ± 11.3 years; 74.7% female) with obesity (BMI 38.5 ± 6.7 kg/m2). See Table 3 for descriptive statistics and Table 4 for model fit statistics. The scree plot produced after the first round of dimension reduction suggested there were four factors with eigenvalues > 1.0 that explained 77.1% of the variance (Figure 1). Items that did not factor load (coefficients < 0.60) were removed one at a time and replaced back into the model so that every combination of items was tested. Items were removed if their exclusion produced a more parsimonious model with greater explained variance. The following items were removed in order: A1c, BF%, and HDL-C. The final factor solution included three factors explaining 87.6% of the variance as shown in Figure 2 and Table 5. LDL-C and TC loaded on factor one, BMI and WC loaded on factor two, and SBP and DBP loaded on factor three.
Table 3.
Descriptive statistics.
Table 4.
Model fit statistics.
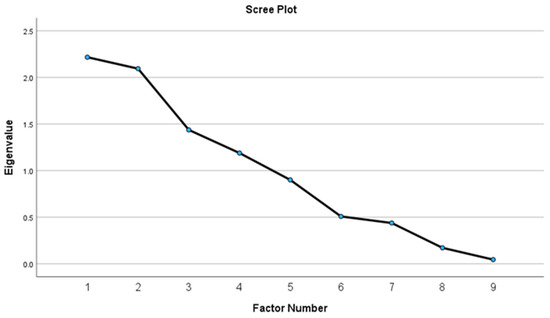
Figure 1.
Scree plot of initial four-factor solution.
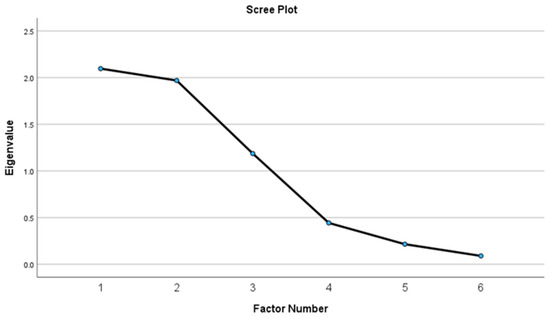
Figure 2.
Scree plot of final three-factor solution.
Table 5.
Pattern matrix of final three-factor solution.
3.2. Item Total Correlations
Internal consistency (α) and item/total correlations were calculated to analyze the final scales for each factor (Table 6). The range of item/total correlations were satisfactory for the lipid factor (0.91), the body size factor (0.79), and the blood pressure factor (0.56). Reliability (α) was also satisfactory for the lipid measures (0.95), the body size measures (0.74), and the blood pressure measures (0.67).
Table 6.
Corrected item/total correlations and alpha of factors if item were deleted.
4. Discussion
The final EFA model revealed three dimensions: lipids, body size, and blood pressure. Results supported the hypothesis that measures of body size would factor load separately from measures of metabolic health, but the distinction of lipid and blood pressure measures of metabolic health was not anticipated. The model also demonstrated acceptable internal consistency of the scales and item/total correlations. These findings support that measures of body size are distinct from CMD risk factors and lend credence to HAES® approaches that advocate for weight-neutral interventions for improving health and well-being in people with obesity.
An EFA is a data-driven approach to identify unobservable constructs and determine the dimensionality of two or more variables. It recognizes patterns in the way that items of a dataset group (e.g., covary) together. The items that group together the strongest are considered to have an underlying construct that interconnects them. Items that do not possess patterns in their covariances are loaded onto separate factors and considered to be multidimensional. Our final EFA model showed that CMD risk factors were multidimensional from measures of body size, indicating the presence of latent constructs driving their distinction.
The constructs of body size and metabolic disease are often conflated because it is well known that there is strong association between the two [3,26]. However, there are cases where obesity can exist without CMD and vice versa. An example is the metabolically obesity healthy (MHO) phenotype in which someone with obesity does not have metabolic disease (i.e., insulin resistance, dyslipidemia, or hypertension) [27]. It is also possible to have cardiometabolic diseases like type 2 diabetes [28] or cardiovascular disease [29,30] without having obesity, also sometimes called the metabolically unhealthy normal weight phenotype [31]. It is obvious that in many cases obesity and CMD coexist, but results of the present study suggest they may be driven by distinct factors. Therefore, each distinct factor could be intervened on separately as part of a patient-centered obesity treatment regimen. Importantly, the well-known connection between obesity and CMD should not be minimized, but rather the distinction between their constructs may present opportunities for other treatment avenues. For example, one could prefer to manage their metabolic health rather than their body size. Physical activity could help prevent CMD with or without weight loss; however, changes in body size/weight are likely to cooccur [32,33].
Obesity is driven by a diverse set of behavioral, physiological, and environmental factors that vary considerably across individuals and populations [34]. Interindividual variability among these driving factors could explain the identified latent constructs driving the distinction between body size and metabolic health. Since obesity’s development and expression is multifactorial, treatment options should also be diverse. Although weight loss should still be included in an obesity treatment paradigm, a constant focus on it may also promote unhealthy attitudes and behaviors such as body dissatisfaction, eating disorders, low self-esteem, and disinterest in physical activity. Therefore, HAES®-based weight-neutral interventions could be used to expand the focus from just weight loss to include more holistic obesity treatment regimens.
A strength of this study is the sample size, which provided a 27:1 subject to item ratio. Although the sample size required for an EFA is not standardized, a ratio of at least 20:1 is generally acceptable [35]. A potential limitation of this research is that our sample consisted mostly of older adult females (mean age 55.7 ± 11.3, 74.7% female) and people with obesity. Therefore, generalizability to men, younger populations, and/or those with MHO or metabolically unhealthy normal weight phenotypes is weaker. Additionally, methods used to collect blood (POC vs. laboratory-drawn blood) and BF% (DXA vs. BIA) varied across studies, but previous research has reported the body composition methods used in the included studies demonstrated suitable agreement [22]. Future research requires a confirmatory factor analysis (CFA) to confirm these results. Additional CFAs (and possibly additional EFAs) will need to be conducted in more diverse populations.
5. Conclusions
Measures of body size factor loaded separately from measures of metabolic health among people with obesity who were entering a weight loss trial, and metabolic health was further split into lipid- and blood pressure-focused factors. These results provide opportunities for both weight-focused (i.e., weight loss) and weight-neutral interventions to improve overall health and well-being [36]. Future research requires a CFA and investigation into additional populations with greater age, sex/gender, and body size diversity.
Author Contributions
Conceptualization, K.M.E. and R.D.S.; Methodology, K.M.E. and K.A.S.; Formal Analysis, K.M.E.; Investigation, K.M.E., A.E.Z., C.R., S.E.E., J.G.C. and T.-K.C.; Resources, J.O.H., H.R.W. and R.D.S.; Data Curation, K.M.E., A.E.Z., C.R., S.E.E., J.G.C. and T.-K.C.; Writing—Original Draft Preparation, K.M.E.; Writing—Review and Editing, A.E.Z., C.R., S.E.E., J.G.C., T.-K.C., J.O.H., H.R.W. and R.D.S.; Visualization, K.M.E.; Supervision, A.E.Z. and S.E.E.; Project Administration, K.M.E., A.E.Z., C.R., S.E.E. and J.G.C.; Funding Acquisition, J.O.H., H.R.W. and R.D.S. All authors have read and agreed to the published version of the manuscript.
Funding
Affiliated studies were funded by (1) National Institutes of Health (NIH), National Institute for Diabetes, and Digestive, and Kidney Diseases (K01DK124244); (2) the University of Alabama at Birmingham (UAB) Nutrition Obesity Research Center (P30DK056336), which funded a portion of KME’s graduate training; (3) the UAB Nutrition Obesity Research Center—Chronic Disease and Health Disparities Revision (3P30DK056336-18S1); (4) the National Institutes of Minority Health and Health Disparities as part of a competitive revision to the Forge AHEAD Center (P50MD017338-03S1); (5) General Mills Inc., Minneapolis, MN which funded a portion of KME’s graduate training; (6) Beef Checkoff/National Cattlemen’s Beef Association and the National Institutes of Health/National Center for Advancing Translational Sciences (NCATS) Colorado Clinical and Translational Science Award (UL1TR002535); and (7) JGC’s Postdoctoral training was supported by the Alzheimer’s Disease Research Center P30 AG072973 and T32 AG078114. The sponsors were not involved in the design or conduct of the research or the interpretation of results.
Institutional Review Board Statement
Studies included in this analysis were conducted according to the guidelines of the Declaration of Helsinki and approved by the Institutional Review Board of the University of Alabama at Birmingham with protocol codes 30003818 on 4 April 2020, 300006816 on 19 April 2021, 300005391 on 12 August 2020, and 300002928 on 15 May 2019.
Informed Consent Statement
Informed consent was obtained from all subjects involved in the studies.
Data Availability Statement
The original data presented in the study are openly available in PubMed Central at https://www.ncbi.nlm.nih.gov/pmc/ (accessed on 2 August 2024).
Acknowledgments
The authors would like to thank the participants, the clinical staff, nurses, and primary care providers at the University of Alabama at Birmingham, Highlands family medicine clinics, and the Wellness, Health, and Research Facility (WHARF) on the Lakeshore Foundation Campus for their invaluable collaboration.
Conflicts of Interest
J.O.H. is a member of the General Mills Health and Wellness Advisory Committee, for which he receives an honorarium. H.R.W. and J.O.H. are co-owners of the State of Slim weight management program, which was the intervention in the affiliated study, NCT04014296. H.R.W. and R.D.S. report speaking fees from the National Cattlemen’s Beef Association. The other authors declared no conflicts of interest.
References
- National Academies of Sciences, Engineering, and Medicine; Division of Behavioral and Social Sciences and Education; Committee on National Statistics; Committee on Population; Committee on Rising Midlife Mortality Rates and Socioeconomic Disparities. Cardiometabolic Diseases. In High and Rising Mortality Rates among Working-Age Adults; Harris, K.M., Majmundar, M.K., Becker, T., Eds.; National Academies Press (US): Washington, DC, USA, 2021. [Google Scholar]
- Wing, R.R.; Lang, W.; Wadden, T.A.; Safford, M.; Knowler, W.C.; Bertoni, A.G.; Hill, J.O.; Brancati, F.L.; Peters, A.; Wagenknecht, L. Benefits of modest weight loss in improving cardiovascular risk factors in overweight and obese individuals with type 2 diabetes. Diabetes Care 2011, 34, 1481–1486. [Google Scholar] [CrossRef] [PubMed]
- Garvey, W.T.; Mechanick, J.I.; Brett, E.M.; Garber, A.J.; Hurley, D.L.; Jastreboff, A.M.; Nadolsky, K.; Pessah-Pollack, R.; Plodkowski, R. American Association of Clinical Endocrinologists and American College of Endocrinology Comprehensive Clinical Practice Guidelines for Medical Care of Patients with Obesity. Endocr. Pract. 2016, 22, 1–203. [Google Scholar] [PubMed]
- Ryan, D.H.; Yockey, S.R. Weight Loss and Improvement in Comorbidity: Differences at 5%, 10%, 15%, and Over. Curr. Obes. Rep. 2017, 6, 187–194. [Google Scholar] [CrossRef]
- The Association for Size Diversity and Health (ASDAH). Health at Every Size®. Available online: https://asdah.org/haes/ (accessed on 23 May 2024).
- Ulian, M.D.; Benatti, F.B.; de Campos-Ferraz, P.L.; Roble, O.J.; Unsain, R.F.; de Morais Sato, P.; Brito, B.C.; Murakawa, K.A.; Modesto, B.T.; Aburad, L.; et al. The Effects of a “Health at Every Size®”-Based Approach in Obese Women: A Pilot-Trial of the “Health and Wellness in Obesity” Study. Front. Nutr. 2015, 2, 34. [Google Scholar] [CrossRef] [PubMed]
- Bacon, L.; Aphramor, L. Weight science: Evaluating the evidence for a paradigm shift. Nutr. J. 2011, 10, 9. [Google Scholar] [CrossRef]
- Hagen, S.J.; Henningfield, M.F. Health at Every Size Principles: Clinician Perspectives to Limit Weight Stigma in Medical Care. WMJ 2023, 122, 277–279. [Google Scholar]
- Penney, T.L.; Kirk, S.F. The Health at Every Size paradigm and obesity: Missing empirical evidence may help push the reframing obesity debate forward. Am. J. Public Health 2015, 105, e38–e42. [Google Scholar] [CrossRef]
- Morsali, M.; Poorolajal, J.; Shahbazi, F.; Vahidinia, A.; Doosti-Irani, A. Diet Therapeutics Interventions for Obesity: A Systematic Review and Network Meta-Analysis. J. Res. Health Sci. 2021, 21, e00521. [Google Scholar] [CrossRef]
- Hall, K.D. Metabolic Adaptations to Weight Loss. Obesity 2018, 26, 790–791. [Google Scholar] [CrossRef]
- Martins, C.; Roekenes, J.; Gower, B.A.; Hunter, G.R. Metabolic adaptation is associated with less weight and fat mass loss in response to low-energy diets. Nutr. Metab. 2021, 18, 60. [Google Scholar] [CrossRef]
- Hales, C.M.; Fryar, C.D.; Ogden, C.L. Prevalence of Obesity and Severe Obesity among Adults: United States, 2017–2018; National Center for Health Statistics: Hyattsville, MD, USA, 2020.
- Clina, J.G.; Sayer, R.D.; Pan, Z.; Cohen, C.W.; McDermott, M.T.; Catenacci, V.A.; Wyatt, H.R.; Hill, J.O. High- and normal-protein diets improve body composition and glucose control in adults with type 2 diabetes: A randomized trial. Obesity 2023, 31, 2021–2030. [Google Scholar] [CrossRef]
- Whitehead, S.J.; Ford, C.; Gama, R. A combined laboratory and field evaluation of the Cholestech LDX and CardioChek PA point-of-care testing lipid and glucose analysers. Ann. Clin. Biochem. 2014, 51, 54–67. [Google Scholar] [CrossRef] [PubMed]
- Shephard, M.D.; Mazzachi, B.C.; Shephard, A.K. Comparative performance of two point-of-care analysers for lipid testing. Clin. Lab. 2007, 53, 561–566. [Google Scholar] [PubMed]
- Panz, V.R.; Raal, F.J.; Paiker, J.; Immelman, R.; Miles, H. Performance of the CardioChek PA and Cholestech LDX point-of-care analysers compared to clinical diagnostic laboratory methods for the measurement of lipids. Cardiovasc. J. S. Afr. 2005, 16, 112–117. [Google Scholar] [PubMed]
- Arnold, W.D.; Kupfer, K.; Little, R.R.; Amar, M.; Horowitz, B.; Godbole, N.; Hvidsten Swensen, M.; Li, Y.; San George, R.C. Accuracy and Precision of a Point-of-Care HbA1c Test. J. Diabetes Sci. Technol. 2020, 14, 883–889. [Google Scholar] [CrossRef] [PubMed]
- D’Hondt, J.; Waterplas, J.; Chapelle, L.; Clarys, P.; D’Hondt, E. A Comparative and Sex-Specific Study of Bio-Electrical Impedance Analysis and Dual Energy X-ray Absorptiometry for Estimating Whole-Body and Segmental Body Composition in Healthy Young Adults. Appl. Sci. 2022, 12, 7686. [Google Scholar] [CrossRef]
- Ng, B.K.; Liu, Y.E.; Wang, W.; Kelly, T.L.; Wilson, K.E.; Schoeller, D.A.; Heymsfield, S.B.; Shepherd, J.A. Validation of rapid 4-component body composition assessment with the use of dual-energy X-ray absorptiometry and bioelectrical impedance analysis. Am. J. Clin. Nutr. 2018, 108, 708–715. [Google Scholar] [CrossRef]
- Suida, A.; Chomentowski, P.J., III; Salacinski, A.J.; Broeder, C. Validity of Whole and Regional Body Composition Testing Devices: 986 Board #165 May 31 3: 30 PM–5: 00 PM. Med. Sci. Sports Exerc. 2017, 49, 264–265. [Google Scholar]
- Ellison, K.M.; Ehrlicher, S.E.; El Zein, A.; Sayer, R.D. Fat and fat-free mass measurement agreement by dual-energy X-ray absorptiometry versus bioelectrical impedance analysis: Effects of posture and waist circumference. Obes. Sci. Pract. 2024, 10, e744. [Google Scholar] [CrossRef]
- Office of Public Health and Science, Health and Human Services Department. The Practical Guide: Identification, Evaluation, and Treatment of Overweight and Obesity in Adults; Office of Public Health and Science, Health and Human Services Department: Washington, DC, USA, 2000.
- Taber, K.S. The Use of Cronbach’s Alpha When Developing and Reporting Research Instruments in Science Education. Res. Sci. Educ. 2018, 48, 1273–1296. [Google Scholar] [CrossRef]
- Zijlmans, E.A.O.; Tijmstra, J.; van der Ark, L.A.; Sijtsma, K. Item-Score Reliability in Empirical-Data Sets and Its Relationship With Other Item Indices. Educ. Psychol. Meas. 2018, 78, 998–1020. [Google Scholar] [CrossRef]
- Bays, H.E.; Chapman, R.H.; Grandy, S. The relationship of body mass index to diabetes mellitus, hypertension and dyslipidaemia: Comparison of data from two national surveys. Int. J. Clin. Pract. 2007, 61, 737–747. [Google Scholar] [CrossRef]
- Blüher, M. Metabolically Healthy Obesity. Endocr. Rev. 2020, 41, bnaa004. [Google Scholar] [CrossRef] [PubMed]
- Taylor, R.; Holman, R.R. Normal weight individuals who develop type 2 diabetes: The personal fat threshold. Clin. Sci. 2015, 128, 405–410. [Google Scholar] [CrossRef] [PubMed]
- Batsis, J.A.; Sahakyan, K.R.; Rodriguez-Escudero, J.P.; Bartels, S.J.; Somers, V.K.; Lopez-Jimenez, F. Normal weight obesity and mortality in United States subjects ≥ 60 years of age (from the Third National Health and Nutrition Examination Survey). Am. J. Cardiol. 2013, 112, 1592–1598. [Google Scholar] [CrossRef] [PubMed]
- Romero-Corral, A.; Somers, V.K.; Sierra-Johnson, J.; Korenfeld, Y.; Boarin, S.; Korinek, J.; Jensen, M.D.; Parati, G.; Lopez-Jimenez, F. Normal weight obesity: A risk factor for cardiometabolic dysregulation and cardiovascular mortality. Eur. Heart J. 2010, 31, 737–746. [Google Scholar] [CrossRef]
- Stefan, N.; Schick, F.; Häring, H.-U. Causes, Characteristics, and Consequences of Metabolically Unhealthy Normal Weight in Humans. Cell Metab. 2017, 26, 292–300. [Google Scholar] [CrossRef]
- Ekelund, U.; Besson, H.; Luan, J.A.; May, A.M.; Sharp, S.J.; Brage, S.; Travier, N.; Agudo, A.; Slimani, N.; Rinaldi, S.; et al. Physical activity and gain in abdominal adiposity and body weight: Prospective cohort study in 288,498 men and women. Am. J. Clin. Nutr. 2011, 93, 826–835. [Google Scholar] [CrossRef]
- Strasser, B. Physical activity in obesity and metabolic syndrome. Ann. N. Y. Acad. Sci. 2013, 1281, 141–159. [Google Scholar] [CrossRef]
- Diels, S.; Vanden Berghe, W.; Van Hul, W. Insights into the multifactorial causation of obesity by integrated genetic and epigenetic analysis. Obes. Rev. 2020, 21, e13019. [Google Scholar] [CrossRef]
- Anna, B.; Costello, J.O. Best practices in explor actices in exploratory factor analysis: Four or analysis: Four recommendations for getting the most from your analysis. Pract. Assess. Res. Eval. 2005, 10, 1–9. [Google Scholar]
- Ellison, K.; Smith, K.; Hill, J.; Wyatt, H.; Sayer, D. PTFS04-06-23 An Exploratory Factor Analysis of Common Cardiometabolic Measures in People With Obesity for Building a Parsimonious Health Assessment. Curr. Dev. Nutr. 2023, 7, 101649. [Google Scholar] [CrossRef]

Disclaimer/Publisher’s Note: The statements, opinions and data contained in all publications are solely those of the individual author(s) and contributor(s) and not of MDPI and/or the editor(s). MDPI and/or the editor(s) disclaim responsibility for any injury to people or property resulting from any ideas, methods, instructions or products referred to in the content. |
© 2024 by the authors. Licensee MDPI, Basel, Switzerland. This article is an open access article distributed under the terms and conditions of the Creative Commons Attribution (CC BY) license (https://creativecommons.org/licenses/by/4.0/).