Abstract
This study aimed to investigate the effect of Japanese dietary patterns on metabolic dysfunction-associated steatotic liver disease (MASLD) and liver fibrosis. After excluding factors affecting the diagnosis of hepatic steatosis, 727 adults were analyzed as part of the Health Promotion Project. The dietary patterns of the participants were classified into rice, vegetable, seafood, and sweet based on their daily food intake. Liver stiffness measurements and controlled attenuation parameters were performed using FibroScan. Energy and nutrient intake were calculated using the Brief-type Self-administered Diet History Questionnaire. Univariate and multivariate analyses were used to identify the risk factors for liver fibrosis within the MASLD population. The vegetable group had significantly lower liver fibrosis indicators in the MASLD population than the rice group. The multivariate analysis identified a body mass index ≥ 25 kg/m2 (odds ratio [OR], 1.83; 95% confidence interval [CI], 1.01–1.83; p = 0.047) and HOMA-IR ≥ 1.6 (OR, 3.18; 95% CI, 1.74–5.78; p < 0.001) as risk factors for liver fibrosis, and vegetable group membership was a significant low-risk factor (OR, 0.38; 95% CI, 0.16–0.88; p = 0.023). The multivariate analysis of nutrients in low-risk foods revealed high intake of α-tocopherol (OR, 0.74; 95% CI, 0.56–0.99; p = 0.039) as a significant low-risk factor for liver fibrosis. This study suggests that a vegetable-based Japanese dietary pattern, through the antioxidant effects of α-tocopherol, may help prevent liver fibrosis in MASLD and the development of MASLD.
1. Introduction
Metabolic dysfunction-associated steatotic liver disease (MASLD) is a hepatic phenotype of lifestyle-related diseases with an increasing trend and worldwide prevalence of approximately 30% [1]. In 2023, MASLD was renamed from the previous term, non-alcoholic fatty liver disease (NAFLD), with the diagnostic criteria including the presence of hepatic steatosis along with one or more cardiovascular metabolic risk factors [2]. Hepatic steatosis is often accompanied by cardiovascular risks and can progress to metabolic dysfunction-associated steatohepatitis (MASH), with some cases progressing to liver cirrhosis or hepatocellular carcinoma.
The onset and progression of MASLD is influenced by various factors, among which dietary habits play a crucial role. It is widely known that the Mediterranean diet is effective in preventing NAFLD compared to Western diets [3,4]. The Mediterranean diet is characterized by a higher intake of grains, vegetables, fruits, olive oil, and seafood with a lower consumption of red meat and processed foods than Western diets [5,6,7]. Consequently, the Mediterranean diet, which is plant-based and rich in vegetables, exerts beneficial health effects, such as a reduction in cardiovascular diseases [8]. Similarly, the Japanese diet, which is rich in vegetables, soy products, and seafood and low in meat, resembles the Mediterranean diet in dietary patterns and has been reported to be effective in preventing NAFLD [9,10].
Many studies have investigated the relationship between national dietary patterns, such as Japanese, Mediterranean, and Western diets, and MASLD. However, few epidemiological studies have examined the extent to which differences in dietary patterns within the same region of the country influence the onset and progression of MASLD. The onset and progression of MASLD involves many factors other than diet, such as sex, age, lifestyle, insulin resistance, and lipid metabolism, necessitating adjustment for these confounding factors. In addition, there are no reports investigating the specific forms of Japanese diet that are effective against MASLD and MASH, despite being already known to be effective against NAFLD.
Therefore, we hypothesized that the Japanese diet is effective at preventing MASLD and liver fibrosis. We conducted an epidemiological evaluation involving a large sample of the general population in the rural areas of Japan. This study assessed how the differences in daily Japanese dietary patterns contribute to the onset of MASLD and its progression to liver fibrosis using detailed questionnaires and numerous measurement items. This study aimed to investigate the effect of Japanese dietary patterns on MASLD and liver fibrosis in the general Japanese population.
2. Materials and Methods
2.1. Study Subjects
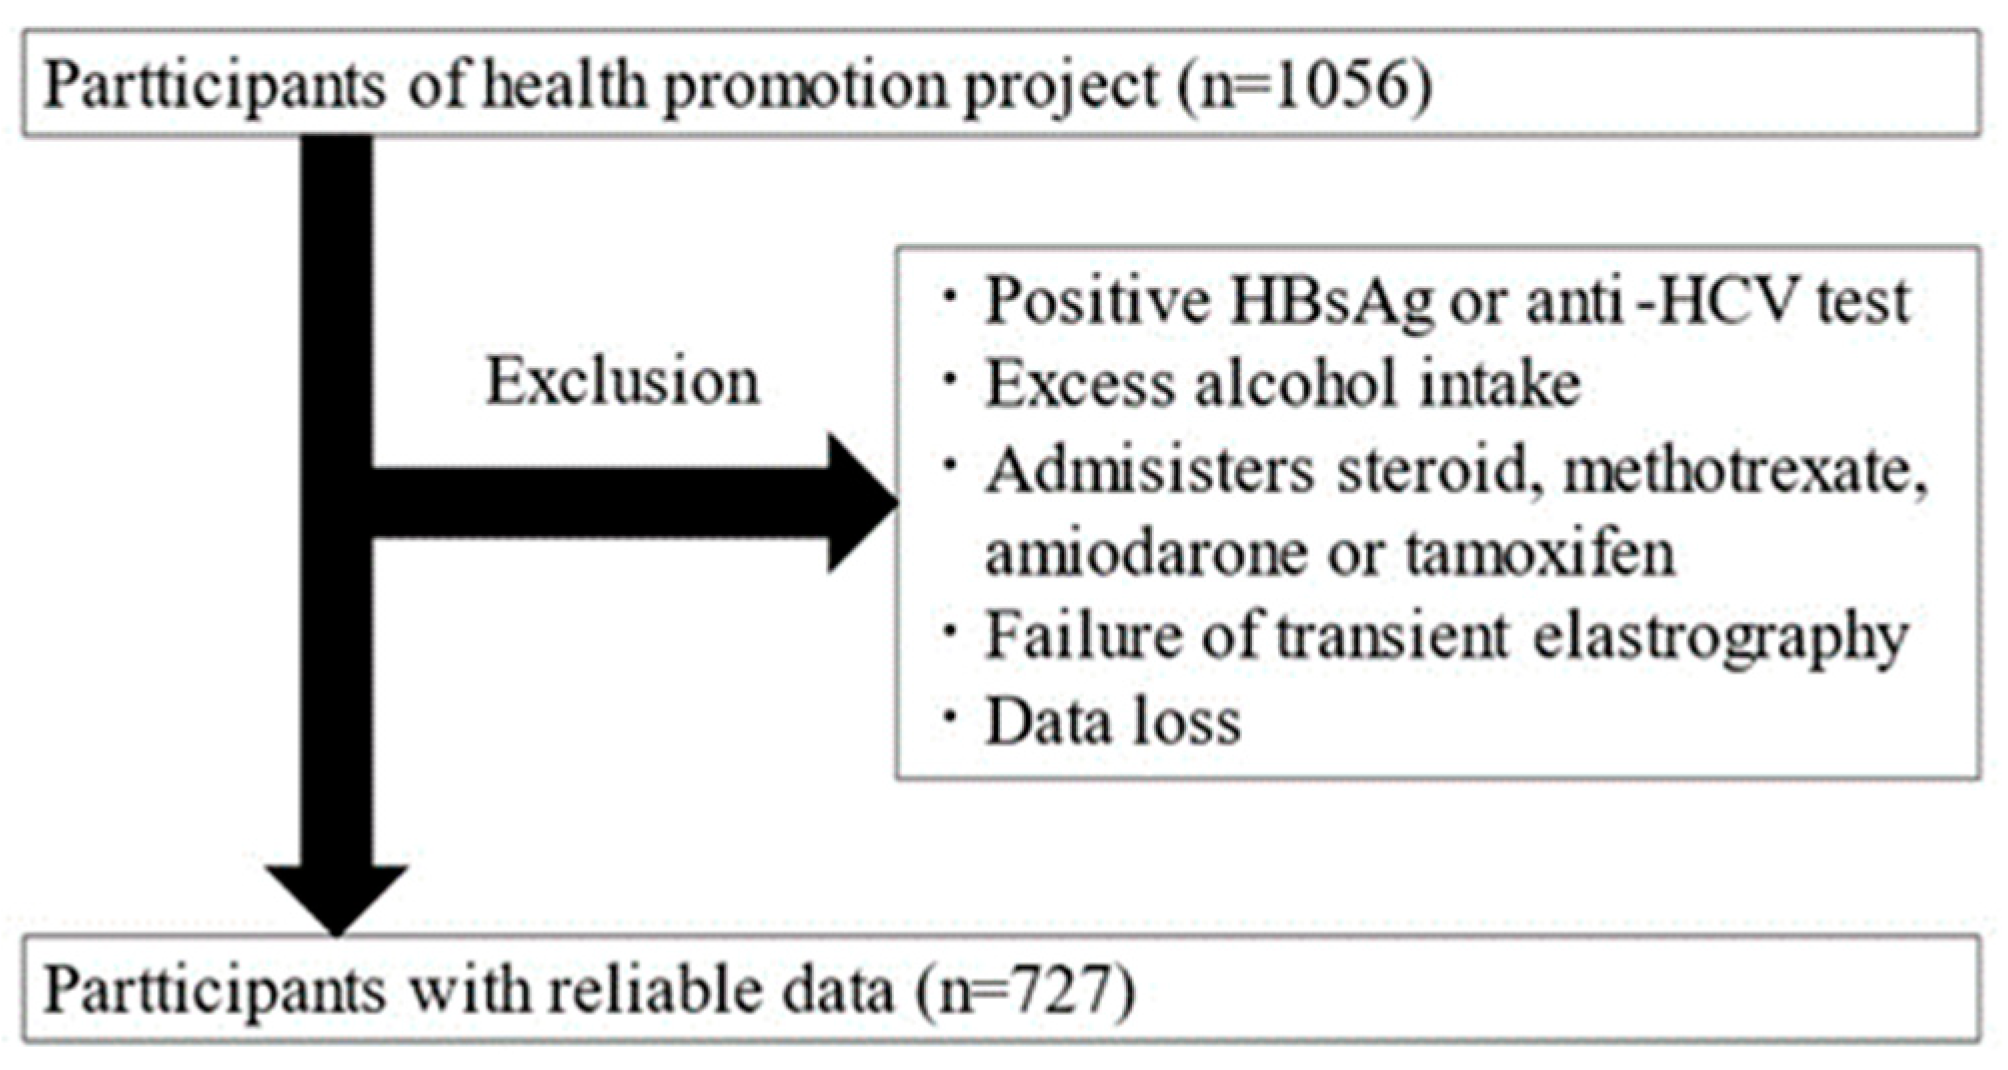
This is a cross-sectional study targeting adults aged 20 and over who participated in the Iwaki Health Promotion Project. The data were collected over a 10-day period from 26 May to 4 June 2018. The Iwaki Health Promotion Project is a community-based health promotion initiative targeting residents of the Iwaki area in Hirosaki City, Aomori Prefecture, and is conducted as an annual health checkup every June [11]. All patients participated voluntarily in response to public recruitment. A total of 1056 adults (aged 20–88 years) participated in this study. After exclusion, 329 participants were excluded, and 727 were included in the analysis (Figure 1).
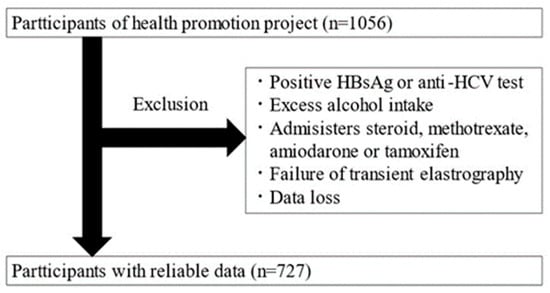
Figure 1.
Study enrollment flowchart.
Individuals with the following factors affecting the diagnosis of hepatic steatosis were excluded: patients positive for HBs antigen or HCV antibodies, habitual drinkers (≥30 g/day for men and ≥20 g/day for women), patients taking medications known to cause hepatic steatosis (steroids, methotrexate, amiodarone, and tamoxifen), patients with fewer than 10 Fibroscan measurements, and patients with an interquartile range/median ratio exceeding 0.30, as these were considered unreliable [12].
2.2. Transient Elastography
Liver stiffness measurements (LSM) and controlled attenuation parameters (CAP) were performed using FibroScan 530 (Echosens, Paris, France). Both M and XL probes were used, and examinations were conducted by five liver specialists who had received specialized training. LMS and CAP were measured at least 10 times, and the medians were calculated. The relationship between histological liver fat content and CAP values corresponds to 248–267 dB/m for S1, 268~279 dB/m for S2, and 280 dB/m or higher for S3, and a CAP value of ≥248 dB/m was defined as hepatic steatosis [13]. As for liver fibrosis, the LSMs corresponding to histological fibrosis, F0, F1, F2, F3, and F4, are 5.7 kPa, 6.8 kPa, 7.8 kPa, 11.8 kPa, and 25.1 kPa [14]. In other studies, less than 5 kPa of LSM is defined as normal, and in this study, we used an LSM of ≥5 kPa as the cutoff value for liver fibrosis [15].
2.3. Clinical Parameters
The following parameters were measured: age, sex, height, weight, body mass index (BMI), aspartate aminotransferase (AST), alanine aminotransferase (ALT), gamma-glutamyl transpeptidase (γGT), fasting blood glucose, hemoglobin A1c (HbA1c), insulin, triglycerides, HDL cholesterol, LDL cholesterol, and smoking and alcohol consumption habits. The Homeostasis Model Assessment of Insulin Resistance (HOMA-IR) was calculated using the following formula: fasting blood glucose (mg/dL) × fasting insulin (μU/mL)/405 [16].
2.4. Dietary Pattern Analysis
Energy and nutrient intake were calculated based on the results of the Brief-type Self-administered Diet History Questionnaire (BDHQ), which is a questionnaire developed for large-scale nutritional epidemiological studies. It consists of 80 questions that estimate the intake of 58 food items and over 100 nutrients [17]. It was designed to obtain information on individual nutrient intake, food consumption, and dietary behavior indicators. The BDHQ was sent to the participants in advance and detailed interviews were conducted on the day of the health examination to collect and verify the responses.
To evaluate the Japanese dietary patterns, we conducted principal component analysis (PCA) with fixed lower bounds of 2 and varimax rotation on the 52 food items surveyed via the BDHQ, based on previous reports [18,19]. Participants were then classified into dietary patterns extracted via PCA using nonhierarchical cluster analysis (k-means method). The effects of these dietary patterns on MAFLD and liver fibrosis were compared. For dietary patterns strongly associated with liver fibrosis, we evaluated food items and their components in relation to liver fibrosis.
For the purposes of the univariate and multivariate analysis, MAFLD and liver fibrosis were used as outcome variables, and factors influencing them, which included age ≥ 65 years [20], sex, BMI ≥ 25 [21], smoking [22], exercise habits [23], HOMA-IR > 1.6 [24], HDL cholesterol < 40 [2,25], LDL cholesterol ≥ 140 [2,25], triglycerides ≥ 150 [2,25], and dietary patterns, were used as explanatory variables. For liver fibrosis, an analysis was conducted using specific foods and predominant components in certain dietary patterns as explanatory variables.
2.5. Diagnosis of MASLD
Among individuals with hepatic steatosis, participants who met any of the following criteria were diagnosed with MASLD [2]: BMI ≥ 23 kg/m2 or waist circumference ≥ 94 cm for men and ≥80 cm for women; fasting blood glucose ≥ 100 mg/dL, postprandial blood glucose ≥ 140 mg/dL, HbA1c ≥ 5.7%, or currently undergoing treatment for type 2 diabetes; blood pressure ≥ 130/85 mmHg or currently undergoing antihypertensive treatment; triglycerides ≥ 150 mg/dL or currently undergoing treatment for dyslipidemia; and HDL cholesterol ≤ 40 mg/dL for men and ≤50 mg/dL for women.
2.6. Statistical Analysis
Statistical analyses of clinical data were performed using the Statistical Package for the Social Sciences version 28.0 (SPSS Inc., Chicago, IL, USA) and EZR [26]. Continuous variables were presented as medians and interquartile ranges. The Mann–Whitney U test was used for comparisons between the two groups. Comparisons among the three groups were conducted using the Kruskal–Wallis test and Steel–Dwass multiple comparisons. The relationship between dietary patterns and MASLD incidence was analyzed using univariate analysis. Multivariate analysis was conducted to analyze the dietary patterns, food items, and nutrients related to liver fibrosis in the MASLD population.
The selection of explanatory variables for the multivariate analysis was based on factors that showed significant differences in the univariate analysis for dietary pattern analysis, and factors that were significant in the multivariate analysis of dietary patterns for the analysis of food items and nutrients. Among the explanatory variables in the univariate and multivariate analyses, the Asian standard BMI and HOMA-IR values of 25 kg/m2 and 1.6, respectively, were used [21,24]. Statistical significance was set at p < 0.05.
3. Results
3.1. Participant Characteristics
The PCA with varimax rotation extracted four components (Table 1). The cluster analysis was conducted using four factors obtained through PCA, resulting in four groups. The food intake of each group was compared, and each group was named based on the food items that were consumed in significantly larger quantities compared to other groups. The characteristics of the four dietary patterns are presented in Table 2. The first group was named the rice group because it was characterized by a high intake of rice. The second group was named the vegetables group because it was characterized by a high intake of vegetables and mushrooms. The third group was named the seafoods group because it was characterized by a high intake of fish and shellfish. The fourth group was named the sweets group because it was characterized by a high intake of western-style sweets and ice cream. The rice group, which had the largest number of participants and did not exhibit distinct tendencies, had a higher proportion of males, higher age, BMI, CAP value, AST, ALT, γGT, serum glucose, HbA1c, and triglycerides, and lower HDL compared to the vegetable group. However, there were no significant differences to the same extent as observed in the vegetable group between the rice group and the seafood and sweet groups.

Table 1.
Factor loading matrix for dietary patterns identified via the principal component analysis.
Table 2.
Participants’ characteristics among the dietary patterns.
3.2. Participant Characteristics among the Dietary Patterns in Patients with MASLD
In total, 220 participants met the diagnostic criteria for MASLD. There were no significant differences in the proportion of patients with MASLD among the different dietary patterns (Table 3). Evaluating the characteristics of the MASLD group associated with liver fibrosis across the dietary patterns, the vegetable group had significantly lower AST, ALT, and triglyceride levels than the rice group.
Table 3.
Participants’ characteristics among the dietary patterns for sample with MASLD.
In the univariate analysis of risk factors with MASLD as the outcome, age ≥ 65 years, male sex, BMI ≥ 25 kg/m2, smoking habits, HOMA-IR ≥ 1.6, HDL cholesterol < 40 mg/dL, LDL cholesterol ≥ 140 mg/dL, and triglycerides ≥ 150 mg/dL were significant risk factors for MASLD (Table 4). However, the dietary pattern was not identified as a significant risk factor for MASLD.
Table 4.
Univariable analysis of risk factors for MASLD.
3.3. Risk Factors for Liver Fibrosis in Patients with MASLD
In the MASLD group, 94 patients (42.7%) had liver fibrosis. The univariate analysis identified BMI ≥ 25 kg/m2 and HOMA-IR ≥ 1.6 as risk factors for liver fibrosis among patients with MASLD (Table 5). In addition, compared with the rice group, the vegetable group was a low-risk factor for liver fibrosis. In the multivariate analysis, BMI ≥ 25 and HOMA-IR ≥ 1.6 were risk factors for fibrosis, while the vegetable group was a significant low-risk factor.
Table 5.
Univariable and multivariate analysis of risk factors for liver fibrosis in sample with MASLD.
Investigating the food items and nutrients predominantly consumed by the vegetable group that are associated with reduced liver fibrosis, the multivariate analysis, which adjusted for the fibrosis risk factors BMI ≥ 25 and HOMA-IR ≥ 1.6, identified high intake of carrots, pumpkins, radishes, and turnips as significant food items associated with reduced liver fibrosis (Table 6). Further analysis of the nutrients contained in these low-risk food items revealed that high intake of α-tocopherol was a significant low-risk factor for liver fibrosis (Table 7).
Table 6.
Multivariate analysis of risk factors of food items for liver fibrosis.
Table 7.
Multivariate analysis of risk factors of the nutrients for liver fibrosis.
4. Discussion
This study revealed that a vegetable-based Japanese dietary pattern was associated with a significantly lower rate of liver fibrosis in patients with MASLD. In addition, it was suggested that a high intake of α-tocopherol, which is found in carrots and pumpkins, is related to the reduction in liver fibrosis rates in the MASLD population.
In this study, we found that the vegetable group had significantly lower liver fibrosis in the MASLD population. The vegetable group of this study represented the dietary pattern of a traditional Japanese diet. The Japanese diet is similar to the Mediterranean diet, rich in vegetables, soybeans, and mushrooms, and is beneficial to the body in the prevention of various diseases such as liver disease and dementia [27,28,29,30,31,32]. Vegetables are rich in dietary fiber, which is converted to butyrate by gut microbiota and believed to inhibit the onset and progression of MASLD via improvement of insulin resistance and lipid abnormalities and anti-inflammatory effects [33,34].
In this study, the vegetable diet group had lower AST, ALT, and triglyceride levels than the other dietary pattern groups in patients with MASLD, which is thought to reflect the hepatoprotective and lipid metabolism-improving effects of the Japanese diet. Previous studies have reported that the Japanese diet reduces the risk of advanced liver fibrosis in patients with MASLD, with the mechanism attributed to muscle and skeletal maintenance through soy consumption [10]. Soy contains isoflavones, which are metabolized by the gut microbiota into equol, a compound with estrogen-like effects that protects against fatty liver [35]. In our study, the vegetable group had a high intake of soy and soy products, suggesting that the high intake of dietary fiber and soy in the vegetable group helped suppress the progression of liver fibrosis in patients with MASLD.
In the analysis of specific food items predominantly consumed by the vegetable group, it was suggested that the intake of α-tocopherol might have been effective in inhibiting liver fibrosis in patients with MASLD. α-tocopherol is a biologically active form of vitamin E with antioxidant properties [36]. The multi-parallel hit hypothesis proposes that not only liver tissue but also other organs, such as the liver, adipose tissue, and intestines, interactively contribute to the onset of MASLD [37]. Oxidative stress, which is known to cause steatohepatitis and liver fibrosis, also plays an important role and is considered a significant pathophysiological factor in MASLD [38,39,40]. Therefore, α-tocopherol, with its antioxidant properties, has been reported to be effective in preventing the onset and progression of NAFLD/NASH [41,42]. Vitamin E has been shown to improve the clinical outcomes in patients with NASH based on real-world practice [43]. Abundant sources of α-tocopherol include nuts, oils, fish, carrots, and pumpkins. This study suggests that the consumption of carrots and pumpkins may inhibit liver fibrosis in patients with MASLD through the antioxidant effects of α-tocopherol.
This study found an association between liver fibrosis and dietary patterns in a population with MASLD, whereas no significant relationship was observed between MASLD incidence and Japanese dietary patterns. Fibrosis involves progression to MASH with accompanying inflammation, which represents the advancement of some cases of MASLD. Factors contributing to MASLD include undernutrition, overnutrition, obesity, glucose metabolism disorders, lipid metabolism disorders, sex, age, oral and gut microbiota, single-nucleotide polymorphisms, and sex hormones, among many other complex interacting factors [41,44,45,46,47]. In this study, differences in age, sex, smoking habits, and exercise habits were observed among the dietary patterns. Therefore, the lack of a significant association between MASLD incidence and dietary patterns may be due to the inability to adjust for other confounding factors aside from the diet of the patients in this study, which was primarily conducted as a health screening project for the general healthy population. The association with dietary patterns was revealed after adjusting for confounding factors and focusing on the analysis of the patients with MASLD. In addition, the study population included a few individuals with a high intake of meat, thus lacking patients with Western dietary patterns. Therefore, since a comparison with meat-based Western diets was not possible, the rice group, which had the largest number of participants among the four dietary patterns, was used as the basis for comparison with other dietary patterns. This study compared other dietary patterns based on the rice group rather than meat-based dietary pattern, which may have contributed to the lack of association between the proportion of MASLD patients and Japanese dietary patterns.
This study has several limitations. First, participants were classified into four groups based on a cluster analysis of food intake, with each group named according to the food items consumed in significantly larger quantities. Consequently, specific cut-off values for dietary intake were not applied. While the observed trends in food consumption offer valuable insights, these findings may not be fully generalizable. Second, the diagnosis of hepatic steatosis was not confirmed using liver biopsy, which is the gold standard for diagnosing hepatic steatosis and fibrosis. However, a liver biopsy is invasive and difficult to perform in the general population. Therefore, we used FibroScan, which is less invasive than liver biopsy. Third, the proportion of patients with fibrosis in the MASLD group was high. Generally, the proportion of MASH with fibrosis within MASLD is 10–20% of the population [48]. The higher proportion of fibrosis (approximately 40%) in this study was attributed to the lower threshold settings for diagnosing fibrosis using LSM. However, when considering the presence of mild fibrosis, this proportion is reasonable. Further studies should be made to address these limitations.
5. Conclusions
MASLD is increasing world-wide, and liver fibrosis leads to cirrhosis and hepatocellular carcinoma. This study has demonstrated that a vegetable-based dietary pattern is associated with a lower rate of liver fibrosis in patients with MASLD, which is potentially due to the intake of foods rich in α-tocopherol which has antioxidant properties. These findings suggest that a vegetable-based Japanese diet pattern may improve prognosis by reducing liver fibrosis in MASLD patients.
Author Contributions
Data curation, T.S. and C.I.; Formal analysis, T.S. and S.S.; Investigation, T.S., C.I., S.S., T.T., G.I. and K.Y.; Visualization, T.S. and S.S.; Writing—original draft, T.S. and S.S.; Conceptualization, C.I. and S.S.; Methodology, C.I. and S.S.; Project administration, C.I., K.S., T.M. and S.N.; Supervision, C.I., T.M., S.N., H.S. and S.F.; Writing—review and editing, C.I., K.S., T.M., S.N., H.S. and S.F.; Resources, K.S., T.M. and S.N. All authors have read and agreed to the published version of the manuscript.
Funding
This work was supported by JST COI, numbers JPMJCE1302, PPMJCA2201, and JPMJP2210.
Institutional Review Board Statement
This study was conducted in accordance with the ethical standards of the Declaration of Helsinki and was approved by the Ethics Committee of Hirosaki University School of Medicine (approval number and date: 2018-012, approved on 11 May 2018).
Informed Consent Statement
Informed consent was obtained from all of the participants.
Data Availability Statement
The original contributions presented in this study are included in the article. Further inquiries can be directed to the corresponding author.
Acknowledgments
We gratefully acknowledge the work of the past and present members of our laboratory.
Conflicts of Interest
The authors declare that they have no known competing financial interests or personal relationships that could have appeared to influence the work reported in this paper.
References
- Riazi, K.; Azhari, H.; Charette, J.H.; Underwood, F.E.; King, J.A.; Afshar, E.E.; Swain, M.G.; Congly, S.E.; Kaplan, G.G.; Shaheen, A.-A. The prevalence and incidence of NAFLD worldwide: A systematic review and meta-analysis. Lancet Gastroenterol. Hepatol. 2022, 7, 851–861. [Google Scholar] [CrossRef]
- Rinella, M.E.; Lazarus, J.V.; Ratziu, V.; Francque, S.M.; Sanyal, A.J.; Kanwal, F.; Romero, D.; Abdelmalek, M.F.; Anstee, Q.M.; Arab, J.P.; et al. A multisociety Delphi consensus statement on new fatty liver disease nomenclature. Hepatology 2023, 78, 1966–1986. [Google Scholar] [CrossRef] [PubMed]
- Kontogianni, M.D.; Tileli, N.; Margariti, A.; Georgoulis, M.; Deutsch, M.; Tiniakos, D.; Fragopoulou, E.; Zafiropoulou, R.; Manios, Y.; Papatheodoridis, G. Adherence to the Mediterranean diet is associated with the severity of non-alcoholic fatty liver disease. Clin. Nutr. 2014, 33, 678–683. [Google Scholar] [CrossRef]
- Gelli, C.; Tarocchi, M.; Abenavoli, L.; Di Renzo, L.; Galli, A.; De Lorenzo, A. Effect of a counseling-supported treatment with the Mediterranean diet and physical activity on the severity of the non-alcoholic fatty liver disease. World J. Gastroenterol. 2017, 23, 3150–3162. [Google Scholar] [CrossRef]
- Trichopoulou, A.; Martínez-González, M.A.; Tong, T.Y.; Forouhi, N.G.; Khandelwal, S.; Prabhakaran, D.; Mozaffarian, D.; de Lorgeril, M. Definitions and potential health benefits of the Mediterranean diet: Views from experts around the world. BMC Med. 2014, 12, 112. [Google Scholar] [CrossRef] [PubMed]
- Martínez-González, M.A.; Salas-Salvadó, J.; Estruch, R.; Corella, D.; Fitó, M.; Ros, E. Benefits of the Mediterranean Diet: Insights From the PREDIMED Study. Prog. Cardiovasc. Dis. 2015, 58, 50–60. [Google Scholar] [CrossRef]
- Ryan, M.C.; Itsiopoulos, C.; Thodis, T.; Ward, G.; Trost, N.; Hofferberth, S.; O’dea, K.; Desmond, P.V.; Johnson, N.A.; Wilson, A.M. The Mediterranean diet improves hepatic steatosis and insulin sensitivity in individuals with non-alcoholic fatty liver disease. J. Hepatol. 2013, 59, 138–143. [Google Scholar] [CrossRef] [PubMed]
- Hidalgo-Mora, J.J.; García-Vigara, A.; Sánchez-Sánchez, M.L.; García-Pérez, M.; Tarín, J.; Cano, A. The Mediterranean diet: A historical perspective on food for health. Maturitas 2020, 132, 65–69. [Google Scholar] [CrossRef]
- Ogce, F.; Ceber, E.; Ekti, R.; Oran, N.T. Comparison of mediterranean, Western and Japanese diets and some recommendations. Asian Pac. J. Cancer Prev. 2008, 9, 351–356. [Google Scholar] [PubMed]
- Matsumoto, Y.; Fujii, H.; Harima, M.; Okamura, H.; Yukawa-Muto, Y.; Odagiri, N.; Motoyama, H.; Kotani, K.; Kozuka, R.; Kawamura, E.; et al. Severity of Liver Fibrosis Is Associated with the Japanese Diet Pattern and Skeletal Muscle Mass in Patients with Nonalcoholic Fatty Liver Disease. Nutrients 2023, 15, 1175. [Google Scholar] [CrossRef]
- Nakaji, S.; Ihara, K.; Sawada, K.; Parodi, S.; Umeda, T.; Takahashi, I.; Murashita, K.; Kurauchi, S.; Tokuda, I. Social innovation for life expectancy extension utilizing a platform-centered system used in the Iwaki health promotion project: A protocol paper. SAGE Open Med. 2021, 9, 20503121211002606. [Google Scholar] [CrossRef] [PubMed]
- Boursier, J.; Zarski, J.P.; de Ledinghen, V.; Rousselet, M.C.; Sturm, N.; Lebail, B.; Fouchard-Hubert, I.; Gallois, Y.; Oberti, F.; Bertrais, S.; et al. Determination of reliability criteria for liver stiffness evaluation by transient elastography. Hepatology 2013, 57, 1182–1191. [Google Scholar] [CrossRef] [PubMed]
- Karlas, T.; Petroff, D.; Sasso, M.; Fan, J.G.; Mi, Y.Q.; de Lédinghen, V.; Kumar, M.; Lupsor-Platon, M.; Han, K.H.; Cardoso, A.C.; et al. Individual patient data meta-analysis of controlled attenuation parameter (CAP) technology for assessing steatosis. J. Hepatol. 2017, 66, 1022–1030. [Google Scholar] [CrossRef]
- Wong, V.W.; Vergniol, J.; Wong, G.L.; Foucher, J.; Chan, H.L.; Le Bail, B.; Choi, P.C.; Kowo, M.; Chan, A.W.; Merrouche, W.; et al. Diagnosis of fibrosis and cirrhosis using liver stiffness measurement in nonalcoholic fatty liver disease. Hepatology 2010, 51, 454–462. [Google Scholar] [CrossRef]
- Barr, R.G.; Wilson, S.R.; Rubens, D.; Garcia-Tsao, G.; Ferraioli, G. Update to the Society of Radiologists in Ultrasound Liver Elastography Consensus Statement. Radiology 2020, 296, 263–274. [Google Scholar] [CrossRef]
- Matthews, D.R.; Hosker, J.P.; Rudenski, A.S.; Naylor, B.A.; Treacher, D.F.; Turner, R.C. Homeostasis model assessment: Insulin resistance and beta-cell function from fasting plasma glucose and insulin concentrations in man. Diabetologia 1985, 28, 412–419. [Google Scholar] [CrossRef] [PubMed]
- Sasaki, S.; Yanagibori, R.; Amano, K. Self-administered diet history questionnaire developed for health education: A relative validation of the test-version by comparison with 3-day diet record in women. J. Epidemiol. 1998, 8, 203–215. [Google Scholar] [CrossRef]
- Tanisawa, K.; Ito, T.; Kawakami, R.; Usui, C.; Kawamura, T.; Suzuki, K.; Sakamoto, S.; Ishii, K.; Muraoka, I.; Oka, K.; et al. Association Between Dietary Patterns and Different Metabolic Phenotypes in Japanese Adults: WASEDA’S Health Study. Front. Nutr. 2022, 9, 779967. [Google Scholar] [CrossRef]
- Ito, T.; Kawakami, R.; Tanisawa, K.; Miyawaki, R.; Ishii, K.; Torii, S.; Suzuki, K.; Sakamoto, S.; Muraoka, I.; Oka, K.; et al. Dietary patterns and abdominal obesity in middle-aged and elderly Japanese adults: Waseda Alumni’s Sports, Exercise, Daily Activity, Sedentariness and Health Study (WASEDA’s Health Study). Nutrition 2019, 58, 149–155. [Google Scholar] [CrossRef]
- Milena, G.; Charilaos, X.; Natalia, K. Old age as a risk factor for liver diseases: Modern therapeutic appriaches. Exp. Gerontol. 2023, 184, 112334. [Google Scholar] [CrossRef]
- Matsuzawa, Y.; Nakamura, T.; Takahashi, M.; Miwa, R.; Inoue, S.; Ikeda, Y.; Ohno, M.; Sakata, T.; Fukagawa, K.; Saitoh, Y.; et al. The Examination Committee of Criteria for ‘Obesity Disease’ in Japan, Japan Society for the Study of Obesity. Circ. J. 2002, 66, 987–992. [Google Scholar] [CrossRef]
- Fotakis, C.; Amanatidou, A.; Kafyra, M.; Andreou, V.; Kalafati, I.P.; Zervou, M.; Dedoussis, G.V. Ciculatory Metabolite Ratios as Indicators of Lifestyle Risk Factors Based on a Greek NAFLD Case-Control Study. Nutrients 2024, 16, 1235. [Google Scholar] [CrossRef]
- Mascaro, M.C.; Bouzas, C.; Montemayor, S.; Casares, M.; Llompart, I.; Ugarriza, L.; Borràs, P.-A.; Martínez, J.A.; Tur, J.A. Effect of a Six-Month Lifestyle Intervention on the Physical Activity and Fitness Status of Adults with NAFLD and Metabolic Syndrome. Nutrients 2022, 14, 1813. [Google Scholar] [CrossRef]
- Beak, J.H.; Kim, H.; Kim, K.Y.; Jung, J. Insulin Resistance and the Risk of Diabetes and Dysglycemia in Korean General Adult Population. Diabetes Metab. Journak 2018, 42, 296–307. [Google Scholar] [CrossRef] [PubMed]
- Okamura, T.; Tsukamoto, K.; Arai, H.; Fujioka, Y.; Ishigaki, Y.; Koba, S.; Ohmura, H.; Shoji, T.; Yokote, K.; Yoshida, H.; et al. Japan Atherosclerosis Society(JAS) Guidelines for Prevention of Atherosclerotic Cardiovascular Disease 2022. J. Atheroscler. Thromb. 2024, 31, 641–853. [Google Scholar] [CrossRef] [PubMed]
- Kanda, Y. Investigation of the freely available easy-to-use software ‘EZR’ for medical statistics. Bone Marrow Transplant. 2013, 48, 452–458. [Google Scholar] [CrossRef] [PubMed]
- Perler, B.K.; Friedman, E.S.; Wu, G.D. The Role of the Gut Microbiota in the Relationship Between Diet and Human Health. Annu. Rev. Physiol. 2023, 85, 449–468. [Google Scholar] [CrossRef]
- Suzuki, N.; Goto, Y.; Ota, H.; Kito, K.; Mano, F.; Joo, E.; Ikeda, K.; Inagaki, N.; Nakayama, T. Characteristics of the Japanese Diet Described in Epidemiologic Publications: A Qualitative Systematic Review. J. Nutr. Sci. Vitaminol. 2018, 64, 129–137. [Google Scholar] [CrossRef]
- Tomata, Y.; Watanabe, T.; Sugawara, Y.; Chou, W.T.; Kakizaki, M.; Tsuji, I. Dietary patterns and incident functional disability in elderly Japanese: The Ohsaki Cohort 2006 study. J. Gerontol. A Biol. Sci. Med. Sci. 2014, 69, 843–851. [Google Scholar] [CrossRef]
- Saji, N.; Tsuduki, T.; Murotani, K.; Hisada, T.; Sugimoto, T.; Kimura, A.; Niida, S.; Toba, K.; Sakurai, T. Relationship between the Japanese-style diet, gut microbiota, and dementia: A cross-sectional study. Nutrition 2022, 94, 111524. [Google Scholar] [CrossRef]
- Romero-Gómez, M.; Zelber-Sagi, S.; Trenell, M. Treatment of NAFLD with diet, physical activity and exercise. J. Hepatol. 2017, 67, 829–846. [Google Scholar] [CrossRef] [PubMed]
- Nakamoto, M.; Otsuka, R.; Nishita, Y.; Tange, C.; Tomida, M.; Kato, Y.; Imai, T.; Sakai, T.; Ando, F.; Shimokata, H. Soy food and isoflavone intake reduces the risk of cognitive impairment in elderly Japanese women. Eur. J. Clin. Nutr. 2018, 72, 1458–1462. [Google Scholar] [CrossRef]
- Kimura, I.; Ozawa, K.; Inoue, D.; Imamura, T.; Kimura, K.; Maeda, T.; Terasawa, K.; Kashihara, D.; Hirano, K.; Tani, T.; et al. The gut microbiota suppresses insulin-mediated fat accumulation via the short-chain fatty acid receptor GPR43. Nat. Commun. 2013, 4, 1829. [Google Scholar] [CrossRef] [PubMed]
- Furusawa, Y.; Obata, Y.; Fukuda, S.; Endo, T.A.; Nakato, G.; Takahashi, D.; Nakanishi, Y.; Uetake, C.; Kato, K.; Kato, T.; et al. Commensal microbe-derived butyrate induces the differentiation of colonic regulatory T cells. Nature 2013, 504, 446–450. [Google Scholar] [CrossRef] [PubMed]
- Takahashi, A.; Takahata, Y.; Kokubun, M.; Anzai, Y.; Kogure, A.; Ogata, T.; Abe, N.; Sugaya, T.; Fujita, M.; Imaizumi, H.; et al. Association between equol and non-alcoholic fatty liver disease in Japanese women in their 50s and 60s. J. Gastroenterol. Hepatol. 2023, 38, 1958–1962. [Google Scholar] [CrossRef]
- Engin, K.N. Alpha-tocopherol: Looking beyond an antioxidant. Mol. Vis. 2009, 15, 855–860. [Google Scholar] [PubMed] [PubMed Central]
- Parthasarathy, G.; Revelo, X.; Malhi, H. Pathogenesis of Nonalcoholic Steatohepatitis: An Overview. Hepatol. Commun. 2020, 4, 478–492. [Google Scholar] [CrossRef]
- Friedman, S.L.; Neuschwander-Tetri, B.A.; Rinella, M.; Sanyal, A.J. Mechanisms of NAFLD development and therapeutic strategies. Nat. Med. 2018, 24, 908–922. [Google Scholar] [CrossRef]
- Masarone, M.; Rosato, V.; Dallio, M.; Gravina, A.G.; Aglitti, A.; Loguercio, C.; Federico, A.; Persico, M. Role of Oxidative Stress in Pathophysiology of Nonalcoholic Fatty Liver Disease. Oxid. Med. Cell. Longev. 2018, 2018, 9547613. [Google Scholar] [CrossRef]
- Nagashimada, M.; Ota, T. Role of vitamin E in nonalcoholic fatty liver disease. IUBMB Life 2019, 71, 516–522. [Google Scholar] [CrossRef]
- Vogli, S.; Naska, A.; Marinos, G.; Kasdagli, M.I.; Orfanos, P. The Effect of Vitamin E Supplementation on Serum Aminotransferases in Non-Alcoholic Fatty Liver Disease (NAFLD): A Systematic Review and Meta-Analysis. Nutrients 2023, 15, 3733. [Google Scholar] [CrossRef] [PubMed]
- Erhardt, A.; Stahl, W.; Sies, H.; Lirussi, F.; Donner, A.; Häussinger, D. Plasma levels of vitamin E and carotenoids are decreased in patients with Nonalcoholic Steatohepatitis (NASH). Eur. J. Med. Res. 2011, 16, 76–78. [Google Scholar] [CrossRef]
- Sanyal, A.J.; Chalasani, N.; Kowdley, K.V.; McCullough, A.; Diehl, A.M.; Bass, N.M.; Neuschwander-Tetri, B.A.; Lavine, J.E.; Tonascia, J.; Unalp, A.; et al. Pioglitazone, vitamin E, or placebo for nonalcoholic steatohepatitis. N. Engl. J. Med. 2010, 362, 1675–1685. [Google Scholar] [CrossRef] [PubMed]
- Dongiovanni, P.; Valenti, L. Genetics of nonalcoholic fatty liver disease. Metabolism 2016, 65, 1026–1037. [Google Scholar] [CrossRef] [PubMed]
- Long, C.; Zhou, X.; Xia, F.; Zhou, B. Intestinal Barrier Dysfunction and Gut Microbiota in Non-Alcoholic Fatty Liver Disease: Assessment, Mechanisms, and Therapeutic Considerations. Biology 2024, 13, 243. [Google Scholar] [CrossRef] [PubMed]
- Lei, Y.; Li, S.; He, M.; Ao, Z.; Wang, J.; Wu, Q.; Wang, Q. Oral Pathogenic Bacteria and the Oral-Gut-Liver Axis: A New Understanding of Chronic Liver Diseases. Diagnostics 2023, 13, 3324. [Google Scholar] [CrossRef]
- Wong, V.W.; Chan, W.K.; Chitturi, S.; Chawla, Y.; Dan, Y.Y.; Duseja, A.; Fan, J.; Goh, K.-L.; Hamaguchi, M.; Hashimoto, E.; et al. Asia-Pacific Working Party on Non-alcoholic Fatty Liver Disease guidelines 2017-Part 1: Definition, risk factors and assessment. J. Gastroenterol. Hepatol. 2018, 33, 70–85. [Google Scholar] [CrossRef]
- Eguchi, Y.; Hyogo, H.; Ono, M.; Mizuta, T.; Ono, N.; Fujimoto, K.; Chayama, K.; Saibara, T. Prevalence and associated metabolic factors of nonalcoholic fatty liver disease in the general populations from 2009 to 2010 in Japan: A multicenter large retrospective study. J. Gastroenterol. 2012, 47, 586–595. [Google Scholar] [CrossRef]
Disclaimer/Publisher’s Note: The statements, opinions and data contained in all publications are solely those of the individual author(s) and contributor(s) and not of MDPI and/or the editor(s). MDPI and/or the editor(s) disclaim responsibility for any injury to people or property resulting from any ideas, methods, instructions or products referred to in the content. |
© 2024 by the authors. Licensee MDPI, Basel, Switzerland. This article is an open access article distributed under the terms and conditions of the Creative Commons Attribution (CC BY) license (https://creativecommons.org/licenses/by/4.0/).