
Mediterranean Diet and Ultra-Processed Food Intake in Older Australian Adults—Associations with Frailty and Cardiometabolic Conditions
 , , , , , , , , , ,
  and
and
Abstract
1. Introduction
2. Methods
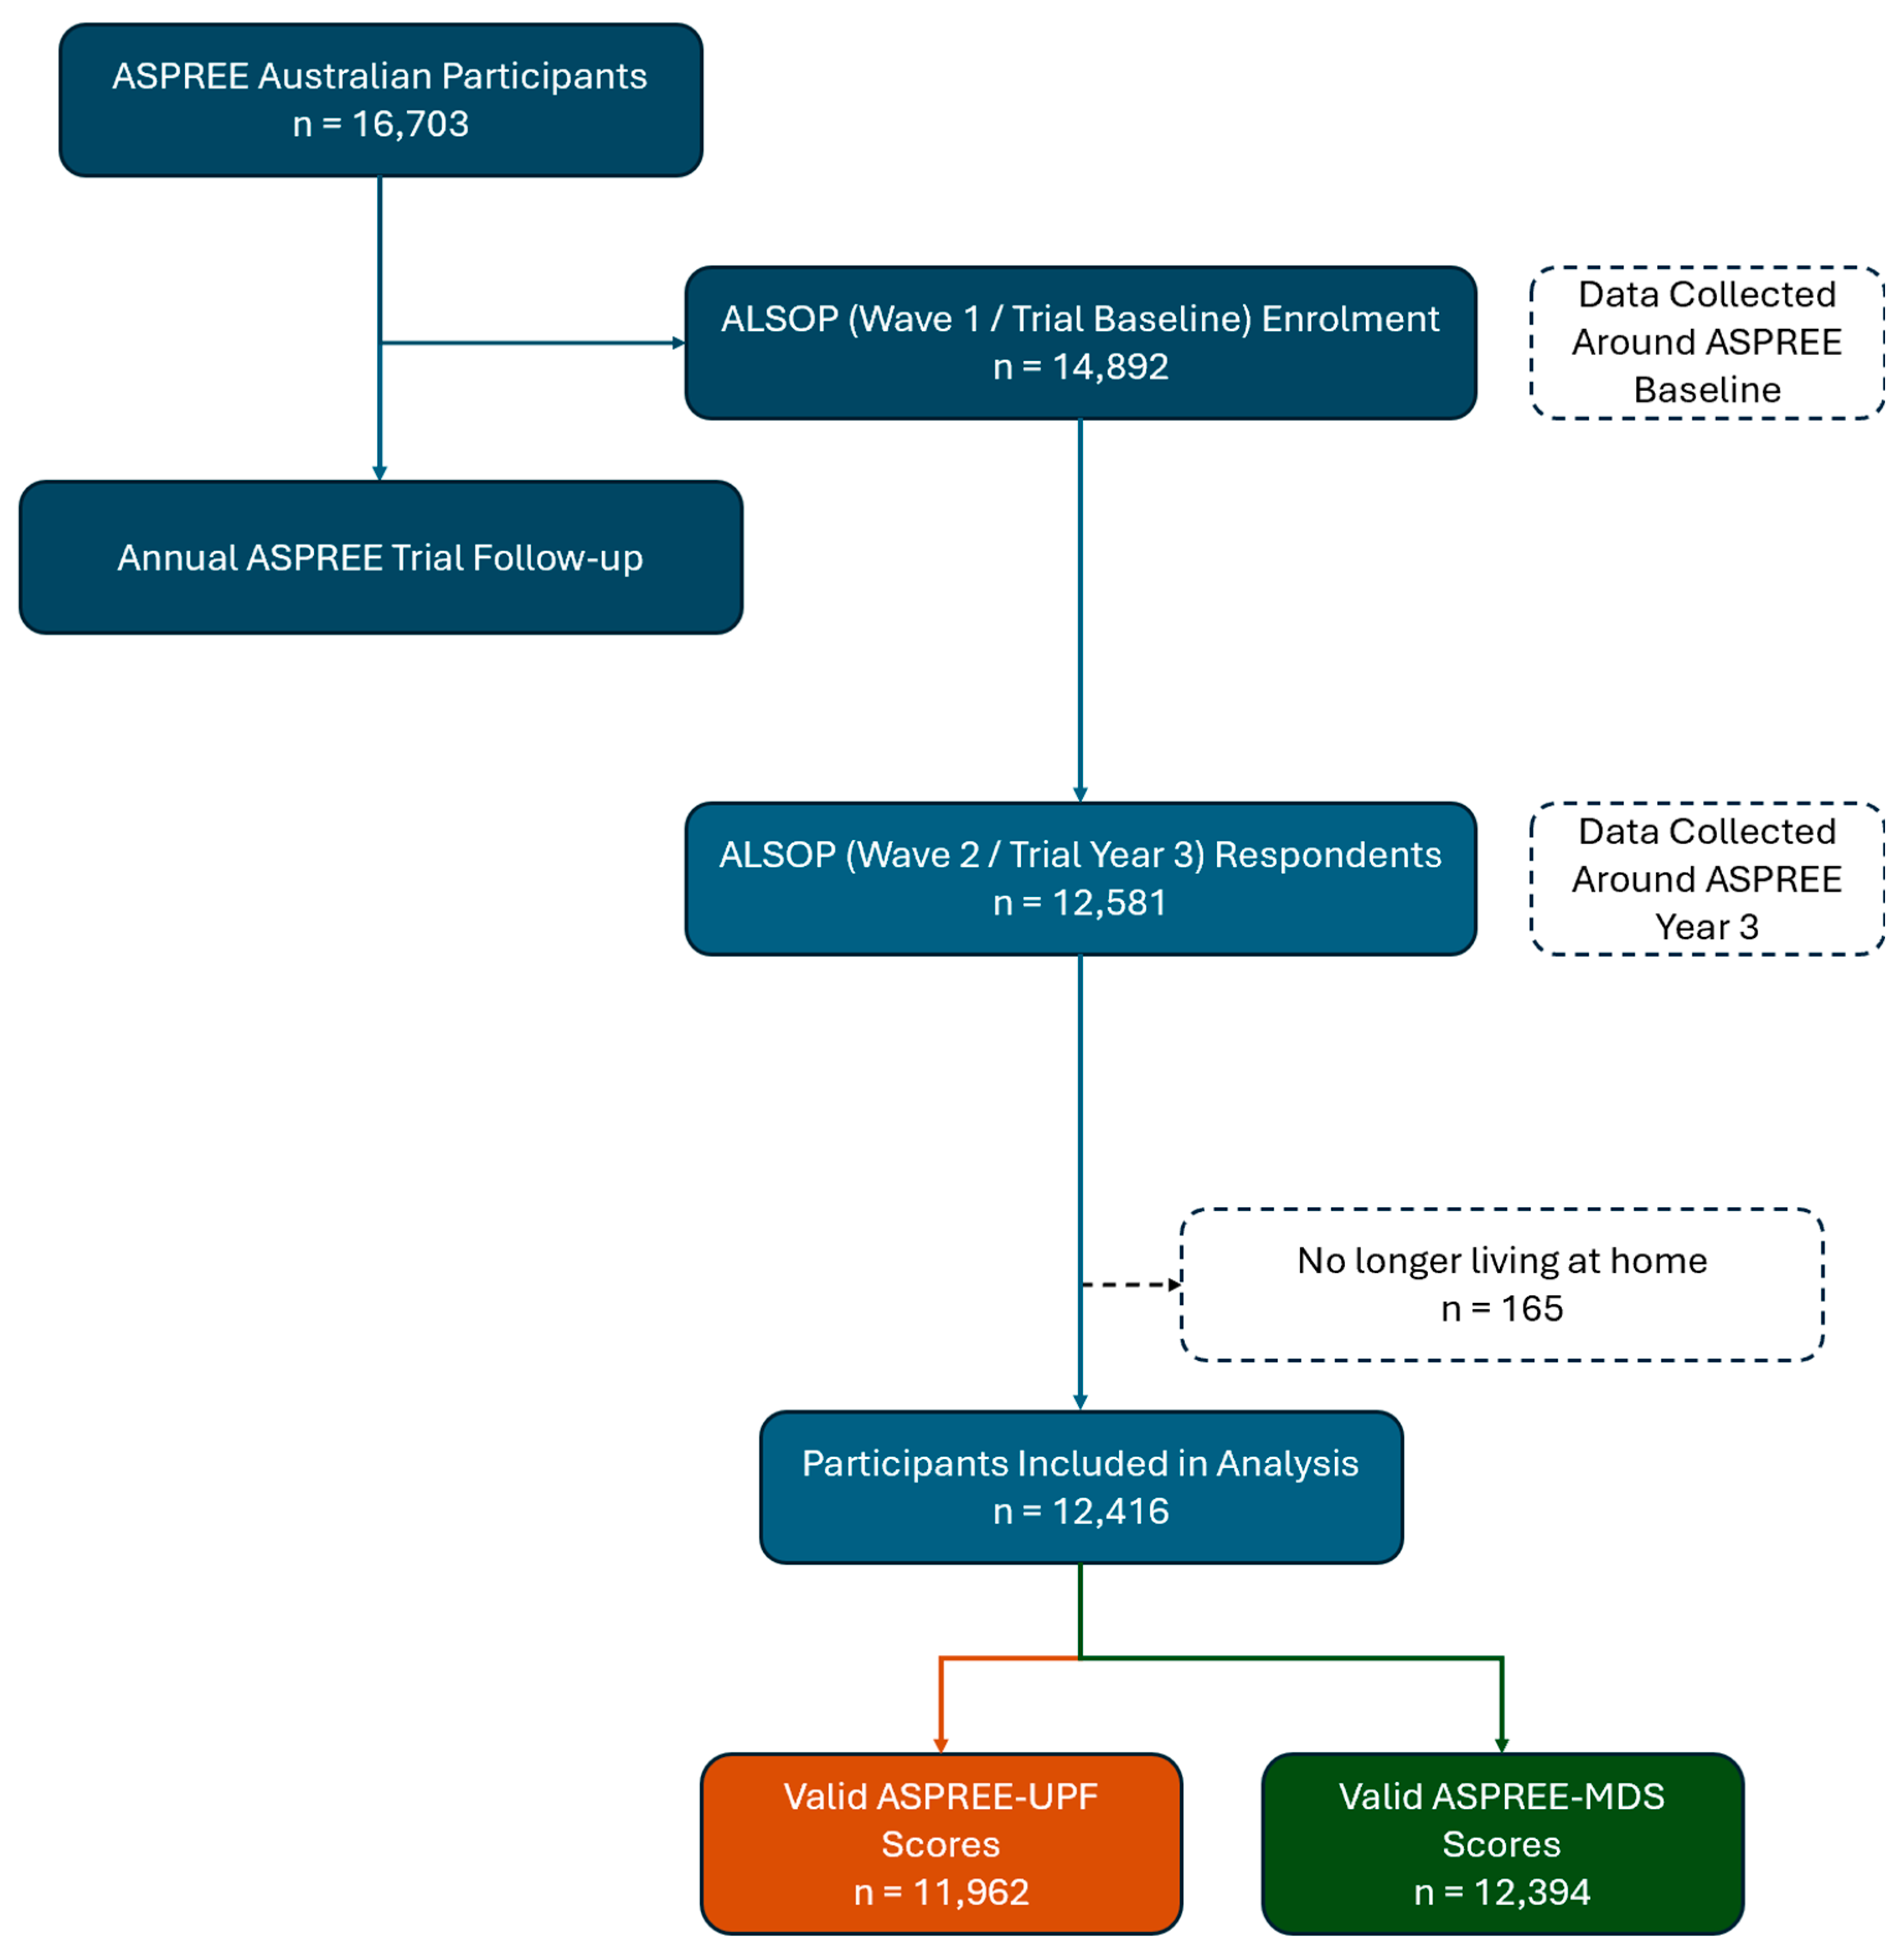
2.1. Baseline and Longitudinal Participant Assessment
2.2. Dietary Score Questionnaire Development
2.3. Morbidity Definitions
2.4. Statistics
3. Results
3.1. Study Population
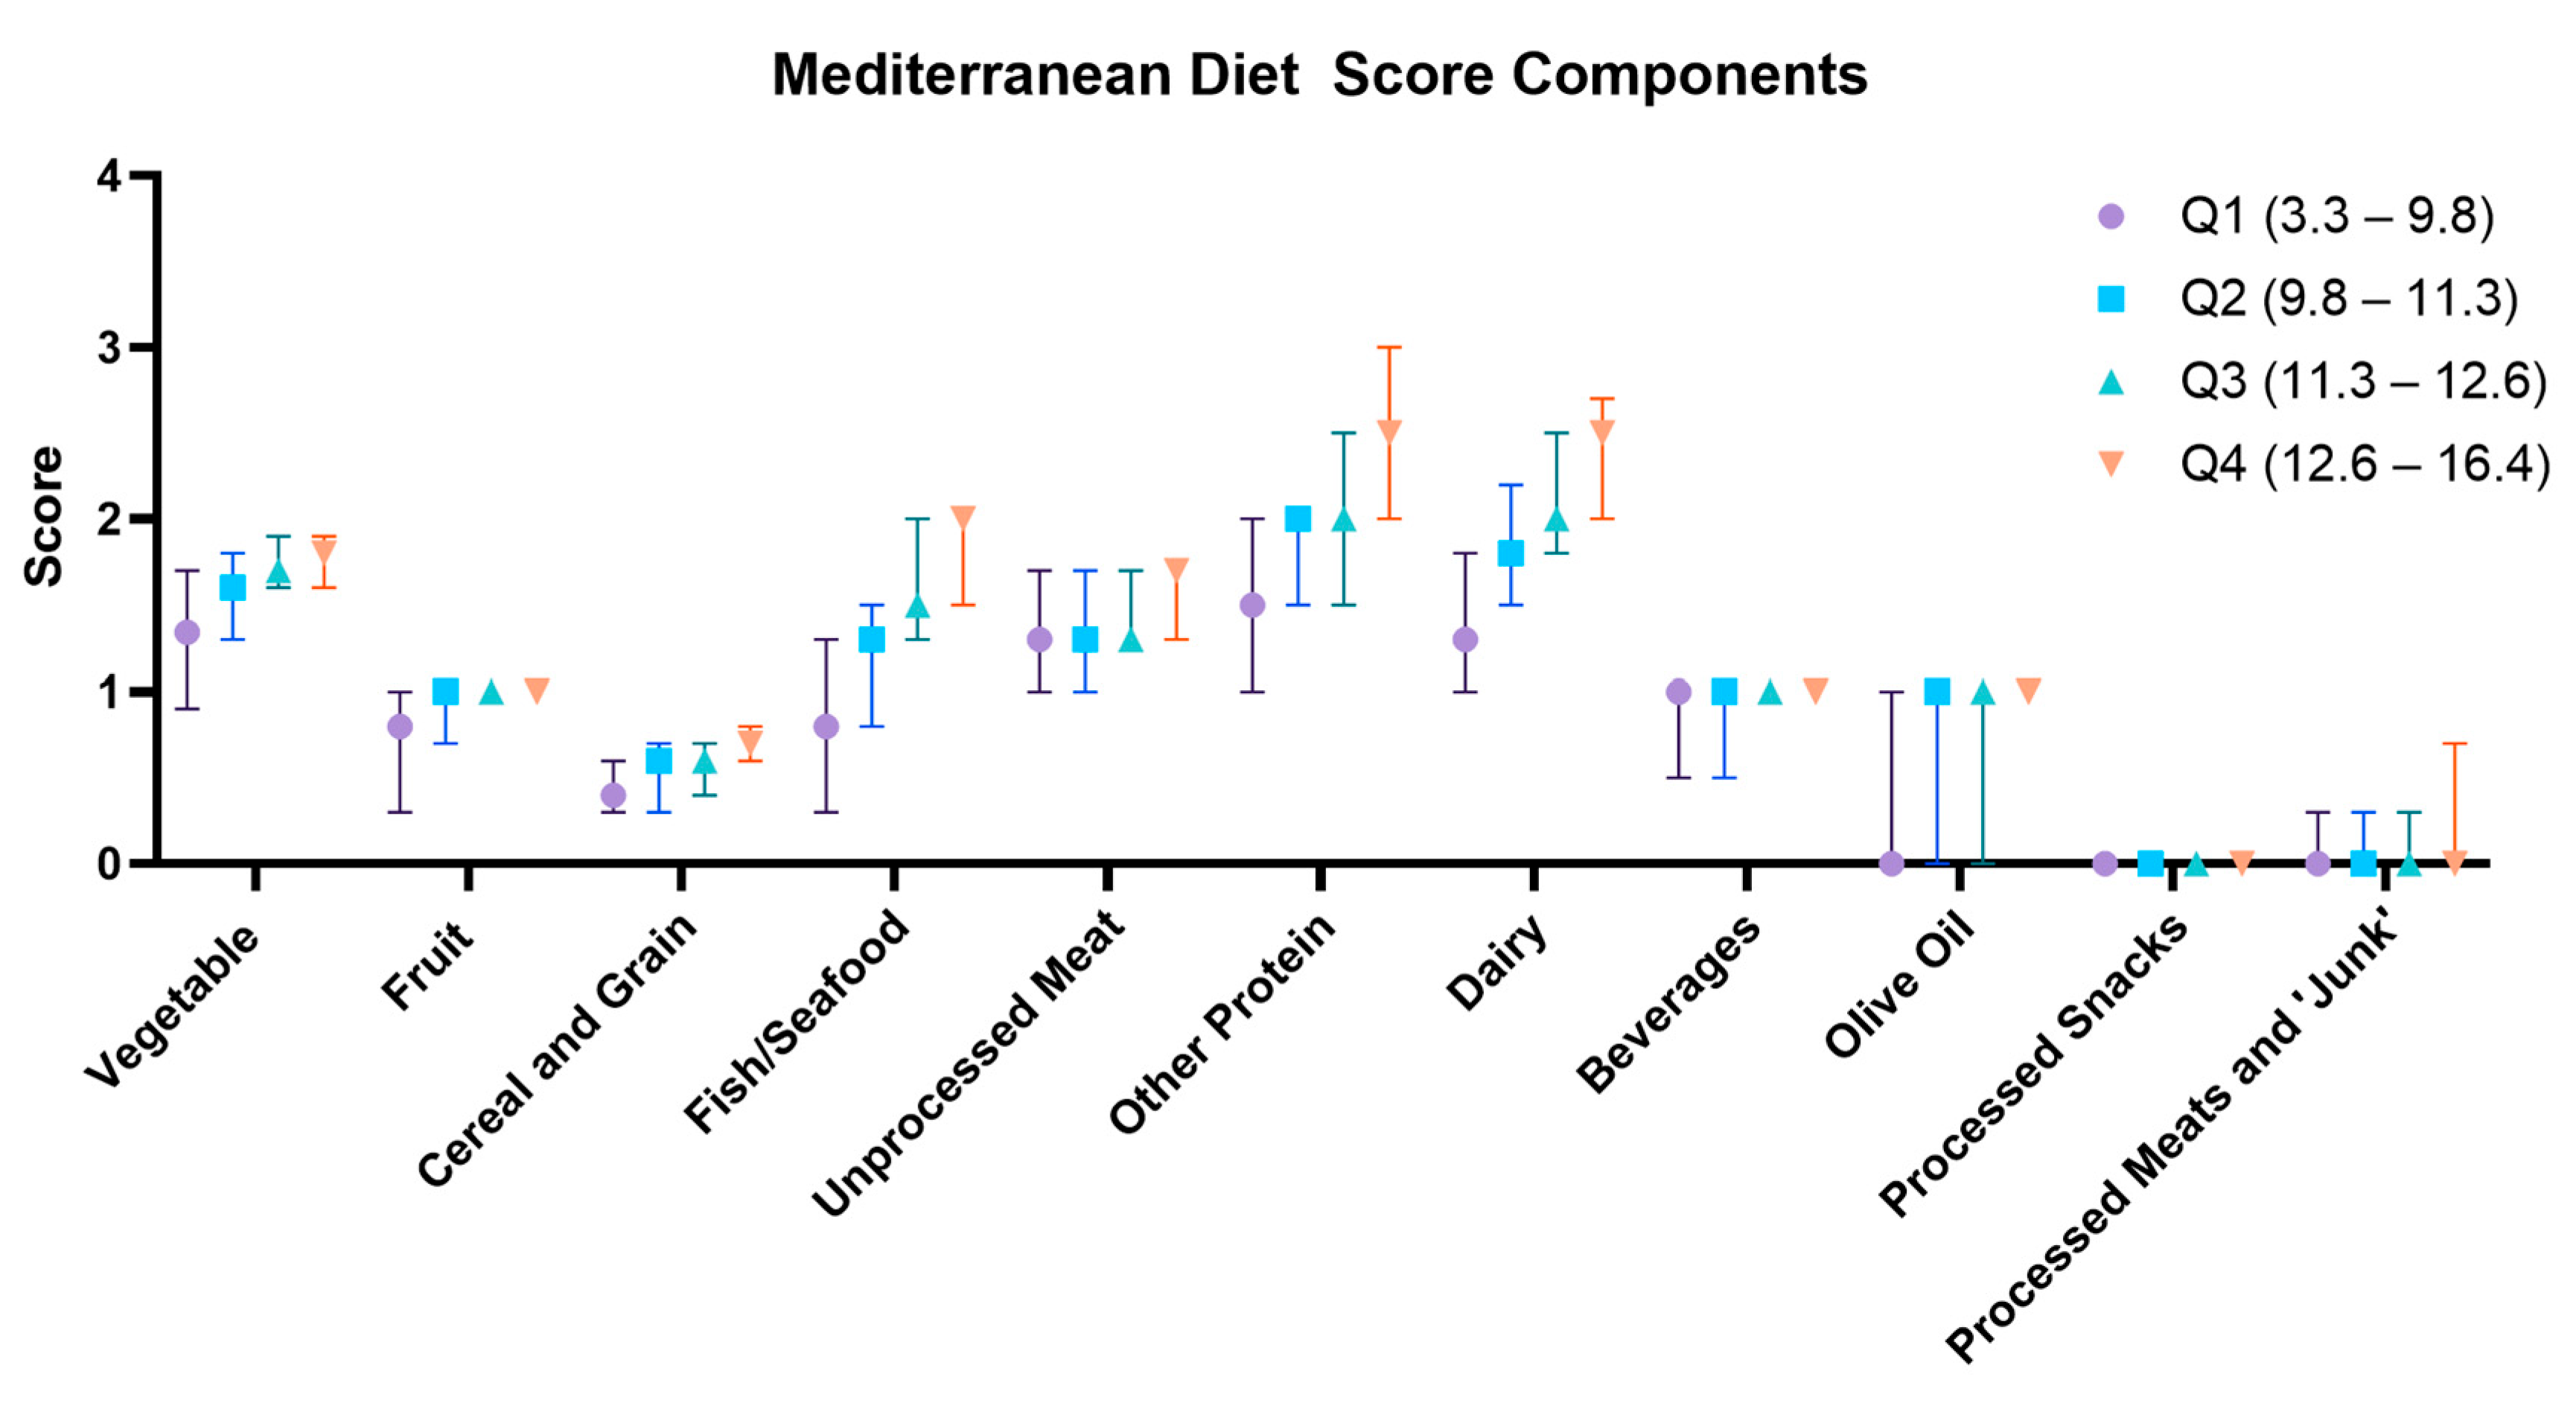
3.2. ASPREE-MDS
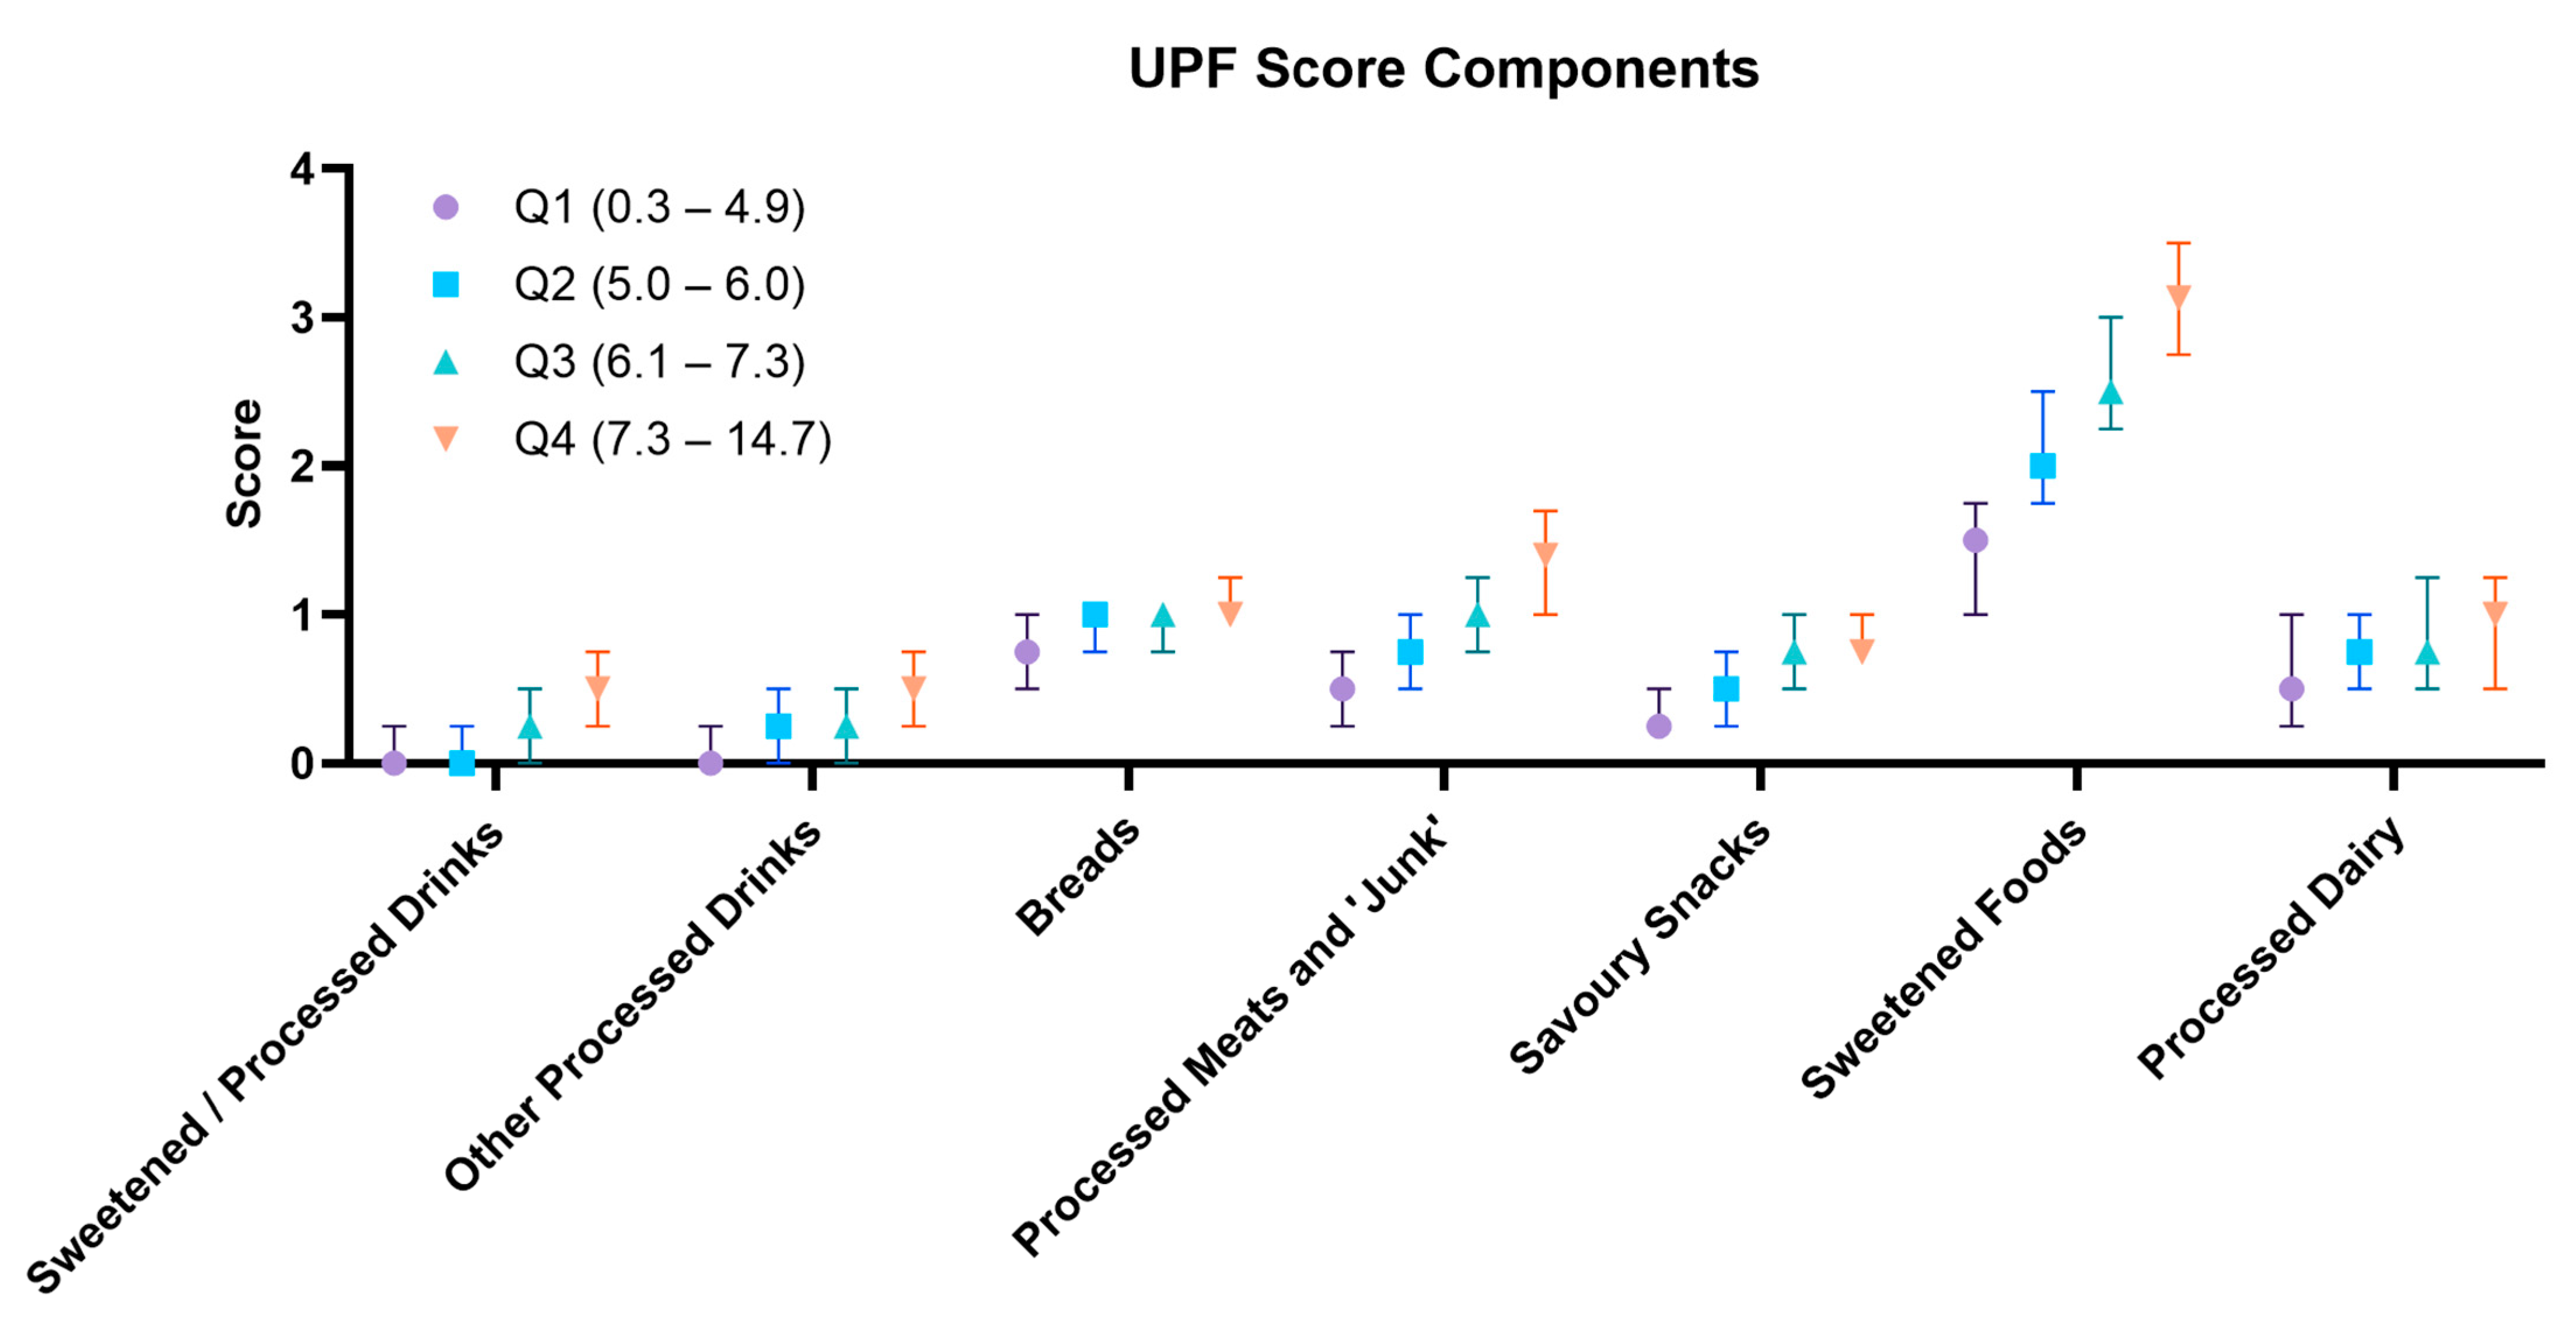
3.3. ASPREE-UPF
3.4. Dietary Patterns with Cardiometabolic Diseases and Frailty Markers
4. Discussion
5. Mediterranean Diet in Older Adults
6. UPF Intake in Older Adults
7. Strengths and Weaknesses
8. Conclusions
Supplementary Materials
Author Contributions
Funding
Institutional Review Board Statement
Informed Consent Statement
Data Availability Statement
Acknowledgments
Conflicts of Interest
References
- GBD Ageing Collaborators. Global, regional, and national burden of diseases and injuries for adults 70 years and older: Systematic analysis for the Global Burden of Disease 2019 Study. BMJ 2022, 376, e068208. [Google Scholar] [CrossRef]
- Bhattacharjee, N.V.; E Schumacher, A.; Aali, A.; Abate, Y.H.; Abbasgholizadeh, R.; Abbasian, M.; Abbasi-Kangevari, M.; Abbastabar, H.; ElHafeez, S.A.; Abd-Elsalam, S.; et al. GBD 2021 Fertility and Forecasting Collaborators. Global fertility in 204 countries and territories, 1950–2021, with forecasts to 2100: A comprehensive demographic analysis for the Global Burden of Disease Study 2021. Lancet 2024, 403, 2057–2099. [Google Scholar] [CrossRef]
- Chang, A.Y.; Skirbekk, V.F.; Tyrovolas, S.; Kassebaum, N.J.; Dieleman, J.L. Measuring population ageing: An analysis of the Global Burden of Disease Study 2017. Lancet Public Health 2019, 4, e159–e167. [Google Scholar] [CrossRef] [PubMed]
- Prince, M.J.; Wu, F.; Guo, Y.; Gutierrez Robledo, L.M.; O’Donnell, M.; Sullivan, R.; Yusuf, S. The burden of disease in older people and implications for health policy and practice. Lancet 2015, 385, 549–562. [Google Scholar] [CrossRef] [PubMed]
- De Nardi, M.; French, E.; Jones, J.B.; McCauley, J. Medical Spending of the US Elderly. Fisc. Stud. 2016, 37, 717–747. [Google Scholar] [CrossRef] [PubMed]
- Harris, A.; Sharma, A. Estimating the future health and aged care expenditure in Australia with changes in morbidity. PLoS ONE 2018, 13, e0201697. [Google Scholar] [CrossRef] [PubMed]
- Lee, J.T.; Hamid, F.; Pati, S.; Atun, R.; Millett, C. Impact of Noncommunicable Disease Multimorbidity on Healthcare Utilisation and Out-Of-Pocket Expenditures in Middle-Income Countries: Cross Sectional Analysis. PLoS ONE 2015, 10, e0127199. [Google Scholar] [CrossRef] [PubMed]
- Picco, L.; Achilla, E.; Abdin, E.; Chong, S.A.; Vaingankar, J.A.; McCrone, P.; Chua, H.C.; Heng, D.; Magadi, H.; Ng, L.L.; et al. Economic burden of multimorbidity among older adults: Impact on healthcare and societal costs. BMC Health Serv. Res. 2016, 16, 173. [Google Scholar] [CrossRef]
- Ofori-Asenso, R.; Chin, K.L.; Curtis, A.J.; Zomer, E.; Zoungas, S.; Liew, D. Recent Patterns of Multimorbidity Among Older Adults in High-Income Countries. Popul. Health Manag. 2019, 22, 127–137. [Google Scholar] [CrossRef]
- Schneider, K.M.; O’Donnell, B.E.; Dean, D. Prevalence of multiple chronic conditions in the United States' Medicare population. Health Qual. Life Outcomes 2009, 7, 82. [Google Scholar] [CrossRef]
- Makovski, T.T.; Schmitz, S.; Zeegers, M.P.; Stranges, S.; van den Akker, M. Multimorbidity and quality of life: Systematic literature review and meta-analysis. Ageing Res. Rev. 2019, 53, 100903. [Google Scholar] [CrossRef] [PubMed]
- English, L.K.; Ard, J.D.; Bailey, R.L.; Bates, M.; Bazzano, L.A.; Boushey, C.J.; Brown, C.; Butera, G.; Callahan, E.H.; de Jesus, J.; et al. Evaluation of Dietary Patterns and All-Cause Mortality: A Systematic Review. JAMA Netw. Open 2021, 4, e2122277. [Google Scholar] [CrossRef] [PubMed]
- Govindaraju, T.; Sahle, B.W.; McCaffrey, T.A.; McNeil, J.J.; Owen, A.J. Dietary Patterns and Quality of Life in Older Adults: A Systematic Review. Nutrients 2018, 10, 971. [Google Scholar] [CrossRef] [PubMed]
- Harrington, J.M.; Dahly, D.L.; Fitzgerald, A.P.; Gilthorpe, M.S.; Perry, I.J. Capturing changes in dietary patterns among older adults: A latent class analysis of an ageing Irish cohort. Public Health Nutr. 2014, 17, 2674–2686. [Google Scholar] [CrossRef] [PubMed]
- Whitelock, E.; Ensaff, H. On Your Own: Older Adults’ Food Choice and Dietary Habits. Nutrients 2018, 10, 413. [Google Scholar] [CrossRef] [PubMed]
- Dominguez, L.J.; Veronese, N.; Baiamonte, E.; Guarrera, M.; Parisi, A.; Ruffolo, C.; Tagliaferri, F.; Barbagallo, M. Healthy Aging and Dietary Patterns. Nutrients 2022, 14, 889. [Google Scholar] [CrossRef]
- Jacobs, D.R., Jr.; Orlich, M.J. Diet pattern and longevity: Do simple rules suffice? A commentary. Am. J. Clin. Nutr. 2014, 100 (Suppl. 1), 313S–319S. [Google Scholar] [CrossRef]
- Keys, A.; Keys, M. How to Eat Well and Stay Well the Mediterranean Way; Doubleday: New York, NY, USA, 1975. [Google Scholar]
- Eleftheriou, D.; Benetou, V.; Trichopoulou, A.; La Vecchia, C.; Bamia, C. Mediterranean diet and its components in relation to all-cause mortality: Meta-analysis. Br. J. Nutr. 2018, 120, 1081–1097. [Google Scholar] [CrossRef]
- Widmer, R.J.; Flammer, A.J.; Lerman, L.O.; Lerman, A. The Mediterranean diet, its components, and cardiovascular disease. Am. J. Med. 2015, 128, 229–238. [Google Scholar] [CrossRef]
- Rosato, V.; Temple, N.J.; La Vecchia, C.; Castellan, G.; Tavani, A.; Guercio, V. Mediterranean diet and cardiovascular disease: A systematic review and meta-analysis of observational studies. Eur. J. Nutr. 2019, 58, 173–191. [Google Scholar] [CrossRef]
- Psaltopoulou, T.; Sergentanis, T.N.; Panagiotakos, D.B.; Sergentanis, I.N.; Kosti, R.; Scarmeas, N. Mediterranean diet, stroke, cognitive impairment, and depression: A meta-analysis. Ann. Neurol. 2013, 74, 580–591. [Google Scholar] [CrossRef] [PubMed]
- Skarupski, K.A.; Tangney, C.C.; Li, H.; Evans, D.A.; Morris, M.C. Mediterranean diet and depressive symptoms among older adults over time. J. Nutr. Health Aging 2013, 17, 441–445. [Google Scholar] [CrossRef]
- Petersson, S.D.; Philippou, E. Mediterranean Diet, Cognitive Function, and Dementia: A Systematic Review of the Evidence. Adv. Nutr. 2016, 7, 889–904. [Google Scholar] [CrossRef] [PubMed]
- Andreo-Lopez, M.C.; Contreras-Bolivar, V.; Munoz-Torres, M.; Garcia-Fontana, B.; Garcia-Fontana, C. Influence of the Mediterranean Diet on Healthy Aging. Int. J. Mol. Sci. 2023, 24, 4491. [Google Scholar] [CrossRef] [PubMed]
- Hutchins-Wiese, H.L.; Bales, C.W.; Porter Starr, K.N. Mediterranean diet scoring systems: Understanding the evolution and applications for Mediterranean and non-Mediterranean countries. Br. J. Nutr. 2022, 128, 1371–1392. [Google Scholar] [CrossRef]
- Monteiro, C.A.; Cannon, G.; Lawrence, M.; Costa Louzada, M.d.; Pereira Machado, P. Ultra-Processed Foods, Diet Quality, and Health Using the NOVA Classification System; FAO: Rome, Italy, 2019; Volume 48. [Google Scholar]
- Monteiro, C.A.; Cannon, G.; Levy, R.B.; Moubarac, J.C.; Louzada, M.L.; Rauber, F.; Khandpur, N.; Cediel, G.; Neri, D.; Martinez-Steele, E.; et al. Ultra-processed foods: What they are and how to identify them. Public Health Nutr. 2019, 22, 936–941. [Google Scholar] [CrossRef]
- Elizabeth, L.; Machado, P.; Zinocker, M.; Baker, P.; Lawrence, M. Ultra-Processed Foods and Health Outcomes: A Narrative Review. Nutrients 2020, 12, 1955. [Google Scholar] [CrossRef]
- Fang, Z.; Rossato, S.L.; Hang, D.; Khandpur, N.; Wang, K.; Lo, C.H.; Willett, W.C.; Giovannucci, E.L.; Song, M. Association of ultra-processed food consumption with all cause and cause specific mortality: Population based cohort study. BMJ 2024, 385, e078476. [Google Scholar] [CrossRef]
- Suksatan, W.; Moradi, S.; Naeini, F.; Bagheri, R.; Mohammadi, H.; Talebi, S.; Mehrabani, S.; Hojjati Kermani, M.A.; Suzuki, K. Ultra-Processed Food Consumption and Adult Mortality Risk: A Systematic Review and Dose-Response Meta-Analysis of 207,291 Participants. Nutrients 2021, 14, 174. [Google Scholar] [CrossRef]
- Cardoso, B.R.; Machado, P.; Steele, E.M. Association between ultra-processed food consumption and cognitive performance in US older adults: A cross-sectional analysis of the NHANES 2011-2014. Eur. J. Nutr. 2022, 61, 3975–3985. [Google Scholar] [CrossRef] [PubMed]
- Srour, B.; Kordahi, M.C.; Bonazzi, E.; Deschasaux-Tanguy, M.; Touvier, M.; Chassaing, B. Ultra-processed foods and human health: From epidemiological evidence to mechanistic insights. Lancet Gastroenterol. Hepatol. 2022, 7, 1128–1140. [Google Scholar] [CrossRef]
- Dicken, S.J.; Batterham, R.L. Ultra-processed Food and Obesity: What Is the Evidence? Curr. Nutr. Rep. 2024, 13, 23–38. [Google Scholar] [CrossRef]
- Winter, J.E.; MacInnis, R.J.; Wattanapenpaiboon, N.; Nowson, C.A. BMI and all-cause mortality in older adults: A meta-analysis. Am. J. Clin. Nutr. 2014, 99, 875–890. [Google Scholar] [CrossRef] [PubMed]
- Bhaskaran, K.; Dos-Santos-Silva, I.; Leon, D.A.; Douglas, I.J.; Smeeth, L. Association of BMI with overall and cause-specific mortality: A population-based cohort study of 3.6 million adults in the UK. Lancet Diabetes Endocrinol. 2018, 6, 944–953. [Google Scholar] [CrossRef] [PubMed]
- Giezenaar, C.; Chapman, I.; Luscombe-Marsh, N.; Feinle-Bisset, C.; Horowitz, M.; Soenen, S. Ageing Is Associated with Decreases in Appetite and Energy Intake--A Meta-Analysis in Healthy Adults. Nutrients 2016, 8, 28. [Google Scholar] [CrossRef] [PubMed]
- McNeil, J.J.; Woods, R.L.; Nelson, M.R.; Murray, A.M.; Reid, C.M.; Kirpach, B.; Storey, E.; Shah, R.C.; Wolfe, R.S.; Tonkin, A.M.; et al. Baseline Characteristics of Participants in the ASPREE (ASPirin in Reducing Events in the Elderly) Study. J. Gerontol. A Biol. Sci. Med. Sci. 2017, 72, 1586–1593. [Google Scholar] [CrossRef]
- McNeil, J.J.; Woods, R.L.; Ward, S.A.; Britt, C.J.; Lockery, J.E.; Beilin, L.J.; Owen, A.J. Cohort Profile: The ASPREE Longitudinal Study of Older Persons (ALSOP). Int. J. Epidemiol. 2019, 48, 1048–1049h. [Google Scholar] [CrossRef]
- McNeil, J.J.; Nelson, M.R.; Woods, R.L.; Lockery, J.E.; Wolfe, R.; Reid, C.M.; Kirpach, B.; Shah, R.C.; Ives, D.G.; Storey, E.; et al. Effect of Aspirin on All-Cause Mortality in the Healthy Elderly. N. Engl. J. Med. 2018, 379, 1519–1528. [Google Scholar] [CrossRef]
- McNeil, J.J.; Wolfe, R.; Woods, R.L.; Tonkin, A.M.; Donnan, G.A.; Nelson, M.R.; Reid, C.M.; Lockery, J.E.; Kirpach, B.; Storey, E.; et al. Effect of Aspirin on Cardiovascular Events and Bleeding in the Healthy Elderly. N. Engl. J. Med. 2018, 379, 1509–1518. [Google Scholar] [CrossRef]
- McNeil, J.J.; Woods, R.L.; Nelson, M.R.; Reid, C.M.; Kirpach, B.; Wolfe, R.; Storey, E.; Shah, R.C.; Lockery, J.E.; Tonkin, A.M.; et al. Effect of Aspirin on Disability-free Survival in the Healthy Elderly. N. Engl. J. Med. 2018, 379, 1499–1508. [Google Scholar] [CrossRef]
- Teng, E.L.; Chui, H.C. The Modified Mini-Mental State (3MS) examination. J. Clin. Psychiatry 1987, 48, 314–318. [Google Scholar] [PubMed]
- Katz, S. Assessing self-maintenance: Activities of daily living, mobility, and instrumental activities of daily living. J. Am. Geriatr. Soc. 1983, 31, 721–727. [Google Scholar] [CrossRef]
- Andresen, E.M.; Malmgren, J.A.; Carter, W.B.; Patrick, D.L. Screening for depression in well older adults: Evaluation of a short form of the CES-D (Center for Epidemiologic Studies Depression Scale). Am. J. Prev. Med. 1994, 10, 77–84. [Google Scholar] [CrossRef] [PubMed]
- Radloff, L.S. The CES-D Scale:A Self-Report Depression Scale for Research in the General Population. Appl. Psychol. Meas. 1977, 1, 385–401. [Google Scholar] [CrossRef]
- Monteiro, C.A.; Cannon, G.; Moubarac, J.C.; Levy, R.B.; Louzada, M.L.C.; Jaime, P.C. The UN Decade of Nutrition, the NOVA food classification and the trouble with ultra-processing. Public Health Nutr. 2018, 21, 5–17. [Google Scholar] [CrossRef] [PubMed]
- Machado, P.P.; Steele, E.M.; Levy, R.B.; Sui, Z.; Rangan, A.; Woods, J.; Gill, T.; Scrinis, G.; Monteiro, C.A. Ultra-processed foods and recommended intake levels of nutrients linked to non-communicable diseases in Australia: Evidence from a nationally representative cross-sectional study. BMJ Open 2019, 9, e029544. [Google Scholar] [CrossRef] [PubMed]
- Davis, C.; Bryan, J.; Hodgson, J.; Murphy, K. Definition of the Mediterranean Diet; a Literature Review. Nutrients 2015, 7, 9139–9153. [Google Scholar] [CrossRef]
- Hedayatnia, M.; Asadi, Z.; Zare-Feyzabadi, R.; Yaghooti-Khorasani, M.; Ghazizadeh, H.; Ghaffarian-Zirak, R.; Nosrati-Tirkani, A.; Mohammadi-Bajgiran, M.; Rohban, M.; Sadabadi, F.; et al. Dyslipidemia and cardiovascular disease risk among the MASHAD study population. Lipids Health Dis. 2020, 19, 42. [Google Scholar] [CrossRef]
- Zoungas, S.; Zhou, Z.; Owen, A.J.; Curtis, A.J.; Espinoza, S.E.; Ernst, M.E.; Woods, R.L.; Orchard, S.G.; McNeil, J.J.; Murray, A.M.; et al. Daily low-dose aspirin and incident type 2 diabetes in community-dwelling healthy older adults: A post-hoc analysis of efficacy and safety in the ASPREE randomised placebo-controlled trial. Lancet Diabetes Endocrinol. 2024, 12, 98–106. [Google Scholar] [CrossRef]
- Clayton-Chubb, D.; Kemp, W.W.; Majeed, A.; Lubel, J.S.; Woods, R.L.; Tran, C.; Ryan, J.; Hodge, A.; Schneider, H.G.; McNeil, J.J.; et al. Metabolic dysfunction-associated steatotic liver disease in older adults is associated with frailty and social disadvantage. Liver Int. 2023, 44, 39–51. [Google Scholar] [CrossRef]
- Cruz-Jentoft, A.J.; Bahat, G.; Bauer, J.; Boirie, Y.; Bruyere, O.; Cederholm, T.; Cooper, C.; Landi, F.; Rolland, Y.; Sayer, A.A.; et al. Sarcopenia: Revised European consensus on definition and diagnosis. Age Ageing 2019, 48, 16–31. [Google Scholar] [CrossRef]
- Ryan, J.; Espinoza, S.; Ernst, M.E.; Ekram, A.; Wolfe, R.; Murray, A.M.; Shah, R.C.; Orchard, S.G.; Fitzgerald, S.; Beilin, L.J.; et al. Validation of a Deficit-Accumulation Frailty Index in the ASPirin in Reducing Events in the Elderly Study and Its Predictive Capacity for Disability-Free Survival. J. Gerontol. A Biol. Sci. Med. Sci. 2022, 77, 19–26. [Google Scholar] [CrossRef] [PubMed]
- Rockwood, K.; Mitnitski, A. Frailty in relation to the accumulation of deficits. J. Gerontol. A Biol. Sci. Med. Sci. 2007, 62, 722–727. [Google Scholar] [CrossRef] [PubMed]
- Yuan, L.; Chang, M.; Wang, J. Abdominal obesity, body mass index and the risk of frailty in community-dwelling older adults: A systematic review and meta-analysis. Age Ageing 2021, 50, 1118–1128. [Google Scholar] [CrossRef]
- Berk, M.; Woods, R.L.; Nelson, M.R.; Shah, R.C.; Reid, C.M.; Storey, E.; Fitzgerald, S.M.; Lockery, J.E.; Wolfe, R.; Mohebbi, M.; et al. ASPREE-D: Aspirin for the prevention of depression in the elderly. Int. Psychogeriatr. 2016, 28, 1741–1748. [Google Scholar] [CrossRef]
- Baker, A.H.; Wardle, J. Sex differences in fruit and vegetable intake in older adults. Appetite 2003, 40, 269–275. [Google Scholar] [CrossRef] [PubMed]
- Shatenstein, B.; Ferland, G.; Belleville, S.; Gray-Donald, K.; Kergoat, M.J.; Morais, J.; Gaudreau, P.; Payette, H.; Greenwood, C. Diet quality and cognition among older adults from the NuAge study. Exp. Gerontol. 2012, 47, 353–360. [Google Scholar] [CrossRef]
- Milte, C.M.; Thorpe, M.G.; Crawford, D.; Ball, K.; McNaughton, S.A. Associations of diet quality with health-related quality of life in older Australian men and women. Exp. Gerontol. 2015, 64, 8–16. [Google Scholar] [CrossRef]
- Guasch-Ferre, M.; Willett, W.C. The Mediterranean diet and health: A comprehensive overview. J. Intern. Med. 2021, 290, 549–566. [Google Scholar] [CrossRef]
- Martinez-Gonzalez, M.A.; Gea, A.; Ruiz-Canela, M. The Mediterranean Diet and Cardiovascular Health. Circ. Res. 2019, 124, 779–798. [Google Scholar] [CrossRef]
- Cowell, O.R.; Mistry, N.; Deighton, K.; Matu, J.; Griffiths, A.; Minihane, A.M.; Mathers, J.C.; Shannon, O.M.; Siervo, M. Effects of a Mediterranean diet on blood pressure: A systematic review and meta-analysis of randomized controlled trials and observational studies. J. Hypertens. 2021, 39, 729–739. [Google Scholar] [CrossRef]
- Chauveau, P.; Aparicio, M.; Bellizzi, V.; Campbell, K.; Hong, X.; Johansson, L.; Kolko, A.; Molina, P.; Sezer, S.; Wanner, C.; et al. Mediterranean diet as the diet of choice for patients with chronic kidney disease. Nephrol. Dial. Transplant. 2018, 33, 725–735. [Google Scholar] [CrossRef] [PubMed]
- Podadera-Herreros, A.; Alcala-Diaz, J.F.; Gutierrez-Mariscal, F.M.; Jimenez-Torres, J.; Cruz-Ares, S.; Arenas-de Larriva, A.P.; Cardelo, M.P.; Torres-Pena, J.D.; Luque, R.M.; Ordovas, J.M.; et al. Long-term consumption of a mediterranean diet or a low-fat diet on kidney function in coronary heart disease patients: The CORDIOPREV randomized controlled trial. Clin. Nutr. 2022, 41, 552–559. [Google Scholar] [CrossRef]
- Poursalehi, D.; Lotfi, K.; Saneei, P. Adherence to the Mediterranean diet and risk of frailty and pre-frailty in elderly adults: A systematic review and dose-response meta-analysis with GRADE assessment. Ageing Res. Rev. 2023, 87, 101903. [Google Scholar] [CrossRef] [PubMed]
- Dominguez, L.J.; Donat-Vargas, C.; Sayon-Orea, C.; Barberia-Latasa, M.; Veronese, N.; Rey-Garcia, J.; Rodriguez-Artalejo, F.; Guallar-Castillon, P.; Martinez-Gonzalez, M.A.; Barbagallo, M. Rationale of the association between Mediterranean diet and the risk of frailty in older adults and systematic review and meta-analysis. Exp. Gerontol. 2023, 177, 112180. [Google Scholar] [CrossRef] [PubMed]
- Luong, R.; Ribeiro, R.; Naganathan, V.; Blyth, F.; Waite, L.M.; Handelsman, D.J.; Le Couteur, D.G.; Seibel, M.J.; Hirani, V. Cross-sectional and longitudinal associations between empirically derived dietary patterns and frailty among older men: The Concord Health and Ageing in Men Project. J. Nutr. Health Aging 2024, 28, 100021. [Google Scholar] [CrossRef]
- Ghosh, T.S.; Rampelli, S.; Jeffery, I.B.; Santoro, A.; Neto, M.; Capri, M.; Giampieri, E.; Jennings, A.; Candela, M.; Turroni, S.; et al. Mediterranean diet intervention alters the gut microbiome in older people reducing frailty and improving health status: The NU-AGE 1-year dietary intervention across five European countries. Gut 2020, 69, 1218–1228. [Google Scholar] [CrossRef]
- Serreli, G.; Deiana, M. Extra Virgin Olive Oil Polyphenols: Modulation of Cellular Pathways Related to Oxidant Species and Inflammation in Aging. Cells 2020, 9, 478. [Google Scholar] [CrossRef]
- Giuffre, D.; Giuffre, A.M. Mediterranean diet and health in the elderly. AIMS Public. Health 2023, 10, 568–576. [Google Scholar] [CrossRef]
- Hooper, L.; Martin, N.; Jimoh, O.F.; Kirk, C.; Foster, E.; Abdelhamid, A.S. Reduction in saturated fat intake for cardiovascular disease. Cochrane Database Syst. Rev. 2020, 8, CD011737. [Google Scholar] [CrossRef]
- Poti, J.M.; Mendez, M.A.; Ng, S.W.; Popkin, B.M. Is the degree of food processing and convenience linked with the nutritional quality of foods purchased by US households? Am. J. Clin. Nutr. 2015, 101, 1251–1262. [Google Scholar] [CrossRef] [PubMed]
- Martini, D.; Godos, J.; Bonaccio, M.; Vitaglione, P.; Grosso, G. Ultra-Processed Foods and Nutritional Dietary Profile: A Meta-Analysis of Nationally Representative Samples. Nutrients 2021, 13, 3390. [Google Scholar] [CrossRef] [PubMed]
- Machado, P.P.; Steele, E.M.; Levy, R.B.; da Costa Louzada, M.L.; Rangan, A.; Woods, J.; Gill, T.; Scrinis, G.; Monteiro, C.A. Ultra-processed food consumption and obesity in the Australian adult population. Nutr. Diabetes 2020, 10, 39. [Google Scholar] [CrossRef] [PubMed]
- Dai, S.; Wellens, J.; Yang, N.; Li, D.; Wang, J.; Wang, L.; Yuan, S.; He, Y.; Song, P.; Munger, R.; et al. Ultra-processed foods and human health: An umbrella review and updated meta-analyses of observational evidence. Clin. Nutr. 2024, 43, 1386–1394. [Google Scholar] [CrossRef]
- Li, H.; Li, S.; Yang, H.; Zhang, Y.; Zhang, S.; Ma, Y.; Hou, Y.; Zhang, X.; Niu, K.; Borne, Y.; et al. Association of Ultraprocessed Food Consumption With Risk of Dementia: A Prospective Cohort Study. Neurology 2022, 99, e1056–e1066. [Google Scholar] [CrossRef]
- Samuthpongtorn, C.; Nguyen, L.H.; Okereke, O.I.; Wang, D.D.; Song, M.; Chan, A.T.; Mehta, R.S. Consumption of Ultraprocessed Food and Risk of Depression. JAMA Netw. Open 2023, 6, e2334770. [Google Scholar] [CrossRef]
- Delpino, F.M.; Figueiredo, L.M.; Bielemann, R.M.; da Silva, B.G.C.; Dos Santos, F.S.; Mintem, G.C.; Flores, T.R.; Arcencio, R.A.; Nunes, B.P. Ultra-processed food and risk of type 2 diabetes: A systematic review and meta-analysis of longitudinal studies. Int. J. Epidemiol. 2022, 51, 1120–1141. [Google Scholar] [CrossRef]
- Qu, Y.; Hu, W.; Huang, J.; Tan, B.; Ma, F.; Xing, C.; Yuan, L. Ultra-processed food consumption and risk of cardiovascular events: A systematic review and dose-response meta-analysis. eClinicalMedicine 2024, 69, 102484. [Google Scholar] [CrossRef]
- Hao, J.; Zhou, P.; Qiu, H. Association between Ultra-Processed Food Consumption and Frailty in American Elder People: Evidence from a Cross-Sectional Study. J. Nutr. Health Aging 2022, 26, 688–697. [Google Scholar] [CrossRef]
- Zupo, R.; Donghia, R.; Castellana, F.; Bortone, I.; De Nucci, S.; Sila, A.; Tatoli, R.; Lampignano, L.; Sborgia, G.; Panza, F.; et al. Ultra-processed food consumption and nutritional frailty in older age. Geroscience 2023, 45, 2229–2243. [Google Scholar] [CrossRef]
- Barbosa, S.S.; Sousa, L.C.M.; de Oliveira Silva, D.F.; Pimentel, J.B.; Evangelista, K.; Lyra, C.O.; Lopes, M.; Lima, S. A Systematic Review on Processed/Ultra-Processed Foods and Arterial Hypertension in Adults and Older People. Nutrients 2022, 14, 1215. [Google Scholar] [CrossRef]
- Vitale, M.; Costabile, G.; Testa, R.; D'Abbronzo, G.; Nettore, I.C.; Macchia, P.E.; Giacco, R. Ultra-Processed Foods and Human Health: A Systematic Review and Meta-Analysis of Prospective Cohort Studies. Adv. Nutr. 2024, 15, 100121. [Google Scholar] [CrossRef]
- Thorpe, M.G.; Milte, C.M.; Crawford, D.; McNaughton, S.A. A comparison of the dietary patterns derived by principal component analysis and cluster analysis in older Australians. Int. J. Behav. Nutr. Phys. Act. 2016, 13, 30. [Google Scholar] [CrossRef]
- Askari, M.; Heshmati, J.; Shahinfar, H.; Tripathi, N.; Daneshzad, E. Ultra-processed food and the risk of overweight and obesity: A systematic review and meta-analysis of observational studies. Int. J. Obes. 2020, 44, 2080–2091. [Google Scholar] [CrossRef]
- Poti, J.M.; Braga, B.; Qin, B. Ultra-processed Food Intake and Obesity: What Really Matters for Health-Processing or Nutrient Content? Curr. Obes. Rep. 2017, 6, 420–431. [Google Scholar] [CrossRef]
- Speer, H.; D’Cunha, N.M.; Naumovski, N.; McKune, A.J. Sex, Age, BMI, and C-Reactive Protein Impact the Odds of Developing Hypertension-Findings Based on Data From the Health and Retirement Study (HRS). Am. J. Hypertens. 2021, 34, 1057–1063. [Google Scholar] [CrossRef] [PubMed]
- Bouchard, J.; Valookaran, A.F.; Aloud, B.M.; Raj, P.; Malunga, L.N.; Thandapilly, S.J.; Netticadan, T. Impact of oats in the prevention/management of hypertension. Food Chem. 2022, 381, 132198. [Google Scholar] [CrossRef] [PubMed]
- Borgi, L.; Muraki, I.; Satija, A.; Willett, W.C.; Rimm, E.B.; Forman, J.P. Fruit and Vegetable Consumption and the Incidence of Hypertension in Three Prospective Cohort Studies. Hypertension 2016, 67, 288–293. [Google Scholar] [CrossRef] [PubMed]
- Dinu, M.; Tristan Asensi, M.; Pagliai, G.; Lotti, S.; Martini, D.; Colombini, B.; Sofi, F. Consumption of Ultra-Processed Foods Is Inversely Associated with Adherence to the Mediterranean Diet: A Cross-Sectional Study. Nutrients 2022, 14, 2073. [Google Scholar] [CrossRef]
- Franchini, C.; Biasini, B.; Sogari, G.; Wongprawmas, R.; Andreani, G.; Dolgopolova, I.; Gomez, M.I.; Roosen, J.; Menozzi, D.; Mora, C.; et al. Adherence to the Mediterranean Diet and its association with sustainable dietary behaviors, sociodemographic factors, and lifestyle: A cross-sectional study in US University students. Nutr. J. 2024, 23, 56. [Google Scholar] [CrossRef]
- Atzeni, A.; Martinez, M.A.; Babio, N.; Konstanti, P.; Tinahones, F.J.; Vioque, J.; Corella, D.; Fito, M.; Vidal, J.; Moreno-Indias, I.; et al. Association between ultra-processed food consumption and gut microbiota in senior subjects with overweight/obesity and metabolic syndrome. Front. Nutr. 2022, 9, 976547. [Google Scholar] [CrossRef] [PubMed]


| Females (n = 6751) | Males (n = 5665) | p | |
|---|---|---|---|
| Age (Median [IQR]), years | 77.0 (74.7–80.5) | 76.7 (74.5–80.1) | <0.001 a |
| Caucasian Ethnicity, n (%) | 6680 (98.9%) | 5584 (98.6%) | 0.056 b |
| Education Completion | <0.001 b | ||
| ≤11 years of education (n, %) | 3457 (51.2%) | 2554 (45.1%) | |
| 12 years of education (n, %) | 755 (11.2%) | 588 (10.4%) | |
| ≥13 years of education (n, %) | 2538 (37.6%) | 2523 (44.5%) | |
| Lifestyle Factors | |||
| Currently Drinking Alcohol (n, %) | 4528 (67.1%) | 4615 (81.5%) | <0.001 b |
| Currently Smoking (n, %) | 151 (2.2%) | 144 (2.5%) | 0.265 b |
| Living Situation | <0.001 b | ||
| Home alone (n, %) | 3001 (44.5%) | 1103 (19.5%) | |
| Home with spouse/friends/family (n, %) | 3750 (55.5%) | 4562 (80.5%) | |
| BMI (mean ± SD), kg/m2 | 27.6 ± 5.1 | 27.6 ± 3.8 | 0.608 c <0.001 b |
| BMI Categories (n, %) | |||
| BMI < 23 kg/m2 | 1200 (17.8%) | 539 (9.5%) | |
| BMI 23–28 kg/m2 | 2706 (40.2%) | 2813 (49.7%) | |
| BMI 28–33 kg/m2 | 1781 (27.8%) | 1809 (32.0%) | |
| BMI > 33 kg/m2 | 962 (14.3%) | 500 (8.8%) | |
| Abdominal circumference (mean ± SD), cm | 92.3 ± 12.7 | 101.4 ± 10.8 | <0.001 c |
| Central adiposity (abnormal abdominal circumference) (n, %) | 4262 (63.2%) | 2639 (46.6%) | <0.001 b |
| Laboratory Parameters | |||
| Glucose (mean ± SD), mg/dL | 97.1 ± 16.4 | 102.0 ± 19.8 | <0.001 c |
| Total Cholesterol (mean ± SD), mg/dL | 206.4 ± 38.0 | 187.2 ± 36.3 | <0.001 c |
| HDL Cholesterol (mean ± SD), mg/dL | 67.6 ± 17.9 | 54.5 ± 15.0 | <0.001 c |
| LDL Cholesterol (mean ± SD), mg/dL | 115.2 ± 35.0 | 109.5 ± 32.9 | <0.001 c |
| Triglycerides (mean ± SD), mg/dL | 117.8 ± 53.0 | 116.3 ± 58.4 | 0.146 c |
| eGFR (mean ± SD), mL/min/1.73 m2 | 70.4 ±14.1 | 70.5 ± 14.1 | 0.883 c |
| Cardiometabolic Conditions | |||
| T2DM, n (%) | 564 (8.4%) | 720 (12.7%) | <0.001 b |
| Hypertension, n (%) | 4929 (73.0%) | 4215 (74.4%) | 0.079 b |
| Chronic Kidney Disease, n (%) | 1961 (29.0%) | 1655 (29.2%) | 0.838 b |
| Dyslipidaemia, n (%) | 5946 (88.1%) | 4296 (75.8%) | <0.001 b |
| Physical Function | |||
| Deficit-Accumulation Frailty Index | <0.001 b | ||
| Not Frail | 2934 (43.7%) | 3364 (59.6%) | |
| Pre-Frail | 2769 (41.2%) | 1885 (33.4%) | |
| Frail | 1015 (15.1%) | 396 (7.0%) | |
| Gait Speed (mean ± SD), m/s | 1.09 ± 0.3 | 1.0 ± 0.2 | <0.001 c |
| Low Gait Speed, n (%) | 598 (8.9%) | 725 (12.8%) | <0.001 b |
| Grip Strength (mean ± SD), kg | 20.1 ± 5.2 | 33.6 ± 8.0 | <0.001 c |
| Low Grip Strength, n (%) | 1384 (20.5%) | 1091 (19.3%) | 0.078 b |
| Neurocognitive Health | |||
| 3MS Score (mean ± SD) | 94.9 ± 4.5 | 93.4 ± 5.1 | <0.001 c |
| CESD score ≥ 8, n (%) | 1280 (19.6%) | 745 (13.6%) | <0.001 b |
| Dietary Scores | |||
| ASPREE-MDS (Median [IQR]) | 11.6 (10.3–12.9) | 10.9 (9.4–12.2) | <0.001 a |
| ASPREE-UPF (Median [IQR]) | 5.8 (4.8–7.0) | 6.5 (5.3–7.7) | <0.001 a |
| ASPREE-MDS Dietary Components | Q1 (3.3–9.8) (n = 3102) | Q2 (9.8–11.3) (n = 3096) | Q3 (11.3–12.6) (n = 3110) | Q4 (12.6–16.4) (n = 3086) | p a | Female (Median: 11.6) (n = 6736) | Male (Medan: 10.9) (n = 5492) | p b |
|---|---|---|---|---|---|---|---|---|
| Vegetable Intake Score (Includes green vegetables and other vegetables) | 1.3 (0.9–1.7) | 1.6 (1.3–1.8) | 1.7 (1.6–1.9) | 1.8 (1.6–1.9) | <0.001 | Median: 1.7 Q1: 0.0–1.3 Q4: 1.9–2.0 | Median 1.6 Q1: 0.0–1.3 Q4: 1.8–2.0 | <0.001 |
| Fruit Intake Score (Includes fresh and canned/tinned Fruits) | 0.8 (0.3–1.0) | 1.0 (0.7–1.0) | 1.0 (1.0–1.0) | 1.0 (1.0–1.0) | <0.001 | Median: 1.0 Q1: 0.0–1.0 Q4: 1.0–1.0 | Median: 1.0 Q1: 0.0–0.7 Q4: 1.0–1.0 | <0.001 |
| Cereal and Grain Intake Score (Includes brown bread, pasta, rice, and cereal) | 0.4 (0.3–0.6) | 0.6 (0.3–0.7) | 0.6 (0.4–0.7) | 0.7 (0.6–0.8) | <0.001 | Median: 0.6 Q1: 0.0–0.3 Q4: 0.7–1.0 | Median: 0.6 Q1: 0.0–0.3 Q4: 0.7–1.0 | <0.001 |
| Fish/Seafood Intake Score (Includes oily/tinned fish and white fish scores) | 0.8 (0.3–1.3) | 1.3 (0.8–1.5) | 1.5 (1.3–2.0) | 2.0 (1.5–2.0) | <0.001 | Median: 1.5 Q1: 0.0–1.0 Q4: 1.8–2.0 | Median: 1.3 Q1: 0.0–0.8 Q4: 1.8–2.0 | <0.001 |
| Unprocessed Meat Intake Score (Includes unprocessed red meat and poultry) | 1.3 (1.0–1.7) | 1.3 (1.0–1.7) | 1.3 (1.3–1.7) | 1.7 (1.3–1.7) | <0.001 | Median: 1.3 Q1: 0.0–1.3 Q4: 1.7–2.0 | Median: 1.3 Q1: 0.0–1.3 Q4: 1.7–2.0 | <0.001 |
| Other Protein Intake Score (Includes eggs, nuts, and beans/legumes) | 1.5 (1.0–2.0) | 2.0 (1.5–2.0) | 2.0 (1.5–2.5) | 2.5 (2.0–3.0) | <0.001 | Median: 2.0 Q1: 0.0–1.5 Q4: 2.5–3.0 | Median: 2.0 Q1: 0.0–1.5 Q4: 2.5–3.0 | <0.001 |
| Dairy Intake Score (Includes cow’s milk, yoghurt, and cheese) | 1.3 (1.0–1.8) | 1.8 (1.5–2.2) | 2.0 (1.8–2.5) | 2.5 (2.0–2.8) | <0.001 | Median: 2.0 Q1: 0.0–1.5 Q4: 2.5–3.0 | Median: 1.8 Q1: 0.0–1.3 Q4: 2.3–3.0 | <0.001 |
| Beverage Intake Score (Water as predominant beverage) | 1.0 (0.5–1.0) | 1.0 (0.5–1.0) | 1.0 (1.0–1.0) | 1.0 (1.0–1.0) | <0.001 | Median: 1.0 Q1: 0.0–1.0 Q4: 1.0–1.0 | Median: 1.0 Q1: 0.0–0.5 Q4: 1.0–1.0 | <0.001 |
| Olive Oil Score | 0.0 (0.0–1.0) | 1.0 (0.0–1.0) | 1.0 (0.0–1.0) | 1.0 (1.0–1.0) | <0.001 | Median: 1.0 Q1: 0.0–0.0 Q4: 1.0–1.0 | Median: 1.0 Q1: 0.0–0.0 Q4: 1.0–1.0 | <0.001 |
| Processed Snack Intake Score | 0.0 (0.0–0.0) | 0.0 (0.0–0.0) | 0.0 (0.0–0.0) | 0.0 (0.0–0.0) | <0.001 | Median: 0.0 Q1: 0.0–0.0 Q4: 0.0–1.0 | Median: 0.0 Q1: 0.0–0.0 Q4: 0.0–1.0 | 0.060 |
| Processed Meat and ‘Junk food’ Score | 0.0 (0.0–0.3) | 0.0 (0.0–0.3) | 0.0 (0.0–0.3) | 0.0 (0.0–0.7) | <0.001 | Median: 0.0 Q1: 0.0–0.0 Q4: 0.3–1.0 | Median: 0.0 Q1: 0.0–0.0 Q4: 0.0–1.0 | <0.001 |
| ASPREE-MDS | Q1 (3.3–9.8) (n = 3102) | Q2 (9.8–11.3) (n = 3096) | Q3 (11.3–12.6) (n = 3110) | Q4 (12.6–16.4) (n = 3086) | p |
|---|---|---|---|---|---|
| Age (Median [IQR]), years | 77.3 (74.8–80.9) | 77.0 (74.7–80.5) | 76.7 (74.5–80.1) | 76.3 (74.4–79.6) | <0.001 a |
| Female Sex, (n, %) | 1293 (41.7%) | 1650 (53.2%) | 1762 (56.7%) | 2021 (65.8%) | <0.001 b |
| Caucasian Ethnicity, n (%) | 3066 (98.9%) | 3063 (98.8%) | 3072 (98.8%) | 3041 (98.5%) | 0.543 b |
| Education Completion | <0.001 b | ||||
| ≤11 years of education, (n, %) | 1779 (57.4%) | 1571 (50.7%) | 1420 (45.7%) | 1226 (39.7%) | |
| 12 years of education, (n, %) | 349 (11.3%) | 329 (10.6%) | 335 (10.8%) | 327 (10.6%) | |
| ≥13 years of education, (n, %) | 971 (31.3%) | 1199 (38.7%) | 1355 (43.6%) | 1533 (49.7%) | |
| Lifestyle Factors | |||||
| Currently Drinking Alcohol (n, %) | 2123 (68.6%) | 2294 (74.0%) | 2350 (75.6%) | 2362 (76.6%) | <0.001 b |
| Currently Smoking (n, %) | 130 (4.2%) | 70 (2.3%) | 62 (2.0%) | 33 (1.1%) | <0.001 b |
| Living Situation | 0.057 b | ||||
| Home alone (n, %) | 1071 (34.6%) | 1018 (32.8%) | 975 (31.4%) | 1032 (33.4%) | |
| Home with spouse/friends/family (n, %) | 2028 (65.4%) | 2081 (67.2%) | 2135 (68.6%) | 2054 (66.6%) | |
| BMI (mean ± SD), kg/m2 | 27.9 ± 4.5 | 27.9 ± 4.7 | 27.5 ± 4.5 | 27.2 ± 4.5 | 0.085 c <0.001 b |
| BMI Categories (n, %) | |||||
| BMI < 23 kg/m2 | 393 (12.7%) | 379 (12.3%) | 454 (14.6%) | 508 (16.5%) | |
| BMI 23–28 kg/m2 | 1304 (42.2%) | 1383 (44.7%) | 1412 (45.5%) | 1409 (45.7%) | |
| BMI 28–33 kg/m2 | 994 (32.1%) | 930 (30.1%) | 899 (28.9%) | 853 (27.7%) | |
| BMI > 33 kg/m2 | 401 (13.0%) | 401 (13.0%) | 341 (11.0%) | 314 (10.2%) | |
| Abdominal circumference (mean ± SD), cm | 98.6 ± 12.6 | 97.3 ± 12.7 | 95.8 ± 12.6 | 94.0 ± 12.5 | 0.768 c |
| Central adiposity (abnormal abdominal circumference (n, %) | 1778 (57.4%) | 1814 (58.5%) | 1686 (54.2%) | 1611 (52.2%) | <0.001 b |
| Laboratory Parameters | |||||
| Glucose (mean ± SD), mg/dL | 100.8 ± 19.7 | 99.9 ± 19.0 | 98.6 ± 17.0 | 98.0 ± 16.7 | <0.001 c |
| Total Cholesterol (mean ± SD), mg/dL | 192.0 ± 37.8 | 197.1 ± 38.4 | 199.4 ± 38.8 | 202.0 ± 38.1 | 0.480 c |
| HDL Cholesterol (mean ± SD), mg/dL | 58.9 ± 17.4 | 60.5 ±17.6 | 62.7 ± 17.8 | 64.4 ± 18.1 | 0.112 c |
| LDL Cholesterol (mean ± SD), mg/dL | 108.6 ± 33.8 | 112.8 ± 34.0 | 113.7 ± 34.3 | 115.4 ± 34.1 | 0.867 c |
| Triglycerides (mean ± SD), mg/dL | 122.7 ± 58.3 | 120.0 ± 55.8 | 114.8 ± 56.2 | 110.9 ± 50.8 | <0.001 c |
| eGFR (mean ± SD), mL/min/1.73 m2 | 68.5 ± 14.9 | 70.1 ± 13.8 | 71.0 ± 13.9 | 72.0 ± 13.4 | <0.001 c |
| Cardiometabolic Conditions | |||||
| T2DM, n (%) | 369 (11.9%) | 343 (11.1%) | 286 (9.2%) | 281 (9.1%) | <0.001 b |
| Hypertension, n (%) | 2380 (76.8%) | 2329 (75.2%) | 2256 (72.5%) | 2161 (70.0%) | <0.001 b |
| Chronic Kidney Disease, n (%) | 1041 (33.6%) | 928 (29.9%) | 860 (27.7%) | 773 (25.0%) | <0.001 b |
| Dyslipidaemia, n (%) | 2496 (80.5%) | 2553 (82.4%) | 2606 (83.8%) | 2568 (83.2%) | 0.005 |
| Physical Function | |||||
| Deficit-Accumulation Frailty Index | <0.001 b | ||||
| Not Frail | 1439 (46.7%) | 1513 (49.0%) | 1611 (52.0%) | 1728 (56.2%) | |
| Pre-Frail | 1222 (39.7%) | 1200 (38.8%) | 1168 (37.7%) | 1056 (34.4%) | |
| Frail | 418 (13.6%) | 376 (12.2%) | 321 (10.4%) | 290 (9.4%) | |
| Gait Speed (mean ± SD), m/s | 1.1 ± 0.3 | 1.1 ± 0.3 | 1.0 ± 0.3 | 1.0 ± 0.3 | <0.001 c |
| Low Gait Speed, n (%) | 266 (8.6%) | 311 (10.0%) | 352 (11.3%) | 393 (12.7%) | <0.001 b |
| Grip Strength (mean ± SD), kg | 27.3 ± 9.7 | 26.3 ± 9.5 | 26.3 ± 9.5 | 25.2 ± 9.0 | 0.001 c |
| Low Grip Strength, n (%) | 717 (23.2%) | 637 (20.6%) | 567 (18.2%) | 549 (17.8%) | <0.001 b |
| Neurocognitive Health | |||||
| 3MS Score (mean ± SD) | 93.3 ± 5.2 | 94.2 ± 4.6 | 94.4 ± 4.7 | 95.0 ± 4.3 | <0.001 c |
| CESD score ≥ 8, n (%) | 549 (18.4%) | 511 (17.0%) | 516 (17.1%) | 443 (14.8%) | 0.003 b |
| Dietary Scores | |||||
| ASPREE-UPF (Median [IQR]) | 5.9 (4.8–7.1) | 6 (4.9–7.4) | 6.3 (5–7.4) | 6.1 (5–7.3) | <0.001 a |
| ASPREE-UPF Dietary Components | Q1 (0.3–4.9) (n = 3037) | Q2 (5.0–6.0) (n = 3009) | Q3 (6.1–7.3) (n = 3034) | Q4 (7.3–14.7) (n = 2882) | p a | Female (Median: 5.8) (n = 6470) | Male (Median: 6.5) (n = 5492) | p b |
|---|---|---|---|---|---|---|---|---|
| Sweetened/Processed Drinks (Includes malt, hot chocolate, cordial, soft drink, diet soft drink, and supplemental drinks) | 0.0 (0.0–0.3) | 0.0 (0.0–0.3) | 0.3 (0.0–0.5) | 0.5 (0.3–0.8) | <0.001 | Median: 0.0 Q1: 0.0–0.0 Q4: 0.8–6.0 | Median: 0.3 Q1: 0.0–0.0 Q4: 1.0–6.0 | <0.001 |
| Other Processed Drinks (Includes non-dairy milk and juice) | 0.0 (0.0–0.3) | 0.3 (0.0–0.5) | 0.3 (0.0–0.5) | 0.5 (0.3–0.8) | <0.001 | Median: 0.3 Q1: 0.0–0.0 Q4: 0.8–2.0 | Median: 0.3 Q1: 0.0–0.0 Q4: 0.8–2.0 | <0.001 |
| Breads (Includes white and brown breads) | 0.8 (0.5–1.0) | 1.0 (0.8–1.0) | 1.0 (0.8–1.0) | 1.0 (1.0–1.3) | <0.001 | Median: 1.0 Q1: 0.0–0.5 Q4: 1.3–2.0 | Median: 1.0 Q1: 0.0–0.8 Q4: 1.5–2.0 | <0.001 |
| Processed Meats and Related Foods (Includes burgers/pizza, pies, pre-packaged meals, sausages, and other processed meats) | 0.5 (0.3–0.8) | 0.8 (0.5–1.0) | 1.0 (0.8–1.3) | 1.4 (1.0–1.7) | <0.001 | Median: 0.8 Q1: 0.0–0.3 Q4: 1.5–3.8 | Median: 1.2 Q1: 0.0–0.5 Q4: 1.8–3.4 | <0.001 |
| Savoury Snacks (Includes crackers and chips) | 0.3 (0.3–0.5) | 0.5 (0.3–0.8) | 0.8 (0.5–1.0) | 0.8 (0.8–1.0) | <0.001 | Median: 0.5 Q1: 0.0–0.0 Q4: 1.0–2.0 | Median 0.8 Q1: 0.0–0.0 Q4: 1.3–2.0 | <0.001 |
| Sweetened Foods (Includes cakes, dark and milk chocolate, sweets/candy, cereal, and ice cream) | 1.5 (1.0–1.8) | 2.0 (1.8–2.5) | 2.5 (2.25–3.0) | 3.1 (2.8–3.5) | <0.001 | Median: 2.3 Q1: 0.0–1.0 Q4: 3.3–5.3 | Median: 2.5 Q1: 0.0–1.3 Q4: 3.5–5.5 | <0.001 |
| Processed Dairy (Includes yoghurt and cream cheese) | 0.5 (0.3–1.0) | 0.8 (0.5–1.0) | 0.8 (0.5–1.3) | 1.0 (0.5–1.3) | <0.001 | Median: 0.8 Q1: 0.0–0.3 Q4: 1.3–2.0 | Median 0.8 Q1: 0.0–0.0 Q4: 1.3–2.0 | <0.001 |
| ASPREE-UPF | Q1 (0.3–4.9) (n = 3037) | Q2 (5.0–6.0) (n = 3009) | Q3 (6.1–7.3) (n = 3034) | Q4 (7.3–14.7) (n = 2882) | p |
|---|---|---|---|---|---|
| Age (Median [IQR]), years | 76.5 (74.5–79.7) | 76.6 (74.6–80.0) | 76.9 (74.6–80.3) | 77.0 (74.6–80.7) | <0.001 a |
| Female Sex, (n, %) | 1959 (64.5%) | 1741 (57.9%) | 1585 (52.2%) | 1185 (41.1%) | <0.001 b |
| Caucasian Ethnicity, n (%) | 2979 (98.1%) | 2974 (98.8%) | 3003 (99.0%) | 2862 (99.3%) | <0.001 b |
| Education Completion | 0.126 b | ||||
| ≤11 years of education, (n, %) | 1432 (47.2%) | 1484 (49.3%) | 1475 (48.6%) | 1335 (46.3%) | |
| 12 years of education, (n, %) | 359 (11.8%) | 305 (10.1%) | 321 (10.6%) | 312 (10.8%) | |
| ≥13 years of education, (n, %) | 1246 (41.0%) | 1220 (40.5%) | 1238 (40.8%) | 1234 (42.8%) | |
| Lifestyle Factors | |||||
| Currently Drinking Alcohol (n, %) | 2226 (73.3%) | 2224 (73.9%) | 2270 (74.8%) | 2142 (74.3%) | 0.566 b |
| Currently Smoking (n, %) | 106 (3.5%) | 74 (2.5%) | 57 (1.9%) | 47 (1.6%) | <0.001 b |
| Living Situation | <0.001 b | ||||
| Home alone (n, %) | 1189 (39.2%) | 1026 (34.1%) | 930 (30.7%) | 776 (26.9%) | |
| Home with spouse/friends/family (n, %) | 1848 (60.8%) | 1983 (65.9%) | 2104 (69.3%) | 2106 (73.1%) | |
| BMI (mean ± SD), kg/m2 | 27.5 ± 4.7 | 27.7 ± 4.5 | 27.7 ± 4.6 | 27.6 ± 4.3 | 0.006 c 0.003 b |
| BMI Categories (n, %) | |||||
| BMI < 23 kg/m2 | 491 (16.2%) | 403 (13.4%) | 406 (13.4%) | 368 (12.8%) | |
| BMI 23–28 kg/m2 | 1289 (42.6%) | 1323 (44.1%) | 1354 (44.6%) | 1350 (46.9%) | |
| BMI 28–33 kg/m2 | 879 (29.0%) | 927 (30.9%) | 908 (29.9%) | 836 (29.0%) | |
| BMI > 33 kg/m2 | 370 (12.2%) | 349 (11.6%) | 365 (12.0%) | 327 (11.4%) | |
| Abdominal circumference (mean ± SD), cm | 94.9 ± 12.9 | 96.3 ± 12.7 | 96.9 ± 12.8 | 97.9 ± 12.2 | 0.019 c |
| Central adiposity (abnormal abdominal circumference (n, %) | 1703 (56.1%) | 1737 (57.7%) | 1672 (55.1%) | 1545 (53.6%) | 0.013 b |
| Laboratory Parameters | |||||
| Glucose (mean ± SD), mg/dL | 98.5 ± 17.0 | 99.6 ± 19.4 | 99.5 ± 17.8 | 99.6 ± 17.7 | <0.001 c |
| Total Cholesterol (mean ± SD), mg/dL | 200.5 ± 39.4 | 198.8 ± 38.8 | 196.5 ± 37.9 | 194.5 ± 37.4 | 0.019 c |
| HDL Cholesterol (mean ± SD), mg/dL | 64.3 ± 18.1 | 62.6 ± 17.8 | 60.8 ± 17.7 | 58.7 ± 17.2 | 0.073 c |
| LDL Cholesterol (mean ± SD), mg/dL | 113.3 ± 34.6 | 112.8 ± 34.7 | 111.8 ± 33.7 | 112.4 ± 33.4 | 0.081 c |
| Triglycerides (mean ± SD), mg/dL | 114.8 ± 53.8 | 116.8 ± 54.5 | 119.2 ± 58.1 | 117.7 ± 55.3 | <0.001 c |
| eGFR (mean ± SD), mL/min/1.73 m2 | 71.1 ± 14.0 | 70.9 ± 13.8 | 70.1 ± 14.1 | 69.7 ± 14.2 | 0.556 c |
| Cardiometabolic Conditions | |||||
| T2DM, n (%) | 298 (9.8%) | 291 (9.7%) | 341 (11.2%) | 289 (10.0%) | 0.165 b |
| Hypertension, n (%) | 2253 (74.2%) | 2226 (74.0%) | 2224 (73.3%) | 2101 (72.9%) | 0.655 b |
| Chronic Kidney Disease, n (%) | 860 (28.3%) | 846 (28.1%) | 884 (29.1%) | 866 (30.0%) | 0.343 b |
| Dyslipidaemia, n (%) | 2555 (84.1%) | 2515 (83.6%) | 2489 (82.0%) | 2314 (80.3%) | <0.001 b |
| Physical Function | |||||
| Deficit-Accumulation Frailty Index | 0.183 b | ||||
| Not Frail | 1576 (52.1%) | 1589 (53.0%) | 1508 (49.8%) | 1452 (50.6%) | |
| Pre-Frail | 1131 (37.4%) | 1097 (36.6%) | 1162 (38.4%) | 1087 (37.9%) | |
| Frail | 319 (10.5%) | 312 (10.4%) | 356 (11.8%) | 331 (11.5%) | |
| Gait Speed (mean ± SD), m/s | 1.1 ± 0.3 | 1.0 ± 0.3 | 1.1 ± 0.3 | 1.1 ± 0.3 | 0.007 c |
| Low Gait Speed (n, %) | 335 (11.0%) | 355 (11.8%) | 310 (10.2%) | 300 (10.4%) | 0.193 b |
| Grip Strength (mean ± SD), kg | 25.1 ± 8.9 | 26.0 ± 9.3 | 26.6 ± 9.5 | 28.0 ± 9.9 | <0.001 c |
| Low Grip Strength (n, %) | 544 (17.9%) | 567 (18.8%) | 612 (20.2%) | 606 (21.0%) | 0.013 b |
| Neurocognitive Health | |||||
| 3MS Score (mean ± SD) | 94.4 ± 4.7 | 94.7 ± 4.5 | 94.3 ± 4.8 | 94.1 ± 4.8 | 0.001 c |
| CESD score ≥ 8, n (%) | 437 (14.9%) | 457 (15.7%) | 498 (17.0%) | 530 (19.0%) | <0.001 b |
| Dietary Scores | |||||
| ASPREE-MDS (Median [IQR]) | 11.1 (9.6–12.5) | 11.3 (9.9–12.6) | 11.4 (9.9–12.6) | 11.4 (10.1–12.6) | <0.001 a |
| ASPREE-MDS | ASPREE-UPF | |||
|---|---|---|---|---|
| Univariate | Multivariate | Univariate | Multivariate | |
| T2DM * | OR 0.94 (95% CI 0.91–0.96) | aOR 0.99 (95% CI 0.96–1.02) | OR 1.01 (95% CI 0.98–1.04) | aOR 0.98 (95% CI 0.95–1.02) |
| Hypertension * | OR 0.93 (95% CI 0.91–0.95) | aOR 0.96 (95% CI 0.94–0.98) | OR 0.98 (95% CI 0.96–1.01) | aOR 0.97 (95% CI 0.94–0.99) |
| CKD * | OR 0.91 (95% CI 0.90–0.94) | aOR 0.94 (95% CI 0.92–0.96) | OR 1.02 (95% CI 1.00–1.05) | aOR 1.01 (95% CI 0.98–1.03) |
| Dyslipidaemia * | OR 1.03 (95% CI 1.01–1.06) | aOR 0.99 (95% CI 0.97–1.02) | OR 0.94 (95% CI 0.91–0.96) | aOR 0.98 (95% CI 0.95–1.01) |
| Deficit-Accumulation Frailty Index † | ||||
| Not Frail | Reference | Reference | Reference | Reference |
| Pre-Frail | RR 0.93 (95% CI 0.91–0.95) | aRR 0.93 (95% CI 0.91–0.95) | RR 1.01 (95% CI 0.99–1.03) | aRR 1.04 (95% CI 1.01–1.06) |
| Frail | RR 0.89 (95% CI 0.86–0.91) | aRR 0.88 (95% CI 0.86–0.91) | RR 1.04 (95% CI 1.00–1.07) | aRR 1.10 (95% CI 1.06–1.14) |
| Deficit-Accumulation Frailty Index § | ||||
| Not Frail | Reference | Reference | ||
| Pre-Frail | aRR 0.93 (95% CI 0.91–0.95) | aRR 1.05 (95% CI 1.02–1.07) | ||
| Frail | aRR 0.87 (95% CI 0.84–0.90) | aRR 1.11 (95% CI 1.07–1.16) | ||
Disclaimer/Publisher’s Note: The statements, opinions and data contained in all publications are solely those of the individual author(s) and contributor(s) and not of MDPI and/or the editor(s). MDPI and/or the editor(s) disclaim responsibility for any injury to people or property resulting from any ideas, methods, instructions or products referred to in the content. |
© 2024 by the authors. Licensee MDPI, Basel, Switzerland. This article is an open access article distributed under the terms and conditions of the Creative Commons Attribution (CC BY) license (https://creativecommons.org/licenses/by/4.0/).
Share and Cite
Clayton-Chubb, D.; Vaughan, N.V.; George, E.S.; Chan, A.T.; Roberts, S.K.; Ryan, J.; Phyo, A.Z.Z.; McNeil, J.J.; Beilin, L.J.; Tran, C.; et al. Mediterranean Diet and Ultra-Processed Food Intake in Older Australian Adults—Associations with Frailty and Cardiometabolic Conditions. Nutrients 2024, 16, 2978. https://doi.org/10.3390/nu16172978
Clayton-Chubb D, Vaughan NV, George ES, Chan AT, Roberts SK, Ryan J, Phyo AZZ, McNeil JJ, Beilin LJ, Tran C, et al. Mediterranean Diet and Ultra-Processed Food Intake in Older Australian Adults—Associations with Frailty and Cardiometabolic Conditions. Nutrients. 2024; 16(17):2978. https://doi.org/10.3390/nu16172978
Chicago/Turabian StyleClayton-Chubb, Daniel, Nicole V. Vaughan, Elena S. George, Andrew T. Chan, Stuart K. Roberts, Joanne Ryan, Aung Zaw Zaw Phyo, John J. McNeil, Lawrence J. Beilin, Cammie Tran, and et al. 2024. "Mediterranean Diet and Ultra-Processed Food Intake in Older Australian Adults—Associations with Frailty and Cardiometabolic Conditions" Nutrients 16, no. 17: 2978. https://doi.org/10.3390/nu16172978
APA StyleClayton-Chubb, D., Vaughan, N. V., George, E. S., Chan, A. T., Roberts, S. K., Ryan, J., Phyo, A. Z. Z., McNeil, J. J., Beilin, L. J., Tran, C., Wang, Y., Sevilla-Gonzalez, M., Wang, D. D., Kemp, W. W., Majeed, A., Woods, R. L., Owen, A. J., & Fitzpatrick, J. A. (2024). Mediterranean Diet and Ultra-Processed Food Intake in Older Australian Adults—Associations with Frailty and Cardiometabolic Conditions. Nutrients, 16(17), 2978. https://doi.org/10.3390/nu16172978