
The Validity and Feasibility of Utilizing the Photo-Assisted Dietary Intake Assessment among College Students and Elderly Individuals in China

 , and
, and 
Abstract
:
1. Introduction
2. Materials and Methods
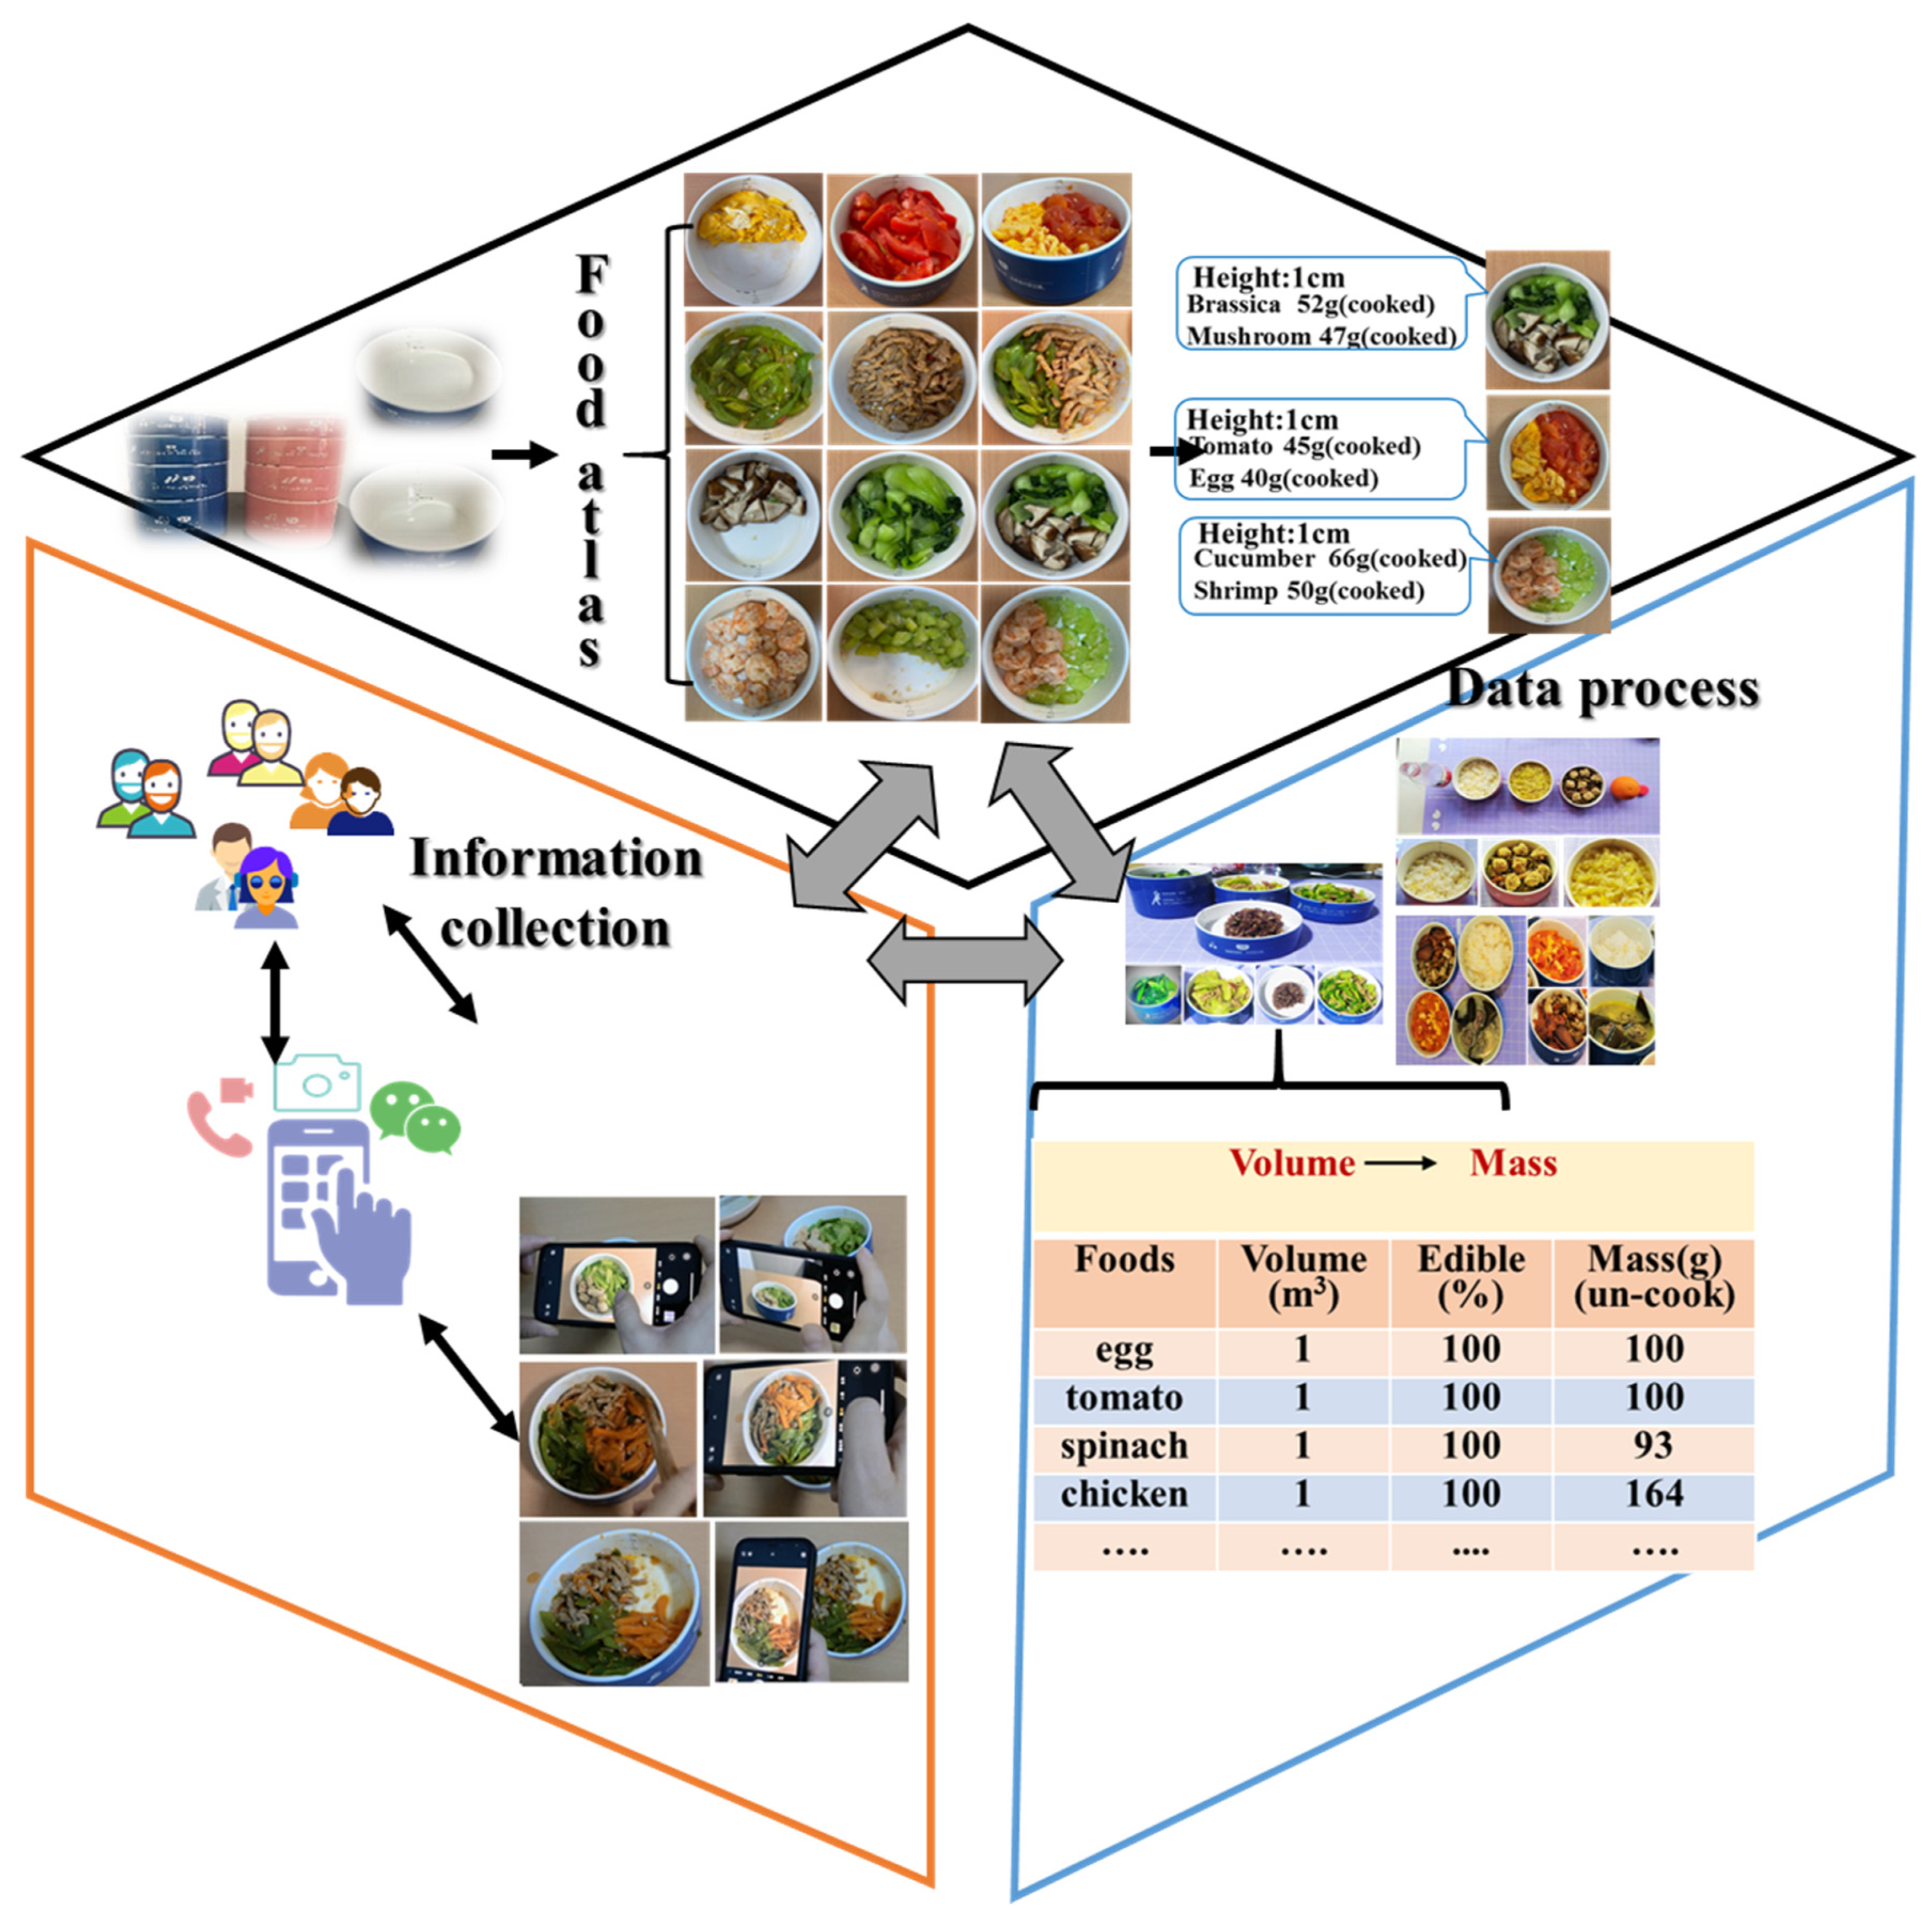
2.1. Overview of the Photo-Assisted Dietary Intake Assessment (PAD)
- (1)
- The collection of food items, including information on their processing and cooking methods;
- (2)
- The determination of the percentage of edible portions of foods and the raw/cooked ratio;
- (3)
- The determination of sizing references and portion sizes;
- (4)
- The documentation of food pictures;
- (5)
- The compilation of these food pictures to form the food atlas.
2.2. Validation of the PAD
2.2.1. Participants
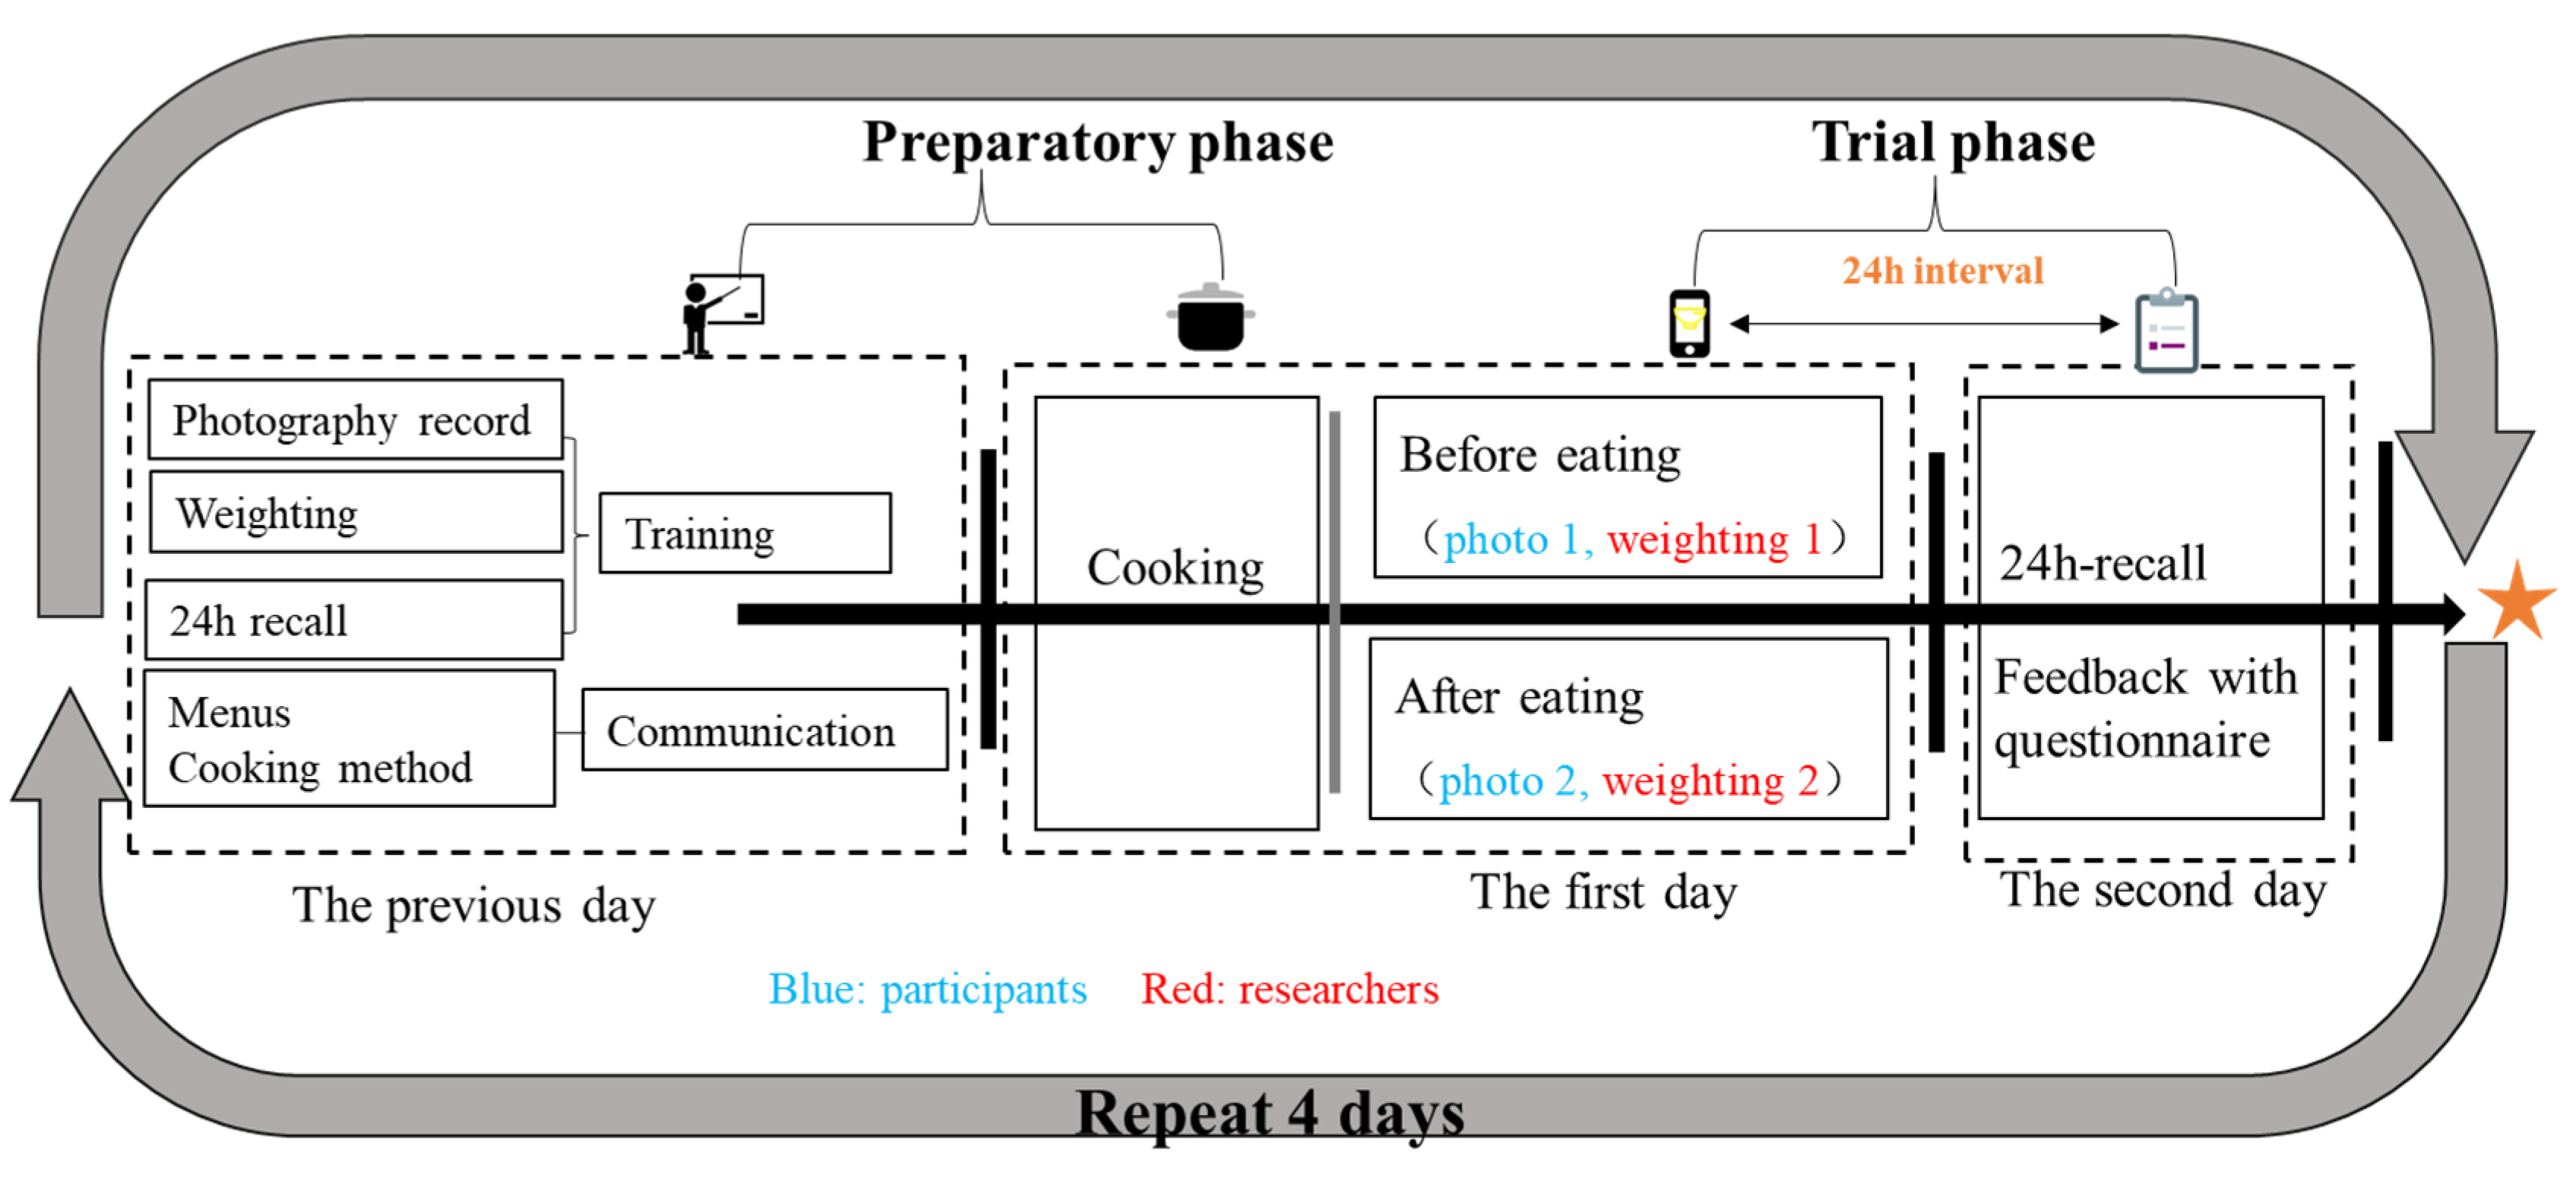
2.2.2. Study Design
2.2.3. Dinner Preparation and Food Weighing
2.2.4. The PAD Method
2.2.5. The 24-H Recall Method
2.3. Application of the PAD Method
2.3.1. Participants
2.3.2. Study Design
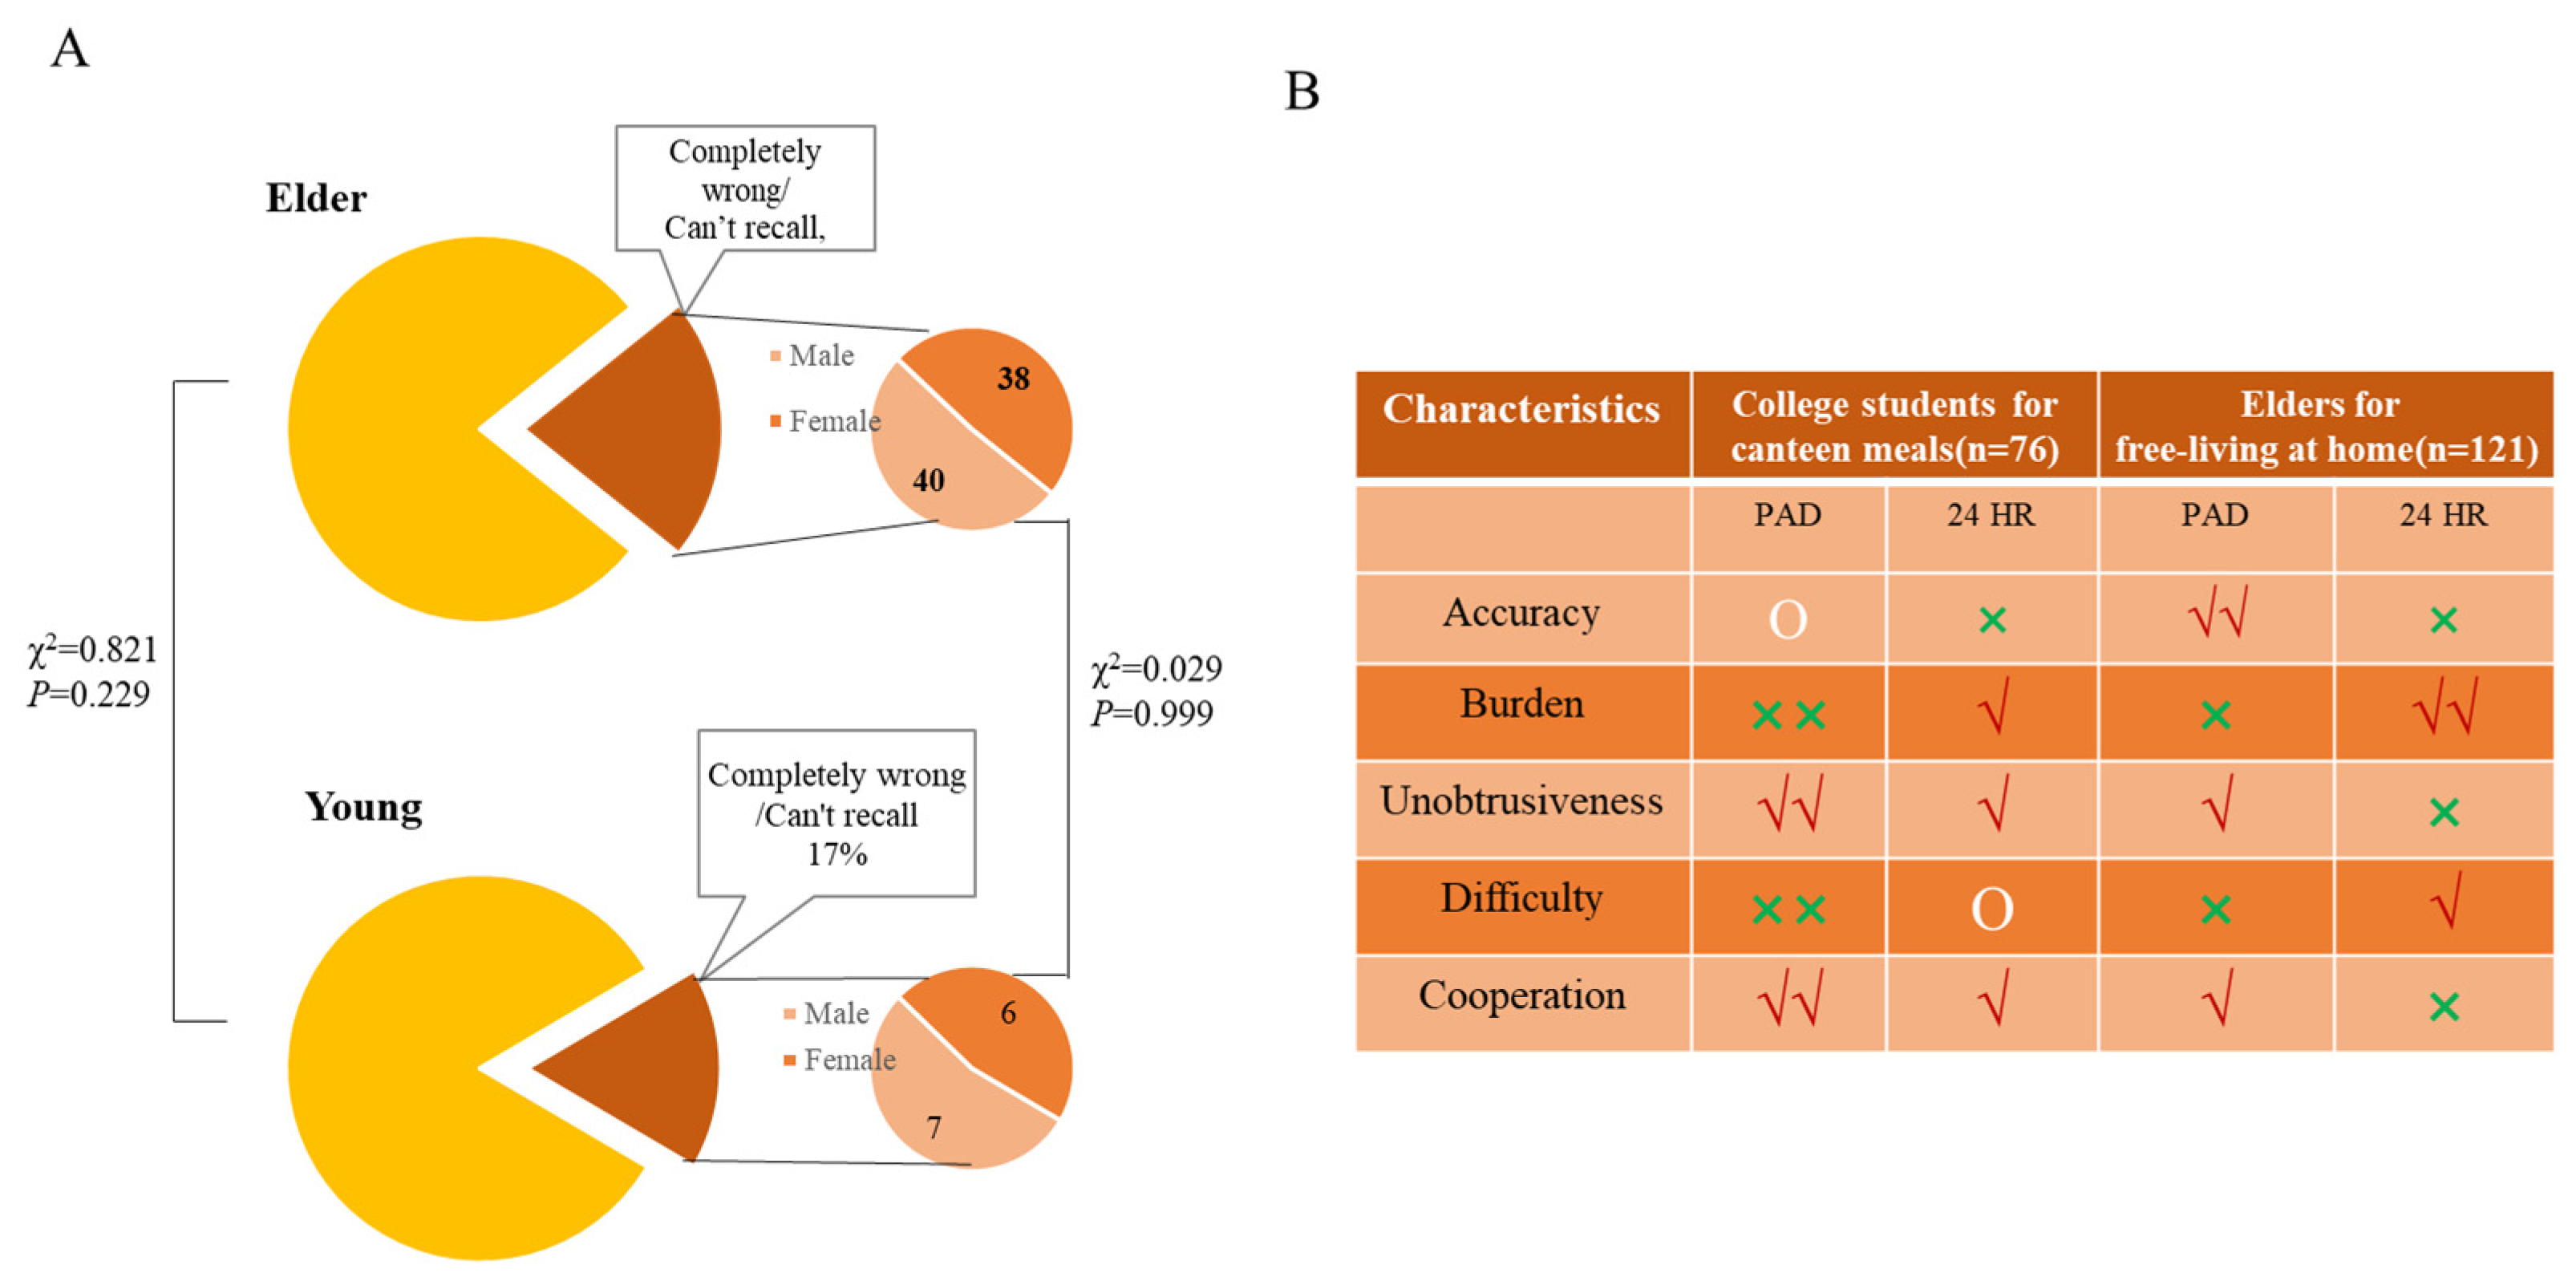
2.4. Feedback on the PAD Application
2.5. Quality Control
2.6. Statistical Analysis
3. Results
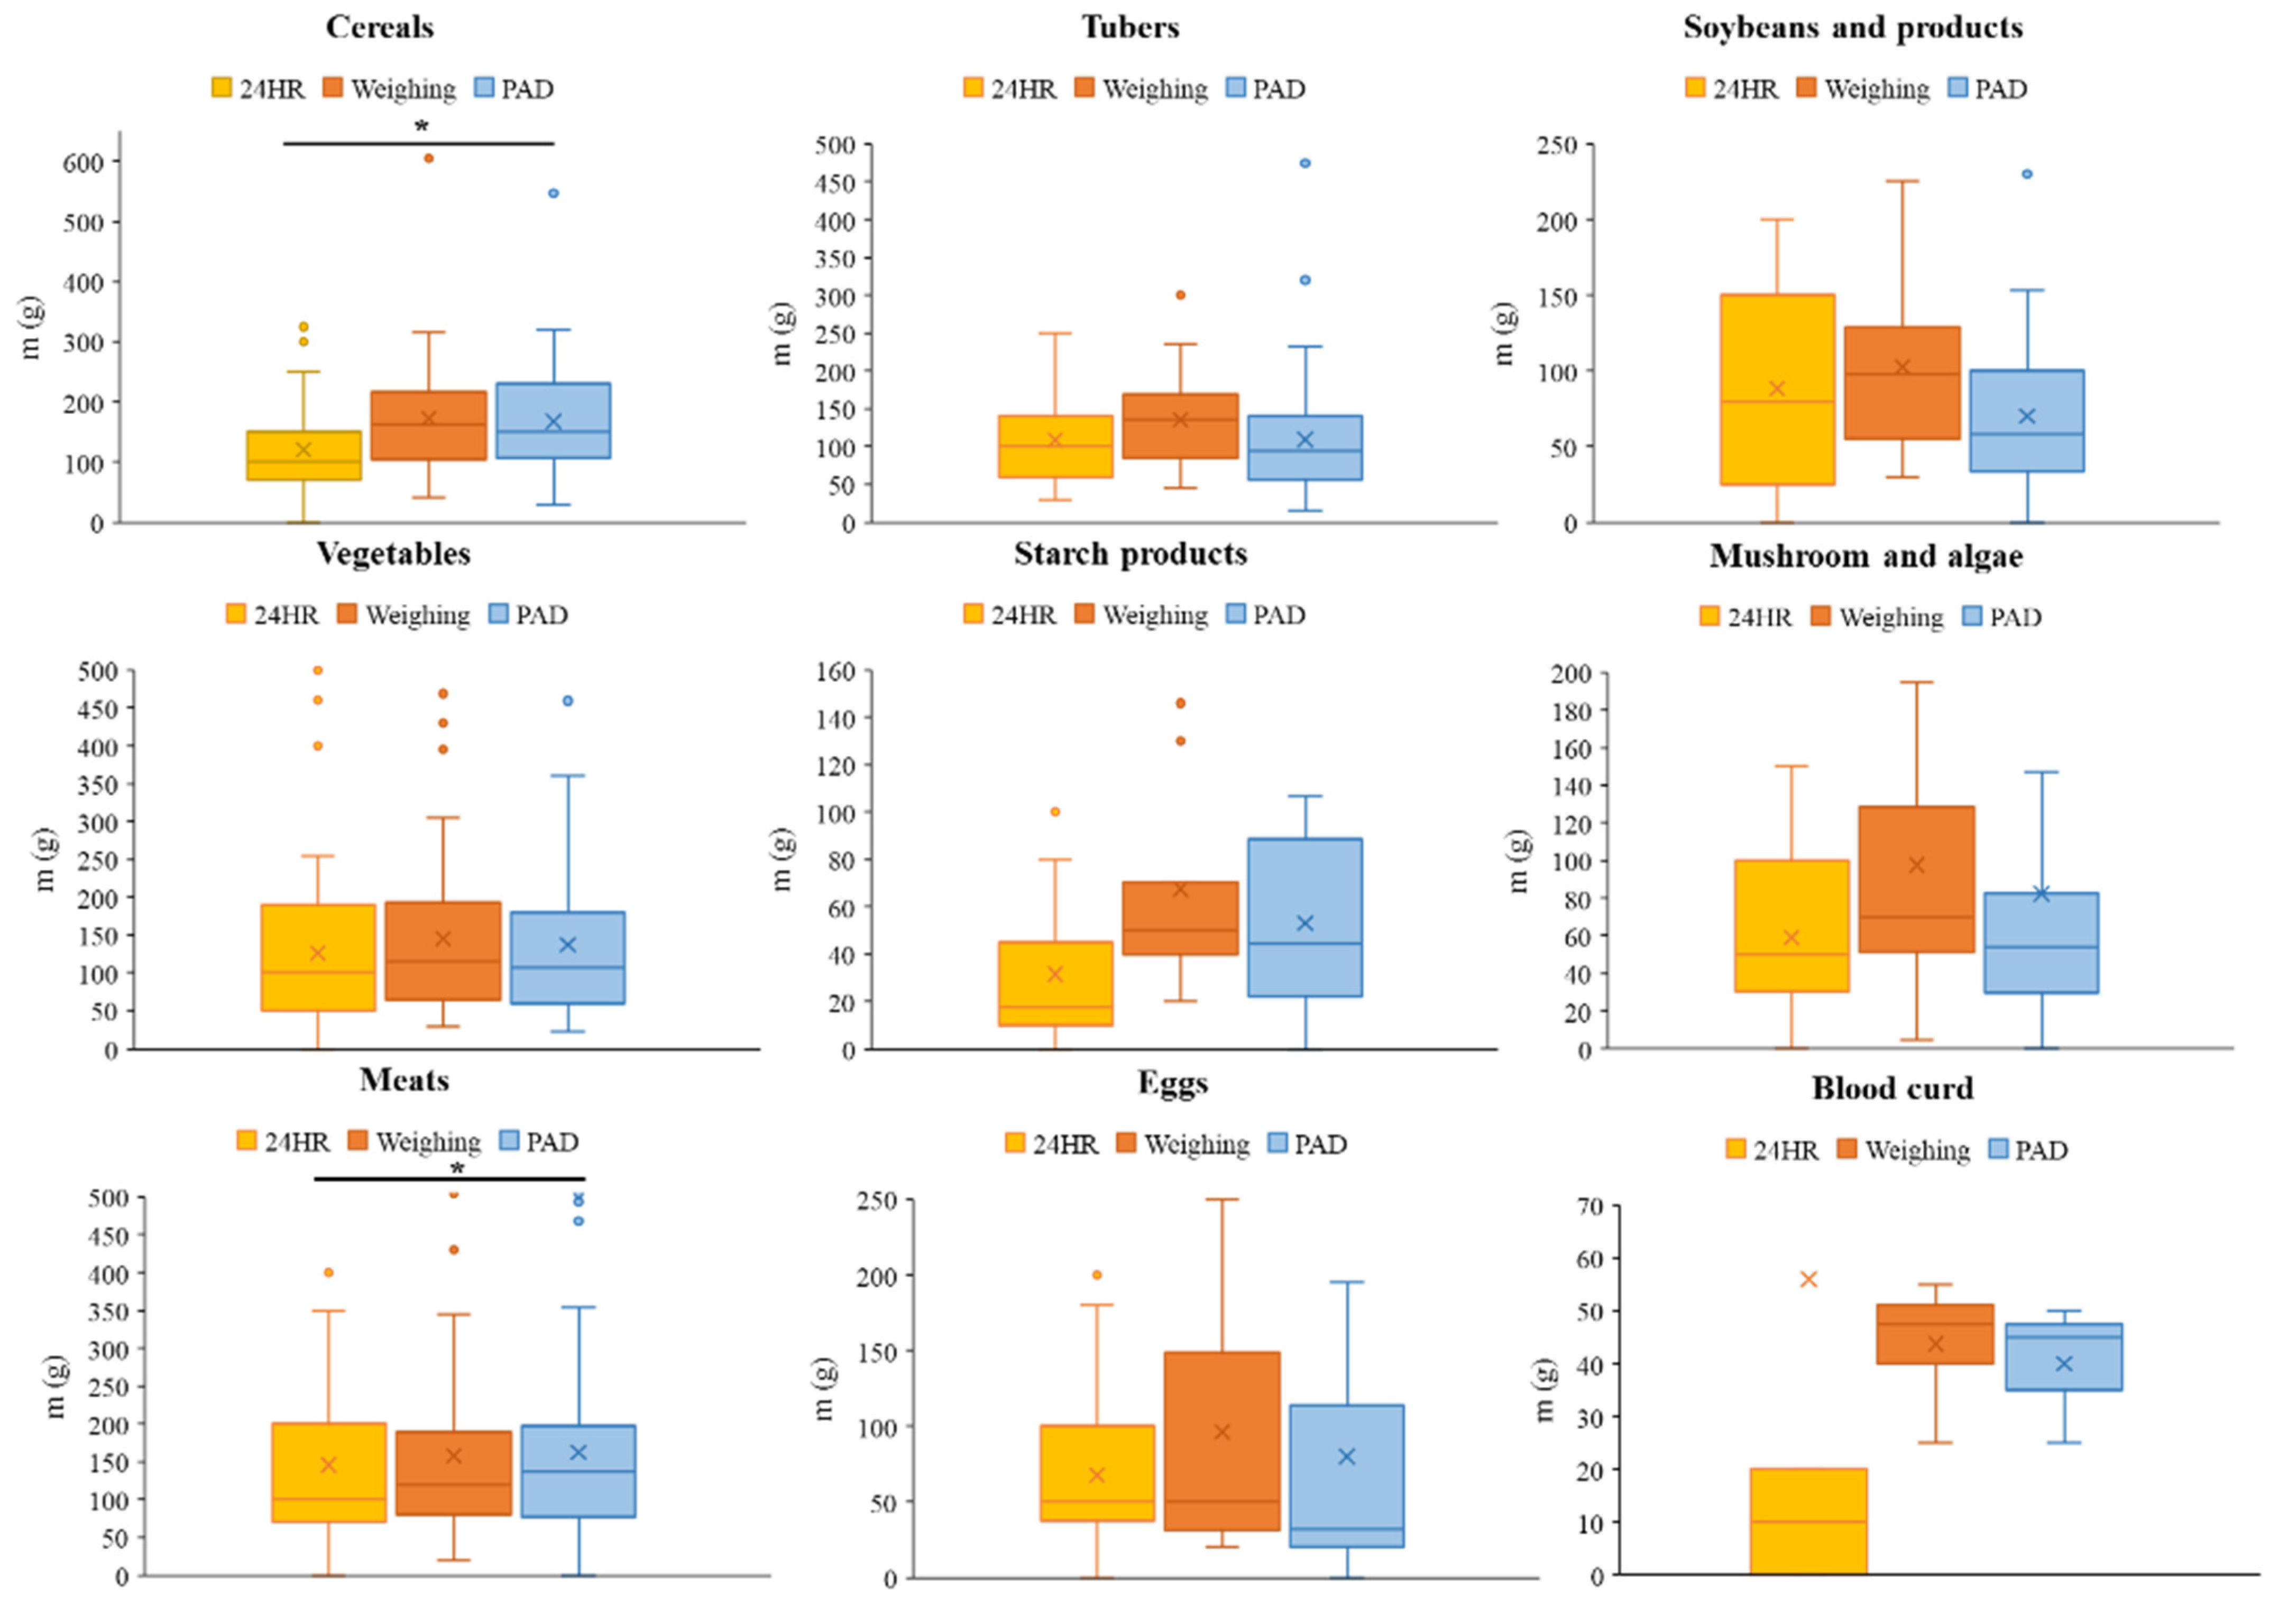
3.1. Comparison between the Weighing and PAD Methods in Terms of Food Weights
3.2. Comparison and Correlation Analysis among Different Methods
3.2.1. The Analysis of Food Weights Estimated Using the 24 HR or PAD Method Versus the Actual Food Weights
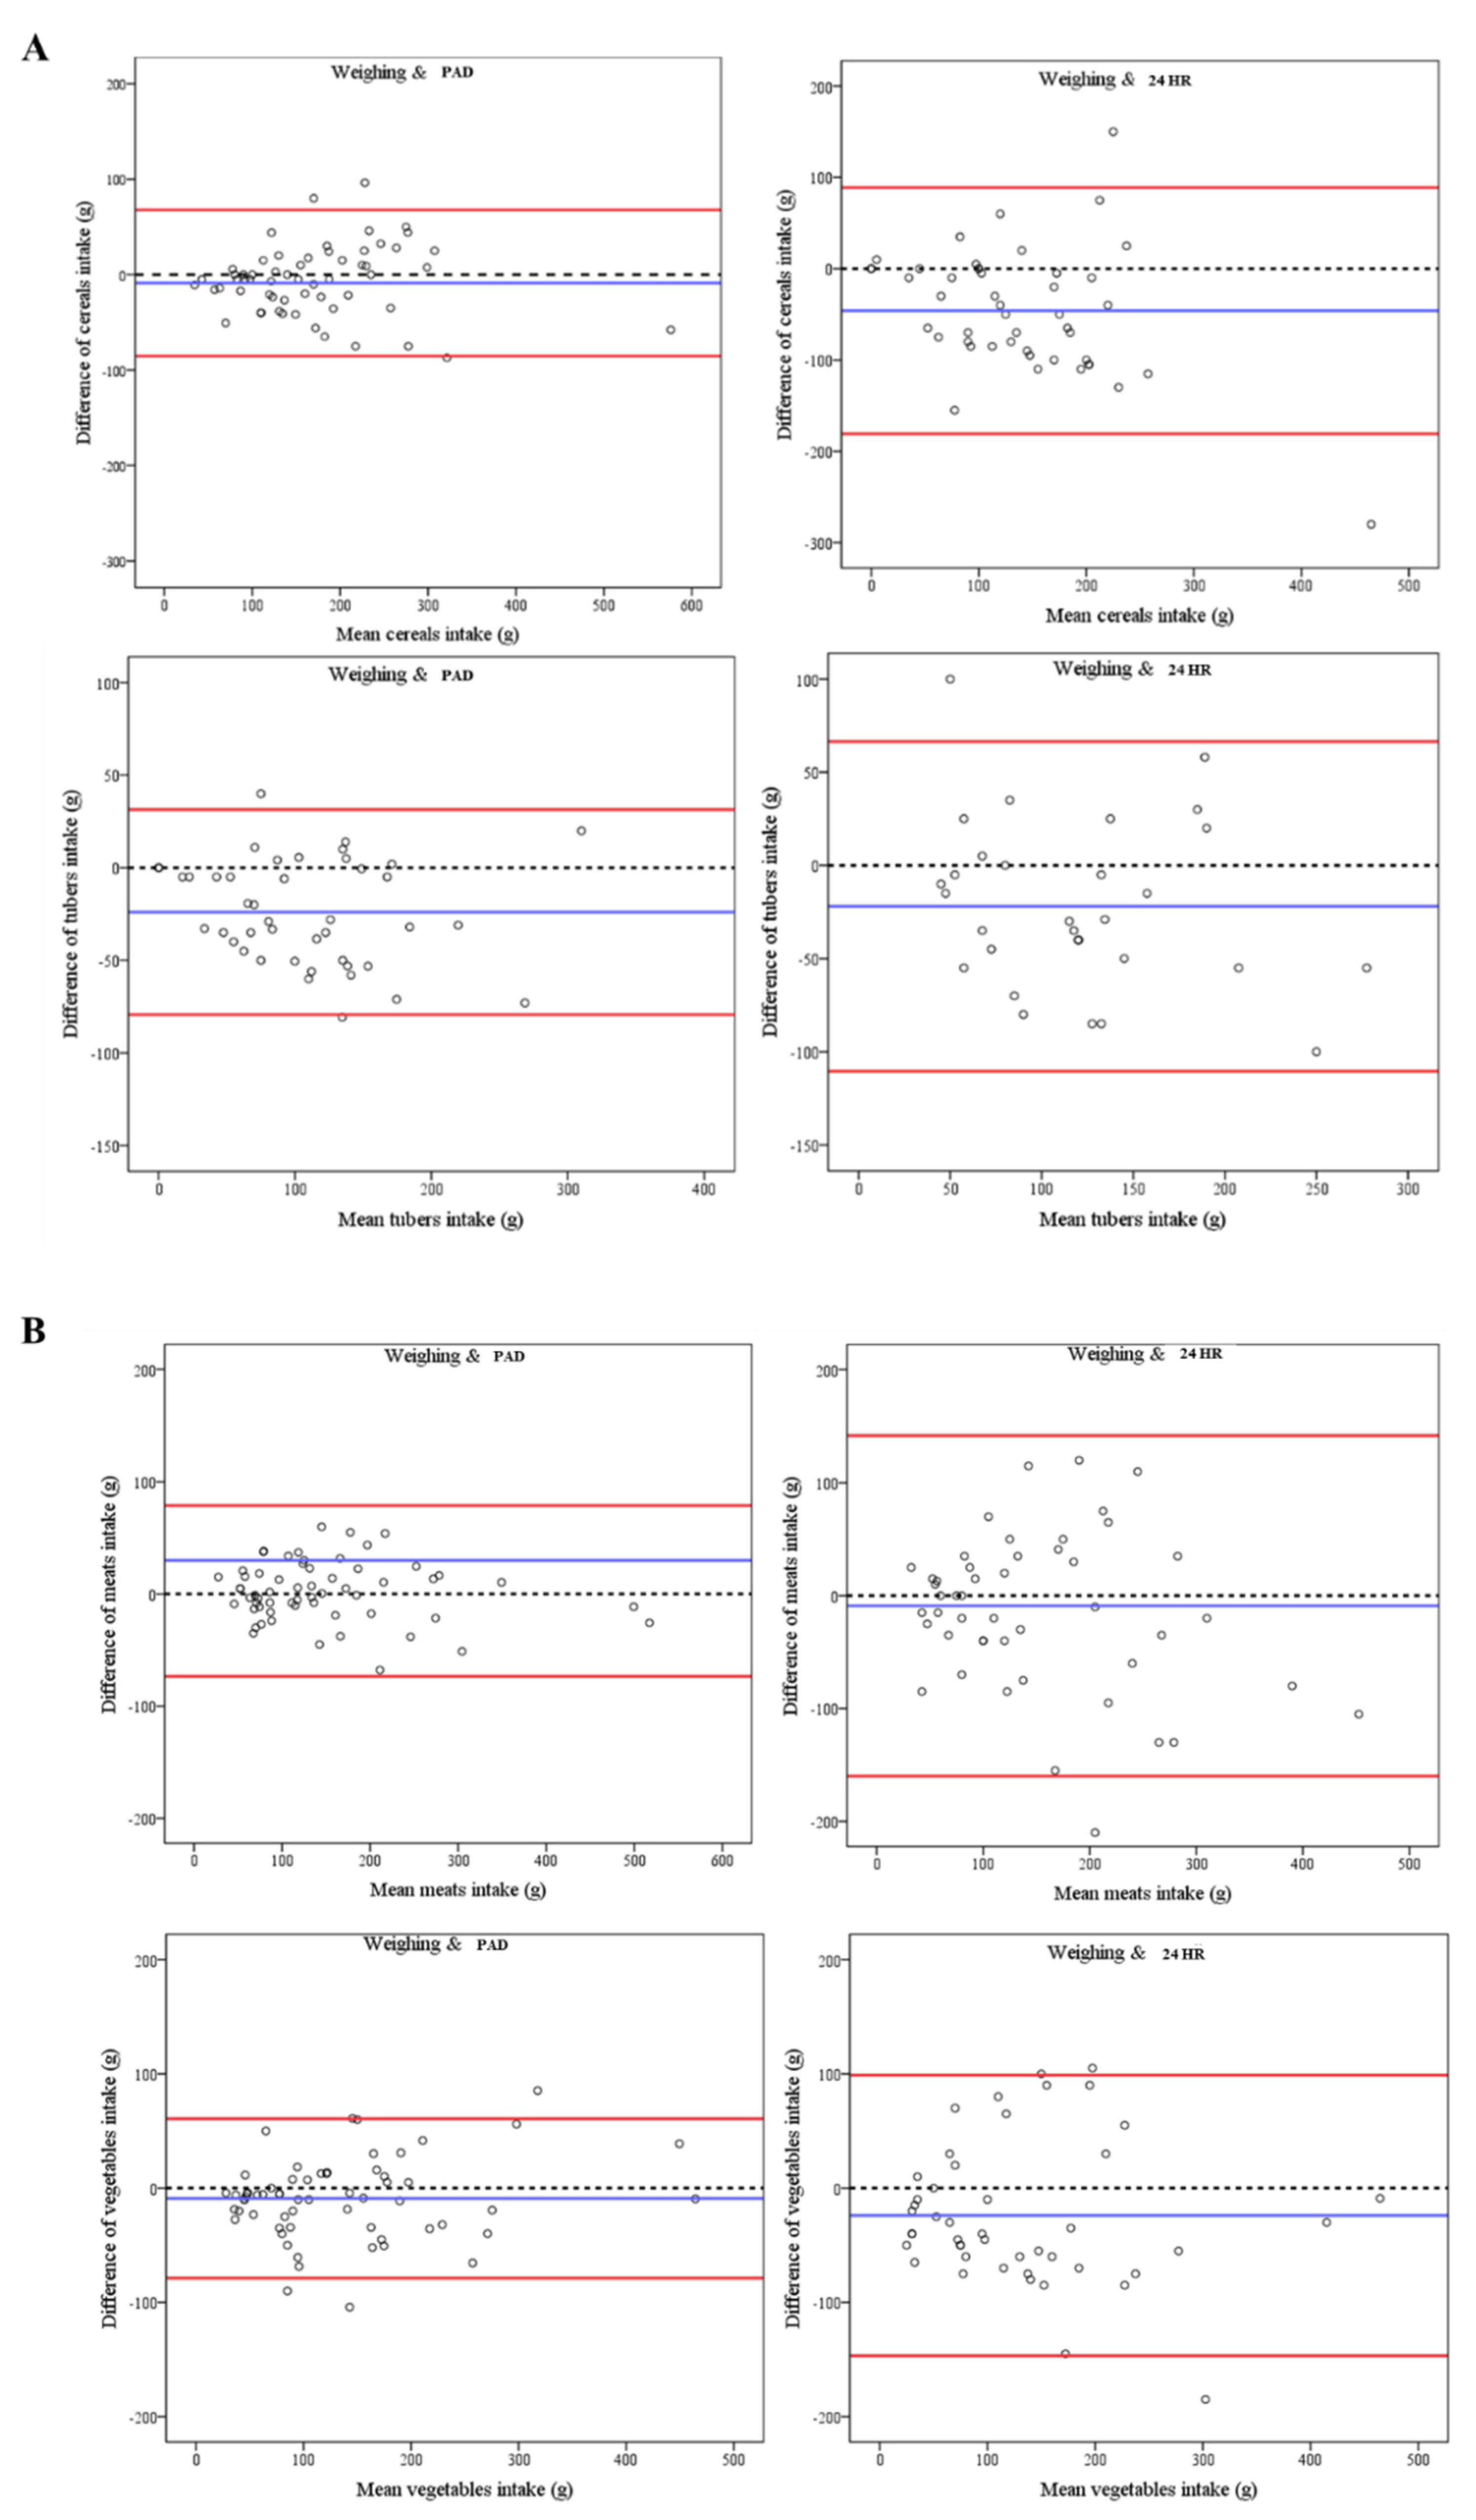
3.2.2. The correlation and Bland–Altman Analysis among Different Methods
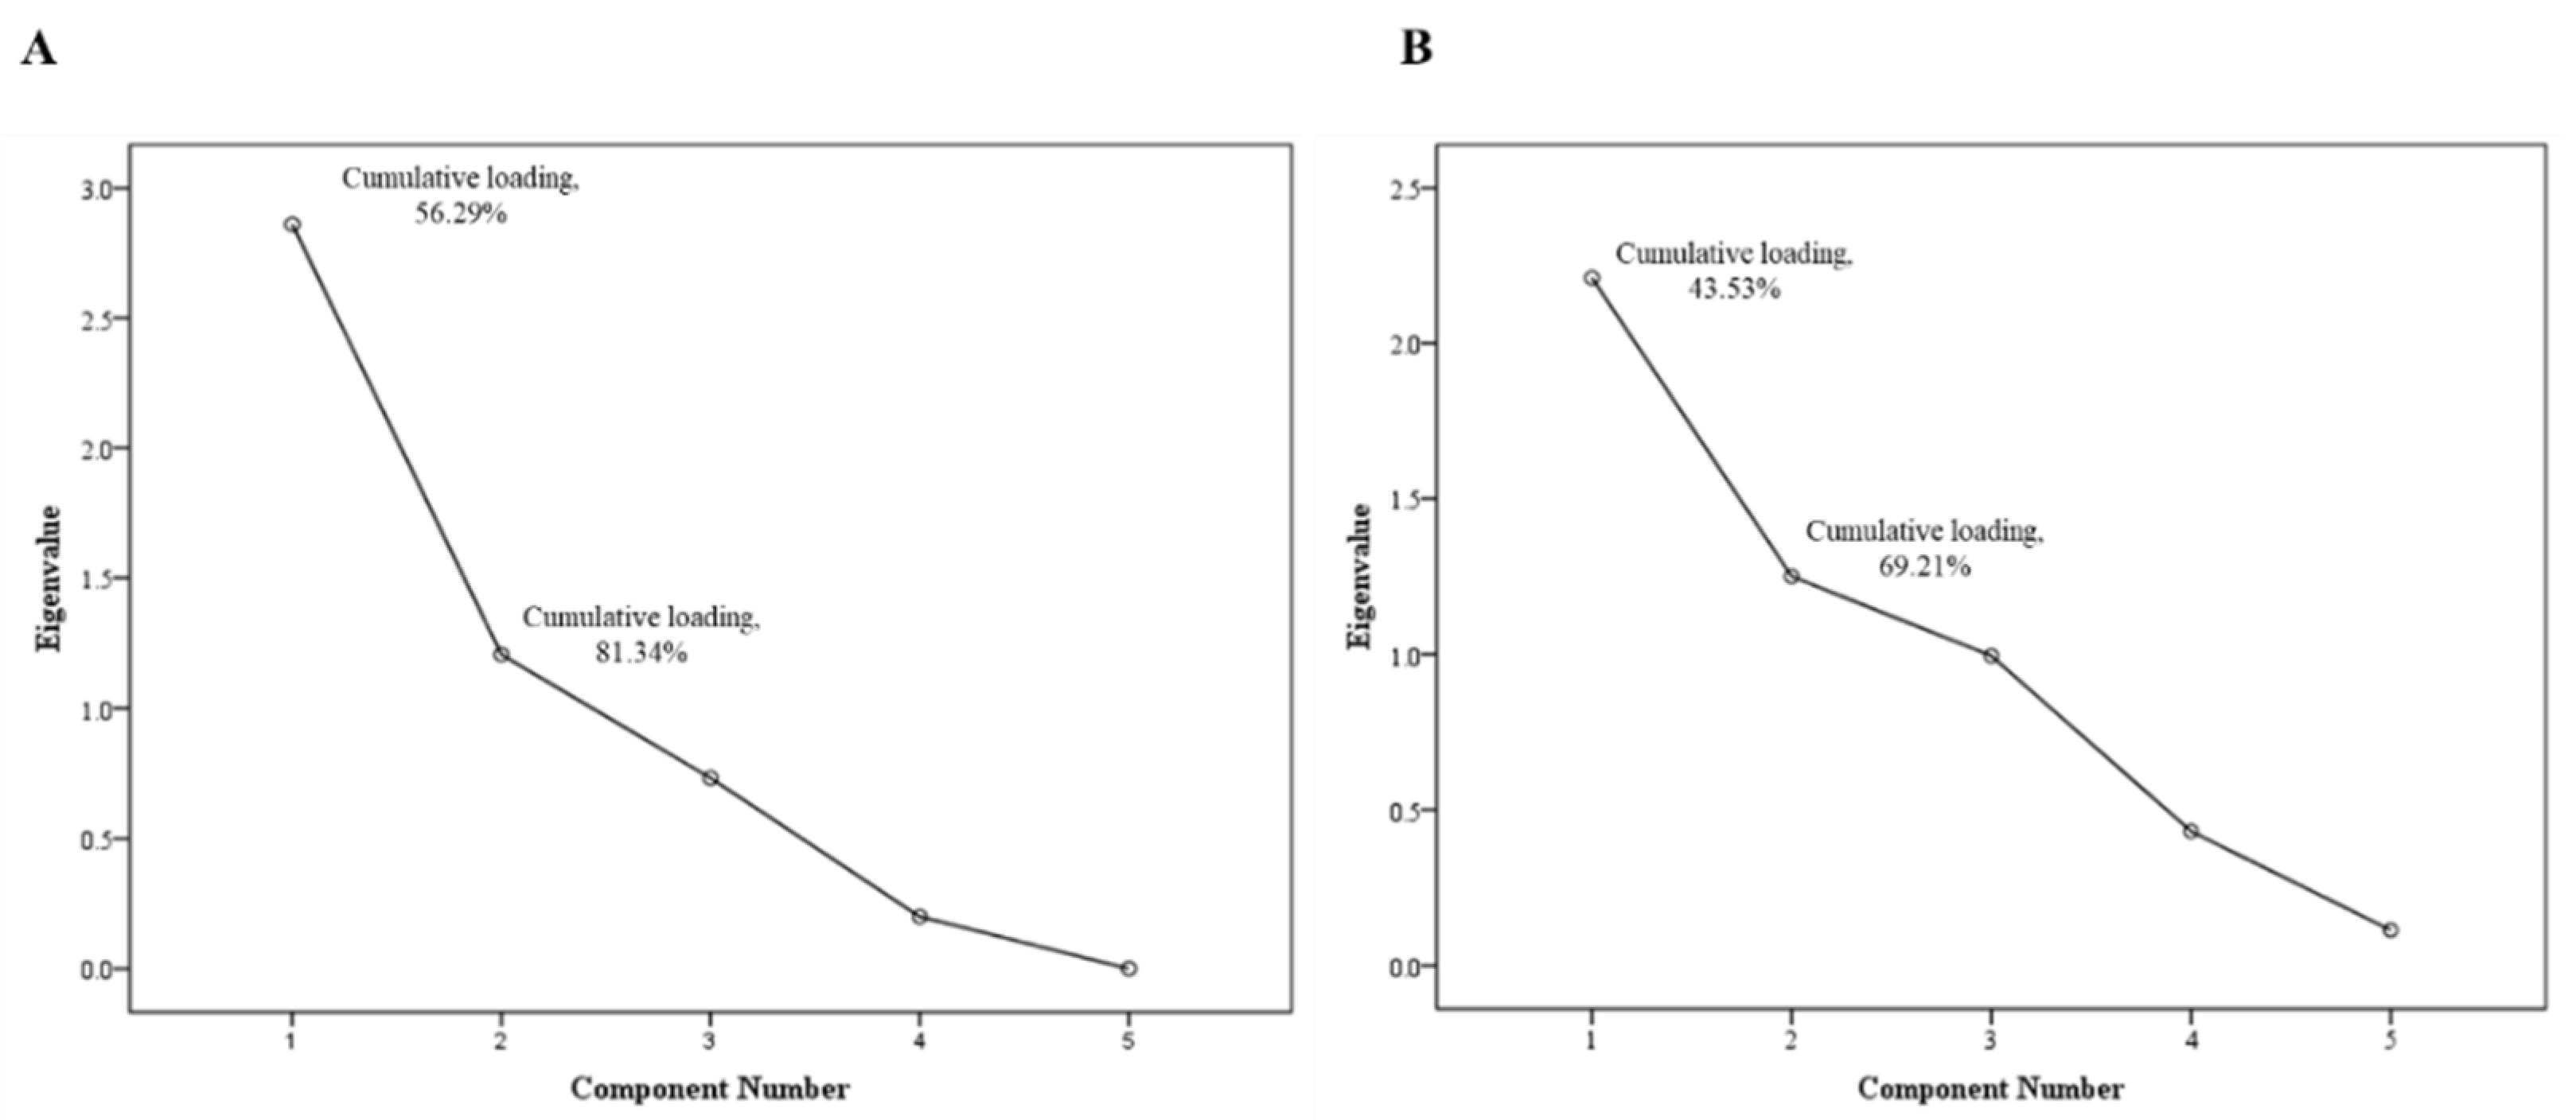
3.2.3. The Principal Component Analysis
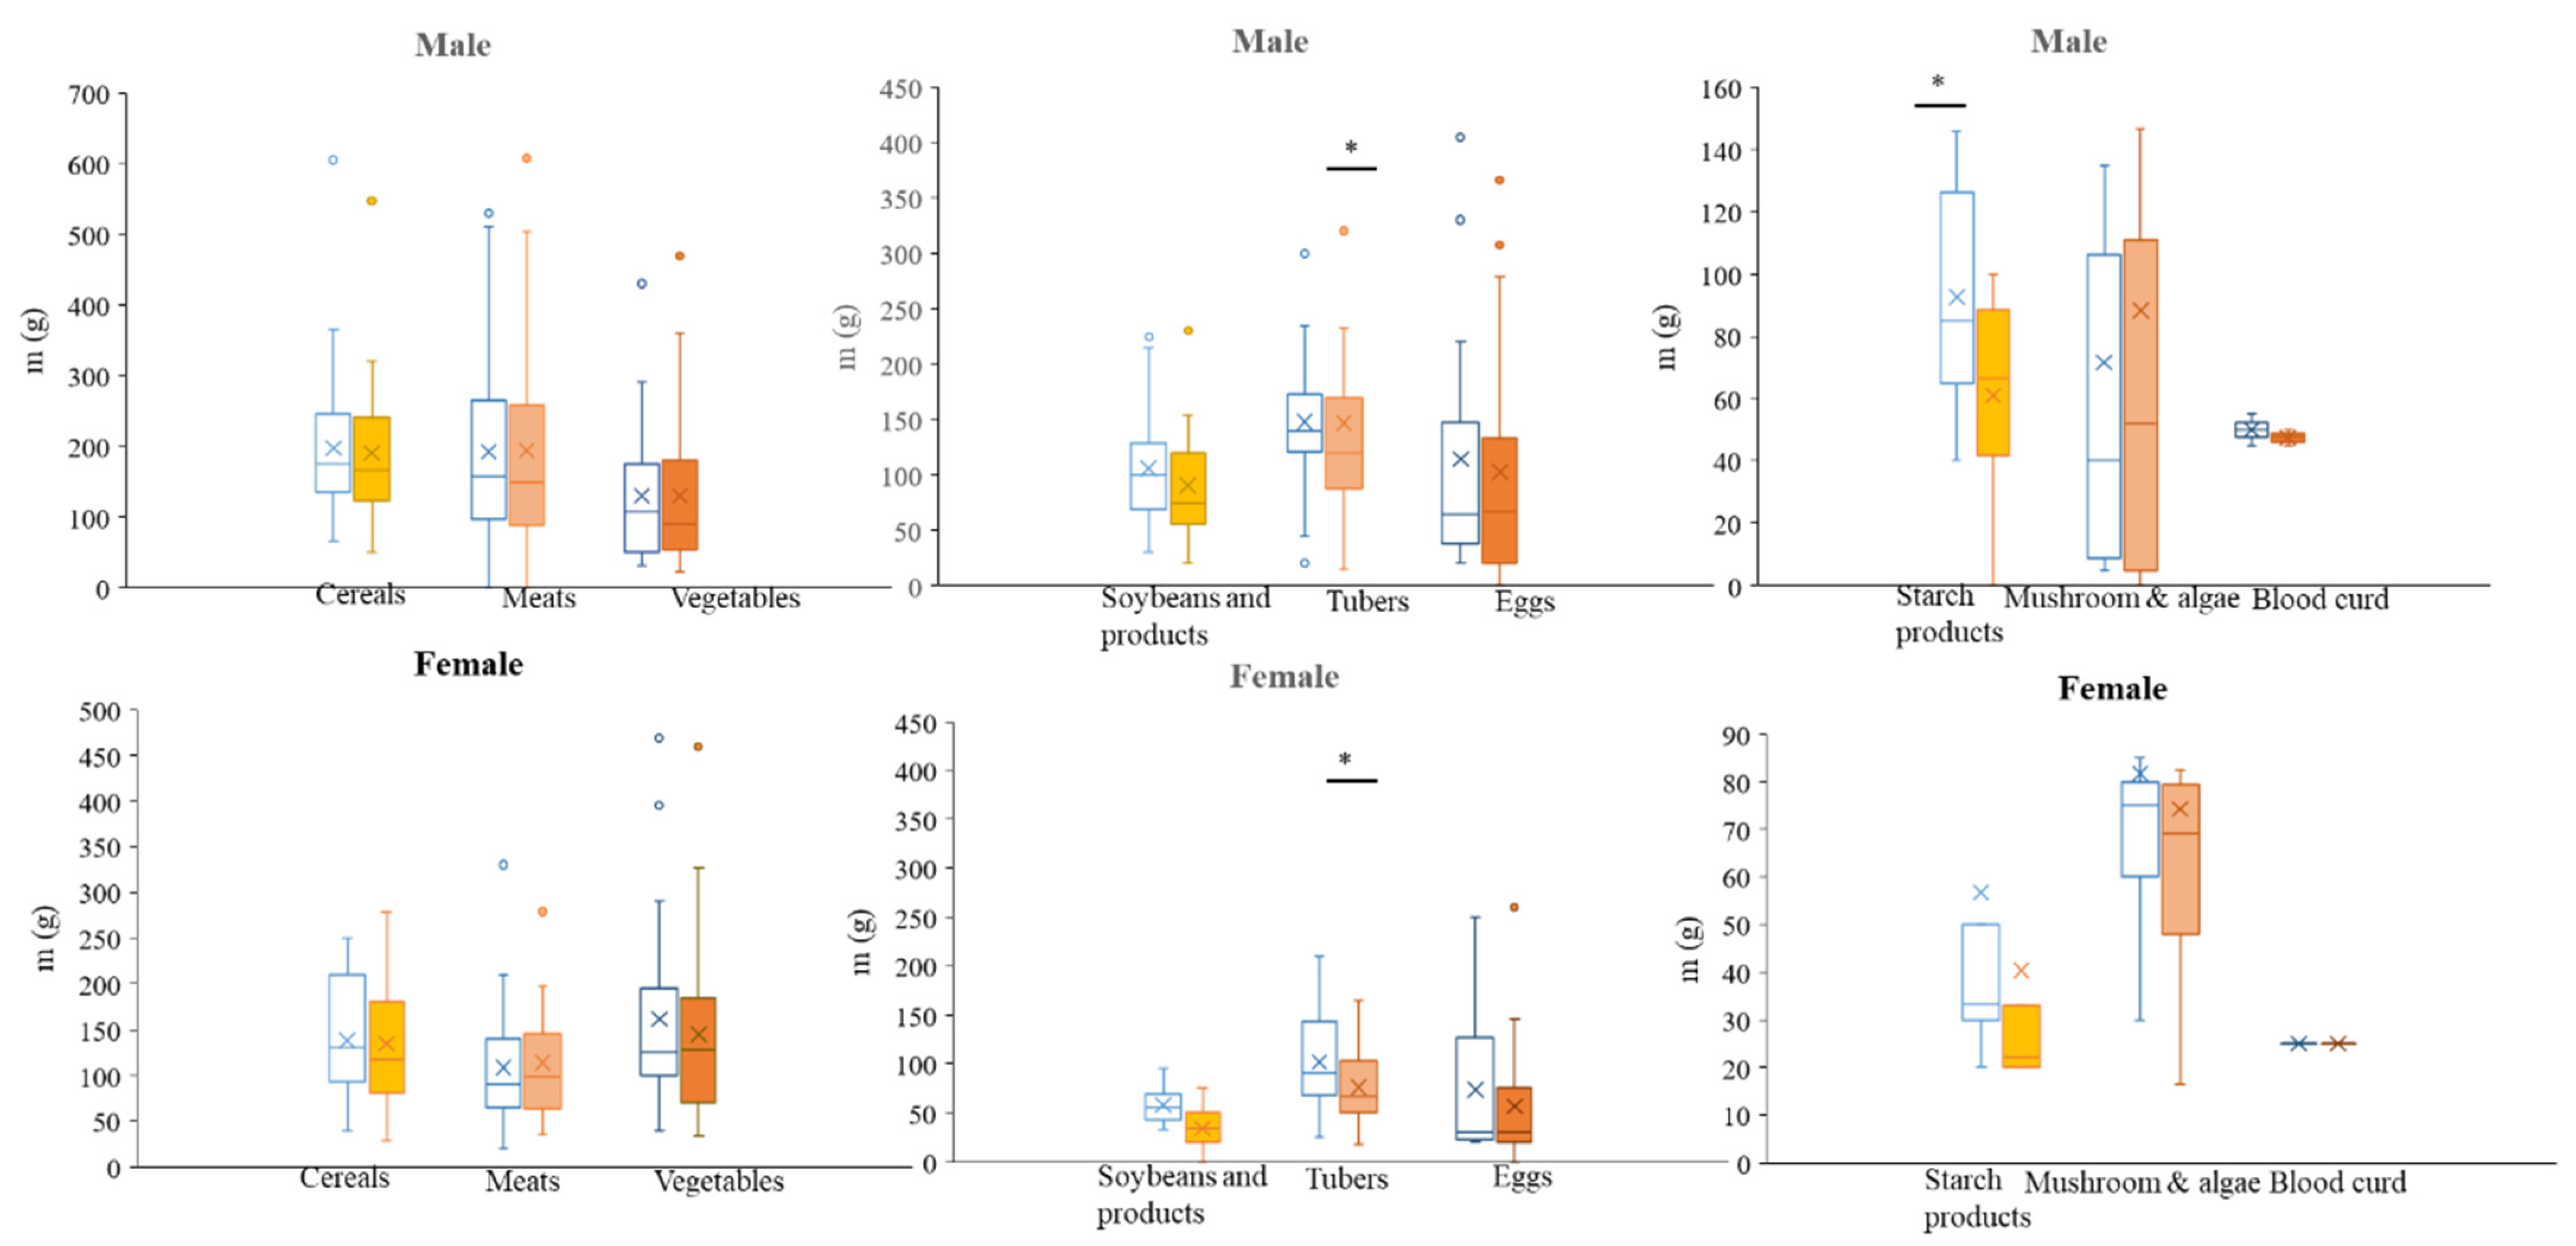
3.3. The Application of Recall and the PAD Method to Different Populations
4. Discussion
5. Conclusions
Supplementary Materials
Author Contributions
Funding
Institutional Review Board Statement
Informed Consent Statement
Data Availability Statement
Conflicts of Interest
References
- Thomas, D.T.; Erdman, K.A.; Burke, L.M. Position of the Academy of Nutrition and Dietetics, Dietitians of Canada, and the American College of Sports Medicine: Nutrition and Athletic Performance. J. Acad. Nutr. Diet. 2016, 116, 501–528. [Google Scholar] [PubMed]
- Hooson, J.; Hutchinson, J.; Warthon-Medina, M.; Hancock, N.; Greathead, K.; Knowles, B.; Vargas-Garcia, E.; Gibson, L.E.; Bush, L.A.; Margetts, B.; et al. A systematic review of reviews identifying UK validated dietary assessment tools for inclusion on an interactive guided website for researchers: www.nutritools.org. Crit. Rev. Food Sci. Nutr. 2020, 60, 1265–1289. [Google Scholar]
- Foster, E.; Bradley, J. Methodological considerations and future insights for 24-hour dietary recall assessment in children. Nutr. Res. 2018, 51, 1–11. [Google Scholar] [PubMed]
- Zhai, L.; Pan, H.; Cao, H.; Zhao, S.; Yao, P. Reliability and validity of a semi-quantitative food frequency questionnaire: Dietary intake assessment among multi-ethnic populations in Northwest China. J. Health Popul. Nutr. 2023, 42, 111. [Google Scholar]
- Cade, J.E. Measuring diet in the 21st century: Use of new technologies. Proc. Nutr. Soc. 2017, 76, 276–282. [Google Scholar] [CrossRef] [PubMed]
- Walker, J.L.; Ardouin, S.; Burrows, T. The validity of dietary assessment methods to accurately measure energy intake in children and adolescents who are overweight or obese: A systematic review. Eur. J. Clin. Nutr. 2018, 72, 185–197. [Google Scholar]
- Bailey, R.L. Overview of dietary assessment methods for measuring intakes of foods, beverages, and dietary supplements in research studies. Curr. Opin. Biotechnol. 2021, 70, 91–96. [Google Scholar]
- Archer, E.; Pavela, G.; Lavie, C.J. The Inadmissibility of ‘What We Eat in America’ (WWEIA) and NHANES Dietary Data in Nutrition & Obesity Research and the Scientific Formulation of National Dietary Guidelines. Mayo Clin. Proc. 2015, 90, 911–926. [Google Scholar]
- Dhurandhar, N.V.; Schoeller, D.; Brown, A.W.; Heymsfield, S.B.; Thomas, D.; Sørensen, T.I.A.; Speakman, J.R.; Jeansonne, M.; Allison, D.B.; Energy Balance Measurement Working Group. Energy balance measurement: When something is not better than nothing. Int. J. Obes. 2015, 39, 1109–1113. [Google Scholar] [CrossRef]
- Nichelle, P.G.; Almeida, C.C.B.; Camey, S.A.; Garmus, L.M.; Elias, V.C.M.; Marchioni, D.M.; da Silva, D.G.; Ocke, M.C.; Slimani, N.; Fisberg, R.M.; et al. Subjects’ Perception in Quantifying Printed and Digital Photos of Food Portions. Nutrients 2019, 11, 501. [Google Scholar]
- Gibson, R.S. Principles of Nutritional Assessment, 2nd ed.; Oxford University Press: New York, NY, USA, 2005. [Google Scholar]
- Raju, V.B.; Hossain, D.; Sazonov, E. Estimation of Plate and Bowl Dimensions for Food Portion Size Assessment in a Wearable Sensor System. IEEE Sens. J. 2023, 23, 5391–5400. [Google Scholar] [CrossRef] [PubMed]
- Gemming, L.; Utter, J.; Ni Mhurchu, C. Image-assisted dietary assessment: A systematic review of the evidence. J. Acad. Nutr. Diet. 2015, 115, 64–77. [Google Scholar] [CrossRef]
- Boushey, C.J.; Spoden, M.; Zhu, F.M.; Delp, E.J.; Kerr, D.A. New mobile methods for dietary assessment: Review of image-assisted and image-based dietary assessment methods. Proc. Nutr. Soc. 2016, 76, 283–294. [Google Scholar] [CrossRef] [PubMed]
- Battaglia, B.; Lee, L.; Jia, S.S.; Partridge, S.R.; Allman-Farinelli, M. The Use of Mobile-Based Ecological Momentary Assessment (mEMA) Methodology to Assess Dietary Intake, Food Consumption Behaviours and Context in Young People: A Systematic Review. Healthcare 2022, 10, 1329. [Google Scholar] [CrossRef]
- Martin, C.K.; Correa, J.B.; Han, H.; Allen, H.R.; Rood, J.C.; Champagne, C.M.; Gunturk, B.K.; Bray, G.A. Validity of the Remote Food Photography Method (RFPM) for estimating energy and nutrient intake in near real-time. Obes. Silver Spring Md. 2012, 20, 891–899. [Google Scholar] [CrossRef] [PubMed]
- Nicklas, T.A.; O’Neil, C.E.; Stuff, J.; Goodell, L.S.; Liu, Y.; Martin, C.K. Validity and feasibility of a digital diet estimation method for use with preschool children: A pilot study. J. Nutr. Educ. Behav. 2012, 44, 618–623. [Google Scholar] [CrossRef]
- Marcano-Olivier, M.; Erjavec, M.; Horne, P.J.; Viktor, S.; Pearson, R. Measuring lunchtime consumption in school cafeterias: A validation study of the use of digital photography. Public Health Nutr. 2019, 22, 1745–1754. [Google Scholar] [CrossRef]
- Zhang, L.; Misir, A.; Boshuizen, H.; Ocké, M. A Systematic Review and Meta-Analysis of Validation Studies Performed on Dietary Record Apps. Adv. Nutr. 2021, 12, 2321–2332. [Google Scholar] [CrossRef]
- Gazan, R.; Vieux, F.; Mora, S.; Havard, S.; Dubuisson, C. Potential of existing online 24-h dietary recall tools for national dietary surveys. Public Health Nutr. 2021, 24, 5361–5386. [Google Scholar] [CrossRef]
- Kouvari, M.; Mamalaki, E.; Bathrellou, E.; Poulimeneas, D.; Yannakoulia, M.; Panagiotakos, D.B. The validity of technology-based dietary assessment methods in childhood and adolescence: A systematic review. Crit. Rev. Food Sci. Nutr. 2021, 61, 1065–1080. [Google Scholar] [CrossRef]
- Ding., Y.; Lu, X.; Xie, Z.; Jiang, T.; Song, C.; Wang, Z. Evaluation of a Novel WeChat Applet for Image-Based Dietary Assessment among Pregnant Women in China. Nutrients 2021, 13, 3158. [Google Scholar] [CrossRef] [PubMed]
- Daugherty, B.L.; Schap, T.E.; Ettienne-Gittens, R.; Zhu, F.M.; Bosch, M.; Delp, E.J.; Ebert, D.S.; Kerr, D.A.; Boushey, C.J.; Stumbo, P.; et al. Novel technologies for assessing dietary intake: Evaluating the usability of a mobile telephone food record among adults and adolescents. J. Med. Internet Res. 2012, 14, e58. [Google Scholar] [CrossRef] [PubMed]
- Höchsmann, C.; Martin, C.K. Review of the validity and feasibility of image-assisted methods for dietary assessment. Int. J. Obes. 2020, 44, 2358–2371. [Google Scholar] [CrossRef] [PubMed]
- Taylor, R.M.; Fealy, S.M.; Bisquera, A.; Smith, R.; Collins, C.E.; Evans, T.J.; Hure, A.J. Effects of Nutritional Interventions during Pregnancy on Infant and Child Cognitive Outcomes: A Systematic Review and Meta-Analysis. Nutrients 2017, 9, 1265. [Google Scholar] [CrossRef]
- Ambrosini, G.L.; Hurworth, M.; Giglia, R.; Trapp, G.; Strauss, P. Feasibility of a commercial smartphone application for dietary assessment in epidemiological research and comparison with 24-h dietary recalls. Nutr. J. 2018, 17, 5. [Google Scholar] [CrossRef] [PubMed]
- Schap, T.E.; Zhu, F.; Delp, E.J.; Boushey, C.J. Merging dietary assessment with the adolescent lifestyle. J. Hum. Nutr. Diet. 2014, 1, 82–88. [Google Scholar] [CrossRef] [PubMed]
- Cacau, L.T.; De Carli, E.; de Carvalho, A.M.; Lotufo, P.A.; Moreno, L.A.; Bensenor, I.M.; Marchioni, D.M. Development and Validation of an Index Based on EAT-Lancet Recommendations: The Planetary Health Diet Index. Nutrients 2021, 13, 1698. [Google Scholar] [CrossRef]
- Santos, R.O.; Gorgulho, B.M.; Castro, M.A.; Fisberg, R.M.; Marchioni, D.M.; Baltar, V.T. Principal Component Analysis and Factor Analysis: Differences and similarities in Nutritional Epidemiology application. Rev. Bras. Epidemiol. 2019, 22, e190041. [Google Scholar] [CrossRef]
- Martin, C.K.; Nicklas, T.; Gunturk, B.; Correa, J.B.; Allen, H.R.; Champagne, C. Measuring food intake with digital photography. J. Hum. Nutr. Diet. 2014, 1, 72–81. [Google Scholar] [CrossRef]
- Tabacchi, G.; Amodio, E.; Di Pasquale, M.; Bianco, A.; Jemni, M.; Mammina, C. Validation and reproducibility of dietary assessment methods in adolescents: A systematic literature review. Public Health Nutr. 2014, 17, 2700–2714. [Google Scholar] [CrossRef]
- Shinozaki, N.; Murakami, K.; Asakura, K.; Masayasu, S.; Sasaki, S. Development of a Digital Photographic Food Atlas as a Portion Size Estimation Aid in Japan. Nutrients 2022, 14, 2218. [Google Scholar] [CrossRef] [PubMed]
- Duhé, A.F.; Gilmore, L.A.; Burton, J.H.; Martin, C.K.; Redman, L.M. The Remote Food Photography Method Accurately Estimates Dry Powdered Foods-The Source of Calories for Many Infants. J. Acad. Nutr. Diet. 2016, 116, 1172–1177. [Google Scholar] [CrossRef] [PubMed]
- Fang, S.; Liu, C.; Zhu, F.; Delp, E.J.; Boushey, C.J. Single-View Food Portion Estimation Based on Geometric Models. In Proceedings of the 2015 IEEE International Symposium on Multimedia (ISM), Miami, FL, USA, 14–16 December 2015; pp. 385–390. [Google Scholar]
- Scagliusi, F.B.; Polacow, V.O.; Artioli, G.G.; Benatti, F.B.; Lancha, A.H. Selective underreporting of energy intake in women: Magnitude, determinants, and effect of training. J. Am. Diet. Assoc. 2003, 103, 1306–1313. [Google Scholar] [CrossRef] [PubMed]
- Macdiarmid, J.; Blundell, J. Assessing dietary intake: Who, what and why of under-reporting. Nutr. Res. Rev. 1998, 11, 231–253. [Google Scholar] [CrossRef] [PubMed]
- Forrestal, S.G. Energy intake misreporting among children and adolescents: A literature review. Matern. Child. Nutr. 2011, 7, 112–127. [Google Scholar] [CrossRef]
- Ding, Y.; Yang, Y.; Li, F.; Shao, Y.; Sun, Z.; Zhong, C.; Fan, P.; Li, Z.; Zhang, M.; Li, X.; et al. Development and validation of a photographic atlas of food portions for accurate quantification of dietary intakes in China. J. Hum. Nutr. Diet. 2021, 34, 604–615. [Google Scholar] [CrossRef]
- Jacquier, C.; Bonthoux, F.; Baciu, M.; Ruffieux, B. Improving the effectiveness of nutritional information policies: Assessment of unconscious pleasure mechanisms involved in food-choice decisions. Nutr. Rev. 2012, 70, 118–131. [Google Scholar] [CrossRef] [PubMed]
- Li, J.R.; Hsieh, Y.H. Traditional Chinese food technology and cuisine. Asia Pac. J. Clin. Nutr. 2004, 13, 147–155. [Google Scholar]
- Christoph, M.J.; Loman, B.R.; Ellison, B. Developing a digital photography-based method for dietary analysis in self-serve dining settings. Appetite 2017, 114, 217–225. [Google Scholar] [CrossRef]
- Naaman, R.; Parrett, A.; Bashawri, D.; Campo, I.; Fleming, K.; Nichols, B.; Burleigh, E.; Murtagh, J.; Reid, J.; Gerasimidis, K. Assessment of Dietary Intake Using Food Photography and Video Recording in Free-Living Young Adults: A Comparative Study. J. Acad. Nutr. Diet. 2020, 121, 749–761. [Google Scholar] [CrossRef]
- Angan, A.; Allman-Farinelli, M.; Donohoe, E.; Gill, T. Misreporting of energy intake in the 2007 Australian Children’s Survey: Differences in the reporting of food types between plausible, under- and over-reporters of energy intake. J. Hum. Nutr. Diet. 2014, 27, 450–458. [Google Scholar]


| Foods | n | Gender | d | D | d% | D% |
|---|---|---|---|---|---|---|
| Cereals | 77 | Male | −5 (−40, 15) | 25 (10, 44.25) | −3.26 (−23.86, 7.69) | 13.82 (5.82, 24.52) |
| Female | −5 (−22.09, 11.1) | 20.46 (5.78, 33.23) | −5.99 (−17.49, 8.51) | 15.09 (7.23, 20.71) | ||
| P | 0.558 | 0.074 | 0.868 | 0.325 | ||
| Tubers | 50 | Male | −29.5 (−47.03, 6.25) | 31.5 (10.75, 53.825) | −18 (−28.71, 4.44) | 21.97 (10, 30.65) |
| Female | −30.9 (−47.5, −5) | 32.98 (5.15, 47.5) | −30.89 (−40.97, −9.6) | 31.69 (13.33, 44.91) | ||
| P | 0.071 | 0.213 | 0.016 * | 0.041 * | ||
| Soybeans and related products | 28 | Male | −11.8 (−33.05, 1) | 19.5 (5.9, 38.45) | −20.46 (−31.50, 1.79) | 27.06 (15.38, 38.91) |
| Female | −15 (−21.4, 0) | 15 (5.7, 21.4) | −27.06 (−38.91, 0) | 0 (0, 0) | ||
| P | 0.791 | 0.31 | 0.884 | 0.403 | ||
| Vegetables | 108 | Male | −5.75 (−20, 21.41) | 20 (10, 40.42) | −10 (−20, 18.28) | 20 (11.43, 40) |
| Female | −10.6 (−41.13, 5.56) | 21.21 (8.95, 50.14) | −8.55 (−28.45, 3.42) | 14.35 (7.10, 31.96) | ||
| P | 0.137 | 0.919 | 0.369 | 0.208 | ||
| Starch products | 20 | Male | −26.75 (−56.68, −6.43) | 26.75 (6.43, 56.68) | −25.08 (−39.02, −15.36) | 25.08 (15.36, 39.02) |
| Female | −11.1 (−17, −10) | 11.1 (10, 17) | −33.33 (−33.33, −28.93) | 33.33 (28.93, 33.33) | ||
| P | 0.403 | 0.403 | 0.432 | 0.432 | ||
| Mushrooms and algae | 25 | Male | 2.39 (−2.43, 16.03) | 5 (3.28, 16.03) | 3.85 (−12.65, 20.93) | 22.74 (6.65, 42.73) |
| Female | −6 (−15.3, 7.5) | 13.5 (7.5, 19.43) | −8 (−38, 6.92) | 27.82 (8, 38) | ||
| P | 0.249 | 0.696 | 0.33 | 0.967 | ||
| Meats | 87 | Male | −1.2 (−20.24, 22.74) | 21.5 (10.33, 37.93) | −0.62 (−12.73, 14.76) | 15.5 (5.52, 30.02) |
| Female | 4.85 (−7.73, 18.33) | 15.14 (4.93, 27.02) | 2.9 (−5.52, 24.66) | 14.29 (5.49, 28.2) | ||
| P | 0.435 | 0.013 * | 0.31 | 0.347 | ||
| Eggs | 39 | Male | −7.5 (−20.5, 10.35) | 17.5 (10, 37.68) | −22.36 (−34.81, 9.68) | 24.55 (11.5, 40.71) |
| Female | −8.7 (−16.25, 2.88) | 11.13 (5, 16.25) | −22.05 (−40, 5.08) | 22.36 (7.05, 40) | ||
| P | 0.621 | 0.618 | 0.724 | 0.844 | ||
| Blood curd | 4 | Male | −2.5 (−3.75, −1.25) | 2.5 (1.25, 3.75) | −4.55 (−6.82, −2.27) | 4.55 (2.27, 6.82) |
| Female | 0 (0, 0) | 0 (0, 0) | 0 (0, 0) | 0 (0, 0) | ||
| P | 0.375 | 0.375 | 0.375 | 0.375 |
| Foods | n | Methods | d(g) | D(g) | d% | D% |
|---|---|---|---|---|---|---|
| Cereals | 77 | 24 HR | −50 (−90, 0) | 65 (20, 95) | −31.82 (−46.28, 0) | 40.59 (14.66, 49.63) |
| PAD | −5 (−36.34, 15) | 23.42 (10, 44.26) | −4.9 (−24.34, 7.69) | 14.28 (5.88, 26.37) | ||
| P | 0.002 * | 0.001 * | 0.007 * | 0.002 * | ||
| Tubers | 50 | 24 HR | −32.5 (−53.75, −1.25) | 37.5 (25, 55) | −23.4 (−33.33, −3.7) | 27.27 (17.84, 44.27) |
| PAD | −24 (−48.75, 3.58) | 31.9 (6.93, 50.34) | −20 (32.65, 2.44) | 25 (9.09, 42.86) | ||
| P | 0.503 | 0.256 | 0.4 | 0.784 | ||
| Soybeans and products | 28 | 24 HR | −7.5 (−30, 28.75) | 30 (16.25, 73.75) | −10.1 (−29.82, 0) | 28.57 (11.11, 87.5) |
| PAD | −5 (−21.53, 0) | 15 (0, 24.83) | −2 (−31.5, 0) | 0 (0, 0) | ||
| P | 0.55 | 0.002 * | 0.943 | 0.002 * | ||
| Vegetables | 108 | 24 HR | −35 (−60, 20) | 55 (30, 75) | −31.82 (−46.84, 27.5) | 44.44 (31.82, 65.22) |
| PAD | −5.5 (−20, 15.83) | 13.7 (5, 35) | −6 (−19.78, 11.83) | 17.67 (9.89, 31.7) | ||
| P | 0.078 | 0 * | 0.16 | 0 * | ||
| Starch products | 20 | 24 HR | −10 (−66, 10) | 50 (10, 66) | −45.21 (−71.43, 0) | 50 (25, 92.31) |
| PAD | −6.7 (−17, −3.4) | 6.7 (3.4, 17) | −16.75 (−34, −4.86) | 16.75 (4.86, 34) | ||
| P | 0.944 | 0.042 * | 0.735 | 0.063 | ||
| Mushrooms and algae | 25 | 24 HR | −7.5 (−32.5, −1.2) | 20 (5, 42.5) | −25.93 (−61.54, −9.09) | 34.85 (11.82, 67.31) |
| PAD | 4.78 (−2.36, 12.6) | 7.5 (4.39, 22.15) | 7.31 (−3.1, 16.84) | 14.56 (7.11, 37.19) | ||
| P | 0.279 | 0.033 | 0.347 | 0.049 * | ||
| Meats | 87 | 24 HR | −10 (−40, 30) | 35 (20, 75) | −4.76 (−33.33, 30.44) | 33.33 (18.6, 42.86) |
| PAD | 4.85 (−11.41, 20.8) | 16.54 (7.73, 37.6) | 2.9 (−10.67, 21.13) | 14.29 (5.49, 28.2) | ||
| P | 0.103 | 0 * | 0.356 | 0 * | ||
| Eggs | 39 | 24 HR | −10 (−45, 5) | 30 (10, 70) | −23.08 (−50, 0) | 42.86 (20, 71.43) |
| PAD | 0 (−15, 9.55) | 11.7 (5.6, 32.5) | 0 (−40, 8) | 22.36 (7.05, 40) | ||
| P | 0.459 | 0.003 * | 0.696 | 0.018 * | ||
| Blood curd | 4 | 24 HR | −20 (−31.2, 37.5) | 37.5 (22.5, 86.25) | −57.78 (−70, 46.97) | 57.78 (13.89, 90) |
| PAD | 0 (−1.25, 0) | 0 (0, 1.25) | 0 (−2.27, 0) | 0 (0, 2.72) | ||
| P | 0.715 | 0.068 | 0.715 | 0.068 |
| Foods | 24 HR | PAD | ||
|---|---|---|---|---|
| r | P | r | P | |
| Cereals | 0.686 | <0.001 | 0.901 | <0.001 |
| Tubers | 0.776 | <0.001 | 0.743 | <0.001 |
| Soybeans and related products | 0.394 | 0.086 | 0.799 | <0.001 |
| Vegetables | 0.747 | <0.001 | 0.88 | <0.001 |
| Starch products | 0.017 | 0.965 | 0.836 | <0.001 |
| Mushrooms and algae | 0.508 | 0.064 | 0.885 | <0.001 |
| Meats | 0.766 | <0.001 | 0.944 | <0.001 |
| Eggs | 0.708 | <0.001 | 0.755 | <0.001 |
| Blood curd | 0.4 | 0.600 | 0.899 | 0 |
| Foods | Weighing and 24 HR | Weighing and PAD | ||||
|---|---|---|---|---|---|---|
| Mean Differences (95%Cl) | 95%LOA | Mean Differences (95%Cl) | 95%LOA | |||
| Lower | Upper | Lower | Upper | |||
| Cereals | −45.96 (−66.15, −25.7) | −180.74 | 88.83 | −8.81 (−18.81, 1.2) | −85.37 | 67.75 |
| Tubers | −21.97 (−38.53, −5.41) | −110.45 | 66.52 | −23.92 (−32.62, −15.2) | −79.31 | 31.47 |
| Soybeans and related products | −0.87 (−31.49, 29.75) | −139.67 | 137.93 | −10.43 (−19.96, −0.9) | −53.62 | 32.76 |
| Starch products | −29.1 (−65.35, 7.15) | −128.43 | 70.23 | −26.87 (−42.77, −12.97) | −72.83 | 19.09 |
| Vegetables | −23.89 (−42.49, −5.29) | −146.66 | 98.88 | −8.99 (−18.02, 0.04) | −78.66 | 60.68 |
| Mushroom and algae | −30 (−69.05, 9.05) | −173.63, | 113.63 | 0.29 (−7.41, 7.98) | −32.86 | 33.44 |
| Meats | −9 (−31.11, 13.11) | −159.9 | 141.9 | 2.73 (−6.98, 12.44) | −73.45 | 78.91 |
| Eggs | −25 (−56, 6) | −178.61 | 128.61 | −11.29 (−24.18, 1.61) | −89.24 | 66.66 |
| Methods | Foods | Communalities | Components | |
|---|---|---|---|---|
| 1 | 2 | |||
| PAD | Cereals | 0.943 | 0.835 | 0.496 |
| Tubers | 0.911 | −0.148 | 0.943 | |
| Meats | 0.799 | 0.893 | −0.048 | |
| Vegetables | 0.745 | 0.826 | −0.251 | |
| Eggs | 0.062 | −0.115 | 0.221 | |
| 24 HR | Cereals | 0.767 | 0.794 | 0.370 |
| Tubers | 0.973 | 0.210 | 0.964 | |
| Meats | 0.869 | 0.896 | −0.257 | |
| Vegetables | 0.828 | 0.869 | −0.270 | |
| Eggs | 0.631 | 0.793 | −0.039 | |
| Bias | Omitting Food | Over-Recall Food | Incorrect Food | D% > 50% |
|---|---|---|---|---|
| Eggs (n = 37) | ||||
| 24 HR | 1 (33) | 1 (33) | 0 (33) | 4 (33) |
| PAD | 0 (30) | 0 (30) | 0 (30) | 2 (30) |
| χ2 | 1.182 | 0.961 | - | 4.043 |
| P | 0.822 | 0.676 | - | 0.02 * |
| Tubers (n = 50) | ||||
| 24 HR | 0 (32) | 1 (32) | 0 (32) | 2 (32) |
| PAD | 2 (29) | 0 (29) | 0 (29) | 8 (29) |
| χ2 | 2.282 | 0.921 | - | 5.053 |
| P | 0.222 | 1 | - | 0.037 * |
| Cereals (n = 77) | ||||
| 24 HR | 0 (41) | 1 (41) | 0 (41) | 8 (41) |
| PAD | 1 (42) | 0 (42) | 0 (42) | 1 (42) |
| χ2 | 0.988 | 1.037 | - | 6.298 |
| P | 1 | 0.494 | - | 0.015 * |
| Meats with 100% edible parts (n = 43) | ||||
| 24 HR | 0 (26) | 3 (26) | 2 (26) | 7 (26) |
| PAD | 0 (22) | 0 (22) | 0 (22) | 1 (22) |
| χ2 | - | 2.708 | 1.766 | 4.297 |
| P | - | 0.239 | 0.493 | 0.042 * |
| Meats with less than 100% edible parts (n = 44) | ||||
| 24 HR | 0 (30) | 1 (30) | 6 (30) | 10 (30) |
| PAD | 0 (28) | 0 (28) | 0 (28) | 0 (28) |
| χ2 | - | 0.95 | 6.246 | 11.278 |
| P | - | 1 | 0.024 | 0.001 * |
| Root and stem vegetables (n = 11) | ||||
| 24 HR | 1 (7) | 1 (7) | 0 (7) | 6 (7) |
| PAD | 0 (7) | 0 (7) | 0 (7) | 1 (7) |
| χ2 | 1.077 | 1.077 | - | 7.143 |
| P | 0.5 | 0.5 | - | 0.029 * |
| Melon and solanaceous vegetables (n = 41) | ||||
| 24 HR | 0 (22) | 0 (22) | 0 (22) | 8 (22) |
| PAD | 0 (20) | 0 (20) | 0 (20) | 2 (20) |
| χ2 | - | - | - | 4.014 |
| P | - | - | - | 0.048 * |
| Leafy, flower, and sprout vegetables (n = 56) | ||||
| 24 HR | 0 (35) | 1 (35) | 2 (35) | 9 (35) |
| PAD | 2 (31) | 0 (31) | 0 (31) | 3 (31) |
| χ2 | 2.329 | 0.899 | 1.827 | 4.654 |
| P | 0.217 | 1 | 0.494 | 0.03 * |
Disclaimer/Publisher’s Note: The statements, opinions and data contained in all publications are solely those of the individual author(s) and contributor(s) and not of MDPI and/or the editor(s). MDPI and/or the editor(s) disclaim responsibility for any injury to people or property resulting from any ideas, methods, instructions or products referred to in the content. |
© 2024 by the authors. Licensee MDPI, Basel, Switzerland. This article is an open access article distributed under the terms and conditions of the Creative Commons Attribution (CC BY) license (https://creativecommons.org/licenses/by/4.0/).
Share and Cite
Fan, R.; Chen, Q.; Song, L.; Wang, S.; You, M.; Cai, M.; Wang, X.; Li, Y.; Xu, M. The Validity and Feasibility of Utilizing the Photo-Assisted Dietary Intake Assessment among College Students and Elderly Individuals in China. Nutrients 2024, 16, 211. https://doi.org/10.3390/nu16020211
Fan R, Chen Q, Song L, Wang S, You M, Cai M, Wang X, Li Y, Xu M. The Validity and Feasibility of Utilizing the Photo-Assisted Dietary Intake Assessment among College Students and Elderly Individuals in China. Nutrients. 2024; 16(2):211. https://doi.org/10.3390/nu16020211
Chicago/Turabian StyleFan, Rui, Qianqian Chen, Lixia Song, Shuyue Wang, Mei You, Meng Cai, Xinping Wang, Yong Li, and Meihong Xu. 2024. "The Validity and Feasibility of Utilizing the Photo-Assisted Dietary Intake Assessment among College Students and Elderly Individuals in China" Nutrients 16, no. 2: 211. https://doi.org/10.3390/nu16020211
APA StyleFan, R., Chen, Q., Song, L., Wang, S., You, M., Cai, M., Wang, X., Li, Y., & Xu, M. (2024). The Validity and Feasibility of Utilizing the Photo-Assisted Dietary Intake Assessment among College Students and Elderly Individuals in China. Nutrients, 16(2), 211. https://doi.org/10.3390/nu16020211