1. Introduction
The significance of diet quality to human health is paramount, as a well-balanced dietary intake plays a crucial role in facilitating normal growth and development, maintaining overall health and well-being, and mitigating the risk of illness [
1]. Accurate dietary assessments are imperative for determining one’s dietary and nutritional status, as it enables a comprehensive understanding of the relationship between diet and various health outcomes. This understanding, in turn, facilitates the formulation of effective public health policies and interventions [
2]. The three primary methods for dietary assessments, dietary records (DR), 24-h dietary recalls (24 HR), and food frequency questionnaires (FFQ), are widely used to capture information on the consumption of various foods and nutrients through self-reported data [
3]. For the assessment of dietary behavior and patterns, FFQ proves to be more suitable than DR and 24 HR [
4]. Compared to 24 HR and DR, the FFQ method is more cost-effective and less intrusive, and it takes less time for participants [
5]. Furthermore, these retrospective methods are susceptible to measurement errors, which involve the deliberate or unconscious omission of consumed foods [
6]. Studies have shown that the correlations between food frequency questionnaires and the standards against which they have been compared typically range from 0.5 to 0.67, which has indicated that approximately 75–64% of the estimated variance is due to error [
5]. Of course, the relatively accurate method has been the weighing food method, which has been widely recognized as the more precise approach to dietary assessments, and it has emerged as the preferred method. Even so, this method is highly expensive, and its substantial burden, including time and manpower, contributes to low participation rates and high attrition rates [
7]. The ongoing use of traditional and classical methods to evaluate diets in scientific environments requires a thorough analysis and evaluation [
8,
9]. As a result, it is imperative to promptly create accurate and feasible tools for assessing diets that can effectively address the limitations and restrictions associated with these conventional approaches.
Indeed, the main obstacle in dietary assessment concerns the identification and quantification of ingested foods, a task that is even more intricate within the framework of Chinese food culture, given the extensive variety of food types accessible and the diverse assortment of cooking techniques employed [
10,
11]. Currently, there is a growing trend of utilizing food photography or electronic images, wearable cameras, and diverse online tools as emerging innovations. These innovations have demonstrated their potential to enhance participants’ compliance by alleviating the burden of recording and improving the accuracy of recorded data [
12,
13,
14]. Furthermore, a considerable number of these techniques facilitate the real-time or near-real-time transmission of food image data to researchers or clinicians for analysis and guidance [
15,
16]. The current innovative assistive tool has exhibited its capacity to alleviate recall bias among participants and even eliminate the need for users to estimate portion sizes in specific scenarios. Notably, the image-assisted approach to estimating food portion sizes has exhibited a strong correlation with weighed portion sizes, with a deviation of less than 10% in the overestimation of image-based estimates compared to the weighing method [
17,
18]. However, this promising conclusion was derived from a study conducted on foreign populations. It is imperative to investigate the potential among Chinese individuals due to their distinct eating and cooking habits. Furthermore, an alternative technology-based food recording instrument, particularly one that is reliant on the internet, has been documented to underestimate micronutrient and food group consumption in comparison to conventional dietary evaluations [
19]. Moreover, the reliability of web-based dietary assessments has been particularly restricted for the elderly population [
19,
20,
21]. In the field of Chinese studies, there has been a scarcity of research conducted on image-/web-assisted methodologies. Ding conducted an assessment of a WeChat applet that employed an image-based dietary evaluation technique. The principal technological facet of this approach entailed converting the food’s area into its mass to facilitate quantification. Nevertheless, this methodology failed to consider the food’s dimensions, including its thickness and height, which could influence the accuracy of the results. Additionally, Ding’s research focused solely on pregnant women, overlooking the potential difficulties associated with implementing this approach among college students, who lack life experience, and the elderly, who may have diminished physical capabilities [
22]. Therefore, in order to evaluate the feasibility and accuracy of the image-assisted method for dietary assessments, it is imperative to select diverse settings and populations.
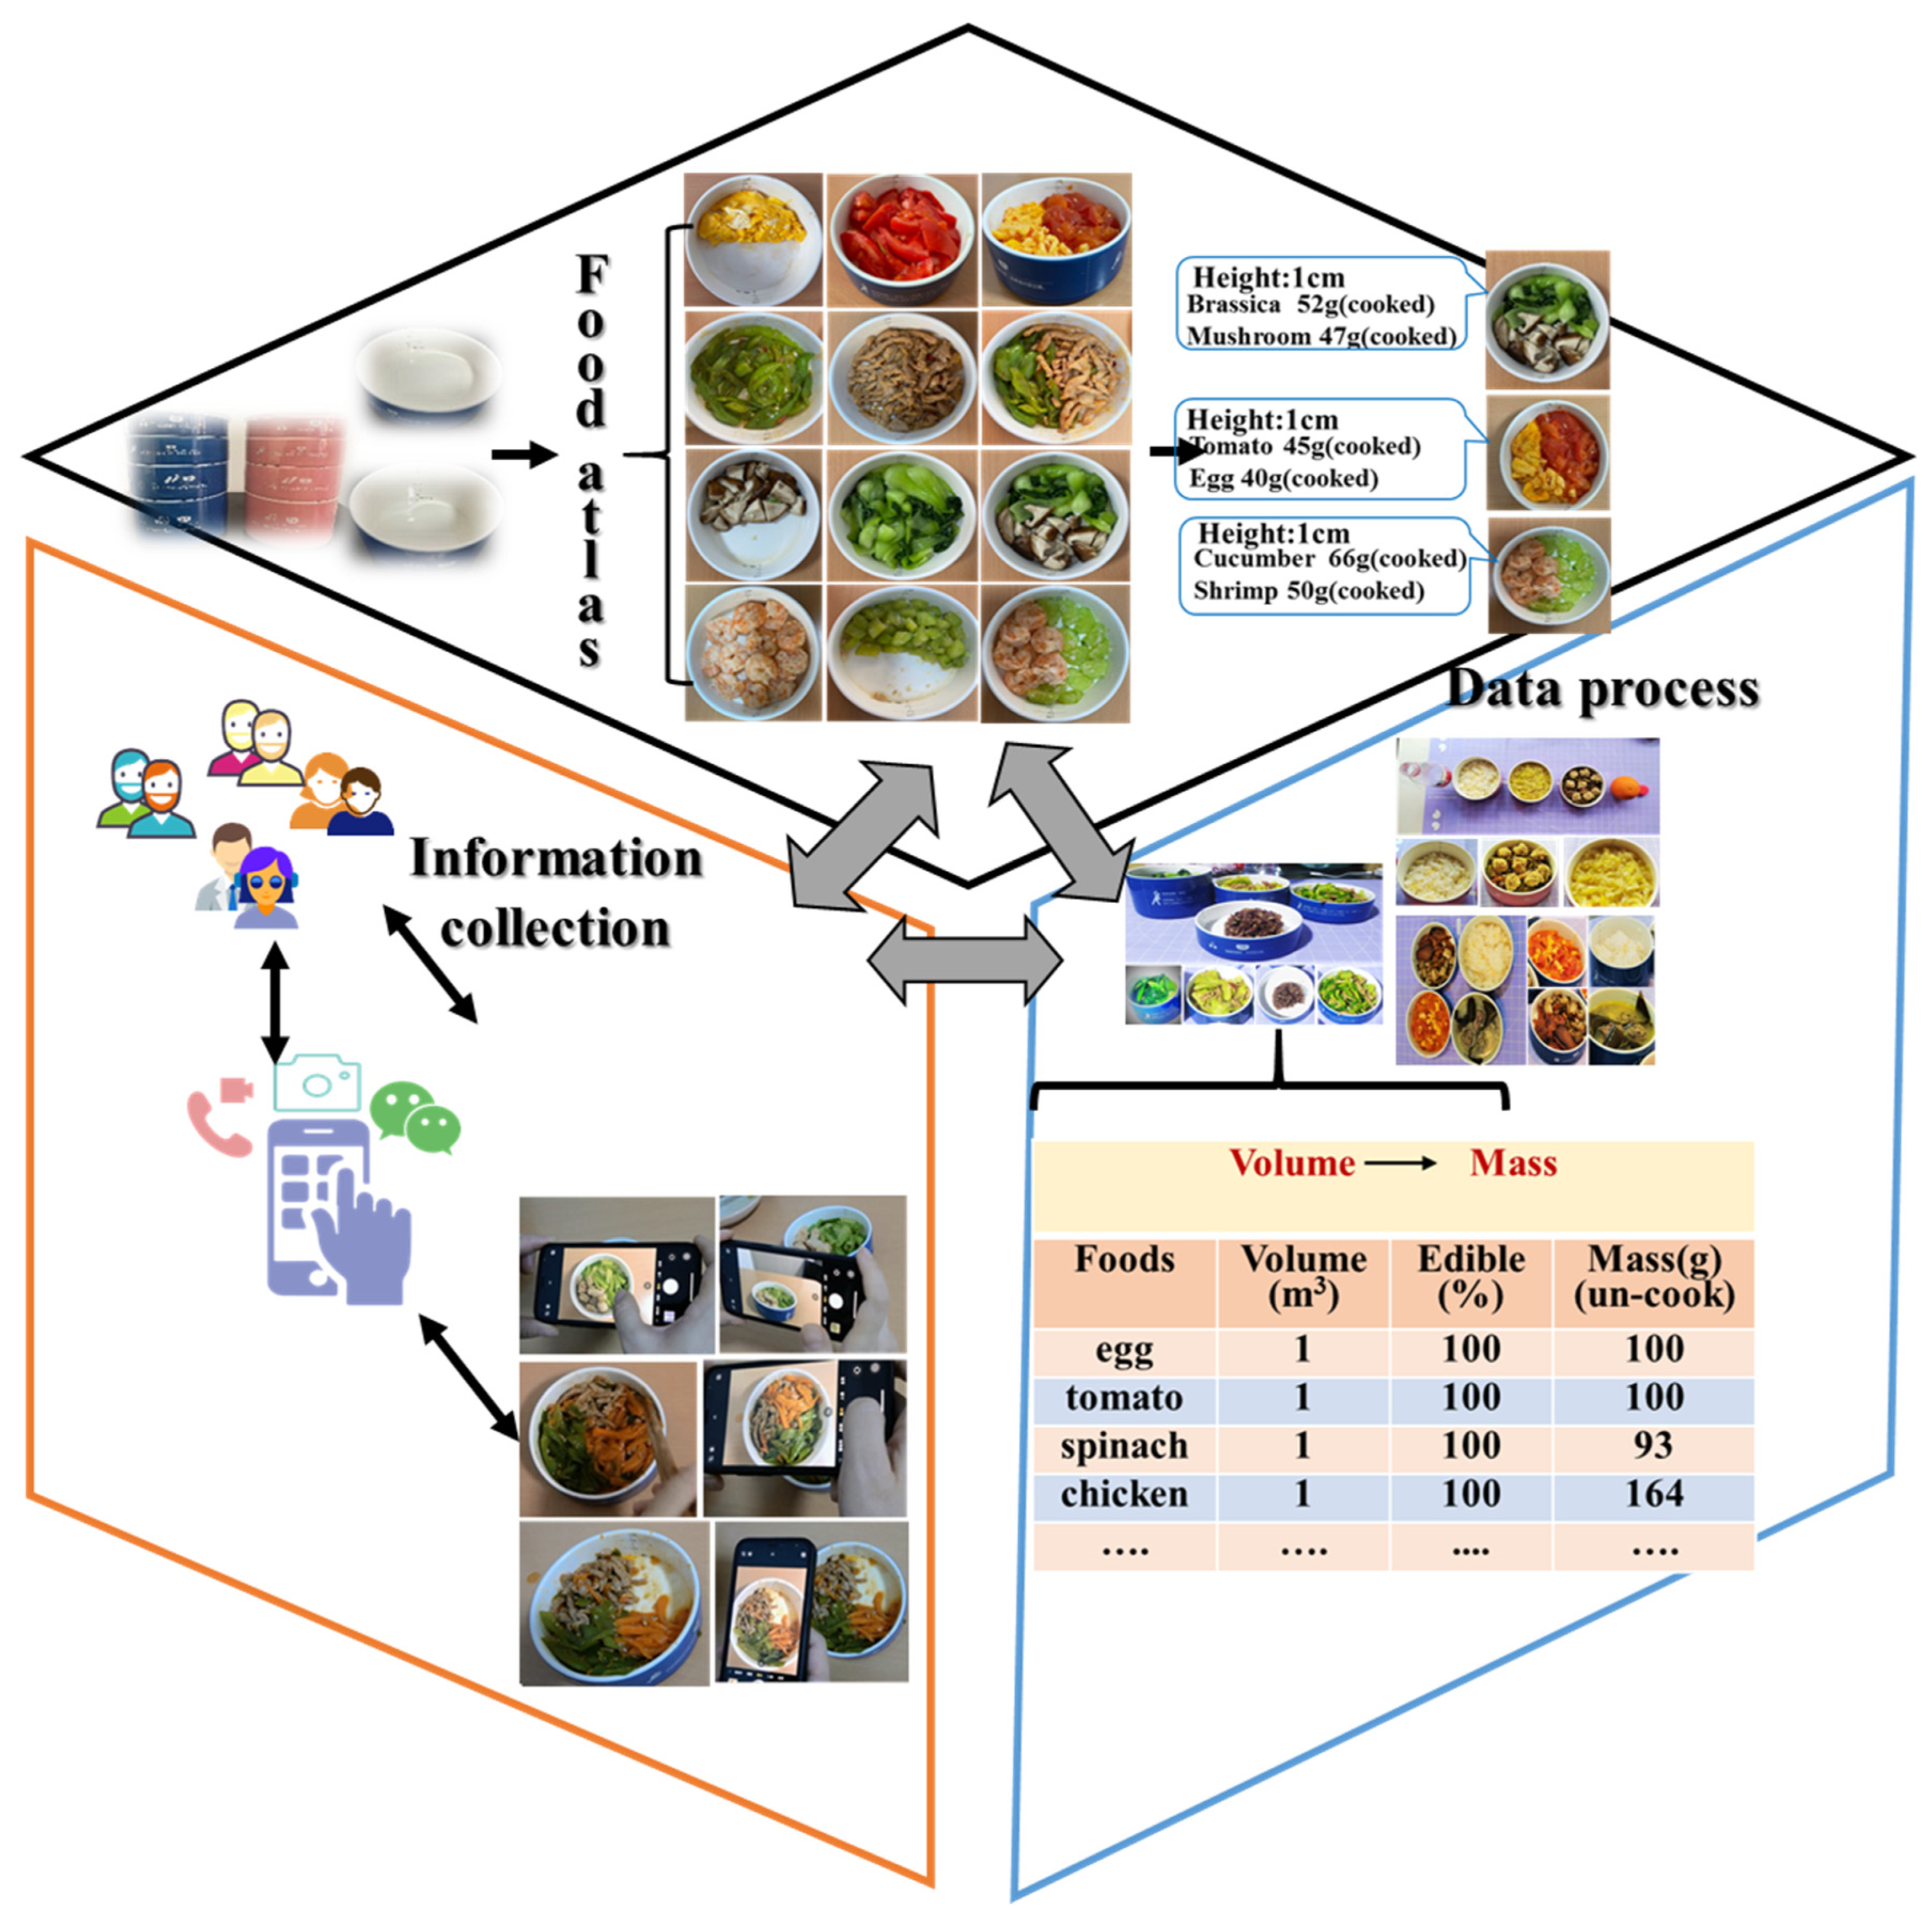
Given the distinctiveness of Chinese food culture, the intricacy of Chinese culinary practices, and the wide range of food and dishes available, this study introduced a photo-assisted dietary intake assessment (PAD) method. The objective was to assess the accuracy of this method by comparing the food mass obtained through PAD with the gold-standard weighing method and the commonly used 24-h dietary recall. Additionally, both elderly individuals and college students were included in the study to evaluate the feasibility of PAD. The findings of this study have the potential to contribute to the advancement of dietary surveys and assessments, thereby enhancing public health and well-being.
4. Discussion
The accuracy of dietary assessments and surveys holds significant importance in the field of public health. In order to address the limitations of current dietary survey methodologies, a novel dietary assessment tool, PAD, was introduced in this study. The validity of PAD was assessed by comparing it with the weighing method and 24 HR among college students. Additionally, the utilization of PAD was evaluated among college students and elderly individuals who were residing communally and given access to canteens and rent-free homes, respectively. The results indicated a lower deviation and closer proximity for PAD versus the weighing method. Additionally, the participants’ willingness and responses were evaluated. Based on these findings, it can be concluded that PAD is a viable approach to assessing dietary quality in China.
It is important to determine whether a dietary assessment method is valid when developing a new one. Validity refers to the degree to which an assessment method captures true dietary intakes [
30]. This validation necessitates a comparison with a recognized benchmark method, commonly referred to as the “gold standard” [
22]. Consequently, the weighing method was chosen for the standard weights in the present study. Additionally, the 24 HR method, which possesses a distinct error structure, was selected to evaluate the relative validity of PAD [
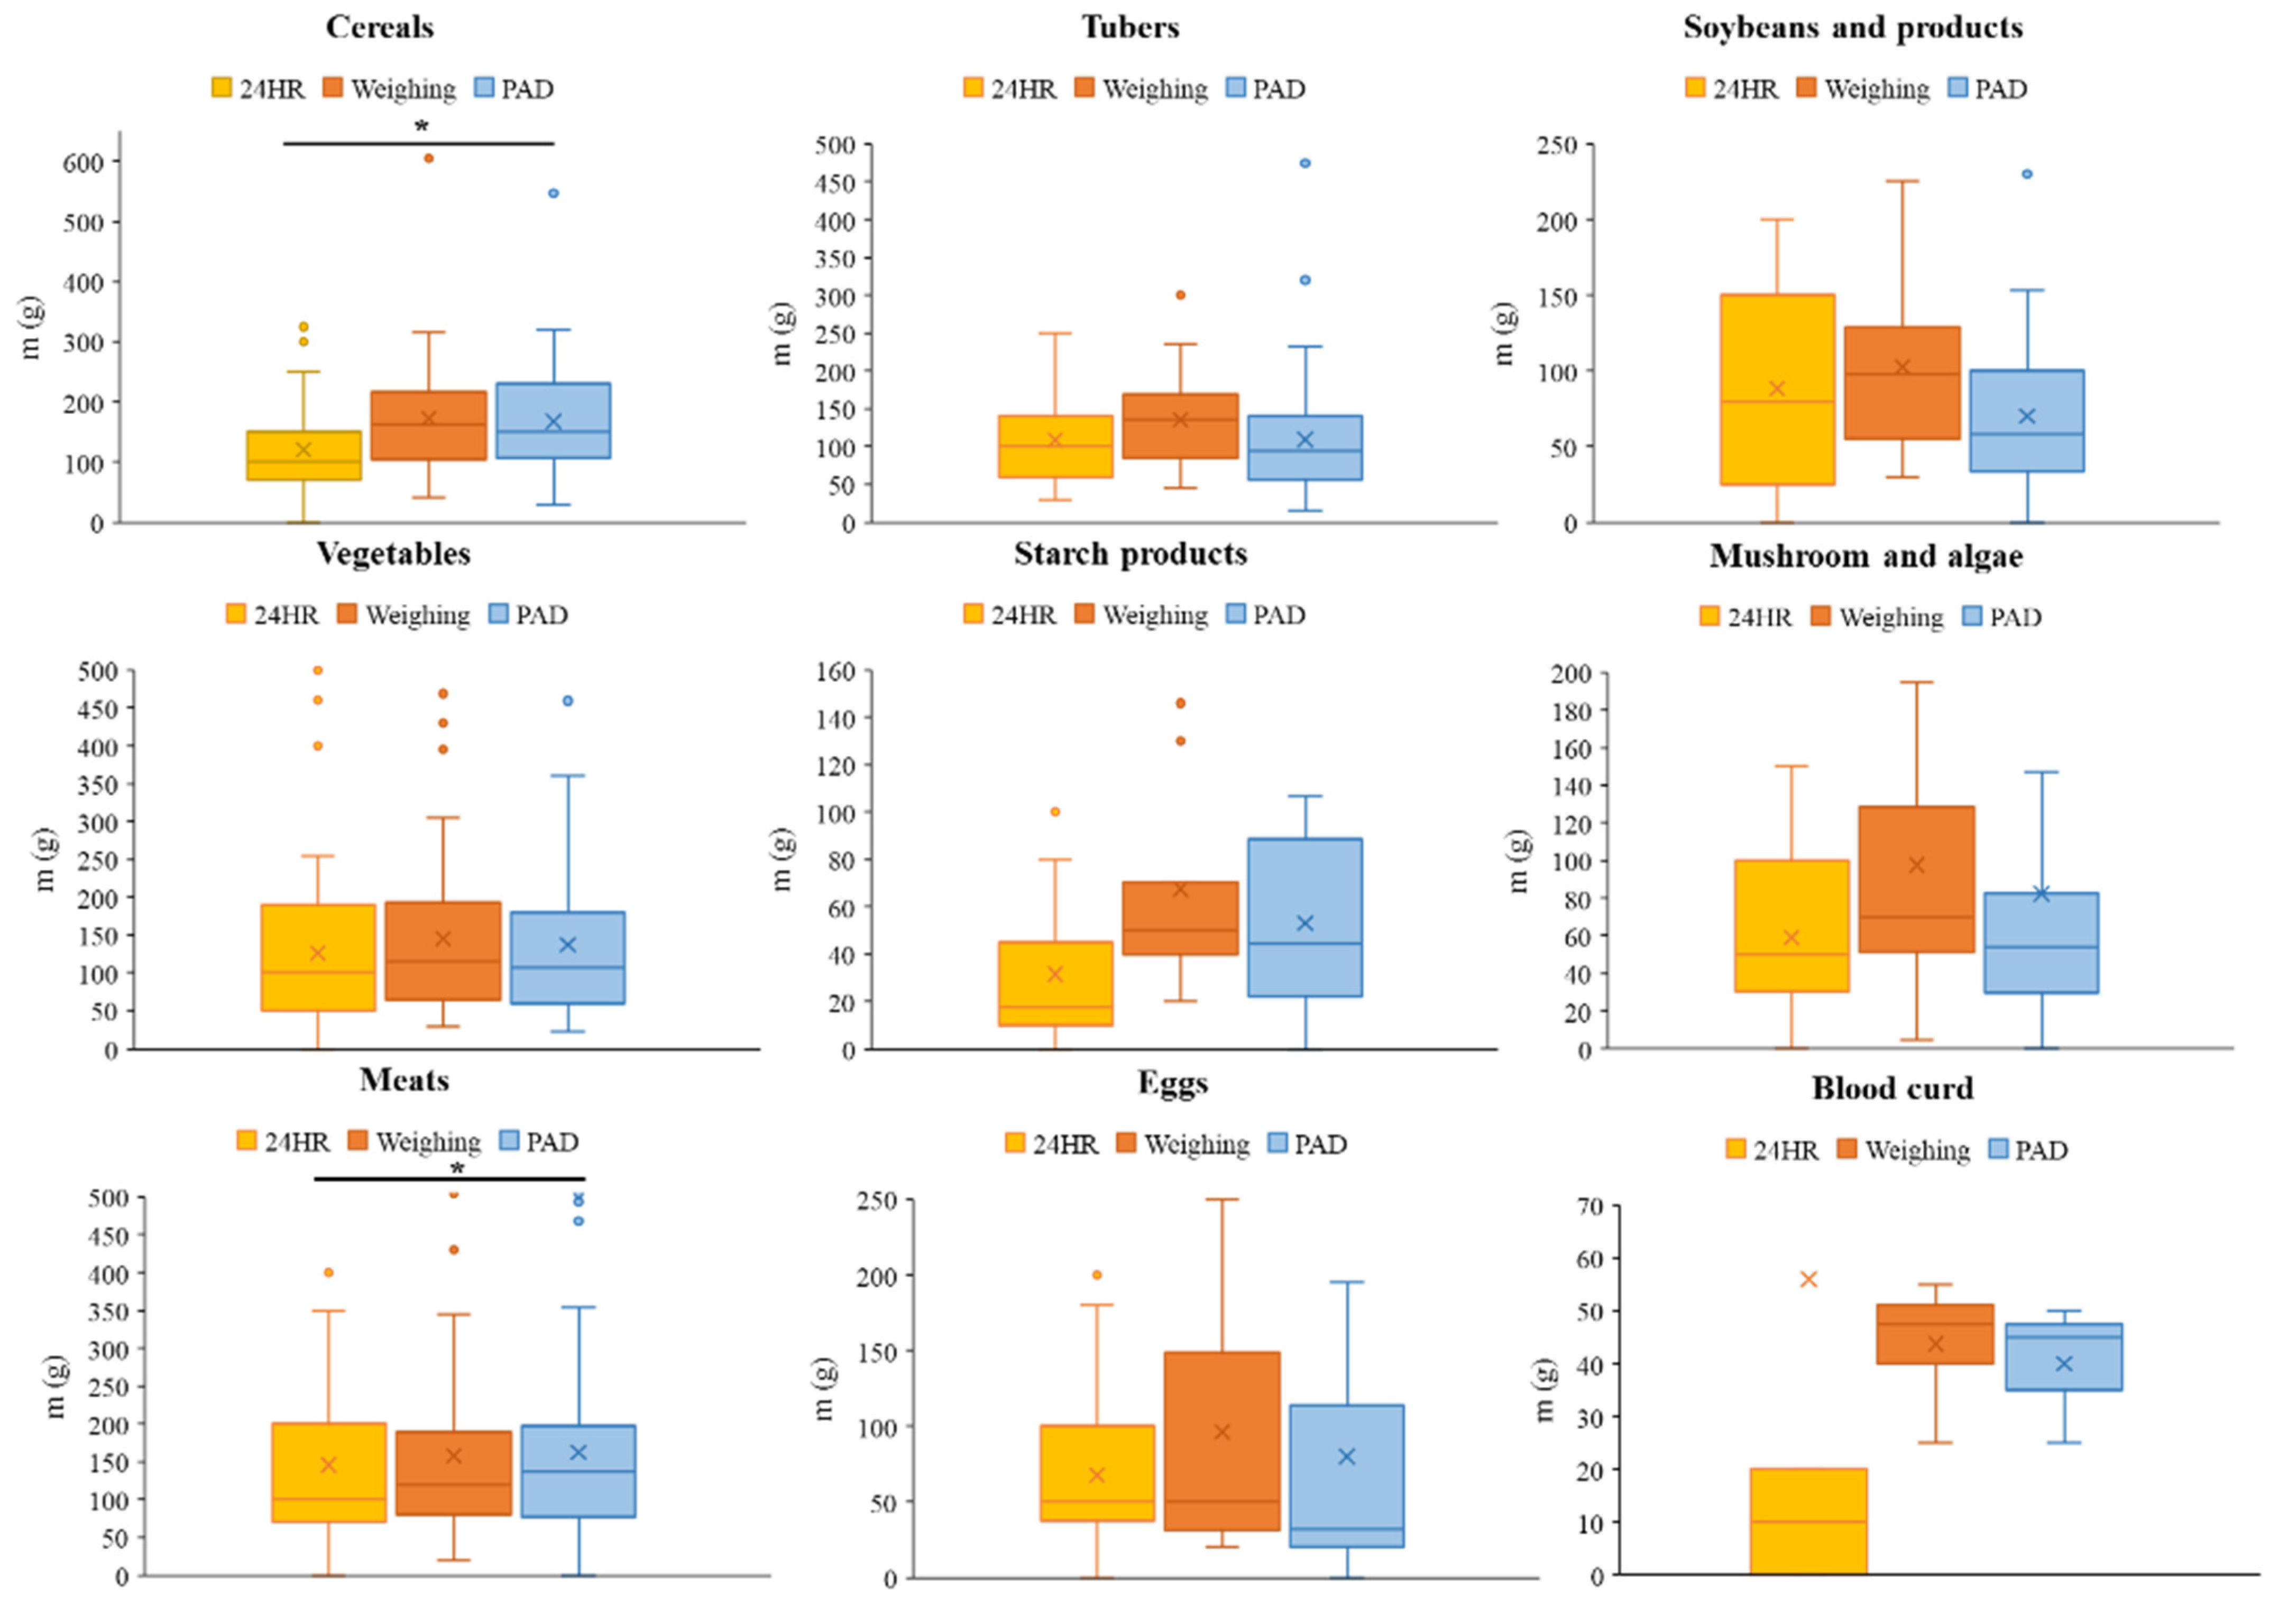
31]. The findings of our study indicated that the weights of most foods, including cereals and vegetables, were lower with PAD than the standardized weights. In terms of food mass, previous studies using image-assisted and weighing methods have yielded inconsistent results, with some reporting larger or smaller masses than the actual values, so the current results were inconsistent with these reports [
22]. The potential factors contributing to this phenomenon could be attributed to variations in participants, intricate dietary patterns, and diverse eating behaviors. Nevertheless, our present findings, indicating that the mass estimated using PAD was lower than the actual mass, align with previous studies conducted on Chinese populations [
18,
22]. Furthermore, the current study revealed that the median deviation in food weights between PAD and the actual mass (ranging from 0% to 33.33%) was greater compared to previous findings, which encompassed the comparison of image assistance coupled with manual portion size estimation method vs. weighing, and image assistance coupled with automatic portion size estimation vs. weighing [
18,
32,
33,
34]. It is unsurprising that employing statistical pattern recognition techniques for the automated estimation of food mass from images may yield greater accuracy compared to manual estimations. However, certain experts have maintained reservations regarding the accuracy of automated image analysis in estimating food intakes [
24]. Our findings indicated a larger difference deviation in food weights compared to previous studies, which can be partially attributed to two factors. Firstly, China’s distinct eating culture and habits contribute to the inclusion of multiple ingredients in dishes and non-standard portion sizes. Secondly, our research was conducted in a communal dining hall for college students, providing a setting closer to real-life dining scenarios than controlled laboratory environments [
24]. The food mass difference deviation between PAD and the weighing method for Chinese participants was found to be similar to the results of Ding’s study [
22]. A good finding is that our study also revealed that certain food items, such as vegetables and meats, exhibited smaller deviations between PAD and the weighing method compared to the previous report (14.35% vs. 30.13% and 14.29% vs. 28.34%, respectively) [
22]. In addition, the findings of our study indicate that the PDA method yielded less variation in estimated food mass (including for cereals, soybeans and related products, vegetables, mushrooms, algae, meats, and eggs) compared to the 24 HR method, which is consistent with a previous report [
22]. The limitations of self-reporting methods, including 24 HR, and the sources of error associated with them encompass several factors. These include the unintentional under-reporting of consumed foods due to forgetfulness, the deliberate under-reporting of foods with unfavorable health connotations, such as those high in fat or sugar, the deliberate over-reporting of foods perceived as healthy, such as fruits and vegetables, and errors in estimating portion sizes [
35,
36]. The use of PAD can alleviate the user burden (as shown in
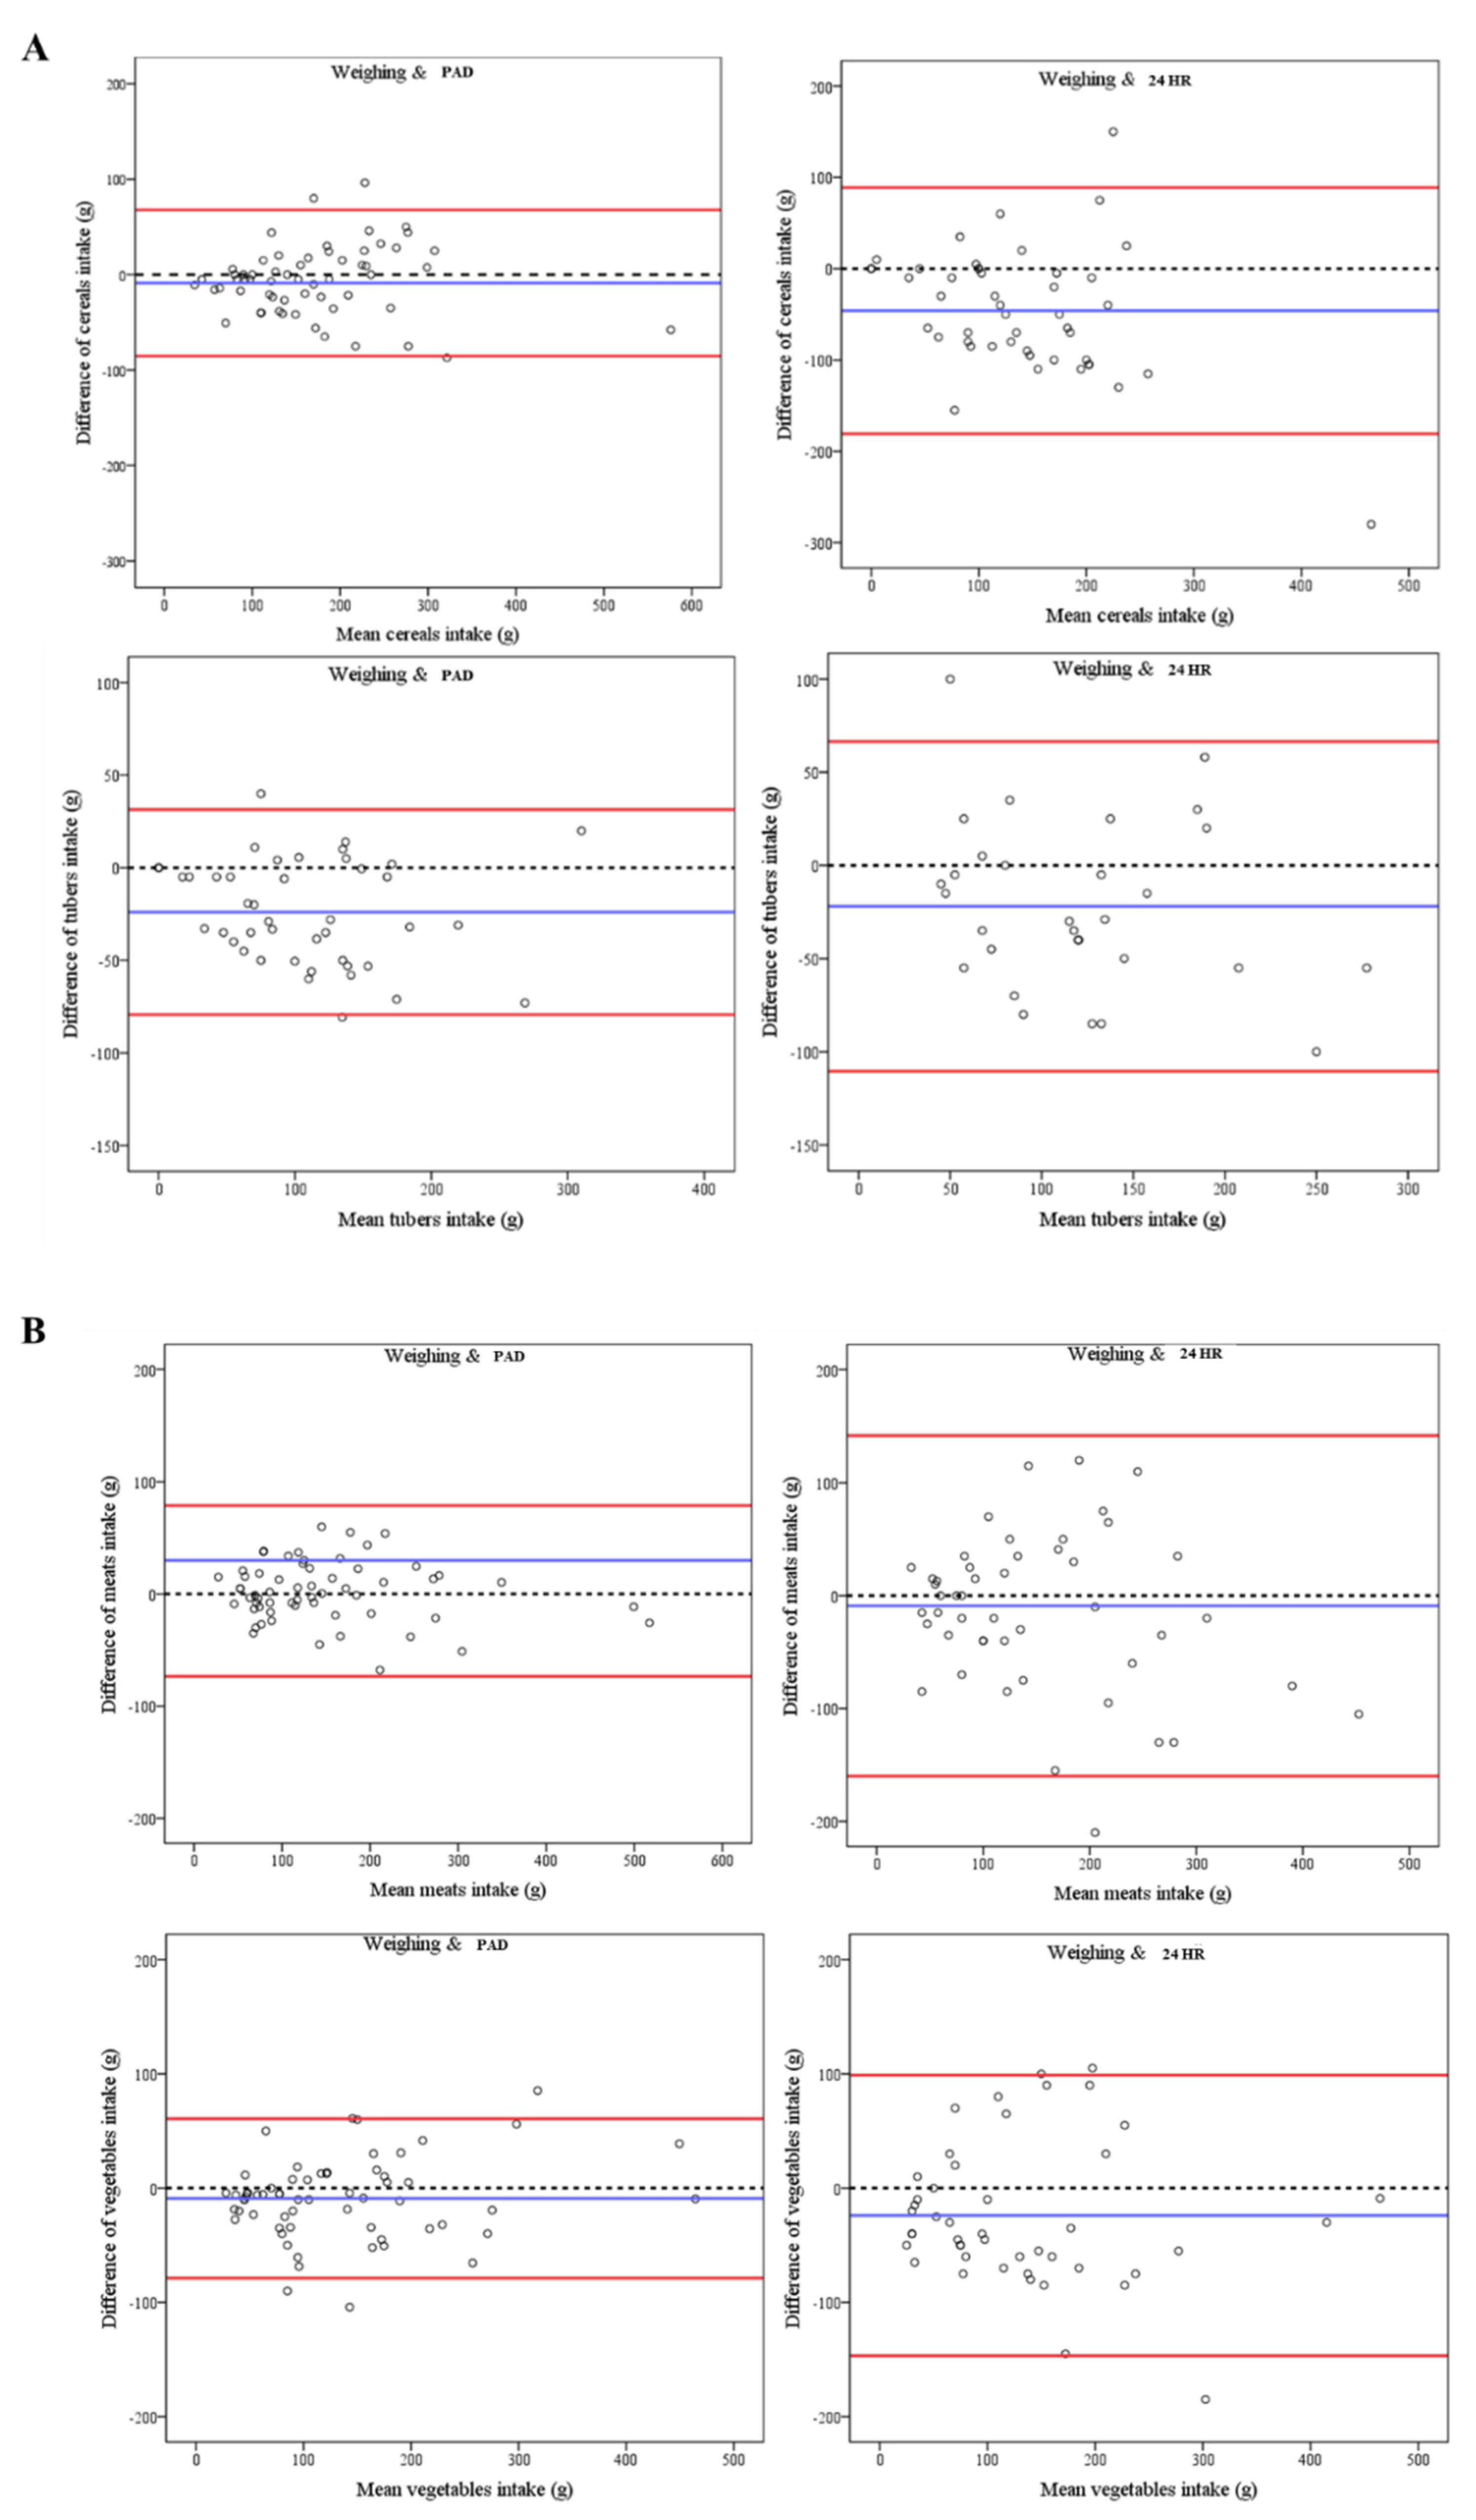
Figure 7) and eliminate the necessity for users to make subjective estimations of portion size, as this task was performed by our trained assessors. Consequently, the accuracy of food mass estimation was enhanced. This finding is supported by the Spearman correlation coefficients between the actual food weights and the weights determined through the PDA method, as well as the Bland–Altman analyses presented in
Table 3 and
Table 4 and
Figure 5. These results demonstrate that the majority of food weights identified through the PAD method are more precise than those identified through 24 HR.
Furthermore, our study revealed that the prominent impacts of 24 HR on bias in food mass were observed in cereals, tubers, vegetables, meats, and eggs, and PAD exhibited biases primarily in cereals, meats, tubers, and vegetables, with the sole exception being eggs. Indeed, eggs’ mass estimated via the PAD method exhibited closer proximity to the actual value compared to the 24 HR method (
Table 3). One possible explanation could be attributed to the Chinese food culture, in which eggs are traditionally served whole and consumed directly, thus leading to a tendency to omit them. Eggs were found to be present in various culinary preparations, including dishes, soups, and even a slurry, as indicated by the food atlas based on the PAD estimation. These findings align with the results presented in
Table 5, which demonstrate fewer instances of omitting food, and a difference deviation of more than 50% was clearly observed for the PAD method, rather than the 24 HR method (
P < 0.05). In general, the utilization of PAD yielded higher levels of accuracy in estimating food mass compared to the 24 HR method. This was evident in the reduced occurrence of incorrect food item identification for meats with less than 100% edible content (
P < 0.05), as well as the occurrence of deviations exceeding 50% for cereals, eggs, meats, and vegetables (
P < 0.05). The findings highlight the significance of accuracy in the PAD method, particularly in relation to meats, eggs, cereals, and vegetables, and suggest that the implementation of PAD can effectively address these accuracy concerns in 24 HR. Ultimately, the accuracy of PAD in estimating food mass for dietary assessments was demonstrated.
In the case of certain food items, such as meat, a subset of participants acknowledged the potential underestimation of their quantities [
37]. In the employed PAD method, the identification and weighing of food were conducted by researchers, rather than participants, thereby minimizing technical bias, enhancing the precision of weight data, and mitigating the influence of weighing records on the data collected through 24 HR. Furthermore, a notable absence of correlation exists between the visual perception of the appearance of completely consumable food and the corresponding food’s weight [
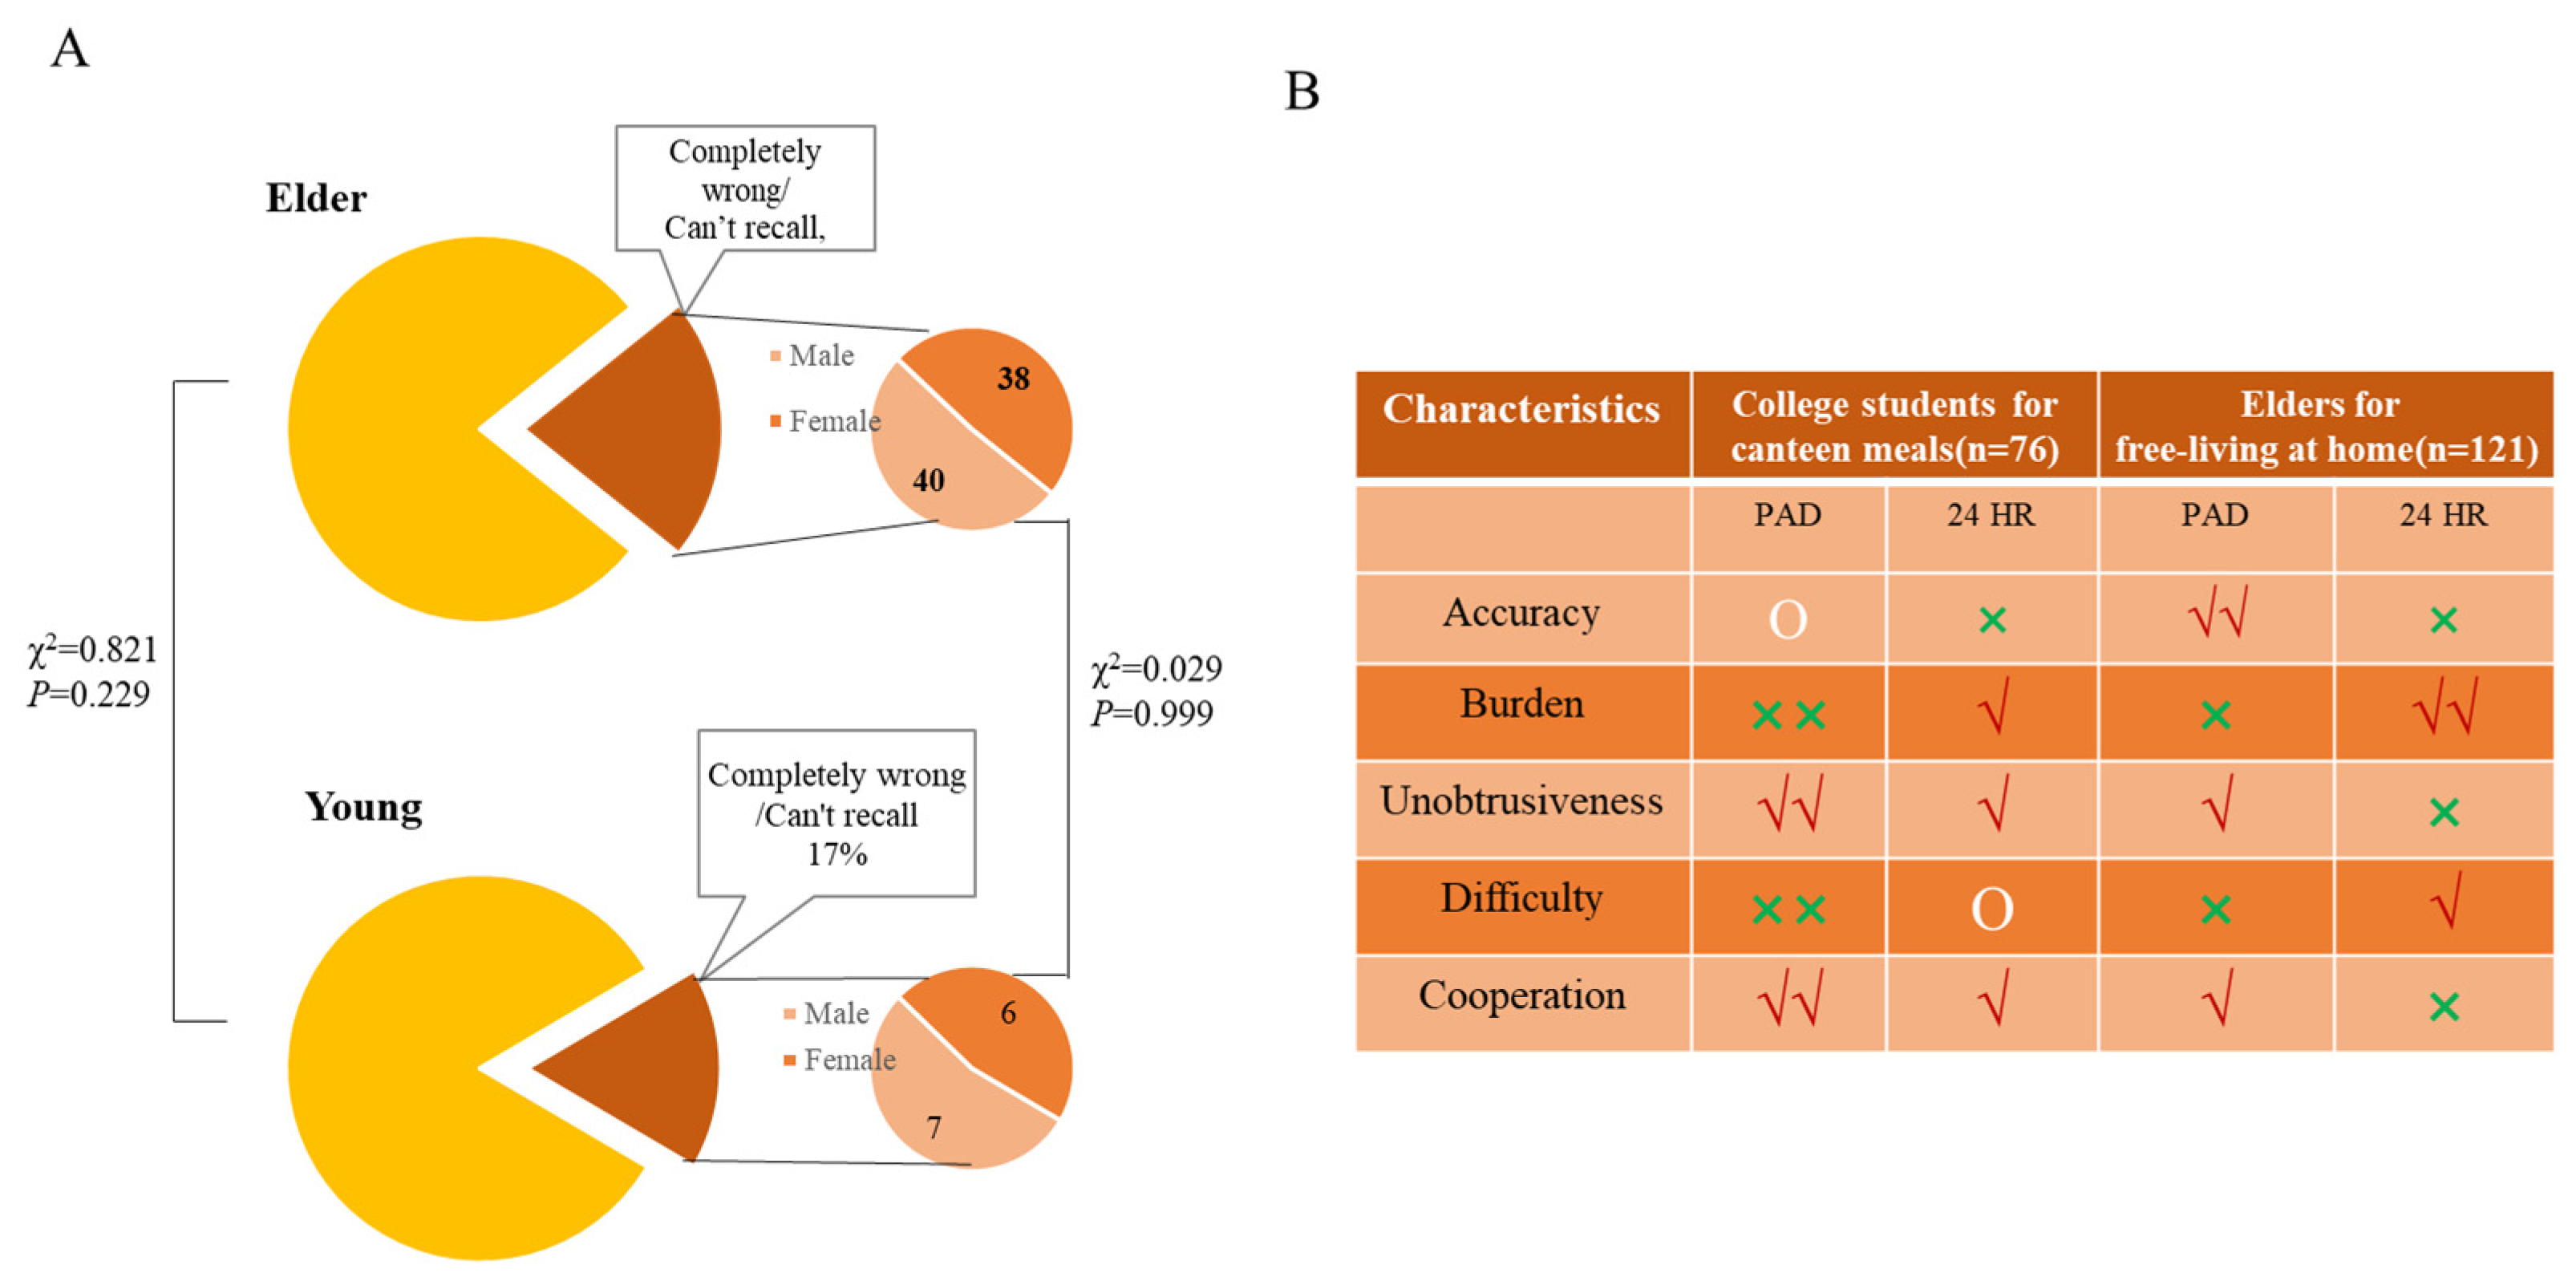
38]. Consequently, with the 24-h dietary recall method, participants were unable to precisely recollect and assess the weights of food items that contained inedible components, such as chicken legs, resulting in a substantial discrepancy between the recalled values and the actual values. With the PAD method, the dietary assessors utilized the food atlas to estimate the inedible portions of foods. This involved fixing the percentage of inedible foods based on the average proportion from the majority of meats, such as chicken/duck legs, ribs, fish, and shrimp. However, it should be noted that the edible proportions of different food parts varied, and using average proportion data instead of actual data may introduce some degree of error. Additionally, it is worth mentioning that the good acceptance and implementation of the PAD method were observed for both students and the elderly population, as evidenced by the questionnaire and the feedback received (
Figure 6B).
Tubers exhibited an exceptional profile, wherein the bias value for tuber deviation was observed to be smaller when employing the 24 HR method as opposed to the PAD method. This discrepancy may be attributed to Chinese eating habits, specifically the consumption of tubers such as sweet potato, yam, and potato, which are commonly considered staple foods and are typically served whole for direct consumption, rather than being placed in a container for photographing, which often leads to the omission of captured images, while eating the whole food makes it easier to recall and convert the measurements into its mass. The exclusion of dairy products and beverages from this study may perplex readers, as these items typically come in pre-packaged forms with specified net contents. Estimating the consumption of beverages is generally simpler than estimating the intake of food. For the estimation of tuber mass, there was an insignificant difference observed in the weights obtained through three methods (see
Figure 3 and
Table 2). However, it is worth noting that the percentage of derivation exceeding 50% was higher with the PAD method compared to the 24 HR method, which could be attributed to the smaller sample size.
Despite the presence of exceptions, the PAD method exhibited a multitude of advantages. On one hand, the present study aligned more closely with the actuality of Chinese diets by considering the distinctive features of Chinese dietetic culture. This study encompassed a diverse range of culinary items, encompassing starchy products such as fish balls, fish bean curd, vermicelli, sausage with starch, etc., as well as blood curd (specifically duck blood). These particular dishes have not been previously documented. Furthermore, the weights of all the food items were approximated by considering mixed dishes, i.e., photographs capturing the entirety of the mixed dish and subsequently recording and estimating the weight of each ingredient within the mixed dish. This estimation process was conducted using a substantial amount of data and the creation of a comprehensive food atlas. The weighing method necessitates the individual weighing of each ingredient in a dish, demanding a significant level of dexterity and expertise, thus resulting in a more intricate and time-intensive process compared to the PAD method. Furthermore, a notable distinction between the PAD method and previously reported image-assisted methods lies in their approaches to converting food weights. Specifically, the PAD method employs a graduated bowl to serve a mixed dish, ensuring an accuracy of 0.1 cm. This allows for the recognition and conversion of the volume occupied by each food into its corresponding mass. Consequently, the PAD method effectively mitigates the loss of mass attributed to the height or thickness of a food, a limitation observed for prior methods [
10,
22,
34]. This advantage is particularly applicable to estimating the weights of ingredients that exhibit diverse shapes, such as chunks, bars, dice, and so forth. However, it should be noted that the estimated volume of foods with irregular shapes may introduce certain inaccuracies that cannot be mitigated using the existing assessment methodologies. The inclusion of dish images serves as a valuable aid in identifying the cooking technique employed, thereby influencing the alteration of food mass, particularly in the context of Chinese cuisine [
38,
39]. China uses various cooking methods, such as cold eggplant and roasted eggplant, each of which has distinct effects on the mass of the vegetable. Cold eggplant is typically steamed, resulting in a significant loss of water during the steaming process, leading to a raw/cooked ratio of approximately 50%. On the other hand, roasted eggplant is deep-fried and coated with a batter (e.g., flour and egg wash) prior to frying, resulting in minimal water loss with an increase in the weight of the eggplant [
40]. Consequently, the different cooking methods pose challenges in accurately estimating the weight of the eggplant. The utilization of the proposed method can enhance the precision of weight estimations based on the cooking technique employed in this research. Consequently, the employment of PAD can effectively guarantee the accuracy of dietary assessments to the greatest extent possible. On the other hand, this study encompassed a diverse range of participants in terms of ages and meal patterns, including individuals who dined at group canteens and prepared meals at home, thus representing a wide spectrum of dining styles [
41,
42]. Moreover, the study specifically targeted college students with limited life and cooking experience, as well as elderly individuals with declining physiology, both of whom require special attention and may exhibit reduced accuracy [
18,
43]. Consequently, the utilization of the PAD method in this study effectively demonstrated its suitability and practical implementation in dietary assessments.
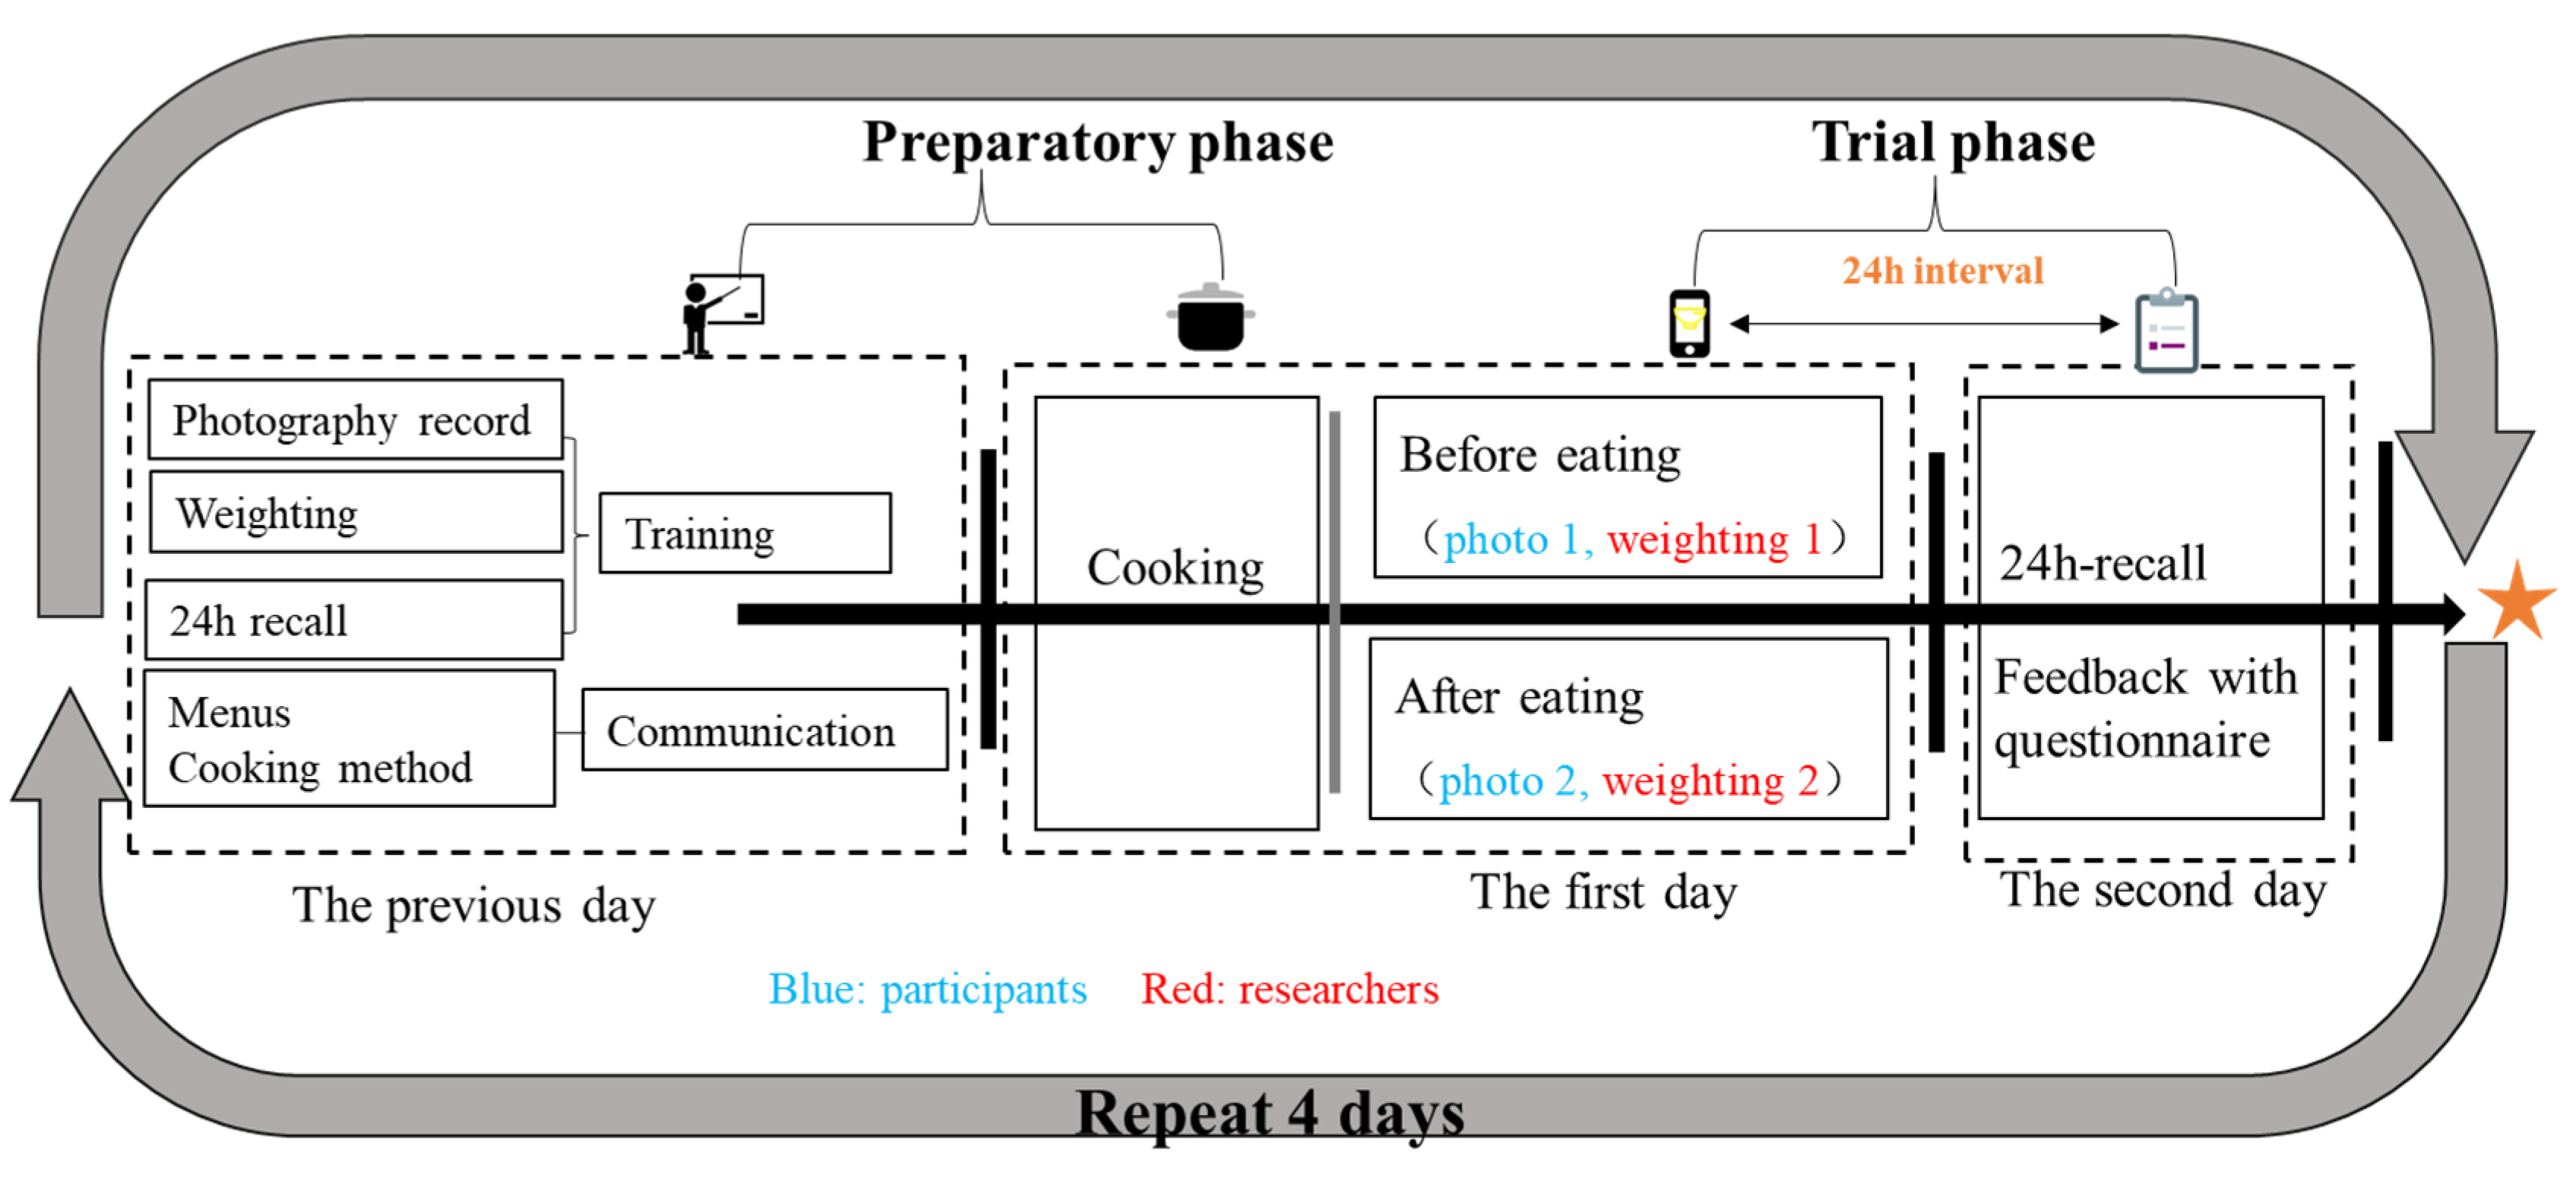
Another limitation that should be elucidated pertains to the exclusion of certain types of foods, specifically condiments. Condiments pose challenges when employing the PAD method for analysis due to their minimal mass and the inherent difficulty in estimating their quantities even using alternative methodologies. In the evaluation of the PAD accuracy, fruits were not involved; the reason was partly due to the forbidding of raw food ingredients in the group canteens for food safety during the COVID-19 period. In addition, fruits are always eaten directly as a whole or a half, rather than put in containers, and they are eaten during two meal intervals, rather than during meal time; this consumption pattern was just observed in this study among the elderly population. Furthermore, this study solely examined the comparative accuracy of dinner consumption. It was observed that numerous college students who frequently skipped breakfast or lunch due to waking up late or missing lunchtime often resorted to irregular eating patterns. Although dinner alone does not encompass the entirety of a day’s dietary intake, it holds significant importance as the primary meal in Chinese culture. Consequently, dinner can be considered somewhat representative in validating the PAD method.


 ,
, 


