The Effect of Time-Restricted Eating on Cardiometabolic Risk Factors: A Systematic Review and Meta-Analysis
Abstract
:1. Introduction
2. Materials and Methods
2.1. Search Strategy
2.2. Study Selection
2.3. Data Extraction
2.4. Quality Assessment Analysis
2.5. Data Analyses and Statistical Methods
3. Results
3.1. Study Characteristics
3.2. Quality Assessment Results
3.3. Effect of TRE on Body Mass Index (BMI) and Weight
3.4. Effect of TRE on Whole-Body Fat Mass (WBFM), Lean Mass (LM), and Total Body Water (TBW)
3.5. Effect of TRE on Body Measurements
3.6. Effect of TRE on Blood Pressure
3.7. Effect of TRE on Metabolic Parameters
3.8. Evaluation of Heterogeneity
3.9. Effect of Risk of Bias on Results
4. Discussion
5. Conclusions
Supplementary Materials
Author Contributions
Funding
Institutional Review Board Statement
Informed Consent Statement
Data Availability Statement
Conflicts of Interest
References
- Kuhlman, S.J.; Craig, L.M.; Duffy, J.F. Introduction to Chronobiology. Cold Spring Harb. Perspect. Biol. 2018, 10, a033613. [Google Scholar] [CrossRef] [PubMed]
- Flanagan, A.; Bechtold, D.A.; Pot, G.K.; Johnston, J.D. Chrono-Nutrition: From Molecular and Neuronal Mechanisms to Human Epidemiology and Timed Feeding Patterns. J. Neurochem. 2021, 157, 53–72. [Google Scholar] [CrossRef] [PubMed]
- O’Neill, J.S.; Feeney, K.A. Circadian Redox and Metabolic Oscillations in Mammalian Systems. Antioxid. Redox Signal. 2014, 20, 2966–2981. [Google Scholar] [CrossRef] [PubMed]
- Fulgham, C.V.; Dreyer, A.P.; Nasseri, A.; Miller, A.N.; Love, J.; Martin, M.M.; Jabr, D.A.; Saurabh, S.; Cavanaugh, D.J. Central and Peripheral Clock Control of Circadian Feeding Rhythms. J. Biol. Rhythm. 2021, 36, 548–566. [Google Scholar] [CrossRef] [PubMed]
- Partch, C.L.; Green, C.B.; Takahashi, J.S. Molecular Architecture of the Mammalian Circadian Clock. Trends Cell Biol. 2014, 24, 90–99. [Google Scholar] [CrossRef]
- Cermakian, N.; Boivin, D.B. The Regulation of Central and Peripheral Circadian Clocks in Humans. Obes. Rev. 2009, 10 (Suppl. S2), 25–36. [Google Scholar] [CrossRef]
- Astiz, M.; Heyde, I.; Oster, H. Mechanisms of Communication in the Mammalian Circadian Timing System. Int. J. Mol. Sci. 2019, 20, 343. [Google Scholar] [CrossRef]
- Sato, T.; Sassone-Corsi, P. Nutrition, Metabolism, and Epigenetics: Pathways of Circadian Reprogramming. EMBO Rep. 2022, 23, e52412. [Google Scholar] [CrossRef]
- Oster, H.; Challet, E.; Ott, V.; Arvat, E.; de Kloet, E.R.; Dijk, D.J.; Lightman, S.; Vgontzas, A.; Van Cauter, E. The Functional and Clinical Significance of the 24-Hour Rhythm of Circulating Glucocorticoids. Endocr. Rev. 2017, 38, 3–45. [Google Scholar] [CrossRef]
- Hutchison, A.T.; Wittert, G.A.; Heilbronn, L.K. Matching Meals to Body Clocks—Impact on Weight and Glucose Metabolism. Nutrients 2017, 9, 222. [Google Scholar] [CrossRef]
- Van Drunen, R.; Eckel-Mahan, K. Circadian Rhythms of the Hypothalamus: From Function to Physiology. Clocks Sleep. 2021, 3, 189–226. [Google Scholar] [CrossRef] [PubMed]
- Rynders, C.A.; Thomas, E.A.; Zaman, A.; Pan, Z.; Catenacci, V.A.; Melanson, E.L. Effectiveness of Intermittent Fasting and Time-Restricted Feeding Compared to Continuous Energy Restriction for Weight Loss. Nutrients 2019, 11, 2442. [Google Scholar] [CrossRef] [PubMed]
- Chaix, A.; Zarrinpar, A.; Miu, P.; Panda, S. Time-Restricted Feeding Is a Preventative and Therapeutic Intervention against Diverse Nutritional Challenges. Cell Metab. 2014, 20, 991–1005. [Google Scholar] [CrossRef] [PubMed]
- Hatori, M.; Vollmers, C.; Zarrinpar, A.; DiTacchio, L.; Bushong, E.A.; Gill, S.; Leblanc, M.; Chaix, A.; Joens, M.; Fitzpatrick, J.A.J.; et al. Time-Restricted Feeding without Reducing Caloric Intake Prevents Metabolic Diseases in Mice Fed a High-Fat Diet. Cell Metab. 2012, 15, 848–860. [Google Scholar] [CrossRef] [PubMed]
- Réda, A.; Wassil, M.; Mériem, M.; Alexia, P.; Abdelmalik, H.; Sabine, B.; Nassir, M. Food Timing, Circadian Rhythm and Chrononutrition: A Systematic Review of Time-Restricted Eating’s Effects on Human Health. Nutrients 2020, 12, 3770. [Google Scholar] [CrossRef]
- Gabel, K.; Cienfuegos, S.; Kalam, F.; Ezpeleta, M.; Varady, K.A. Time-Restricted Eating to Improve Cardiovascular Health. Curr. Atheroscler. Rep. 2021, 23, 22. [Google Scholar] [CrossRef]
- Moon, S.; Kang, J.; Kim, S.H.; Chung, H.S.; Kim, Y.J.; Yu, J.M.; Cho, S.T.; Oh, C.M.; Kim, T. Beneficial Effects of Time-Restricted Eating on Metabolic Diseases: A Systemic Review and Meta-Analysis. Nutrients 2020, 12, 1267. [Google Scholar] [CrossRef]
- Liu, L.; Chen, W.; Wu, D.; Hu, F. Metabolic Efficacy of Time-Restricted Eating in Adults: A Systematic Review and Meta-Analysis of Randomized Controlled Trials. J. Clin. Endocrinol. Metab. 2022, 107, 3428–3441. [Google Scholar] [CrossRef]
- Lowe, D.A.; Wu, N.; Rohdin-Bibby, L.; Moore, A.H.; Kelly, N.; Liu, Y.E.; Philip, E.; Vittinghoff, E.; Heymsfield, S.B.; Olgin, J.E.; et al. Effects of Time-Restricted Eating on Weight Loss and Other Metabolic Parameters in Women and Men with Overweight and Obesity: The TREAT Randomized Clinical Trial. JAMA Intern. Med. 2020, 180, 1491–1499. [Google Scholar] [CrossRef]
- Phillips, N.E.; Mareschal, J.; Schwab, N.; Manoogian, E.N.C.; Borloz, S.; Ostinelli, G.; Gauthier-jaques, A.; Umwali, S.; Rodriguez, E.G.; Aeberli, D.; et al. The Effects of Time-Restricted Eating versus Standard Dietary Advice on Weight, Metabolic Health and the Consumption of Processed Food: A Pragmatic Randomised Controlled Trial in Community-Based Adults. Nutrients 2021, 13, 1042. [Google Scholar] [CrossRef]
- Che, T.; Yan, C.; Tian, D.; Zhang, X.; Liu, X.; Wu, Z. Time-Restricted Feeding Improves Blood Glucose and Insulin Sensitivity in Overweight Patients with Type 2 Diabetes: A Randomised Controlled Trial. Nutr. Metab. 2021, 18, 88. [Google Scholar] [CrossRef] [PubMed]
- Chair, S.Y.; Cai, H.; Cao, X.; Qin, Y.; Cheng, H.Y.; Timothy, M.N.G. Intermittent Fasting in Weight Loss and Cardiometabolic Risk Reduction: A Randomized Controlled Trial. J. Nurs. Res. 2022, 30, E185. [Google Scholar] [CrossRef] [PubMed]
- Moro, T.; Tinsley, G.; Bianco, A.; Marcolin, G.; Pacelli, Q.F.; Battaglia, G.; Palma, A.; Gentil, P.; Neri, M.; Paoli, A. Effects of Eight Weeks of Time-Restricted Feeding (16/8) on Basal Metabolism, Maximal Strength, Body Composition, Inflammation, and Cardiovascular Risk Factors in Resistance-Trained Males. J. Transl. Med. 2016, 14, 290. [Google Scholar] [CrossRef] [PubMed]
- Kotarsky, C.J.; Johnson, N.R.; Mahoney, S.J.; Mitchell, S.L.; Schimek, R.L.; Stastny, S.N.; Hackney, K.J. Time-Restricted Eating and Concurrent Exercise Training Reduces Fat Mass and Increases Lean Mass in Overweight and Obese Adults. Physiol. Rep. 2021, 9, e14868. [Google Scholar] [CrossRef] [PubMed]
- Cai, H.; Qin, Y.L.; Shi, Z.Y.; Chen, J.H.; Zeng, M.J.; Zhou, W.; Chen, R.Q.; Chen, Z.Y. Effects of Alternate-Day Fasting on Body Weight and Dyslipidaemia in Patients with Non-Alcoholic Fatty Liver Disease: A Randomised Controlled Trial. BMC Gastroenterol. 2019, 19, 219. [Google Scholar] [CrossRef]
- Isenmann, E.; Dissemond, J.; Geisler, S. The Effects of a Macronutrient-Based Diet and Time-Restricted Feeding (16:8) on Body Composition in Physically Active Individuals—A 14-Week Randomised Controlled Trial. Nutrients 2021, 13, 3122. [Google Scholar] [CrossRef]
- Domaszewski, P.; Konieczny, M.; Pakosz, P.; Baczkowicz, D.; Sadowska-Krępa, E. Effect of a Six-Week Intermittent Fasting Intervention Program on the Composition of the Human Body in Women over 60 Years of Age. Int. J. Environ. Res. Public Health 2020, 17, 4138. [Google Scholar] [CrossRef]
- Tinsley, G.M.; Moore, M.L.; Graybeal, A.J.; Paoli, A.; Kim, Y.; Gonzales, J.U.; Harry, J.R.; Vandusseldorp, T.A.; Kennedy, D.N.; Cruz, M.R. Time-Restricted Feeding plus Resistance Training in Active Females: A Randomized Trial. Am. J. Clin. Nutr. 2019, 110, 628–640. [Google Scholar] [CrossRef]
- Brady, A.J.; Langton, H.M.; Mulligan, M.; Egan, B. Effects of 8 Wk of 16:8 Time-Restricted Eating in Male Middle- and Long-Distance Runners. Med. Sci. Sports Exerc. 2021, 53, 633–642. [Google Scholar] [CrossRef]
- Tinsley, G.M.; Forsse, J.S.; Butler, N.K.; Paoli, A.; Bane, A.A.; La Bounty, P.M.; Morgan, G.B.; Grandjean, P.W. Time-Restricted Feeding in Young Men Performing Resistance Training: A Randomized Controlled Trial. Eur. J. Sport. Sci. 2017, 17, 200–207. [Google Scholar] [CrossRef]
- Jones, R.; Pabla, P.; Mallinson, J.; Nixon, A.; Taylor, T.; Bennett, A.; Tsintzas, K. Two Weeks of Early Time-Restricted Feeding (ETRF) Improves Skeletal Muscle Insulin and Anabolic Sensitivity in Healthy Men. Am. J. Clin. Nutr. 2020, 112, 1015–1028. [Google Scholar] [CrossRef] [PubMed]
- Moro, T.; Tinsley, G.; Longo, G.; Grigoletto, D.; Bianco, A.; Ferraris, C.; Guglielmetti, M.; Veneto, A.; Tagliabue, A.; Marcolin, G.; et al. Time-Restricted Eating Effects on Performance, Immune Function, and Body Composition in Elite Cyclists: A Randomized Controlled Trial. J. Int. Soc. Sports Nutr. 2020, 17, 65. [Google Scholar] [CrossRef] [PubMed]
- Lin, S.; Cienfuegos, S.; Ezpeleta, M.; Gabel, K.; Pavlou, V.; Mulas, A.; Chakos, K.; McStay, M.; Wu, J.; Tussing-Humphreys, L.; et al. Time-Restricted Eating Without Calorie Counting for Weight Loss in a Racially Diverse Population. Ann. Intern. Med. 2023, 176, 885–895. [Google Scholar] [CrossRef] [PubMed]
- Manoogian, E.N.C.; Zadourian, A.; Lo, H.C.; Gutierrez, N.R.; Shoghi, A.; Rosander, A.; Pazargadi, A.; Wang, X.; Fleischer, J.G.; Golshan, S.; et al. Protocol for a Randomised Controlled Trial on the Feasibility and Effects of 10-Hour Time-Restricted Eating on Cardiometabolic Disease Risk among Career Firefighters Doing 24-Hour Shift Work: The Healthy Heroes Study. BMJ Open 2021, 11, e045537. [Google Scholar] [CrossRef] [PubMed]
- Pavlou, V.; Cienfuegos, S.; Lin, S.; Ezpeleta, M.; Ready, K.; Corapi, S.; Wu, J.; Lopez, J.; Gabel, K.; Tussing-Humphreys, L.; et al. Effect of Time-Restricted Eating on Weight Loss in Adults with Type 2 Diabetes: A Randomized Clinical Trial. JAMA Netw. Open 2023, 6, E2339337. [Google Scholar] [CrossRef]
- Schroder, J.D.; Falqueto, H.; Mânica, A.; Zanini, D.; de Oliveira, T.; de Sá, C.A.; Cardoso, A.M.; Manfredi, L.H. Effects of Time-Restricted Feeding in Weight Loss, Metabolic Syndrome and Cardiovascular Risk in Obese Women. J. Transl. Med. 2021, 19, 3. [Google Scholar] [CrossRef]
- Ahmed, N.; Farooq, J.; Siddiqi, H.S.; Meo, S.A.; Kulsoom, B.; Laghari, A.H.; Jamshed, H.; Pasha, F. Impact of Intermittent Fasting on Lipid Profile—A Quasi-Randomized Clinical Trial. Front. Nutr. 2021, 7, 596787. [Google Scholar] [CrossRef]
- Tovar, A.P.; Richardson, C.E.; Keim, N.L.; Van Loan, M.D.; Davis, B.A.; Casazza, G.A. Four Weeks of 16/8 Time Restrictive Feeding in Endurance Trained Male Runners Decreases Fat Mass, without Affecting Exercise Performance. Nutrients 2021, 13, 2941. [Google Scholar] [CrossRef]
- Sutton, E.F.; Beyl, R.; Early, K.S.; Cefalu, W.T.; Ravussin, E.; Peterson, C.M. Early Time-Restricted Feeding Improves Insulin Sensitivity, Blood Pressure, and Oxidative Stress Even without Weight Loss in Men with Prediabetes. Cell Metab. 2018, 27, 1212–1221.e3. [Google Scholar] [CrossRef]
- Parr, E.B.; Devlin, B.L.; Radford, B.E.; Hawley, J.A. A Delayed Morning and Earlier Evening Time-Restricted Feeding Protocol for Improving Glycemic Control and Dietary Adherence in Men with Overweight/Obesity: A Randomized Controlled Trial. Nutrients 2020, 12, 505. [Google Scholar] [CrossRef]
- Jamshed, H.; Beyl, R.A.; Manna, D.L.D.; Yang, E.S.; Ravussin, E.; Peterson, C.M. Early Time-Restricted Feeding Improves 24-Hour Glucose Levels and Affects Markers of the Circadian Clock, Aging, and Autophagy in Humans. Nutrients 2019, 11, 1234. [Google Scholar] [CrossRef] [PubMed]
- Meessen, E.C.E.; Andresen, H.; van Barneveld, T.; van Riel, A.; Johansen, E.I.; Kolnes, A.J.; Kemper, E.M.; Olde Damink, S.W.M.; Schaap, F.G.; Romijn, J.A.; et al. Differential Effects of One Meal per Day in the Evening on Metabolic Health and Physical Performance in Lean Individuals. Front. Physiol. 2022, 12, 771944. [Google Scholar] [CrossRef] [PubMed]
- Stote, K.S.; Baer, D.J.; Spears, K.; Paul, D.R.; Keith Harris, G.; Rumpler, W.V.; Strycula, P.; Najjar, S.S.; Ferrucci, L.; Ingram, D.K. A controlled trial of reduced meal frequency without caloric restriction in healthy, normal-weight, middle-aged adult. Am. J. Clin. Nutr. 2007, 85, 981–988. [Google Scholar] [CrossRef] [PubMed]
- Richardson, C.E.; Tovar, A.P.; Davis, B.A.; Van Loan, M.D.; Keim, N.L.; Casazza, G.A. An Intervention of Four Weeks of Time-Restricted Eating (16/8) in Male Long-Distance Runners Does Not Affect Cardiometabolic Risk Factors. Nutrients 2023, 15, 985. [Google Scholar] [CrossRef]
- Wilkinson, M.J.; Manoogian, E.N.C.; Zadourian, A.; Lo, H.; Fakhouri, S.; Shoghi, A.; Wang, X.; Fleischer, J.G.; Navlakha, S.; Panda, S.; et al. Ten-Hour Time-Restricted Eating Reduces Weight, Blood Pressure, and Atherogenic Lipids in Patients with Metabolic Syndrome. Cell Metab. 2020, 31, 92–104.e5. [Google Scholar] [CrossRef]
- Buhr, E.D.; Takahashi, J.S. Molecular Components of the Mammalian Circadian Clock. Handb. Exp. Pharmacol. 2013, 217, 3–27. [Google Scholar] [CrossRef]
- Nicolaides, N.C.; Charmandari, E.; Chrousos, G.P.; Kino, T. Circadian Endocrine Rhythms: The Hypothalamic-Pituitary-Adrenal Axis and Its Actions. Ann. N. Y. Acad. Sci. 2014, 1318, 71–80. [Google Scholar] [CrossRef]
- Cox, K.H.; Takahashi, J.S. Circadian Clock Genes and the Transcriptional Architecture of the Clock Mechanism. J. Mol. Endocrinol. 2019, 63, R93–R102. [Google Scholar] [CrossRef]
- Turek, F.W.; Joshu, C.; Kohsaka, A.; Lin, E.; Ivanova, G.; McDearmon, E.; Laposky, A.; Losee-Olson, S.; Easton, A.; Jensen, D.R.; et al. Obesity and Metabolic Syndrome in Circadian Clock Mutant Nice. Science 2005, 308, 1043–1045. [Google Scholar] [CrossRef]
- McDearmon, E.L.; Patel, K.N.; Ko, C.H.; Walisser, J.A.; Schook, A.C.; Chong, J.L.; Wilsbacher, L.D.; Song, E.J.; Hong, H.K.; Bradfield, C.A.; et al. Dissecting the Functions of the Mammalian Clock Protein BMAL1 by Tissue-Specific Rescue in Mice. Science 2006, 314, 1304–1308. [Google Scholar] [CrossRef]
- Lamia, K.A.; Storch, K.-F.; Weitz, C.J. Physiological Significance of a Peripheral Tissue Circadian Clock. Proc. Natl. Acad. Sci. USA 2008, 105, 15172–15177. [Google Scholar] [CrossRef] [PubMed]
- Światkiewicz, I.; Woźniak, A.; Taub, P.R. Time-Restricted Eating and Metabolic Syndrome: Current Status and Future Perspectives. Nutrients 2021, 13, 221. [Google Scholar] [CrossRef] [PubMed]
- Borgundvaag, E.; Mak, J.; Pharm, B.; Kramer, C.K.; Kramer, C.K. Metabolic Impact of Intermittent Fasting in Patients with Type 2 Diabetes Mellitus: A Systematic Review and Meta-Analysis of Interventional Studies. J. Clin. Endocrinol. Metab. 2021, 106, 902–911. [Google Scholar] [CrossRef] [PubMed]
- Yang, F.; Liu, C.; Liu, X.; Pan, X.; Li, X.; Tian, L.; Sun, J.; Yang, S.; Zhao, R.; An, N.; et al. Effect of Epidemic Intermittent Fasting on Cardiometabolic Risk Factors: A Systematic Review and Meta-Analysis of Randomized Controlled Trials. Front. Nutr. 2021, 8, 669325. [Google Scholar] [CrossRef]
- Yuan, X.; Wang, J.; Yang, S.; Gao, M.; Cao, L.; Li, X.; Hong, D.; Tian, S.; Sun, C. Effect of Intermittent Fasting Diet on Glucose and Lipid Metabolism and Insulin Resistance in Patients with Impaired Glucose and Lipid Metabolism: A Systematic Review and Meta-Analysis. Int. J. Endocrinol. 2022, 2022, 6999907. [Google Scholar] [CrossRef]


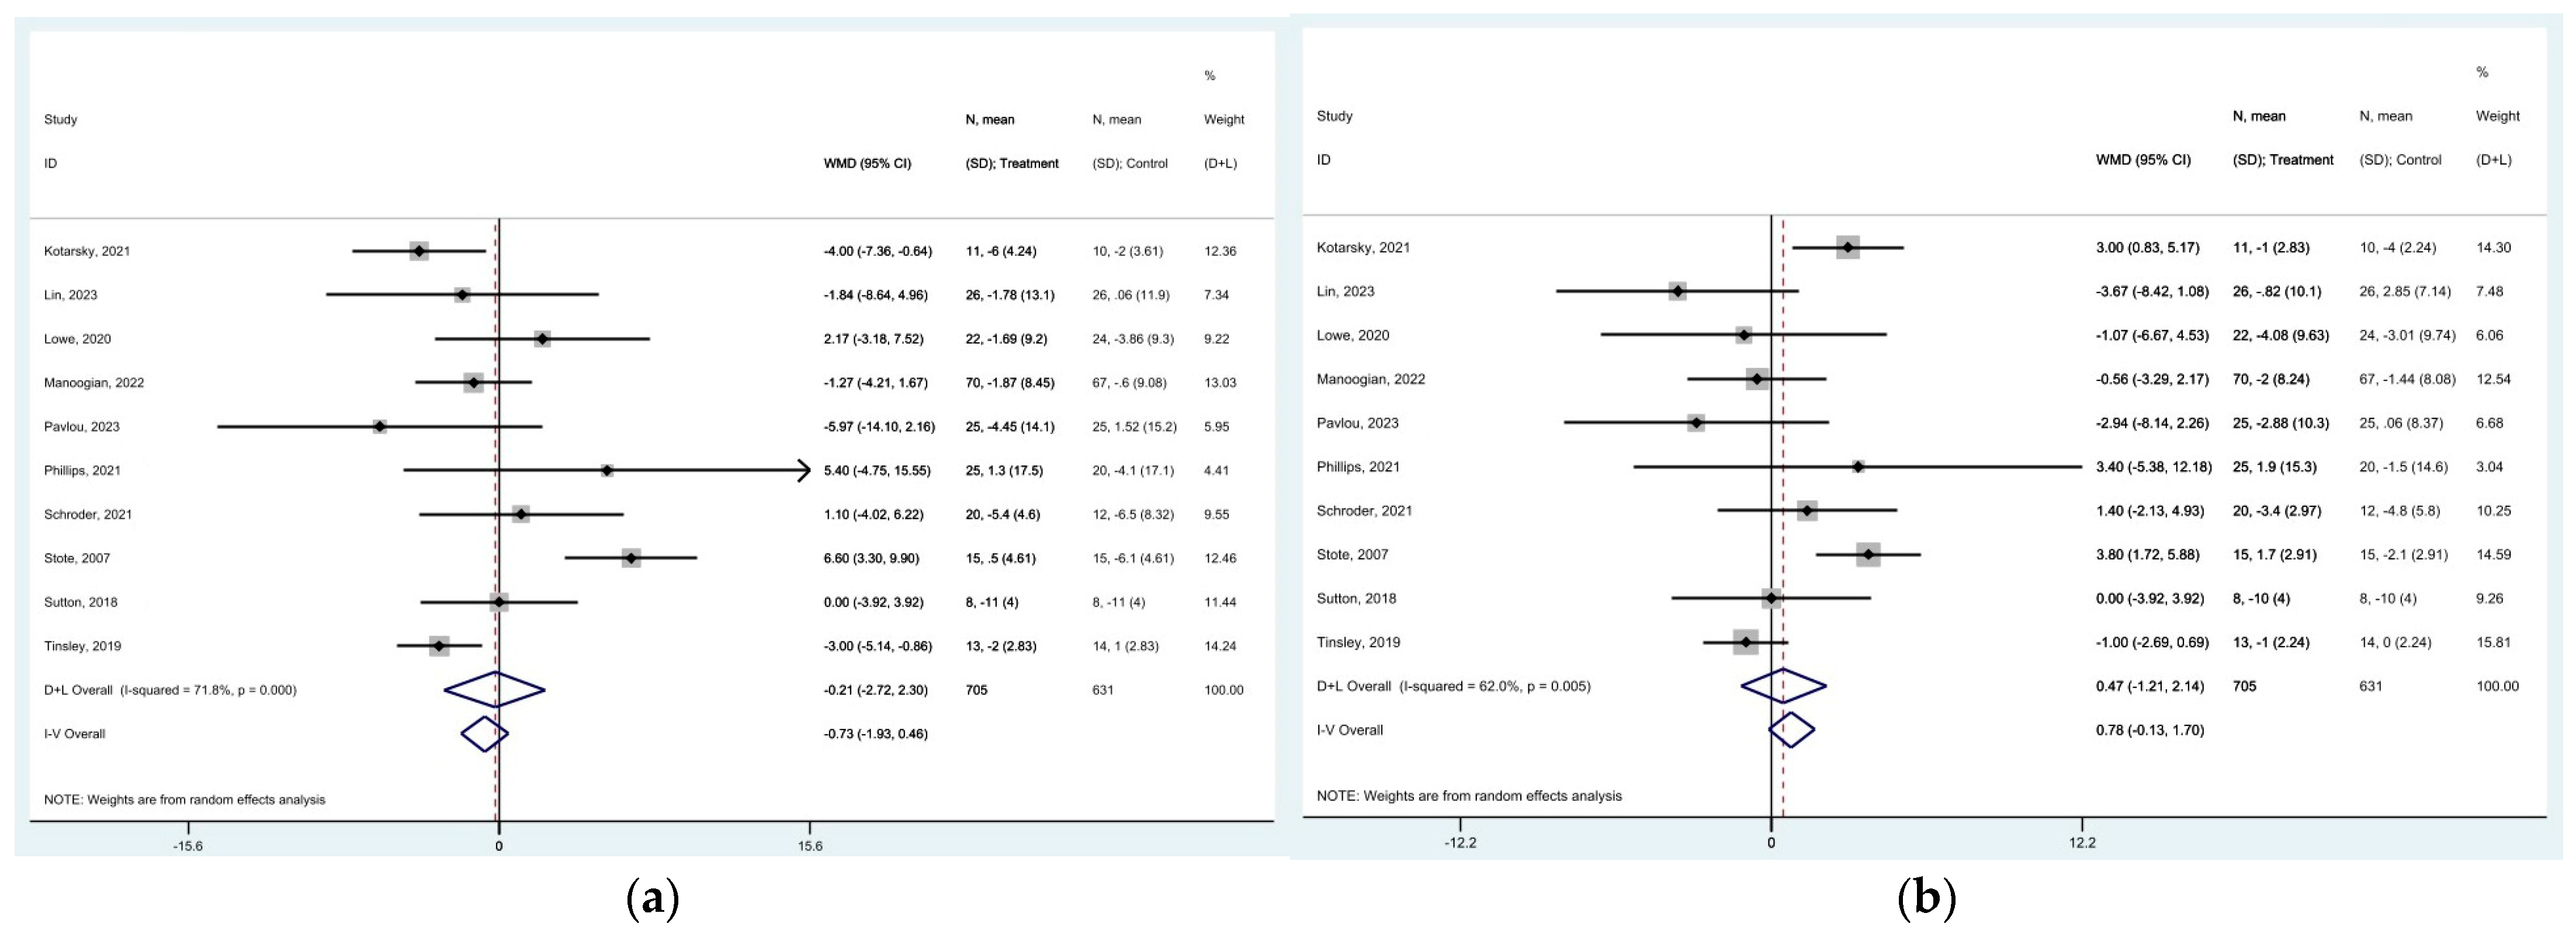
 represent effect estimates for each study, with size proportional to study weight. Horizontal lines indicate 95% confidence intervals (CI). The diamond
  shows the pooled effect, with its width representing the 95% CI. The vertical line
  through the diamond represents the overall effect estimate. The central vertical line
  at zero marks no effect; confidence intervals crossing this line indicate non-significant results. “D+L” and “IV” indicate different pooling methods (random-effects and fixed-effects, respectively). I2 and p-value indicate heterogeneity across studies [19,20,21,22,23,24,25,26,28,29,30,31,32,33,35,36,37,38,39,42,43,44].
 represent effect estimates for each study, with size proportional to study weight. Horizontal lines indicate 95% confidence intervals (CI). The diamond
  shows the pooled effect, with its width representing the 95% CI. The vertical line
  through the diamond represents the overall effect estimate. The central vertical line
  at zero marks no effect; confidence intervals crossing this line indicate non-significant results. “D+L” and “IV” indicate different pooling methods (random-effects and fixed-effects, respectively). I2 and p-value indicate heterogeneity across studies [19,20,21,22,23,24,25,26,28,29,30,31,32,33,35,36,37,38,39,42,43,44].
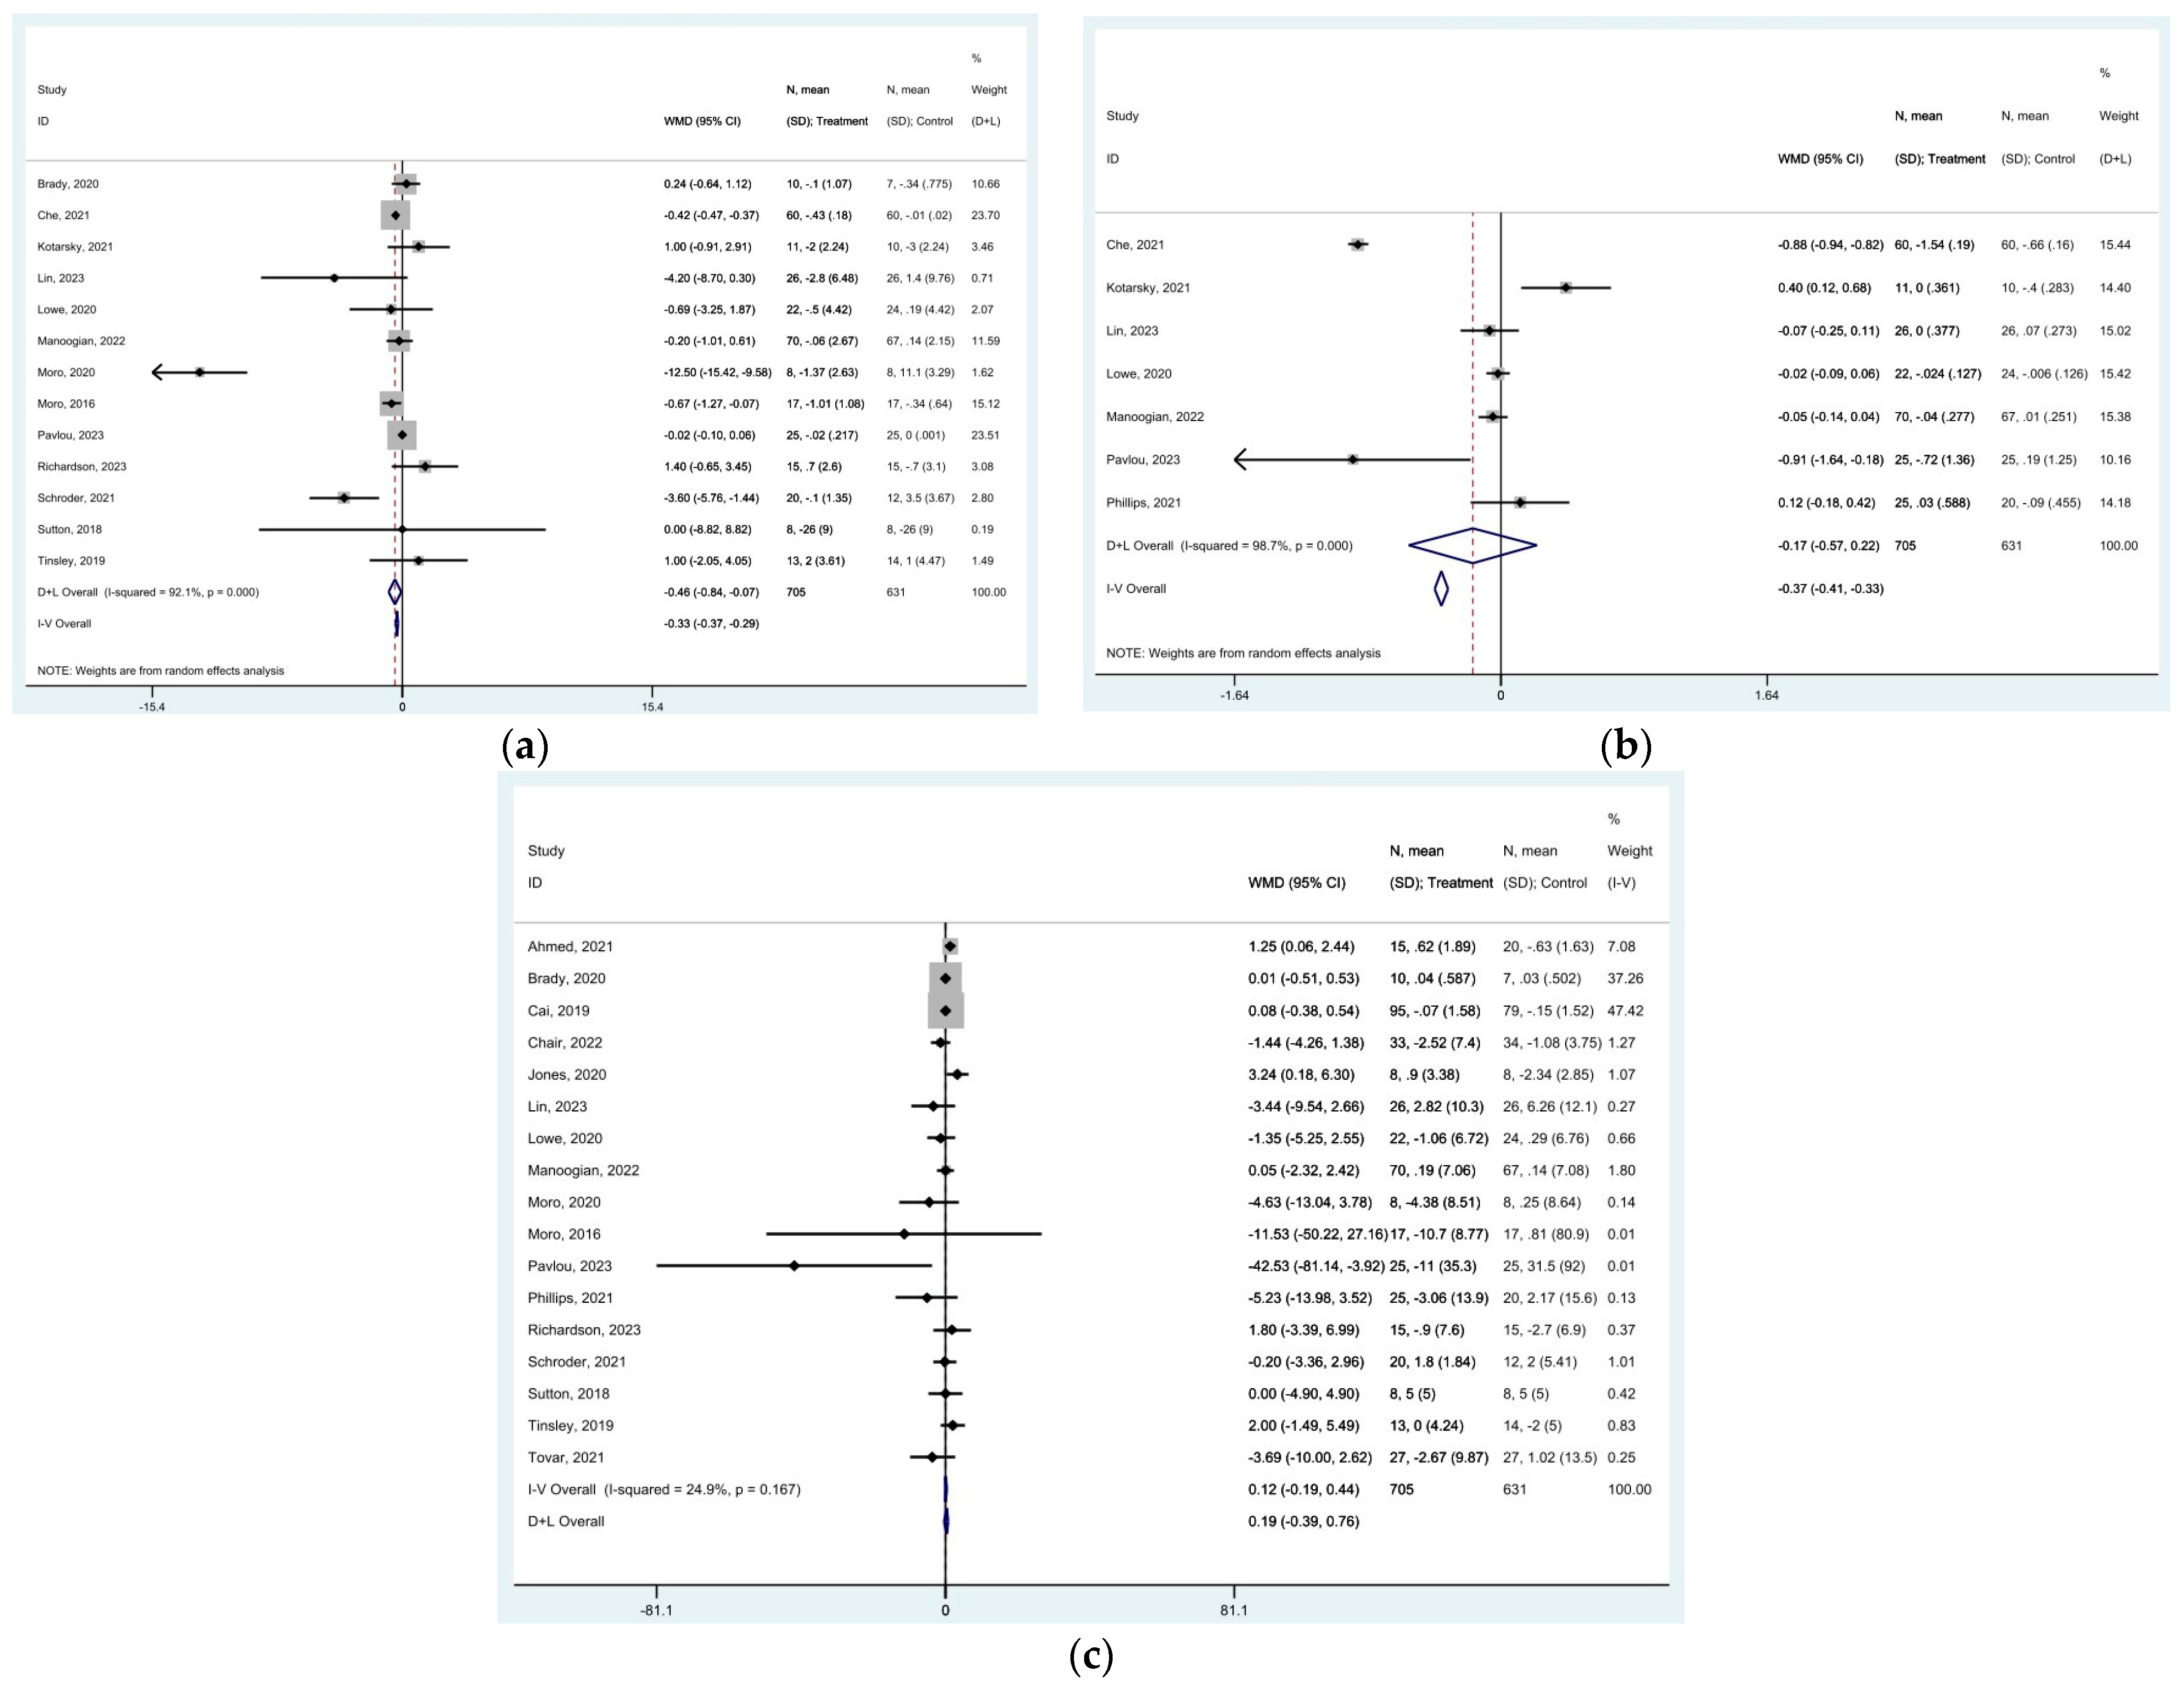
 represent effect estimates for each study, with size proportional to study weight. Horizontal lines indicate 95% confidence intervals (CI). The diamond
  shows the pooled effect, with its width representing the 95% CI. The vertical line
  through the diamond represents the overall effect estimate. The central vertical line
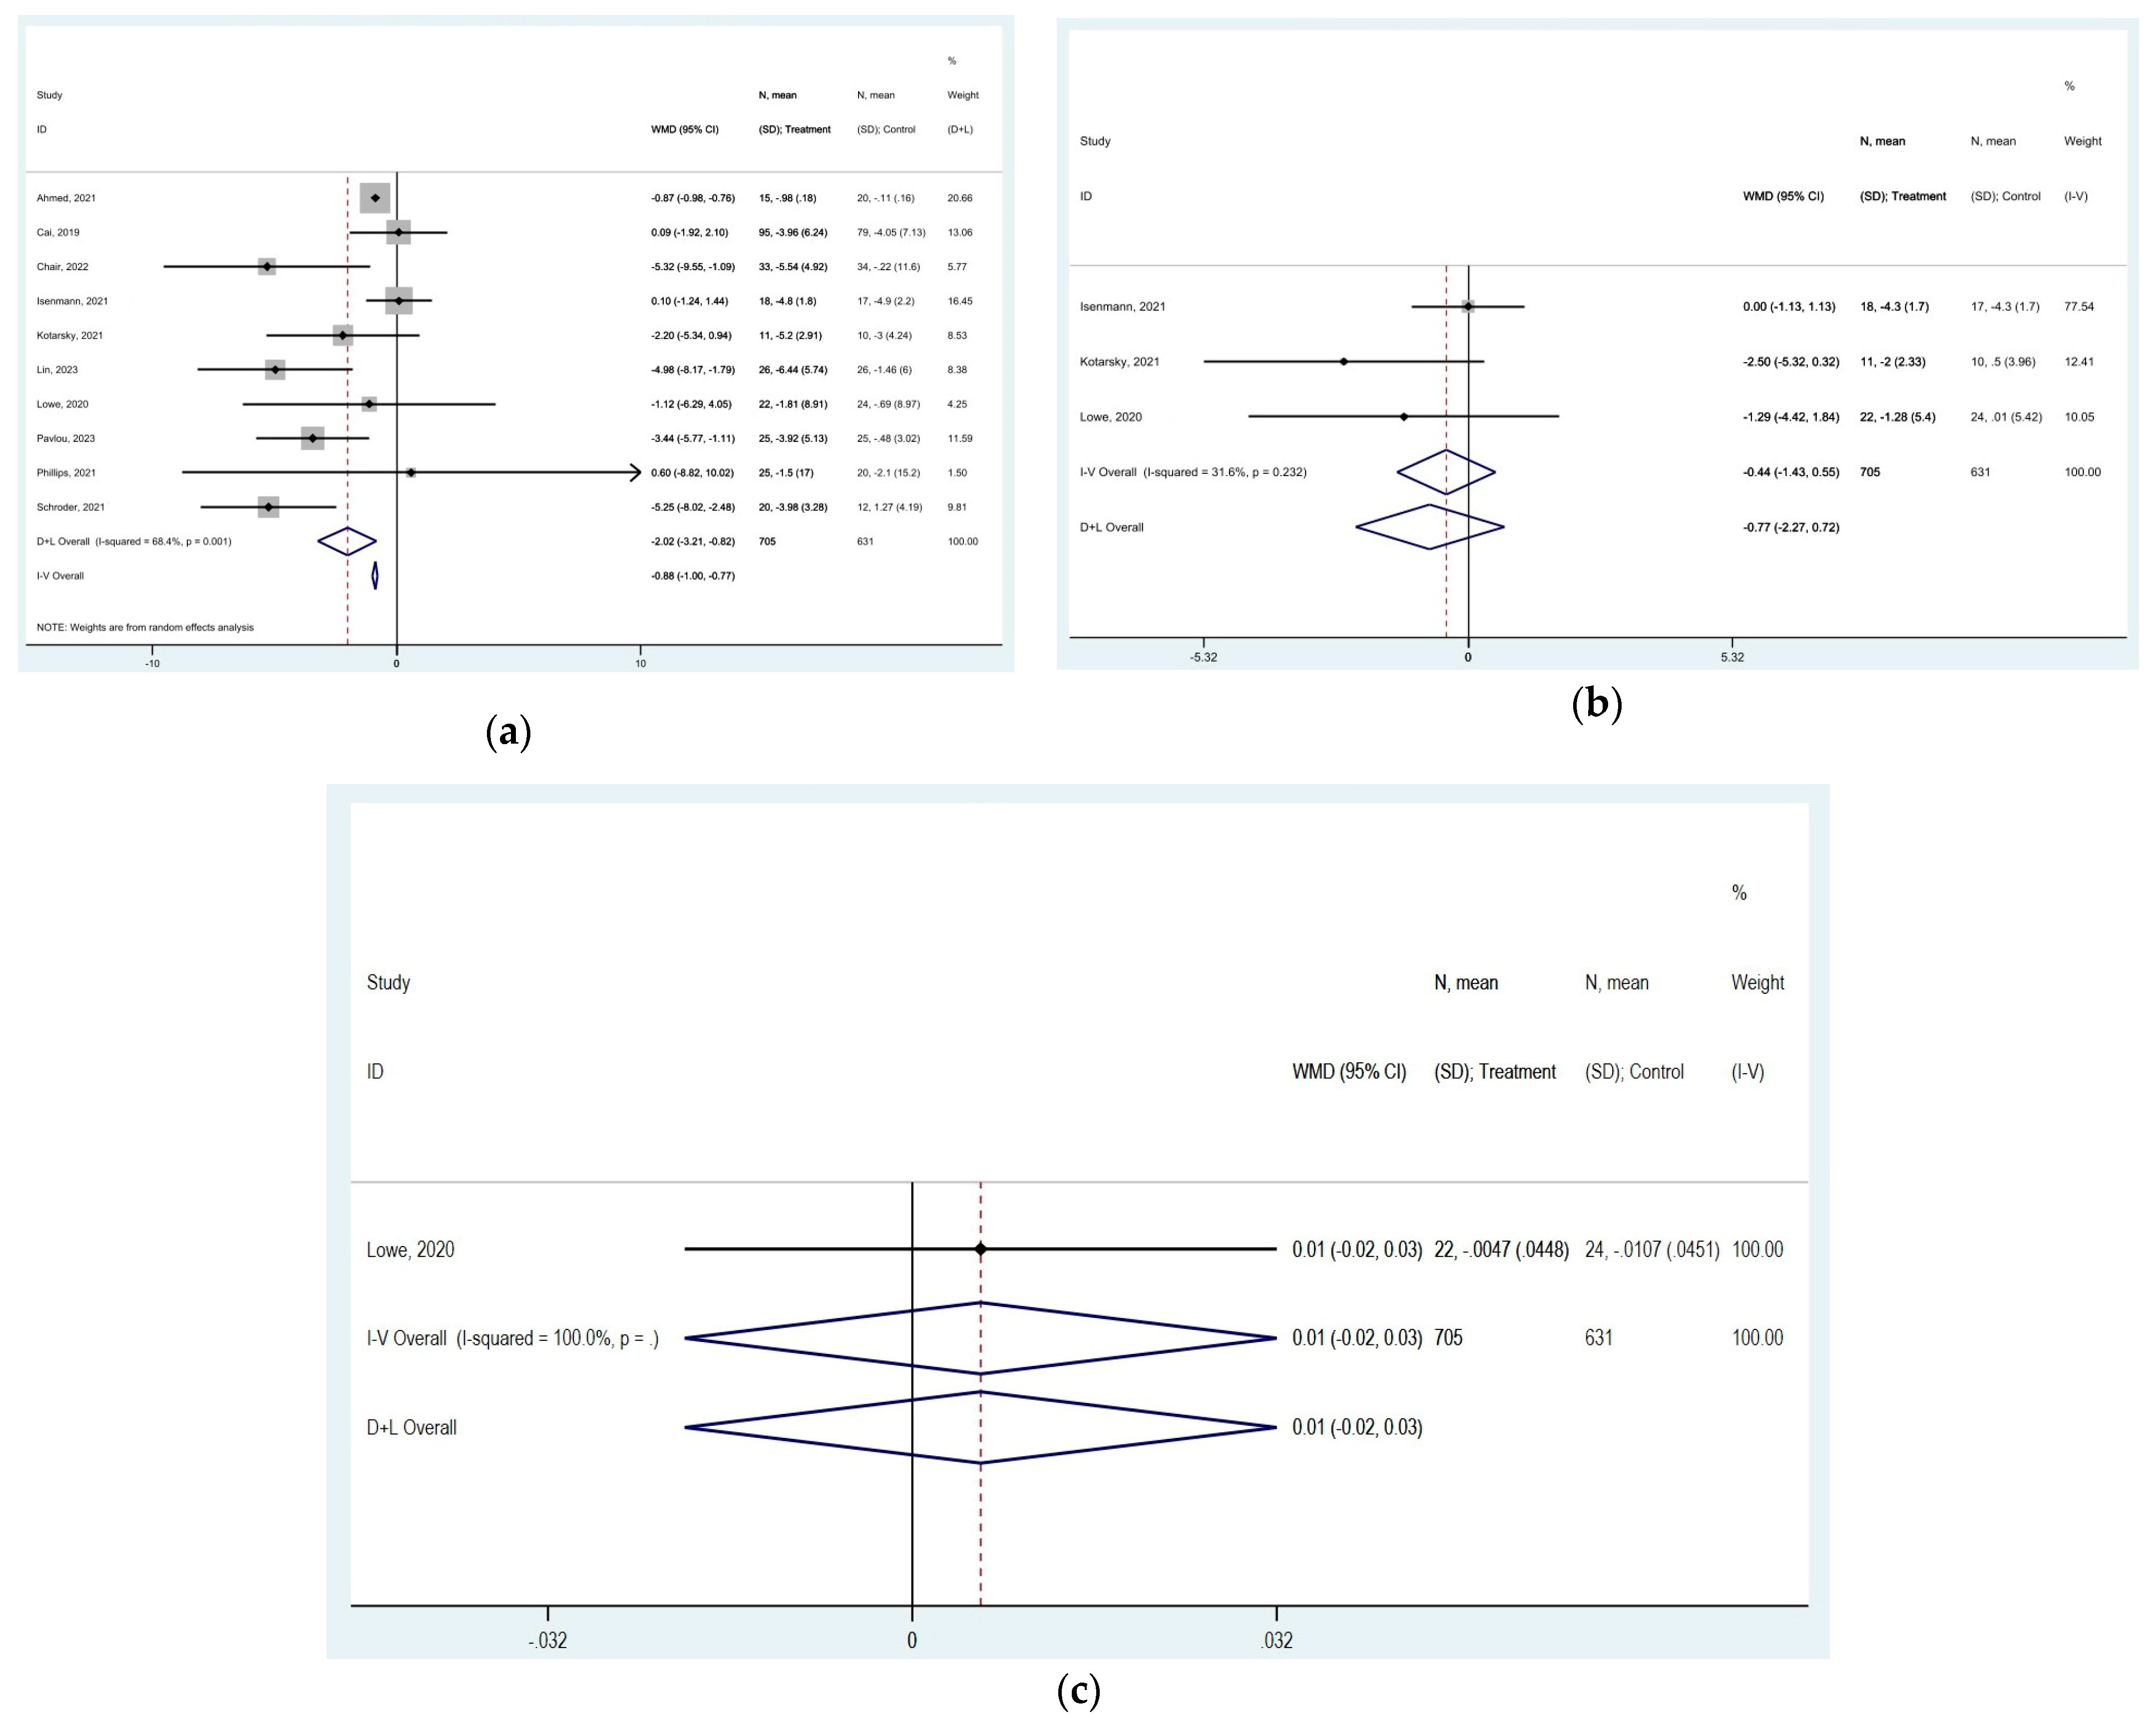
  at zero marks no effect; confidence intervals crossing this line indicate non-significant results. “D+L” and “IV” indicate different pooling methods (random-effects and fixed-effects, respectively). I2 and p-value indicate heterogeneity across studies [19,20,22,24,25,26,33,35,36,37].
 represent effect estimates for each study, with size proportional to study weight. Horizontal lines indicate 95% confidence intervals (CI). The diamond
  shows the pooled effect, with its width representing the 95% CI. The vertical line
  through the diamond represents the overall effect estimate. The central vertical line
  at zero marks no effect; confidence intervals crossing this line indicate non-significant results. “D+L” and “IV” indicate different pooling methods (random-effects and fixed-effects, respectively). I2 and p-value indicate heterogeneity across studies [19,20,22,24,25,26,33,35,36,37].
 represent effect estimates for each study, with size proportional to study weight. Horizontal lines indicate 95% confidence intervals (CI). The diamond
  shows the pooled effect, with its width representing the 95% CI. The vertical line
  through the diamond represents the overall effect estimate. The central vertical line
  at zero marks no effect; confidence intervals crossing this line indicate non-significant results. “D+L” and “IV” indicate different pooling methods (random-effects and fixed-effects, respectively). I2 and p-value indicate heterogeneity across studies [19,20,24,28,33,34,35,36,39,43].
 represent effect estimates for each study, with size proportional to study weight. Horizontal lines indicate 95% confidence intervals (CI). The diamond
  shows the pooled effect, with its width representing the 95% CI. The vertical line
  through the diamond represents the overall effect estimate. The central vertical line
  at zero marks no effect; confidence intervals crossing this line indicate non-significant results. “D+L” and “IV” indicate different pooling methods (random-effects and fixed-effects, respectively). I2 and p-value indicate heterogeneity across studies [19,20,24,28,33,34,35,36,39,43].
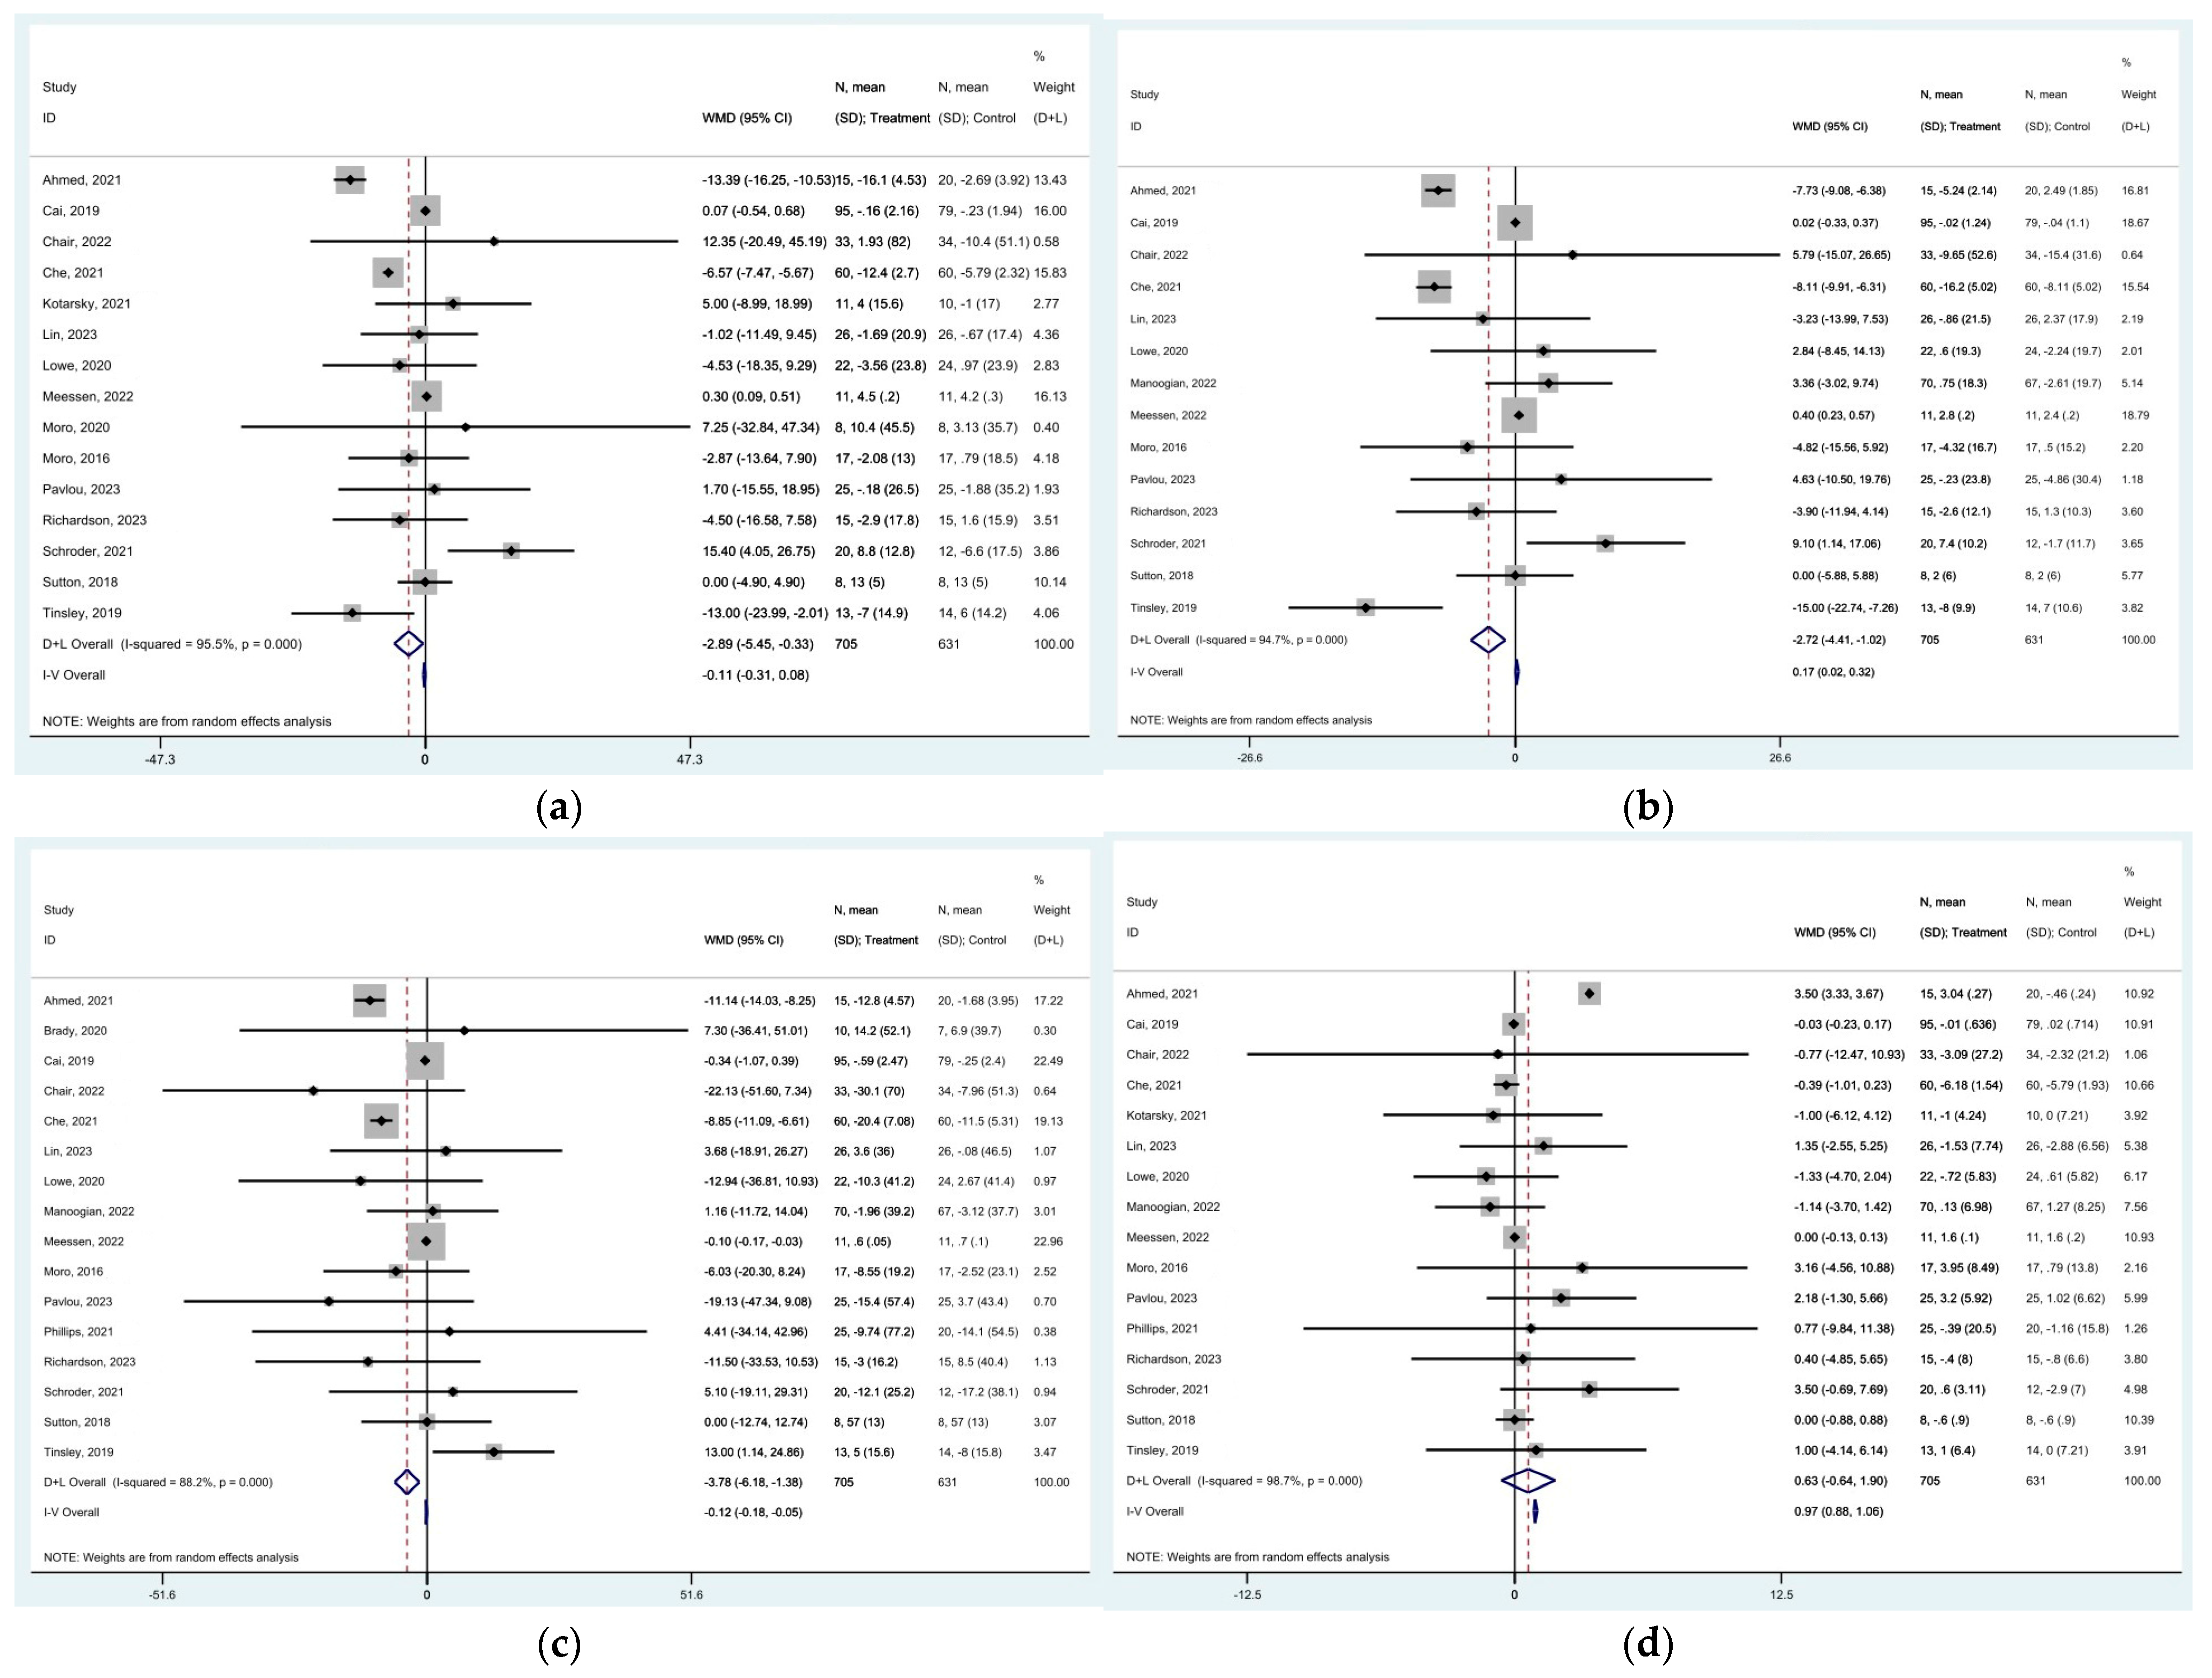
 represent effect estimates for each study, with size proportional to study weight. Horizontal lines indicate 95% confidence intervals (CI). The diamond
  shows the pooled effect, with its width representing the 95% CI. The vertical line
  through the diamond represents the overall effect estimate. The central vertical line
  at zero marks no effect; confidence intervals crossing this line indicate non-significant results. “D+L” and “IV” indicate different pooling methods (random-effects and fixed-effects, respectively). I2 and p-value indicate heterogeneity across studies [19,20,21,22,23,24,25,28,29,31,32,33,34,35,36,37,38,39,44].
 represent effect estimates for each study, with size proportional to study weight. Horizontal lines indicate 95% confidence intervals (CI). The diamond
  shows the pooled effect, with its width representing the 95% CI. The vertical line
  through the diamond represents the overall effect estimate. The central vertical line
  at zero marks no effect; confidence intervals crossing this line indicate non-significant results. “D+L” and “IV” indicate different pooling methods (random-effects and fixed-effects, respectively). I2 and p-value indicate heterogeneity across studies [19,20,21,22,23,24,25,28,29,31,32,33,34,35,36,37,38,39,44].
 represent effect estimates for each study, with size proportional to study weight. Horizontal lines indicate 95% confidence intervals (CI). The diamond
  shows the pooled effect, with its width representing the 95% CI. The vertical line
  through the diamond represents the overall effect estimate. The central vertical line
  at zero marks no effect; confidence intervals crossing this line indicate non-significant results. “D+L” and “IV” indicate different pooling methods (random-effects and fixed-effects, respectively). I2 and p-value indicate heterogeneity across studies [19,20,21,22,23,24,25,28,29,32,33,34,35,36,37,39,42,44].
 represent effect estimates for each study, with size proportional to study weight. Horizontal lines indicate 95% confidence intervals (CI). The diamond
  shows the pooled effect, with its width representing the 95% CI. The vertical line
  through the diamond represents the overall effect estimate. The central vertical line
  at zero marks no effect; confidence intervals crossing this line indicate non-significant results. “D+L” and “IV” indicate different pooling methods (random-effects and fixed-effects, respectively). I2 and p-value indicate heterogeneity across studies [19,20,21,22,23,24,25,28,29,32,33,34,35,36,37,39,42,44].
| 1st Author‘s Name | Publication Year | Study Design | Study Duration | TRE Regimen | Total Participants | Sex | Participants Characteristics | Number of Participants Per Group |
|---|---|---|---|---|---|---|---|---|
| Dylan A. Lowe [19] | 2020 | RCT | 12 weeks | 16:8 | 116 | Female = 46 Male = 70 | men and women, 18 to 64 years with a BMI of 27 to 43 kg/m2 | Intervention group: 59 Control group: 57 |
| Nicholas Edward Phillips [20] | 2021 | RCT | 6 months | 12:12 | 45 | Female = 32 Male = 13 | adults with a body mass index BMI ≥ 20 kg/m2, stable weight (±2 kg) over the previous 3 months and at least one component of MS | Intervention group: 25 Control group: 20 |
| Tingting Che [21] | 2021 | RCT | 12 weeks | 10:14 | 120 | Female = 55 Male = 65 | overweight adults with type 2 diabetes | Intervention group: 60 Control group: 60 |
| Sek Ying Chair [22] | 2022 | RCT | 3 weeks | 16:8 | 67 | Female = 36 Male = 31 | overweight and obese adults with prediabetes | Intervention group: 33 Control group: 34 |
| Tatiana Moro [23] | 2016 | RCT | 8 weeks | 16:8 | 17 | Male = 17 | male middle- and long-distance runners | Intervention group: 10 Control group: 7 |
| Christopher J. Kotarsky [24] | 2021 | RCT | 8 weeks | 16:8 | 21 | Female = 18 Male = 3 | Physically inactive and overweight or obese female and male participants, determined by a BMI between 25.0 and 34.9 kg/m2, between the ages of 35 and 60 years | Intervention group: 11 Control group: 10 |
| Hua Cai [25] | 2019 | RCT | 4 weeks | 16:8 | 174 | Female = 145 Male = 52 | adults with NAFLD | Intervention group: 95 Control group: 79 |
| Eduard Isenmann [26] | 2021 | RCT | 14 weeks | 16:8 | 35 | Female = 21 Male = 14 | healthy, physically active, between 20 and 40 years old, BMI of less than 33 kg/m2 | Intervention group: 18 Control group: 17 |
| Przemysław Domaszewski [27] | 2020 | RCT | 6 weeks | 16:8 | 45 | Female = 45 | non-smoking women over 60 years of age | Intervention group: 25 Control group: 20 |
| Grant M Tinsley [28] | 2019 | RCT | 8 weeks | 16:8 | 40 | Female = 40 | resistance-trained healthy females 18–30 years | Intervention group: 13 Control group: 14 |
| Aidan J. Brady [29] | 2020 | RCT | 8 weeks | 16:8 | 23 | Male = 23 | male middle- and long-distance runners | Intervention group: 12 Control group: 11 |
| Grant M. Tinsley [30] | 2017 | RCT | 8 weeks | 20:4 | 18 | Male = 18 | healthy, active men who had not followed a consistent RT program over the previous three months | Intervention group: 10 Control group: 8 |
| Robert Jones [31] | 2020 | non-RCT | 2 weeks | 16:8 | 16 | Male = 16 | healthy males | Intervention group: 8 Control group: 8 |
| Tatiana Moro [32] | 2020 | RCT | 4 weeks | 16:8 | 16 | Male = 16 | healthy young men from 5 different elite cyclist teams | Intervention group: 8 Control group: 8 |
| Shuhao Lin [33] | 2023 | RCT | 12 months | 16:8 | 60 | Female = 50 Male = 10 | adults with obesity | Intervention group: 30 Control group: 30 |
| Emily N.C. Manoogian [34] | 2022 | RCT | 12 weeks | 10:14 | 137 | Female = 12 Male = 125 | healthy adults | Intervention group: 70 Control group: 67 |
| Vasiliki Pavlou [35] | 2023 | RCT | 6 months | 16:8 | 75 | Female = 53 Male = 22 | adults with type 2 diabetes | Intervention group: 25 Control group: 25 |
| Jéssica D. Schroder [36] | 2021 | non-RCT | 3 months | 16:8 | 32 | Female = 32 | obese women (BMI ≥ 30 kg/m2) | Intervention group: 20 Control group: 12 |
| Naseer Ahmed [37] | 2021 | non-RCT | 6 weeks | 12:12 | 35 | Female = 15 Male = 20 | age of 20–70 years, with serum HDL< 40 mg/dL for men and <50 mg/dL for women | Intervention group: 15 Control group: 20 |
| Ashley P. Tovar [38] | 2021 | randomized crossover | 4 weeks | 16:8 | 15 | Male = 15 | healthy, endurance trained male runners between 21–36 years of age | Intervention group: 8 Control group: 7 |
| Elizabeth F. Sutton [39] | 2018 | randomized crossover | 5 weeks | 18:6 | 8 | Male = 8 | male with prediabetes | 8 individuals |
| Evelyn B. Parr [40] | 2020 | randomized crossover | 5 days | 16:8 | 11 | Male = 11 | men (aged 30–45 years) with overweight/obesity and inactive/sedentary lifestyle | 11 individuals |
| Humaira Jamshed [41] | 2019 | randomized crossover | 4 days | 18:6 | 11 | Female = 4 Male = 7 | adults aged 20–45 years old with BMI between 25.0 kg and 35.0 kg/m2, a body weight between 68 kg and 100 kg | 11 individuals |
| Emma C. E. Meessen [42] | 2022 | randomized crossover | 11 days | 22:2 | 11 | Female = 6 Male = 5 | free-living healthy lean individuals | 11 individuals |
| Kim S Stote [43] | 2007 | randomized crossover | 8 weeks | 20:4 | 15 | Female = 10 Male = 5 | healthy men and women aged 40–50 years | 15 individuals |
| Christine E. Richardson [44] | 2023 | randomized crossover | 4 weeks | 16:8 | 15 | Male = 15 | endurance-trained male runners | 15 individuals |
| Michael J. Wilkinson [45] | 2020 | single-arm, paired-sample trial | 12 weeks | 14:10 | 19 | Female = 6 Male = 13 | participants with metabolic syndrome | 19 individuals |
| Outcome | No. of Studies [Reference] | Type of Model | MD (95% CI) | p-Value | Heterogeneity I2% | p-Value |
|---|---|---|---|---|---|---|
| Body weight | [23] | Random | −1.622 kg (−2.302 to −0.941) | p < 0.0001 | 96.1% | p < 0.0001 |
| BMI | [11] | Random | −0.919 kg/m2 (−1.189 to −0.650) | p < 0.0001 | 82% | p < 0.0001 |
| WBFM | [17] | Fixed | −0.662 kg (−0.795 to −0.530) | p < 0.0001 | 17.8% | p = 0.246 |
| LM | [9] | Fixed | −0.448 kg (−0.672 to −0.224) | p < 0.0001 | 0.0% | p = 0.983 |
| Waist circumference | [10] | Random | −2.015 cm (−3.212 to −0.819) | p = 0.001 | 68.4% | p = 0.001 |
| Hip circumference | [3] | Fixed | −0.440 cm (−1.432 to 0.552 | p = 0.385 | 31.6% | p = 0.232 |
| Waist–hip ratio | [1] | Fixed | 0.006 cm (−0.020 to 0.032) | p = 0.651 | ||
| Total body water | [2] | Fixed | 0.372 kg (−0.246 to 0.990) | p = 0.238 | 3.8% | p = 0.308 |
| SBP | [10] | Random | −0.212 mmHg (−2.721 to 2.298) | p = 0.869 | 71.8% | p < 0.0001 |
| DBP | [10] | Random | 0.466 mmHg (−1.207 to 2.140) | p = 0.585 | 62% | p = 0.005 |
| Insulin | [13] | Random | −0.458 mIU/L (−0.843 to −0.073) | p = 0.020 | 92.1% | p < 0.0001 |
| HbA1C | [7] | Random | −0.175% (−0.569 to 0.219) | p = 0.385 | 98.7% | p < 0.0001 |
| Glucose | [17] | Fixed | 0.124 mg/dL (−0.193 to 0.442) | p = 0.444 | 24.9% | p = 0.167 |
| Total cholesterol | [15] | Random | −2.889 mg/dL (−5.447 to −0.330) | p = 0.027 | 95.5% | p < 0.0001 |
| HDL | 16 | Random | 0.632 mg/dL (−0.636 to 1.899) | p = 0.329 | 98.7% | p < 0.0001 |
| LDL | [14] | Random | −2.717 mg/dL (−4.412, −1.021) | p = 0.002 | 94.7% | p < 0.0001 |
| Triglycerides | [16] | Random | −3.782 mg/dL (−6.180 to 1.384) | p = 0.002 | 88.2% | p < 0.0001 |
| Factors | ΒΜΙ | Weight | Waist Circumference | Insulin | HbA1C | SBP | DBP | Cholesterol | HDL | LDL | Triglycerides |
|---|---|---|---|---|---|---|---|---|---|---|---|
| Country (USA, European countries, Australia, China, Brazil) | p = 0.855 | p = 0.744 | p = 0.825 | p = 0.005; adj R2 = 92.9% | p = 0.006; adj R2 = 94.2% | p = 0.811 | p = 0.929 | p = 0.595 | p = 0.756 | p = 0.813 | p = 0.372 |
| Study duration, in weeks | p = 0.464 | p = 0.765 | p = 0.659 | p = 0.911 | p = 0.774 | p = 0.960 | p = 0.213; adj R2 = 16.0% | p = 0.917 | p = 0.755 | p = 0.892 | p = 0.338 |
| Female % | p = 0.705 | p = 0.501 | p = 0.591 | p = 0.916 | p = 0.712 | p = 0.609 | p = 0.342 | p = 0.562 | p = 0.891 | p = 0.316 | p = 0.380 |
| Age, in years (pooled mean) | p = 0.565 | p = 0.516 | p = 0.646 | p = 0.494 | p = 0.459 | p = 0.483 | p = 0.730 | p = 0.607 | p = 0.945 | p = 0.922 | p = 0.467 |
| BMI (polled mean) | p = 0.508 | p = 0.625 | p = 0.941 | p = 0.110; adj R2 = 25.2% | p = 0.605 | p = 0.165; adj R2 = 28.6% | p = 0.064; adj R2 = 48.9% | p = 0.586 | p = 0.645 | p = 0.710 | p = 0.191; adj R2 = 8.9% |
| Study design (randomized study, non-randomized study, crossover design) | p = 0.066; adj R2 = 25.7% | p = 0.208 | p = 0.011; adj R2 = 77.4% | p = 0.580 | - | p = 0.197; adj R2 = 36.7% | p = 0.297 | p = 0.524 | p = 0.286 | p = 0.318 | p = 0.293 |
| Fasting hours | p = 0.145; adj R2 = 12.9% | p = 0.294 | p = 0.282 | p = 0.079; adj R2 = 34.1% | p = 0.640 | p = 0.183; adj R2 = 14.0% | p = 0.190; adj R2 = 17.9% | p = 0.022; adj R2 = 31.0% | p = 0.996 | p = 0.012; adj R2 = 45.4% | p = 0.670 |
| RoB (low, moderate, serious) | p = 0.148; adj R2 = 22.5% | p = 0.032; adj R2 = 12.5% | p = 0.045; adj R2 = 62.0% | p = 0.581 | p = 0.059; adj R2 = 46.8% | p = 0.907 | p = 0.758 | p = 0.552 | p = 0.287 | p = 0.465 | p = 0.244 |
| Population (healthy, metabolic syndrome) | p = 0.933 | p = 0.586 | p = 0.989 | p = 0.389 | p = 0.395 | p = 0.355 | p = 0.562 | p = 0.890 | p = 0.985 | p = 0.785 | p = 0.591 |
Disclaimer/Publisher’s Note: The statements, opinions and data contained in all publications are solely those of the individual author(s) and contributor(s) and not of MDPI and/or the editor(s). MDPI and/or the editor(s) disclaim responsibility for any injury to people or property resulting from any ideas, methods, instructions or products referred to in the content. |
© 2024 by the authors. Licensee MDPI, Basel, Switzerland. This article is an open access article distributed under the terms and conditions of the Creative Commons Attribution (CC BY) license (https://creativecommons.org/licenses/by/4.0/).
Share and Cite
Panagiotou, K.; Stefanou, G.; Kourlaba, G.; Athanasopoulos, D.; Kassari, P.; Charmandari, E. The Effect of Time-Restricted Eating on Cardiometabolic Risk Factors: A Systematic Review and Meta-Analysis. Nutrients 2024, 16, 3700. https://doi.org/10.3390/nu16213700
Panagiotou K, Stefanou G, Kourlaba G, Athanasopoulos D, Kassari P, Charmandari E. The Effect of Time-Restricted Eating on Cardiometabolic Risk Factors: A Systematic Review and Meta-Analysis. Nutrients. 2024; 16(21):3700. https://doi.org/10.3390/nu16213700
Chicago/Turabian StylePanagiotou, Krystalia, Garyfallia Stefanou, Georgia Kourlaba, Dimitrios Athanasopoulos, Penio Kassari, and Evangelia Charmandari. 2024. "The Effect of Time-Restricted Eating on Cardiometabolic Risk Factors: A Systematic Review and Meta-Analysis" Nutrients 16, no. 21: 3700. https://doi.org/10.3390/nu16213700
APA StylePanagiotou, K., Stefanou, G., Kourlaba, G., Athanasopoulos, D., Kassari, P., & Charmandari, E. (2024). The Effect of Time-Restricted Eating on Cardiometabolic Risk Factors: A Systematic Review and Meta-Analysis. Nutrients, 16(21), 3700. https://doi.org/10.3390/nu16213700


