DNA Methylation Signatures Characterize Gene Expression Modulation in Lung Cancer Patients Affected by Anorexia
Abstract
1. Introduction
2. Materials and Methods
2.1. Patients and Control Group Selection
2.2. Nutritional, Clinical Parameters and Appetite Evaluation
2.3. Blood Samples Collection and DNA Extraction from PBMCs
2.4. Genome-Wide DNA Methylation Analysis
2.5. Merging of DNA Methylation and Gene Expression Data
2.6. Targeted Bisulfite Sequencing
2.7. Statistical Analyses
3. Results
3.1. Study Participant Characteristics
3.2. DNA Methylation and Gene Expression Patterns in PBMCs of Lung Cancer Patients
3.3. Targeted Bisulfite Sequencing of Four Genes of Interest
4. Discussion
5. Conclusions
Supplementary Materials
Author Contributions
Funding
Institutional Review Board Statement
Informed Consent Statement
Data Availability Statement
Acknowledgments
Conflicts of Interest
References
- Molfino, A.; de van der Schueren, M.A.; Sánchez-Lara, K.; Milke, P.; Amabile, M.I.; Imbimbo, G.; Di Lazzaro, L.; Cavuto, S.; Ronzani, G.; Snegovoy, A.; et al. Cancer-associated anorexia: Validity and performance overtime of different appetite tools among patients at their first cancer diagnosis. Clin. Nutr. 2021, 40, 4037–4042. [Google Scholar] [CrossRef] [PubMed]
- Laviano, A.; Seelaender, M.; Sanchez-Lara, K.; Gioulbasanis, I.; Molfino, A.; Rossi Fanelli, F. Beyond anorexia -cachexia. Nutrition and modulation of cancer patients’ metabolism: Supplementary, complementary or alternative anti-neoplastic therapy? Eur. J. Pharmacol. 2011, 668 (Suppl. S1), S87–S90. [Google Scholar] [CrossRef] [PubMed]
- Viana, E.C.R.d.M.; Oliveira, I.d.S.; Rechinelli, A.B.; Marques, I.L.; de Souza, V.F.; Spexoto, M.C.B.; Pereira, T.S.S.; Guandalini, V.R. Malnutrition and nutrition impact symptoms (NIS) in surgical patients with cancer. PLoS ONE 2020, 15, e0241305. [Google Scholar] [CrossRef] [PubMed]
- Abraham, M.; Kordatou, Z.; Barriuso, J.; Lamarca, A.; Weaver, J.M.J.; Cipriano, C.; Papaxoinis, G.; Backen, A.; Mansoor, W. Early recognition of anorexia through patient-generated assessment predicts survival in patients with oesophagogastric cancer. PLoS ONE 2019, 14, e0224540. [Google Scholar] [CrossRef]
- Hariyanto, T.I.; Kurniawan, A. Appetite problem in cancer patients: Pathophysiology, diagnosis, and treatment. Cancer Treat. Res. Commun. 2021, 27, 100336. [Google Scholar] [CrossRef]
- Baracos, V.E.; Martin, L.; Korc, M.; Guttridge, D.C.; Fearon, K.C.H. Cancer-associated cachexia. Nat. Rev. Dis. Primers. 2018, 4, 17105. [Google Scholar] [CrossRef]
- Grossberg, A.J.; Scarlett, J.M.; Zhu, X.; Bowe, D.D.; Batra, A.K.; Braun, T.P.; Marks, D.L. Arcuate nucleus proopiomelanocortin neurons mediate the acute anorectic actions of leukemia inhibitory factor via gp130. Endocrinology 2010, 151, 606–616. [Google Scholar] [CrossRef]
- Bodnar, R.J.; Pasternak, G.W.; Mann, P.E.; Paul, D.; Warren, R.; Donner, D.B. Mediation of anorexia by human recombinant tumor necrosis factor through a peripheral action in the rat. Cancer Res. 1989, 49, 6280–6284. [Google Scholar]
- Molfino, A.; Ambrosani, F.; Tambaro, F.; Belli, R.; Imbimbo, G.; Udali, S.; Moruzzi, S.; Pattini, P.; Ramaccini, C.; Castagna, A.; et al. Changes of gene expression in peripheral blood mononuclear cells of lung cancer patients with or without anorexia. Clin. Nutr. 2023, 42, 9–17. [Google Scholar] [CrossRef]
- Sharples, A.P.; Polydorou, I.; Hughes, D.C.; Owens, D.J.; Hughes, T.M.; Stewart, C.E. Skeletal muscle cells possess a ‘memory’ of acute early life TNF-α exposure: Role of epigenetic adaptation. Biogerontology 2016, 17, 603–617. [Google Scholar] [CrossRef]
- Wu, H.; Eckhardt, C.M.; Baccarelli, A.A. Molecular mechanisms of environmental exposures and human disease. Nat. Rev. Genet. 2023, 24, 332–344. [Google Scholar] [CrossRef] [PubMed]
- Supic, G.; Jagodic, M.; Magic, Z. Epigenetics: A new link between nutrition and cancer. Nutr. Cancer 2013, 65, 781–792. [Google Scholar] [CrossRef] [PubMed]
- Jones, P.A.; Baylin, S.B. The epigenomics of cancer. Cell 2007, 128, 683–692. [Google Scholar] [CrossRef]
- Jang, H.; Mason, J.B.; Choi, S.W. Genetic and epigenetic interactions between folate and aging in carcinogenesis. J. Nutr. 2005, 135, 2967S–2971S. [Google Scholar] [CrossRef]
- Ehrlich, M. Cancer-linked DNA hypomethylation and its relationship to hypermethylation. Curr. Top. Microbiol. Immunol. 2006, 310, 251–274. [Google Scholar]
- Dawson, M.A.; Kouzarides, T. Cancer epigenetics: From mechanism to therapy. Cell 2012, 150, 12–27. [Google Scholar] [CrossRef] [PubMed]
- Terry, M.B.; Delgado-Cruzata, L.; Vin-Raviv, N.; Wu, H.C.; Santella, R.M. DNA methylation in white blood cells: Association with risk factors in epidemiologic studies. Epigenetics 2011, 6, 828–837. [Google Scholar] [CrossRef]
- Agha, G.; Mendelson, M.M.; Ward-Caviness, C.K.; Joehanes, R.; Huan, T.; Gondalia, R.; Salfati, E.; Brody, J.A.; Fiorito, G.; Bressler, J.; et al. Blood Leukocyte DNA Methylation Predicts Risk of Future Myocardial Infarction and Coronary Heart Disease. Circulation 2019, 140, 645–657. [Google Scholar] [CrossRef]
- Joyce, B.T.; Gao, T.; Zheng, Y.; Liu, L.; Zhang, W.; Dai, Q.; Shrubsole, M.J.; Hibler, E.A.; Cristofanilli, M.; Zhang, H.; et al. Prospective changes in global DNA methylation and cancer incidence and mortality. Br. J. Cancer. 2016, 115, 465–472. [Google Scholar] [CrossRef]
- Friso, S.; Udali, S.; Guarini, P.; Pellegrini, C.; Pattini, P.; Moruzzi, S.; Girelli, D.; Pizzolo, F.; Martinelli, N.; Corrocher, R.; et al. Global DNA hypomethylation in peripheral blood mononuclear cells as a biomarker of cancer risk. Cancer Epidemiol. Biomark. Prev. 2013, 22, 348–355. [Google Scholar] [CrossRef]
- Udali, S.; Guarini, P.; Moruzzi, S.; Ruzzenente, A.; Tammen, S.A.; Guglielmi, A.; Friso, S. Global DNA methylation and hydroxymethylation differ in hepatocellular carcinoma and cholangiocarcinoma and relate to survival rate. Hepatology 2015, 62, 496–504. [Google Scholar] [CrossRef] [PubMed]
- You, M.; Xie, Z.; Zhang, N.; Zhang, Y.; Xiao, D.; Liu, S.; Zhuang, W.; Li, L.; Tao, Y. Signaling pathways in cancer metabolism: Mechanisms and therapeutic targets. Signal Transduct. Target. Ther. 2023, 8, 196. [Google Scholar] [CrossRef] [PubMed]
- Wei, X.; Zhang, H. Four and a half LIM domains protein 1 can be as a double-edged sword in cancer progression. Cancer Biol. Med. 2020, 17, 270–281. [Google Scholar] [CrossRef] [PubMed]
- Asada, K.; Ando, T.; Niwa, T.; Nanjo, S.; Watanabe, N.; Okochi-Takada, E.; Ushijima, T. FHL1 on chromosome X is a single-hit gastrointestinal tumor-suppressor gene and contributes to the formation of an epigenetic field defect. Oncogene 2013, 32, 2140–2149. [Google Scholar] [CrossRef]
- Kawakami, K.; Matsumoto, M.; Enokida, H.; Toki, K.; Matsuda, R.; Chiyomaru, T.; Nishiyama, K.; Kawahara, K.; Seki, N.; Nakagawa, M. CpG hypermethylation of human four-and-a-half LIM domains 1 contributes to migration and invasion activity of human bladder cancer. Int. J. Mol. Med. 2010, 26, 241–247. [Google Scholar] [CrossRef] [PubMed]
- Furutani, M.; Suganuma, M.; Akiyama, S.; Mitsumori, R.; Takemura, M.; Matsui, Y.; Satake, S.; Nakano, Y.; Niida, S.; Ozaki, K.; et al. RNA-sequencing analysis identification of potential biomarkers for diagnosis of sarcopenia. J. Gerontol. A Biol. Sci. Med. Sci. 2023, 78, 1991–1998. [Google Scholar] [CrossRef]
- Thoompumkal, I.J.; Subba Rao, M.R.; Kumaraswamy, A.; Krishnan, R.; Mahalingam, S. GNL3L Is a Nucleo-Cytoplasmic Shuttling Protein: Role in Cell Cycle Regulation. PLoS ONE 2015, 10, e0135845. [Google Scholar] [CrossRef]
- Meng, L.; Hsu, J.K.; Tsai, R.Y. GNL3L depletion destabilizes MDM2 and induces p53-dependent G2/M arrest. Oncogene 2011, 30, 1716–1726. [Google Scholar] [CrossRef]
- Liu, P.; Guo, W.; Su, Y.; Chen, C.; Ma, Y.; Ma, P.; Chen, C.; Lv, X. Multi-Omics Analysis of GNL3L Expression, Prognosis, and Immune Value in Pan-Cancer. Cancers 2022, 14, 4595. [Google Scholar] [CrossRef]
- Thejer, B.M.; Adhikary, P.P.; Teakel, S.L.; Fang, J.; Weston, P.A.; Gurusinghe, S.; Anwer, A.G.; Gosnell, M.; Jazayeri, J.A.; Ludescher, M.; et al. PGRMC1 effects on metabolism, genomic mutation and CpG methylation imply crucial roles in animal biology and disease. BMC Mol. Cell Biol. 2020, 21, 26. [Google Scholar] [CrossRef]
- Aversa, Z.; Pin, F.; Lucia, S.; Penna, F.; Verzaro, R.; Fazi, M.; Colasante, G.; Tirone, A.; Fanelli, F.R.; Ramaccini, C.; et al. Autophagy is induced in the skeletal muscle of cachectic cancer patients. Sci. Rep. 2016, 6, 30340. [Google Scholar] [CrossRef] [PubMed]
- Sonis, S.; Haddad, R.; Posner, M.; Watkins, B.; Fey, E.; Morgan, T.; Mookanamparambil, L.; Ramoni, M. Gene expression changes in peripheral blood cells provide insight into the biological mechanisms associated with regimen-related toxicities in patients being treated for head and neck cancers. Oral. Oncol. 2007, 43, 289–300. [Google Scholar] [CrossRef] [PubMed]
- Fortunati, N.; Manti, R.; Birocco, N.; Pugliese, M.; Brignardello, E.; Ciuffreda, L.; Catalano, M.G.; Aragno, M.; Boccuzzi, G. Pro-inflammatory cytokines and oxidative stress/antioxidant parameters characterize the bio-humoral profile of early cachexia in lung cancer patients. Oncol. Rep. 2007, 18, 1521–1527. [Google Scholar] [CrossRef] [PubMed]
- Feehley, T.; O’Donnell, C.W.; Mendlein, J.; Karande, M.; McCauley, T. Drugging the epigenome in the age of precision medicine. Clin. Epigenetics 2023, 15, 6. [Google Scholar] [CrossRef]


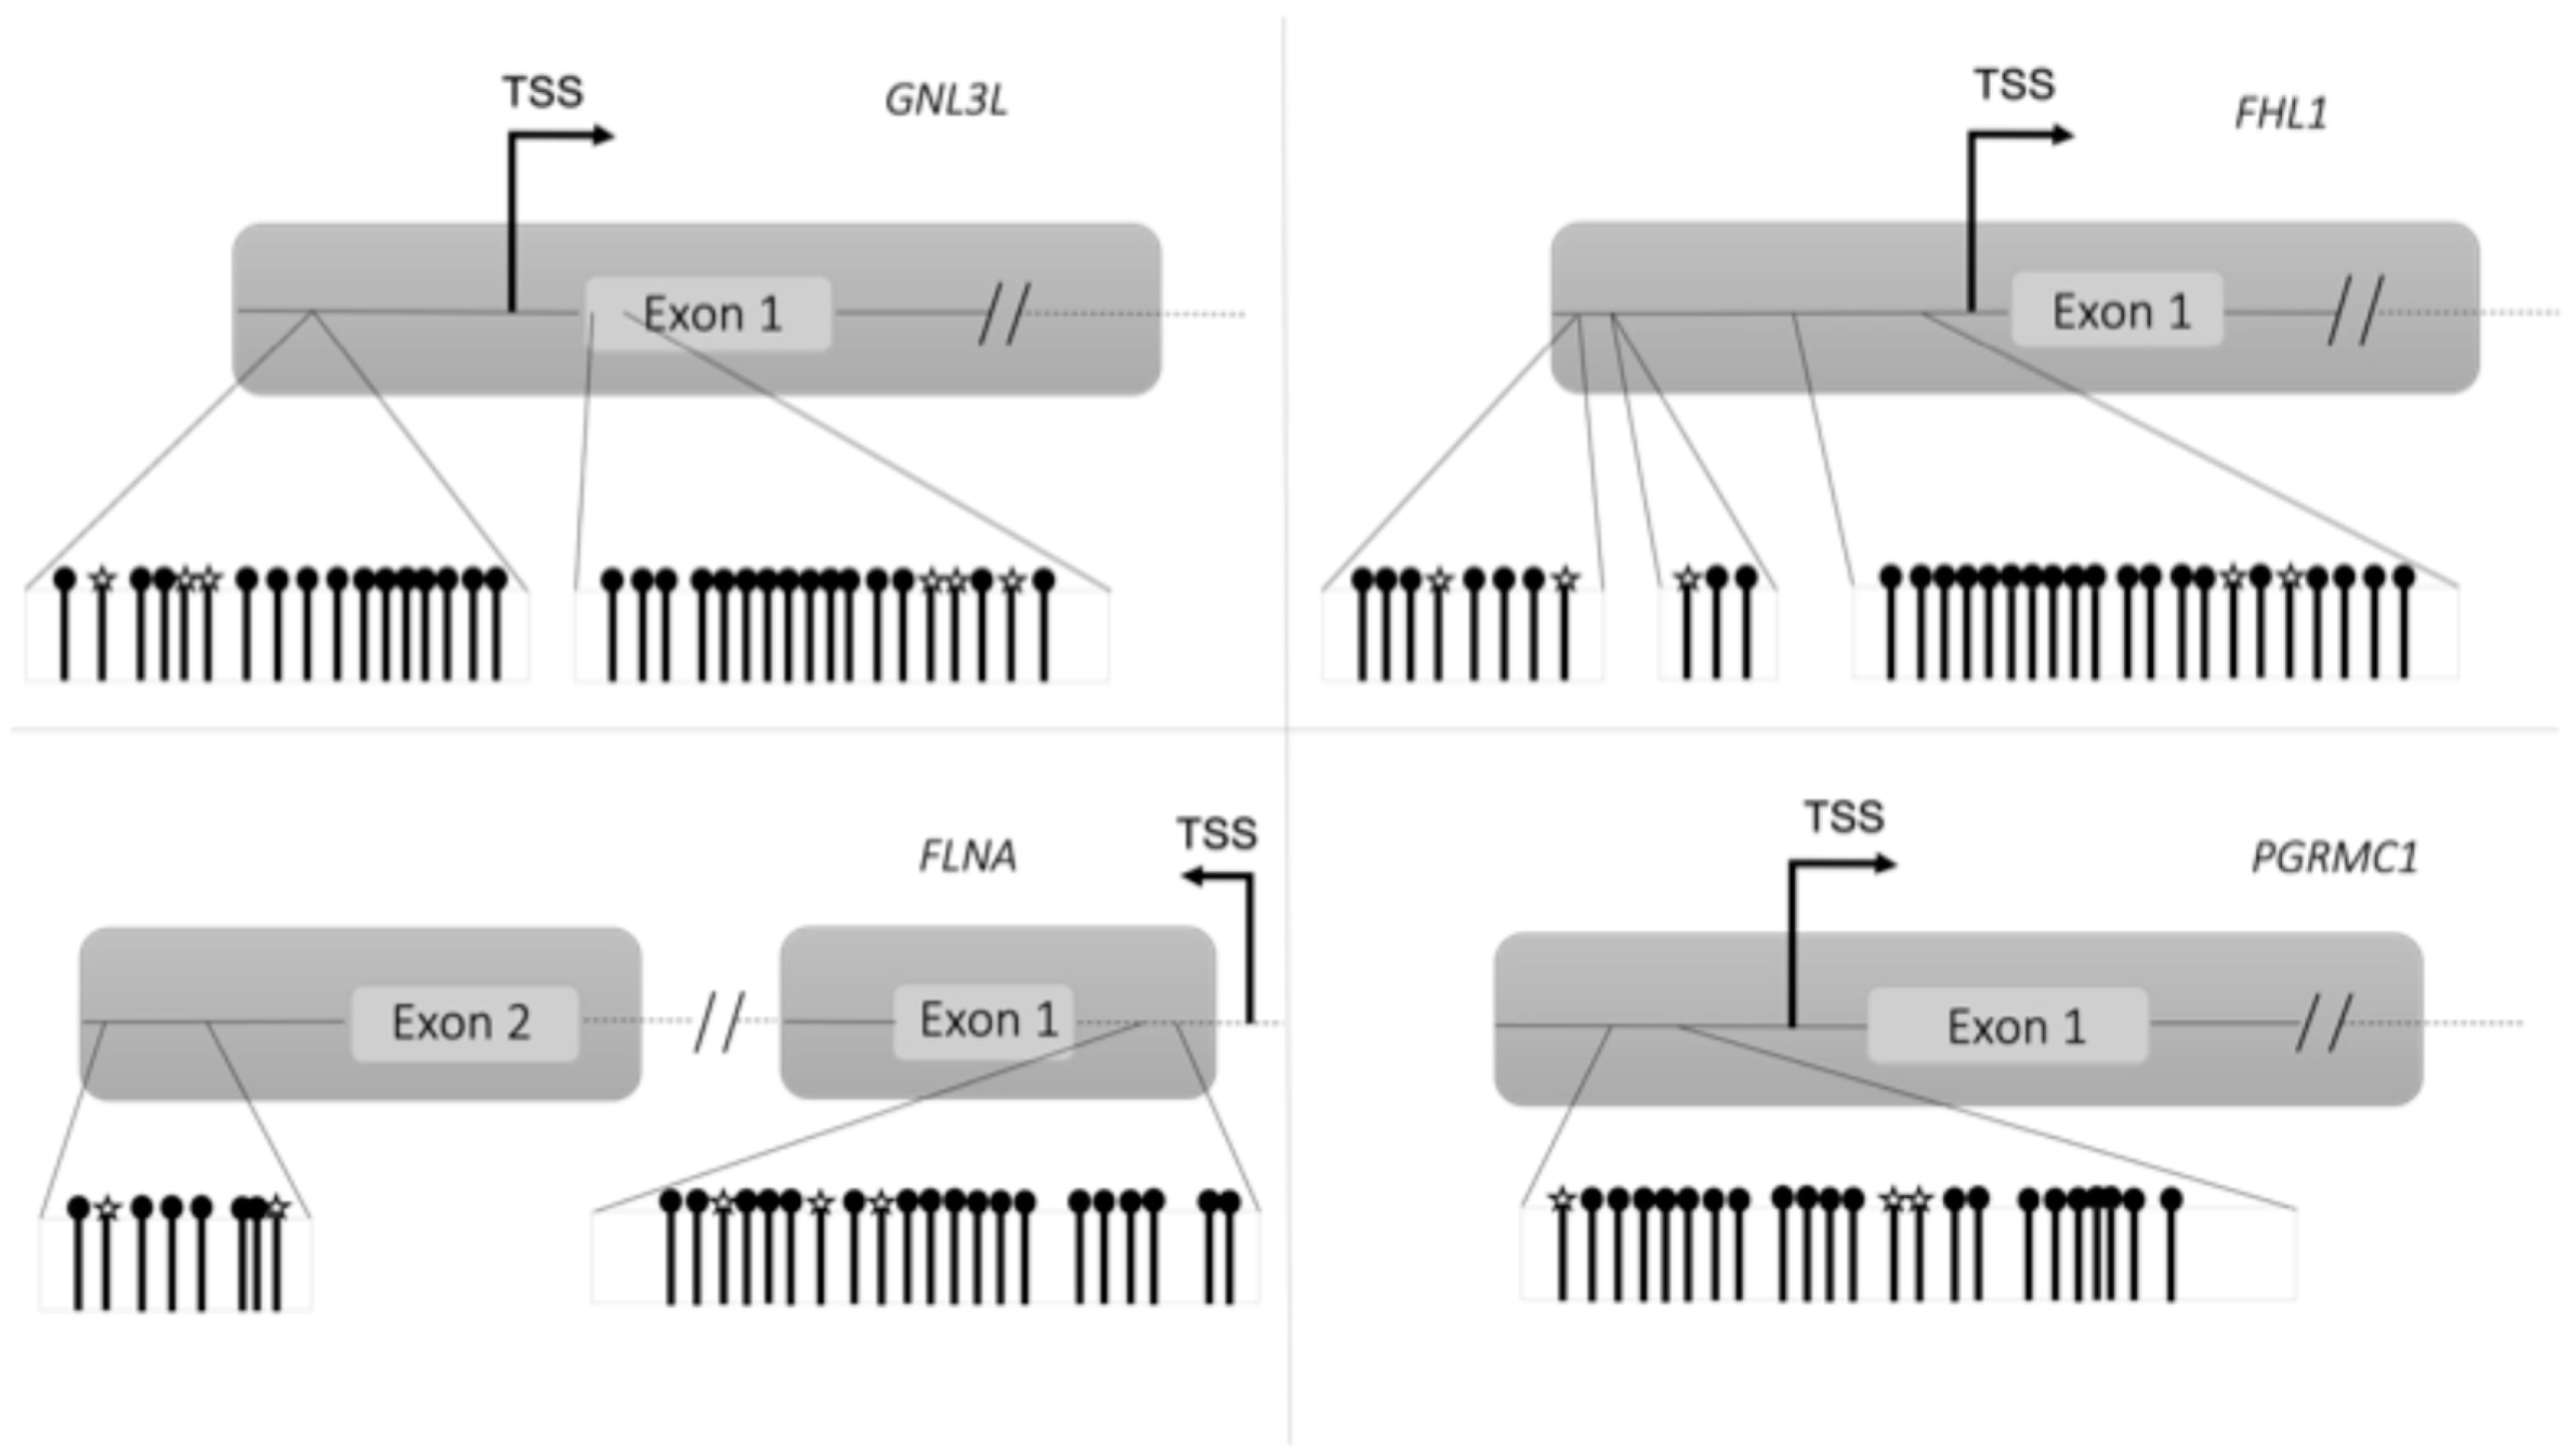
 CGs detected by microarray and validated by targeted bisulfite sequencing analysis.
  CGs detected with targeted bisulfite sequencing.
 CGs detected by microarray and validated by targeted bisulfite sequencing analysis.
  CGs detected with targeted bisulfite sequencing.

| Parameter | Patients with Lung Cancer | Controls |
|---|---|---|
| (n = 16) | (n = 8) | |
| Males, n (%) | 13 (81) | 3 (38) * |
| Age, y | 65 ± 12 | 56 ± 13 |
| BMI, kg/m2 | 24.8 ± 4.1 | 26.0 ± 5.6 |
| Body weight loss in the previous six months, % | 5.7 (1.1; 8.1) | 0 (0; 0) # |
| Hemoglobin, g/dL | 13.1 ± 2.1 | 13.4 ± 2.7 |
| Albumin, g/dL | 3.7 ± 0.6 | 3.9 ± 0.7 |
| C-reactive protein, mg/dL | 5.1 (1; 7.5) | 0.28 (0.13; 1.05) § |
| Anorexia according to FAACT score ≤ 30 | 8 (50%) | / |
| Main comorbidities | ||
| Hypertension, n (%) | 3 (19) | 2 (25) |
| Diabetes, n (%) | 1 (6) | 1 (13) |
| Dyslipidemia, n (%) | 2 (13) | 2 (25) |
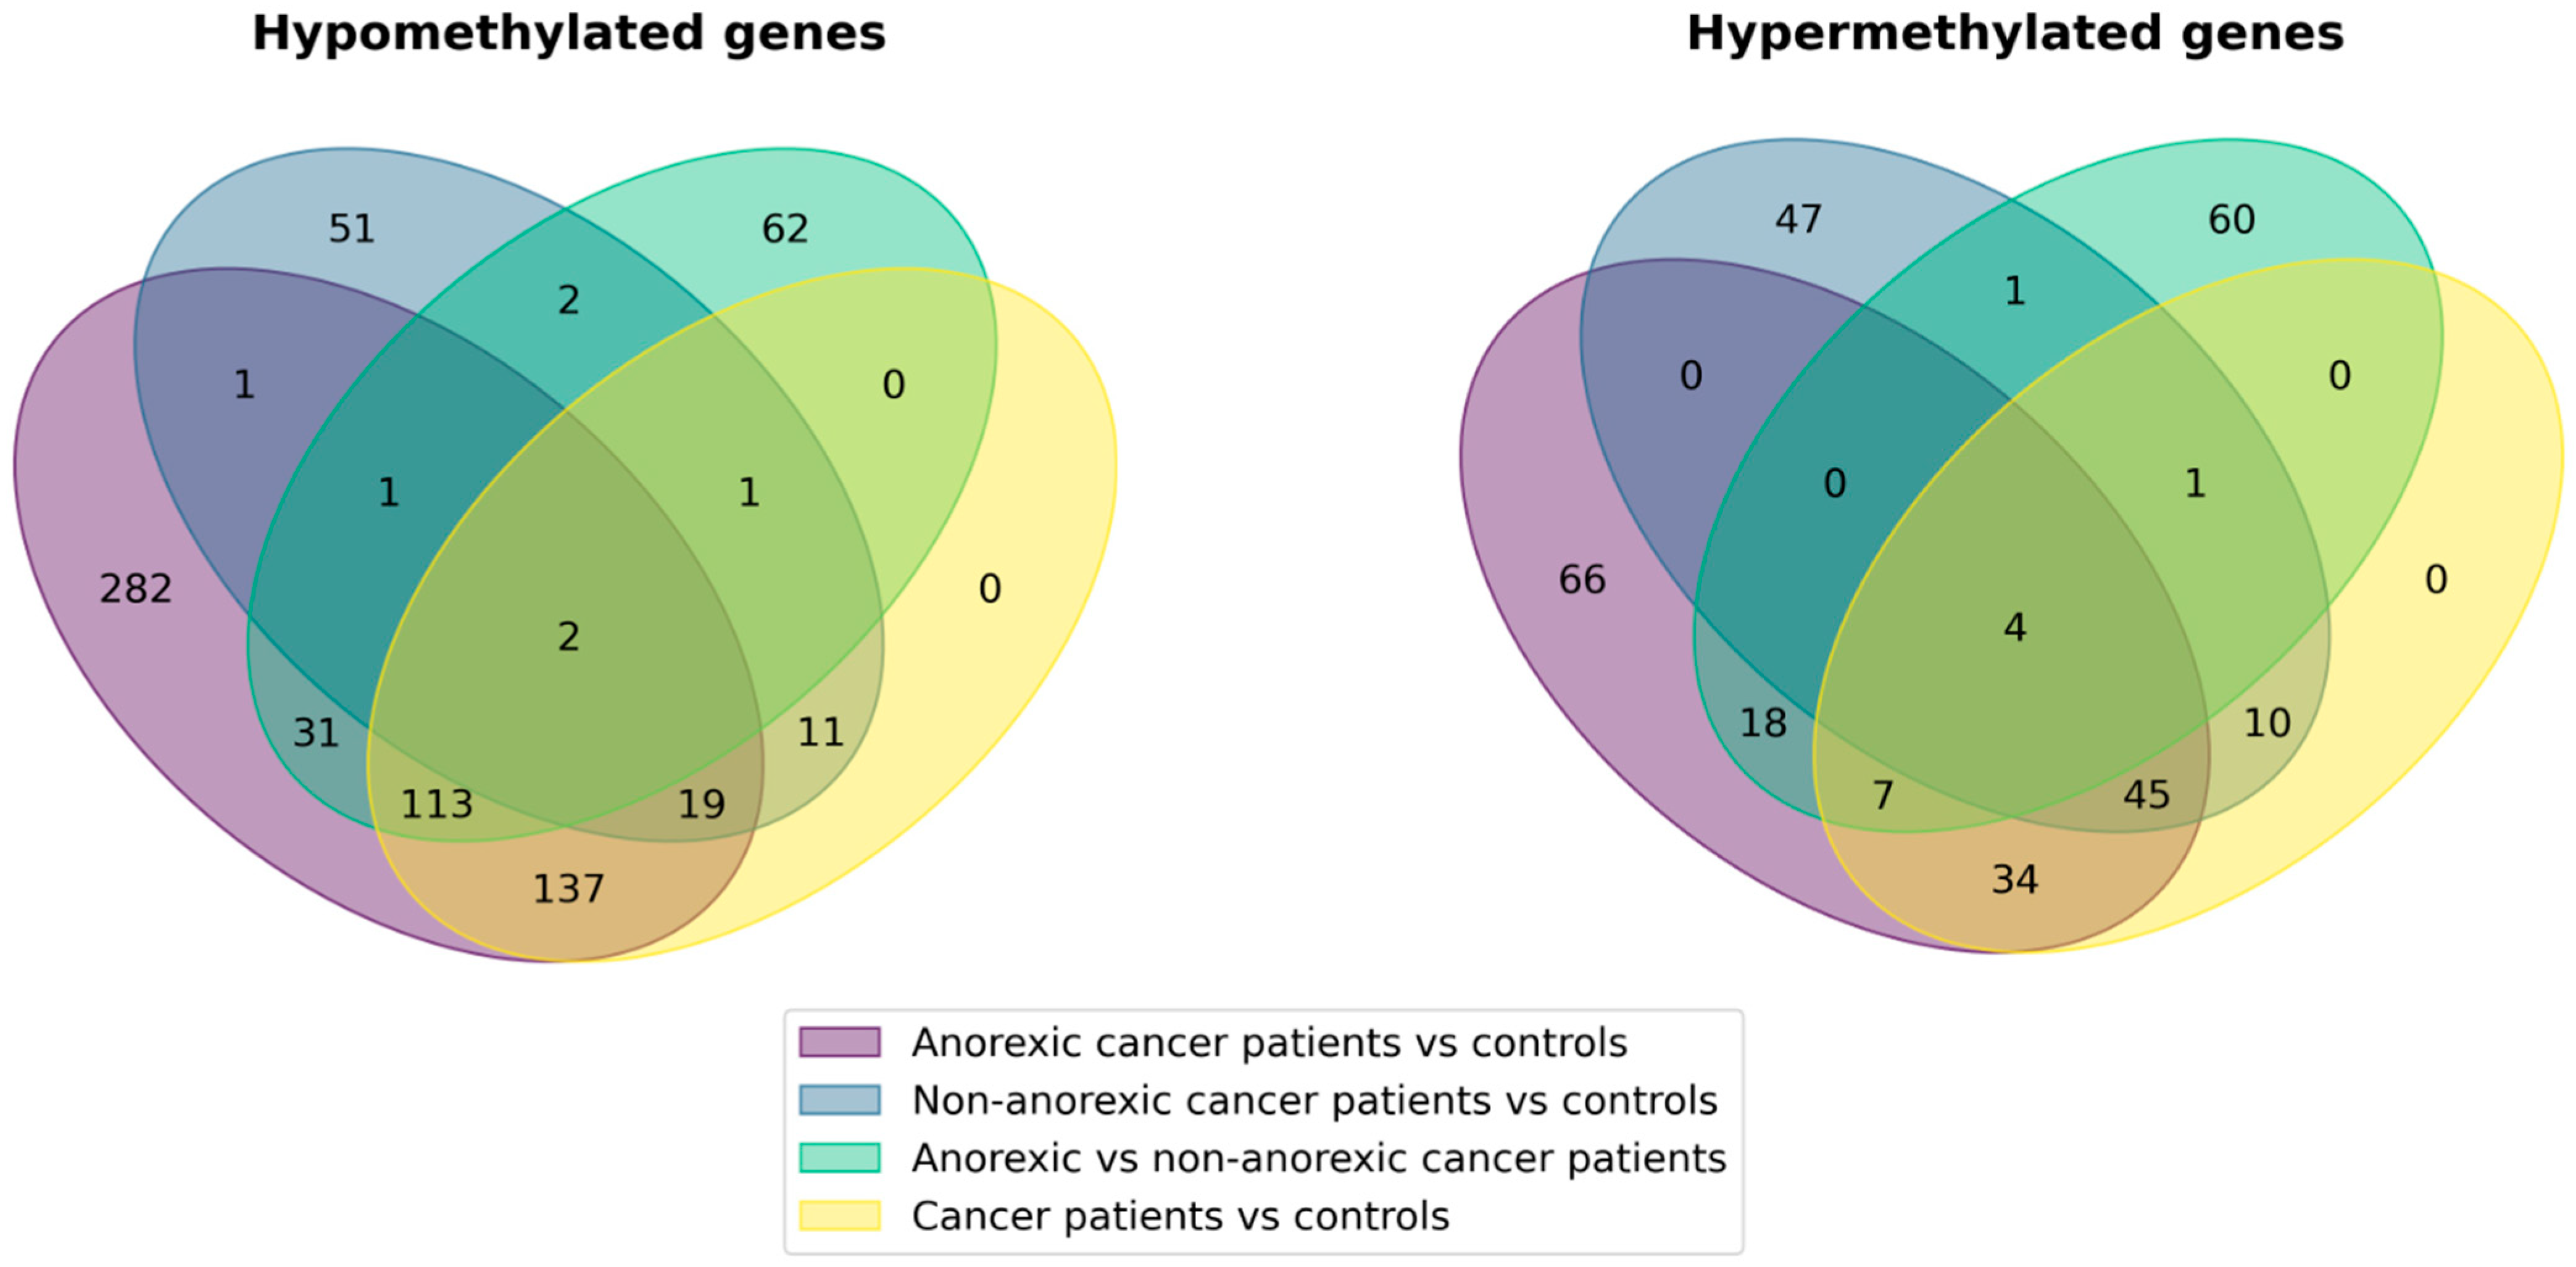
| Hypomethylated Genes | Hypermethylated Genes | |
|---|---|---|
| Cancer patients vs. controls | 282 | 100 |
| Anorexic cancer patients vs. controls | 586 | 174 |
| Non-anorexic cancer patients vs. controls | 87 | 107 |
| Anorexic vs. non-anorexic cancer patients | 211 | 90 |
| Hypermethylated Genes | Hypomethylated Genes | ||||
|---|---|---|---|---|---|
| Induced | Repressed | Induced | Repressed | ||
| Cancer patients vs. controls | ATL1 FAM50A FHL1 GNL3L LONRF3 MPP1 MSN NSDHL OPHN1 PCYT1B PGRMC1 POLA1 SAT1 SLC38A5 THOC2 UPF3B WDR44 XK | NFATC1 NUP93 OGT | ARHGAP30 CDK2AP1 MAP2K3 NLGN4Y NSRP1 PCSK6 RYR2 SLC1A3 TSPAN9 | ||
| Anorexic cancer patients vs. controls | ANKRD33B ARHGAP30 GNAS MAP2K3 NSRP1 PACSIN2 RYR2 SRPK2 TMSB4Y TSPAN9 | FAM53B LSM5 MOV10 SUPT20H XIST | ANK1 ARHGAP6 ARHGEF12 CHD7 FAM50A FHL1 FLNA FMR1 GLA GNL3L HMGN5 HTATSF1 KIF4A LANCL3 LONRF3 MPP1 MSN NKAP OPHN1 PCYT1B PGRMC1 | POLA1 REPS2 RPGR SAT1 SH3BGRL SHROOM4 SLC10A3 SLC38A5 SYTL4 THOC2 TIMP1 TMSB4X TMSB4Y TNS1 TRIM26 UBL4A UPF3B VDR WDR13 WDR44 XK | COX11 HLA-DRB1 IL2RG KLHL3 MAGEE1 OGT PITRM1 PRKX REPIN1 RPL10 STK26 TGFBR3 UBA1 VMA21 ZMYM3 |
| Non-anorexic cancer patients vs. controls | CDK2AP1 NCOR2 NLGN4Y RYR2 SLC1A3 | ASAP2 ATL1 CETP CYFIP1 | |||
| Anorexic vs. non-anorexic cancer patients | MAST2 | SLC2A1-AS1 | |||
Disclaimer/Publisher’s Note: The statements, opinions and data contained in all publications are solely those of the individual author(s) and contributor(s) and not of MDPI and/or the editor(s). MDPI and/or the editor(s) disclaim responsibility for any injury to people or property resulting from any ideas, methods, instructions or products referred to in the content. |
© 2024 by the authors. Licensee MDPI, Basel, Switzerland. This article is an open access article distributed under the terms and conditions of the Creative Commons Attribution (CC BY) license (https://creativecommons.org/licenses/by/4.0/).
Share and Cite
Molfino, A.; Ambrosani, F.; Udali, S.; Imbimbo, G.; Moruzzi, S.; Castagna, A.; Pattini, P.; Tambaro, F.; Ramaccini, C.; Muscaritoli, M.; et al. DNA Methylation Signatures Characterize Gene Expression Modulation in Lung Cancer Patients Affected by Anorexia. Nutrients 2024, 16, 3721. https://doi.org/10.3390/nu16213721
Molfino A, Ambrosani F, Udali S, Imbimbo G, Moruzzi S, Castagna A, Pattini P, Tambaro F, Ramaccini C, Muscaritoli M, et al. DNA Methylation Signatures Characterize Gene Expression Modulation in Lung Cancer Patients Affected by Anorexia. Nutrients. 2024; 16(21):3721. https://doi.org/10.3390/nu16213721
Chicago/Turabian StyleMolfino, Alessio, Francesca Ambrosani, Silvia Udali, Giovanni Imbimbo, Sara Moruzzi, Annalisa Castagna, Patrizia Pattini, Federica Tambaro, Cesarina Ramaccini, Maurizio Muscaritoli, and et al. 2024. "DNA Methylation Signatures Characterize Gene Expression Modulation in Lung Cancer Patients Affected by Anorexia" Nutrients 16, no. 21: 3721. https://doi.org/10.3390/nu16213721
APA StyleMolfino, A., Ambrosani, F., Udali, S., Imbimbo, G., Moruzzi, S., Castagna, A., Pattini, P., Tambaro, F., Ramaccini, C., Muscaritoli, M., & Friso, S. (2024). DNA Methylation Signatures Characterize Gene Expression Modulation in Lung Cancer Patients Affected by Anorexia. Nutrients, 16(21), 3721. https://doi.org/10.3390/nu16213721


