Abstract
Bean consumption during childhood may play a role in promoting early-life health given their high nutritional quality. To examine the associations of children’s bean consumption with the socio-demographic characteristics of the child and mother and the child’s nutrient intake, we analyzed data from the WIC-ITFPS-2, which followed children and their mothers at 1, 3, 5, 7, 9, 11, 13, 15, 18, and 24 months (m) following birth. Caregivers (mostly mothers) responded to an interview-administered 24 h recall on their child’s dietary intake at each time point. The intake of dried beans, chili, yellow beans, and lima beans was quantified. Correlate measures included socio-demographic characteristics. Outcome measures of interest focused on the intake of macronutrients (grams and % kcals) and micronutrients at 11 (infancy) and 24 m (toddler) only. To ensure statistical power, we only examined the associations of dried beans and chili with socio-demographics (Chi-square tests) and nutritional outcomes (ANOVA) at 11 and 24 m. The proportion of children who consumed dried beans or chili was very low in the first 6 m of age, started to increase at 7 m (1.2% and 0.4%) and 11 m (4.9% and 2.3%), and reached a high level at 18 m (10.5%) and 24 m (5.9%), respectively. Consumption of yellow or lima beans was rare (<0.1%). At 11 and 24 m, dried bean consumption was higher in children who were White (vs. Black). Dried bean and chili consumption was higher in children who were of Hispanic or Latino ethnicity (vs. non-Hispanic or non-Latino ethnicity). Children who consumed dried beans and chili at 11 or 24 m had a higher intake of total energy, protein, total fiber, potassium, folate, and magnesium compared with non-consumers. The bean consumption was low amongst children, differed by race and ethnicity, and was associated with improved macro- and micronutrient intake in children at 11 and 24 m.
1. Introduction
Optimal nutrition throughout infancy and the first 2 years of life has a critical impact on early childhood development and may protect against the programming of metabolic disease risk, triggered by early exposure to both nutritional deficiencies and overnutrition [1]. A previous cross-sectional analysis of data from NHANES 2009–2014 reported that a significant proportion of US children from infancy through preschool age (<5 years) exceeded the recommended limits for sugars, saturated fat, and sodium [2]. Moreover, increasing evidence suggests that an excessive intake of sodium and added sugar during infancy and early childhood is associated with poor cardiovascular health and overweight/obesity status [3,4,5]. This is particularly concerning in light of the wide availability of highly processed foods for infants and children [6,7,8]. Previous work has reported that consumption of added sugars from infant formulas was associated with rapid weight gain in infants and toddlers [9]. Thus, the introduction of whole, nutrient-dense foods during complementary feeding practices and early childhood is recommended to provide optimal nutrition to support the high nutrient intake demands for rapid growth [10], set future flavor preferences and dietary habits [11,12], and improve the nutrition status and health status of children [13].
Pulses such as dried beans, peas, and lentils have an outstanding nutritional profile, containing high-quality protein, complex carbohydrates, micronutrients (including iron, folate, potassium, zinc, and magnesium), and phytochemicals (i.e., catechins and procyanidins) [14,15]. Previous studies in adult populations suggest that pulse consumption is associated with an overall improvement in diet quality due to higher energy-adjusted intakes of fiber, folate, magnesium, potassium, zinc, iron, and choline and a lower intake of fat [16,17,18]. Surprisingly, only limited research has been conducted on early childhood (3–5 years) to assess the health-promoting and disease-prevention benefits of pulse consumption. Further, we are not aware of previous reports that have assessed the prevalence of pulse consumption in infants and children, although it is expected to be low, as pulse consumption amongst the general public is far below recommendations [19,20]. Additionally, the nutrient profiles of bean-based foods may vary significantly depending on factors such as the type of beans that are consumed and cooking methods, as seen in dishes like chili, where various combinations of vegetables and meats can be used to cook them [21]. Little attention has been given to the confounding effects of other nutrients or ingredients that are commonly paired with beans, which may also impact the interpretation of their health effects. Therefore, using data from the Women, Infants, and Children Infant and Toddler Feeding Practices Study-2 (WIC ITFPS-2), we aimed to estimate the prevalence and correlates of bean consumption among children from 1 m to 24 m and describe associations between children’s bean consumption, energy, and nutrient intake at 11 m and 24 m.
2. Materials and Methods
2.1. Study Population and Sample
This was a secondary data analysis using data from the WIC ITFPS-2. This study focused on infant feeding practices and nutrition outcomes of participants enrolled in the Special Supplemental Nutrition Program for Women, Infants, and Children (WIC). Methodological details on WIC ITFPS-2 have been published previously [22]. Briefly, mothers and their children were followed at 1, 3, 5, 7, 9, 11, 13, 15, 18, 24, 30, 42, 48, 54, and 60 months (m) after birth. Participants (mother-child dyads) were recruited in-person over a 12-week period from 1 July 2013 to 18 November 2013 in the 80 sampled WIC sites (98 mothers per site). The inclusion criteria involved participants who were able to speak English or Spanish (mother), were at least 16 y of age (mother), enrolled in WIC for the first time during the mother’s current pregnancy or before the child was 2.5 m old, had a household income at or below 185 percent of the Federal Poverty Level (the income threshold for WIC participation), and completed an interview when the child was either 1 or 3 m of age. Conversely, the exclusion criteria included infants who were older than 2.5 months at recruitment, mothers under the age of 16, mothers in foster care upon enrollment, and foster parents registering a foster infant. A total of 4489 eligible participants and 4367 children were enrolled in the study, 2322 completed follow-ups at 11 m, and 2461 completed follow-ups at 24 m (Supplementary Figure S1).
We included 3039 children (Table 1) with complete data on infant consumption of at least one of the 3 common bean products (dried bean, chili, and yellow bean) at 11 or 24 m (two important milestone ages of child development). The mothers provided written informed consent for their and their children’s participation. All study procedures were conducted in accordance with the ethical standards of the responsible committee on social and behavioral science research and with the Helsinki Declaration of 1975, as revised in 2000. This secondary data analysis project used de-identified data from the WIC ITFPS-2. It was approved by the University at Buffalo Institutional Review Board.

Table 1.
Distribution of characteristics of children and mothers in the analytic sample.
2.2. Exposures
We examined infant/toddler consumption of several common bean products consumed by the U.S. general population [17], including dried beans, chili, yellow beans, and lima beans using the 24 h data. For each age (1, 3, 5, 9, 11, 13, 15, 18, and 24 m), from the mother-reported list of foods that were consumed by the infant or toddler, children were coded as dried bean consumers if their mother reported that they consumed “dried beans and peas, vegetarian meat substitutes” on the previous day and as non-consumers if the mother reported that they did not consume this food in the previous 24 h. Similarly, three other binary variables for chili, yellow bean, and lima bean consumers/non-consumers were created with the “yes” option if chili (“bean and rice, chili, and other bean mixtures”), yellow bean (“yellow beans”), and lima bean (“immature lima bean”) were consumed, respectively, and with the “no” option if the child did not consume these. Information concerning the frequency or amount of bean intake by infants was not available.
2.3. Nutrition Outcome Measures
To estimate an infant’s energy and nutrient intake, a 24 h dietary recall [23,24] interview was conducted with a main caregiver (mostly the mother) over the telephone at each visit using the USDA’s Automated Multi-Pass Method (AMPM) [22,25]. The mother was asked to recall the infant’s dietary intake for each eating event, including foods, beverages, and dietary supplements, from 12:00 a.m. through 11:59 p.m. on the previous day, which could be a weekday or weekend. The caregivers were provided with measuring guides to help them report the child’s portion size during the interview. The USDA Food and Nutrition Database for Dietary Studies (FNDDS), 5.0, was used to assess total calorie and nutrient intake from the 24 h data [25]. If the caregiver did not know about the amount of food that the child ate, then the amount was estimated using the FNDDS [25]. For our nutritional outcome measures, we focused on the nutrients that are known to be rich in bean products (i.e., protein, protein intake (% of energy), carbohydrate, carbohydrate intake (% of energy), total fat, fat intake (% of energy), fiber, iron, potassium, folate, vitamin D, and magnesium) and those that would potentially be displaced from the diet (i.e., saturated fat) with increased dietary bean intake.
2.4. Covariates
Based on the literature in this field [17,26,27], we considered the socio-demographic characteristics of children and mothers as the potential correlates of bean consumption at 11 and 24 m in this study. At 1 or 3 m of child age, mothers completed a questionnaire to obtain socio-demographic information. Child characteristics included sex (male, female), race (Black or African American, White, others), ethnicity (Hispanic or Latino, not Hispanic or Latino), and birth weight (low ≤5 lbs. 9 oz.; normal, from 5 lbs. 10 oz. to 9 lbs. 13 oz.; high ≥9 lbs. 14 oz.). Parental characteristics included marital status (married, not married), timing of WIC enrollment [1st trimester, 2nd trimester, 3rd trimester, 4th trimester (postnatal)], body mass index (BMI) status (normal or underweight, overweight, obese), age (16–19 years, 20–25 years, 26 years or older), highest education (9th grade or less, 10th or 11th grade, 12th grade, more than 12th grade), nativity status (born in the U.S., not born in the U.S.), food security score (high or marginal, low, and very low), poverty status (75% of poverty guideline or below, above 75% but no more than 130%, above 130%), cohabitation status (living with father of the baby, not living with father of the baby), maternal breastfeeding duration (no breastfeeding or 0 m, greater than 0 m but ≤3 m, greater than 3 m but ≤6 m, and greater than 6 m), nutrition education (received training on formula only, received training on cereal only, received training on both, received training on neither, not applicable), participation in non-WIC benefit program (not in any other benefit programs, in Supplemental Nutrition Assistance Program [SNAP] or in SNAP and other programs, and in other programs excluding SNAP) [28,29].
2.5. Statistical Analysis
To examine the age trend of children’s bean consumption, we plotted bar charts, with the X-axis as the child’s age in months (m) and the Y-axis as the percentage of infants who consumed a specific bean food, i.e., dried beans (Figure 1a), chili (Figure 1b), and yellow beans (Figure 1c).
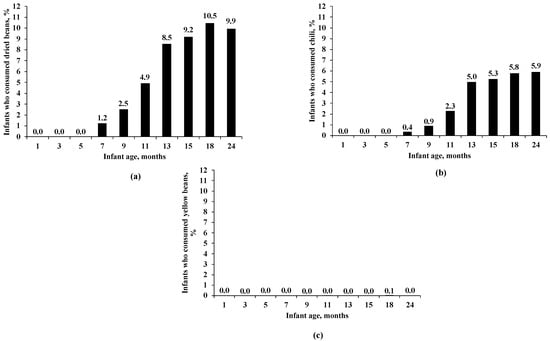
Figure 1.
(a) Percentage of infants who consumed dried beans by age. (b) Percentage of infants who consumed chili by age. (c) Percentage of infants who consumed yellow beans by age. The available sample size varied by infant age for dried beans, chili, and yellow beans: 3398 for 1 m, 2881 for 3 m, 2631 for 5 m, 3121 for 7 m, 2443 for 9 m, 2316 for 11 m, 2799 for 13 m, 2076 for 15 m, 1998 for 18 m, and 2465 for 24 m.
The percentage of infants who consumed dried beans, chili, and yellow beans by age is presented in Figure 1a–c, respectively.
We examined the frequencies and percentages of our sample characteristics of children and mothers (Table 1).
Next, we classified the children based on their mother-reported bean consumption at 11 and 24 m of child age: children who consumed beans vs. children who did not consume beans. All statistical analyses comparing dried bean consumption to participant characteristics and nutrient intake of the children were conducted based on the dietary intake of the children at 11 and 24 m. We did not examine these associations for the consumption of yellow or lima beans due to insufficient statistical power related to its very low consumption. Chi-square tests were used to examine if the consumption of dried beans and chili at 11 and 24 m (Table 2 and Table 3) differed by socio-demographic characteristics. We conducted ANOVA (analysis of variance) to determine if mean nutrient intakes differed by dried bean consumption (Table 4) and by chili consumption (Table 5). We conducted all analyses using SAS version 9.4 (SAS Institute, Inc., Cary, NC, USA). A two-sided p-value < 0.05 was considered statistically significant.
Table 2.
Associations between socio-demographics and dried bean consumption at 11 and 24 m.
Table 3.
Associations between socio-demographics and chili consumption at 11 m and 24 m.
Table 4.
Association of dried bean consumption with nutritional outcomes in children at 11 and 24 m.
Table 5.
Association of chili consumption with nutritional outcomes in children at 11 and 24 m.
3. Results
3.1. Sample Characteristics
The distributions of the sample characteristics of children and their mothers are shown in Table 1. The percentages of males (51.0%) and females (49.0%) were similarly distributed in the sample. The children were mostly White (55.8%), non-Hispanic or Latino (58.6%), and had a normal birth weight (91.4%). The majority of the mothers were unmarried (68.7%), were enrolled into WIC in the 1st or the 2nd trimester (71.6%), were overweight or obese (56.4%), were aged 26 years or older (48.0%), had an education level of the 12th grade or lower (61.1%), were born in the U.S. (74.5%), had high or marginal food security (51.2%), were living with the baby’s father (54.6%), breastfed their children (greater than 0 m but ≤3 m [47.9%], greater than 3 m but ≤6 m [11.6%], greater than 6 m [22.6%]), and were participating in SNAP and/or another benefit programs (84.4%).
3.2. Age Trend of Bean Consumption
The percentage of infants who consumed dried beans was very low in the first 6 m of age, started to increase at 7 m (1.2%), and peaked at 18 m (10.5%) (Figure 1a). Similarly, the percentage of infants who consumed chili was very low in the first 6 m of age, started to increase at 7 m (0.4%), and peaked at 24 m (5.9%) (Figure 1b). However, the percentage of infants who consumed yellow beans remained very low throughout all ages, with the highest value being only 0.1% at 18 m (Figure 1c).
3.3. Socio-Demographics for Infant Dried Bean Consumption
Dried bean consumption at 11 months. White children (6.3%) were more likely to consume dried beans than Black children (1.3%) at 11 m of age. Hispanic or Latino children (8.5%) were more likely to consume dried beans than non-Hispanic or Latino children (2.1%) (Table 2). A higher dried bean consumption was observed in children of mothers who were married (6.8% vs. 4.1% children of unmarried mothers), were not born in the U.S. (8.0% vs. 3.8% for those born in the U.S.), and were cohabitating with the infant’s father (5.7% vs. 3.9% of those not cohabitating), or who breastfed their children for a longer duration (0 m [1.9%], greater than 0 m but ≤3 m [4.4%], greater than 3 m but ≤6 m [5.9%], greater than 6 m [8.0%]). Other characteristics, including the child’s sex and birth weight, were not associated with dried bean consumption at 11 m.
Dried bean consumption at 24 months. White children (11.8%) were more likely to consume dried beans than Black children (5.2%) at 24 m of age. Hispanic or Latino children (18.7%) were more likely to consume dried beans than non-Hispanic or Latino children (4.1%) (Table 2). Children of married mothers (12.9% vs. 8.6% of children of unmarried mothers) or with maternal education up to the 9th grade (18.5% vs. 8.7% with maternal education above the 12th grade) had a higher intake of dried beans. Children of mothers who were not born in the U.S. (20.7% vs. 6.3% born in the U.S), were not cohabitating with the infant’s father (8.5% vs. 11.2% for cohabitating), breastfed their children for a longer duration (0 m [5.7%], greater than 0 m but ≤3 m [8.8%], greater than 3 m but ≤6 m [11.5%], greater than 6 m [13.7%]), or had participated in SNAP and other programs (8.0% vs. 12.9% participated in programs other than SNAP) had a higher dried bean consumption. Other characteristics, including the child’s sex and birth weight status, were not associated with dried bean consumption at 24 m.
3.4. Socio-Demographics for Infant Chili Consumption
Chili consumption at 11 months. Hispanic or Latino children (3.8%) were more likely to consume chili at 11 m than non-Hispanic or Latino children (1.1%). Children of mothers with an education higher than the 12th grade (3.3% vs. 1.3% with maternal education of the 12th grade) and children of mothers who were not born in the U.S. (3.5% vs. 1.8% born in the U.S.) had a higher chili consumption (Table 3). Other characteristics, including the child’s sex, race, and birth weight, were not associated with chili consumption at 11 m.
Chili consumption at 24 months. Hispanic or Latino children (8.7%) were more likely to consume chili at 24 m than non-Hispanic or Latino children (4.1%). Children of mothers with an education of the 9th grade or less (8.4% vs. 4.5% with maternal education of the 12th grade) and children of mothers who were not born in the U.S. (8.7% vs. 4.9% born in the U.S.) had a higher chili consumption (Table 3). Other characteristics, including the child’s sex, race, and birth weight, were not associated with chili consumption at 24 m.
3.5. Nutrient Intake by Child’s Dried Bean Consumption
Dried bean consumption at 11 months. Compared with non-consuming children, child consumers of dried beans had a higher total daily energy intake at 11 m (975.05 vs. 907.01 Kcal) (Table 4). A higher protein consumption was observed in dried bean consumers vs. non-consumers (28.79 vs. 24.04 g and 11.4 vs. 10.3% of energy). Although the absolute intake of carbohydrates did not differ, the percentage of energy from carbohydrates was lower in dried bean consumers vs. non-consumers (52.6 vs. 54.1%). In addition, the total fiber intake was higher in consumers vs. non-consumers (8.34 vs. 6.05 g). Dried bean consumption was associated with a higher absolute total fat intake (39.61 vs. 36.51 g), but no difference was observed when this was expressed as a percentage of energy intake. Compared with non-consumers, consumers of dried beans had a higher intake of potassium (1357.65 vs. 1251.84 mg), folate (202.49 vs. 154.39 mcg), and magnesium (137.62 vs. 121.07 mg) but a lower intake of iron (15.38 vs. 18.00 mg) and vitamin D (6.76 vs. 8.02 mcg).
Dried bean consumption at 24 months. At 24 m, consumption of dried beans was associated with a lower energy intake (1264.35 vs. 1326.18 Kcal) vs. non-consumption. Compared with non-consumption, dried bean intake was associated with a higher intake of protein (16.7% vs. 15.8% of energy) but a lower intake of fat (42.87 vs. 47.77 g and 30.5% vs. 32.3% of energy). Dried bean consumption was not associated with a difference in total carbohydrate intake; however, a higher intake of total dietary fiber was observed for dried bean consumers (11.56 g) vs. non-consumers (10.38 g). Consumption of dried beans was associated with a higher intake of potassium (2036.85 vs. 1967.00 mg), folate (323.62 vs. 307.21 mcg), and magnesium (195.93 vs. 189.16 mg) compared with non-consumption.
3.6. Nutritional Outcomes for Infant Chili Consumption
Chili consumption at 11 months. Compared with non-consumption, the consumption of chili was associated with a higher total energy intake at 11 m (1053.67 vs. 907.01 Kcal) (Table 5). A higher protein consumption was noted in chili consumers vs. non-consumers (30.72 vs. 24.12 g and 11.3% vs. 10.4% of energy). Although the percentage of energy from carbohydrates did not differ, the absolute intake of carbohydrates was higher in chili consumers vs. non-consumers (141.77 vs. 122.34 g). In addition, the total fiber intake was higher in consumers vs. non-consumers (9.03 vs. 6.10 g). Chili consumption was associated with a higher absolute total fat intake (41.40 vs. 36.55 g), but no difference was observed when this was expressed as a percentage of energy intake. Compared with non-consumption, chili consumption was associated with higher intakes of potassium (1468.23 vs. 1252.10 mg), folate (206.89 vs. 155.59 mcg), and magnesium (149.47 vs. 121.24 mg). However, the intake of iron and vitamin D did not differ.
Chili consumption at 24 months. At 24 m, the consumption of chili was associated with a higher intake of fiber (12.01 vs. 10.40 g). Compared with non-consumption, chili intake was associated with a higher percent of energy from carbohydrates (54.5% vs. 53.5% of energy) but a lower percent of energy from fats (30.9% vs. 32.2% of energy). Chili consumption was not associated with changes in total protein, total carbohydrate, and absolute total fat intake. The consumption of chili was associated with a higher intake of potassium (2085.47 vs. 1967.01 mg) and magnesium (203.39 vs. 188.99 mg) compared with non-consumption.
4. Discussion
In this study, we used data from the WIC ITFPS-2 to characterize the prevalence of bean intake among children. We also examined socio-demographic correlates for both mothers and children and the nutrient intake by children’s bean consumption. We observed that the consumption of dried beans and chili in children was low in the first 6 m of age but increased at 7 m and peaked at 18 m and 24 m, respectively. However, the consumption of yellow or lima beans was rare. White and Hispanic or Latino children were found to consume more dried beans at 11 and 24 m than Black and non-Hispanic or Latino ethnicity children. Similarly, the consumption of chili was higher among children who were Hispanic or Latino at 11 and 24 m. Children who consumed dried beans at 11 and 24 m had a higher intake of protein, total dietary fiber, potassium, and folate compared with non-consumers. Children who consumed chili at 11 m had a higher intake of total energy, protein, carbohydrates, total fiber, fat, potassium, folate, and magnesium compared with non-consumers. Similarly, children who consumed chili at 24 m had a higher intake of dietary fiber, and a higher percentage of energy from carbohydrates, potassium, and magnesium.
Dietary recommendations from both the Dietary Guidelines for Americans [30] and the American Heart Association [31] encourage 1.5 cups of cooked pulses/week for both toddlers and children; however, few studies have evaluated childhood pulse consumption patterns in the US [32]. This is unfortunate, as a previous study suggested that although the acceptability of legumes by youths (7–16 years old) varied in general by legume categories, the acceptability of beans and chili with beans was high, at 67% and 66%, respectively [33]. Further, exposing children to nutritious foods during infancy can influence their liking and willingness to consume healthy foods in the longer term [34,35,36]. Our results suggest that the majority of infants and children do not consume bean products in sufficient quantities, with low consumption of dried beans and chili observed across age groups.
This pattern of low bean consumption is likely multifactorial, including issues specifically pertaining to bean foods themselves (i.e., awareness, attitude, and perception issues) and contributing socio-demographic influences (i.e., race and ethnicity, level of education). Previous work on low-income women suggests that mothers typically make food choices based on their availability of time, culture, convenience, and family taste preferences rather than the nutritional composition of food [37]. A hesitancy to include bean foods as a component of complementary feeding practices or as a childhood dietary staple may be related to the general perception that they are hard to digest and are associated with gastrointestinal discomfort [38]. Further, it was previously reported that messaging strategies to position bean products as a low-cost alternative to meat may actually reduce bean consumption amongst low-income women due to their avoidance of ‘cheap’ family foods and the belief that children require animal-sourced proteins [39].
Additionally, we observed several socio-demographic characteristics that influenced the consumption of dried beans and chili in children. Children of mothers who were born in the U.S. had lower dried bean and chili consumption compared with children of mothers who were not born in the U.S. at 11 and 24 m. Further, at 11 and 24 m, dried bean consumption was higher in children who were White (vs. Black) and Hispanic or Latino ethnicity (vs. non-Hispanic or Latino ethnicity). We observed that children who were breastfed for a duration of more than 6 m had a higher dried bean consumption at 11 m and 24 m, respectively. A recent analysis of population trends in pulse consumption using data from the 2003–2014 National Health and Nutrition Examination Survey reported that Hispanic and Mexican American adults (≥19 years) were more likely to consume dietary pulses compared with other ethnic groups [16]. This may be related to ethnic differences in cooking practices, as Winham et al., (2019) reported that compared with low-income Latina women, non-Hispanic White women may lack a general awareness of how to properly cook beans [26]. Interestingly, we also observed that children (24 m) of mothers who had an education up to the 9th grade or less had a higher intake of dried beans compared with those who had an education of the 12th grade. This finding was perhaps surprising, as previous work has reported that adults with an education beyond high school were more likely to consume pulses compared to those with less education [16,40]. Although the reason(s) for this discrepancy is not clear, it does not appear to be related to maternal poverty status, a finding that is supported by previous work reporting that pulse consumption was not associated with income level [40,41]. These findings suggest that socio-demographic factors, including children’s race and ethnicity, mother’s level of education, nativity status, and breastfeeding duration, play a critical role in determining pulse consumption patterns in young children.
As a low-calorie and nutrient-dense food, pulses are an excellent nutrient source to support childhood development and health. Based on the nutrient composition, pulses can contribute significantly to childhood requirements for protein, dietary fiber, and micronutrients including iron, zinc, and magnesium [32]. In addition to their contribution of nutrients, the consumption of dietary pulses may help to improve the overall diet quality by displacing less healthy nutrients of concern (i.e., added sugar and saturated fat). Accordingly, we observed that compared with non-consumers, children who consumed dried beans at 11m had a higher intake of total energy, protein, total fiber, potassium, folate, and magnesium. Alternatively, the % of energy from carbohydrates was lower in consumers vs. non-consumers at 11 m. The findings at 24 m were similar for micronutrient intake including potassium, folate, and magnesium, but differed with respect to energy (1264 vs. 1326 kcal) and fat (30.5 vs. 32.3% energy), which were both lower in consumers versus non-consumers. Associations in nutritional outcomes for chili consumption at 11 and 24 m were largely discordant, with similarities only noted for fiber and magnesium, which were both higher in consumers vs. non-consumers. Compared with non-consumers, chili consumption at 11 m was associated with an increased intake of energy and protein (% energy); however, these associations were not evident at 24 m. However, chili consumption at 24 m was associated with an increased carbohydrate intake (% energy) and a reduced fat intake (% energy).
We are not aware of any previous work that has examined the association of pulse intake with diet quality or nutrient intake parameters in U.S. children for direct comparison. However, a previous study of 772 mother-child pairs in Southern Ethiopia examined the influence of a maternal nutrition education program that was meant to increase education about the benefits of using pulses in complementary feeding practices [42]. The intervention resulted in a substantial increase in maternal knowledge, attitude, and practices towards pulses and increased the frequency of pulse intake and diet diversity scores in children. Further, anthropometric indices, including stunting, wasting, and underweight were all improved in the intervention group compared with the control. Beyond this study, the influence of increased pulse consumption on childhood health outcomes is not known. However, in previous adult studies, the consumption of pulses and pulse-enriched products has been shown to reduce blood pressure [43], improve glycemic control [44], increase satiety [45], and help in the maintenance of a healthy body weight [46,47]. Further, a recent meta-analysis assessing the relationship between dietary pulses and cardiometabolic health reported a reduced incidence of cardiovascular disease and coronary heart disease with pulse consumption but with low certainty, necessitating the need for future research [48].
5. Strengths and Limitations
The strengths of this study included the prospective design and relatively long follow-up. However, secondary data analysis is constrained by various limitations, including limited control over the data collection, data quality issues, ethical considerations, and restrictions in addressing new research questions. Our study also had several other limitations. Firstly, the primary limitation might be social desirability bias or error from a lack of memory recalling diet, as the mothers reported the children’s diet through a 24 h dietary recall interview. Secondly, we might have limited statistical power to detect significant associations due to the moderate sample size of children who consumed beans. Thirdly, we lacked information about the frequency or amount of bean intake by infants. Additionally, we did not assess the average grams/cups of bean foods, which may have provided valuable insight into the dietary habits of the participants. Fourthly, the 24 h for an infant’s dietary intake could be a weekday or weekend, which may influence what the child is eating. Fifthly, people may cook chili differently, with different types of vegetables and meat. However, we did not have any information on this variation and how different types of beans, vegetables, or meats in the chili may impact infant nutritional outcomes. Furthermore, we did not calculate the percentage of children that met or did not meet the Dietary Reference Intakes by pulse consumption status to determine the number of infants who were below recommended intakes of macro- and micronutrients. However, these aspects would be considered in future analyses.
6. Conclusions
In summary, the results of this study suggest that the consumption of bean products, particularly dried beans, and chili, was low during childhood, differed by race and ethnicity in children at 11 m and 24 m, and was associated with improved macro- and micronutrient intake in early childhood. Future work should examine how bean consumption during infancy and early childhood influences longer-term food preferences and health outcomes.
Supplementary Materials
The following supporting information can be downloaded at https://www.mdpi.com/article/10.3390/nu16081120/s1: Figure S1: Flowchart of Participants.
Author Contributions
Conceptualization, X.W. and T.C.R.; formal analysis, D.C.; investigation, D.C.; data curation, D.C.; writing—original draft preparation, D.C.; writing—review and editing, D.C., T.C.R., X.W. and A.E.M.; funding acquisition, X.W. and T.C.R. All authors have read and agreed to the published version of the manuscript.
Funding
This research was funded by the United States Department of Agriculture, grant number (No. ARS 58-3060-1-040, to X.W.).
Institutional Review Board Statement
The study was conducted in accordance with the Declaration of Helsinki and approved by the Institutional Review Board (or Ethics Committee) of the University at Buffalo (No. STUDY00005702, approved on 12 August 2021).
Informed Consent Statement
Consent from participants was not needed since this study was determined as non-human research.
Data Availability Statement
The data presented in this study cannot be shared without permission from the USDA (data owner). Researchers who are interested in using the WIC-ITFPS-2 data can contact the USDA directly.
Acknowledgments
We would like to thank the staff from the USDA for reviewing and approving our analytic plan, as well as providing access to the de-identified and public use data of the WIC-ITFPS-2.
Conflicts of Interest
The authors declare no conflict of interest. The funders had no role in the design of the study; in the collection, analyses, or interpretation of data; in the writing of the manuscript; or in the decision to publish the results.
References
- Choudhary, D.; Rideout, T.C.; Cameron, C.E.; Lehman, H.K.; Oken, E.; Rifas-Shiman, S.L.; Wen, X. Egg Introduction during Infancy is Associated with Lower Fat Mass Index in Females at Early Adolescence. J. Nutr. 2023, 153, 158–166. [Google Scholar] [CrossRef] [PubMed]
- Wang, Y.; Guglielmo, D.; Welsh, J.A. Consumption of sugars, saturated fat, and sodium among US children from infancy through preschool age, NHANES 2009–2014. Am. J. Clin. Nutr. 2018, 108, 868–877. [Google Scholar] [CrossRef] [PubMed]
- Brion, M.J.; Ness, A.R.; Davey Smith, G.; Emmett, P.; Rogers, I.; Whincup, P.; Lawlor, D.A. Sodium intake in infancy and blood pressure at 7 years: Findings from the Avon Longitudinal Study of Parents and Children. Eur. J. Clin. Nutr. 2008, 62, 1162–1169. [Google Scholar] [CrossRef] [PubMed]
- Emmerik, N.E.; de Jong, F.; van Elburg, R.M. Dietary Intake of Sodium during Infancy and the Cardiovascular Consequences Later in Life: A Scoping Review. Ann. Nutr. Metab. 2020, 76, 114–121. [Google Scholar] [CrossRef] [PubMed]
- Rousham, E.K.; Goudet, S.; Markey, O.; Griffiths, P.; Boxer, B.; Carroll, C.; Petherick, E.S.; Pradeilles, R. Unhealthy Food and Beverage Consumption in Children and Risk of Overweight and Obesity: A Systematic Review and Meta-Analysis. Adv. Nutr. 2022, 13, 1669–1696, Correction in Adv. Nutr. 2022, 13, 2064. [Google Scholar] [CrossRef] [PubMed]
- Maalouf, J.; Cogswell, M.E.; Bates, M.; Yuan, K.; Scanlon, K.S.; Pehrsson, P.; Gunn, J.P.; Merritt, R.K. Sodium, sugar, and fat content of complementary infant and toddler foods sold in the United States, 2015. Am. J. Clin. Nutr. 2017, 105, 1443–1452. [Google Scholar] [CrossRef] [PubMed]
- Kaplan, M.E. Cryoglobulinemia in infectious mononucleosis: Quantitation and characterization of the cryoproeins. J. Lab. Clin. Med. 1968, 71, 754–765. [Google Scholar]
- Hutchinson, J.; Rippin, H.; Threapleton, D.; Jewell, J.; Kanamäe, H.; Salupuu, K.; Caroli, M.; Antignani, A.; Pace, L.; Vassallo, C. High sugar content of European commercial baby foods and proposed updates to existing recommendations. Matern. Child Nutr. 2021, 17, e13020. [Google Scholar] [CrossRef]
- Kong, K.L.; Burgess, B.; Morris, K.S.; Re, T.; Hull, H.R.; Sullivan, D.K.; Paluch, R.A. Association Between Added Sugars from Infant Formulas and Rapid Weight Gain in US Infants and Toddlers. J. Nutr. 2021, 151, 1572–1580. [Google Scholar] [CrossRef]
- Bailey, R.L.; Stang, J.S.; Davis, T.A.; Naimi, T.S.; Schneeman, B.O.; Dewey, K.G.; Donovan, S.M.; Novotny, R.; Kleinman, R.E.; Taveras, E.M.; et al. Dietary and Complementary Feeding Practices of US Infants, 6 to 12 Months: A Narrative Review of the Federal Nutrition Monitoring Data. J. Acad. Nutr. Diet. 2022, 122, 2337–2345.e1. [Google Scholar] [CrossRef]
- Albrechtsen, D.H.; Evensen, S.A.; Froland, S.; Stavem, P.; Lie, S.O.; Steinbakk, M.; Rollag, H.; Solheim, B.; Thorsby, E.; Jacobsen, A.B.; et al. Allogeneic bone marrow transplantation in Norway. Tidsskr. Nor. Laegeforen. 1987, 107, 2222–2224. [Google Scholar] [PubMed]
- Switkowski, K.M.; Aris, I.M.; Gingras, V.; Oken, E.; Young, J.G. Estimated causal effects of complementary feeding behaviors on early childhood diet quality in a US cohort. Am. J. Clin. Nutr. 2022, 115, 1105–1114. [Google Scholar] [CrossRef] [PubMed]
- D’Auria, E.; Borsani, B.; Pendezza, E.; Bosetti, A.; Paradiso, L.; Zuccotti, G.V.; Verduci, E. Complementary Feeding: Pitfalls for Health Outcomes. Int. J. Environ. Res. Public Health 2020, 17, 7931. [Google Scholar] [CrossRef] [PubMed]
- Mudryj, A.N.; Yu, N.; Aukema, H.M. Nutritional and health benefits of pulses. Appl. Physiol. Nutr. Metab. 2014, 39, 1197–1204. [Google Scholar] [CrossRef] [PubMed]
- Singh, N. Pulses: An overview. J. Food Sci. Technol. 2017, 54, 853–857. [Google Scholar] [CrossRef] [PubMed]
- Mitchell, D.C.; Marinangeli, C.P.F.; Pigat, S.; Bompola, F.; Campbell, J.; Pan, Y.; Curran, J.M.; Cai, D.J.; Jaconis, S.Y.; Rumney, J. Pulse Intake Improves Nutrient Density among US Adult Consumers. Nutrients 2021, 13, 2668. [Google Scholar] [CrossRef] [PubMed]
- Mitchell, D.C.; Lawrence, F.R.; Hartman, T.J.; Curran, J.M. Consumption of dry beans, peas, and lentils could improve diet quality in the US population. J. Am. Diet. Assoc. 2009, 109, 909–913. [Google Scholar] [CrossRef]
- Mudryj, A.N.; Yu, N.; Hartman, T.J.; Mitchell, D.C.; Lawrence, F.R.; Aukema, H.M. Pulse consumption in Canadian adults influences nutrient intakes. Br. J. Nutr. 2012, 108 (Suppl. 1), S27–S36. [Google Scholar] [CrossRef]
- Mitchell, D.C.; Webster, A.; Garrison, B. Terminology Matters: Advancing Science to Define an Optimal Pulse Intake. Nutrients 2022, 14, 655. [Google Scholar] [CrossRef]
- Marinangeli, C.P.F.; Curran, J.; Barr, S.I.; Slavin, J.; Puri, S.; Swaminathan, S.; Tapsell, L.; Patterson, C.A. Enhancing nutrition with pulses: Defining a recommended serving size for adults. Nutr. Rev. 2017, 75, 990–1006. [Google Scholar] [CrossRef]
- Tungmunnithum, D.; Drouet, S.; Lorenzo, J.M.; Hano, C. Effect of traditional cooking and in vitro gastrointestinal digestion of the ten most consumed beans from the fabaceae family in Thailand on their phytochemicals, antioxidant and anti-diabetic potentials. Plants 2021, 11, 67. [Google Scholar] [CrossRef] [PubMed]
- Harrison, G.G.; Hirschman, J.D.; Owens, T.A.; McNutt, S.W.; Sallack, L.E. WIC Infant and Toddler Feeding Practices Study: Protocol design and implementation. Am. J. Clin. Nutr. 2014, 99, 742S–746S. [Google Scholar] [CrossRef] [PubMed]
- Borger, C.; Paolicelli, C.; Sun, B.; Zimmerman, T.P.; Dixit-Joshi, S. Duration of WIC Participation and Early Feeding Practices Are Associated with Meeting the Added Sugars Recommendation at Age 3 Years. J. Nutr. Educ. Behav. 2022, 54, 670–676. [Google Scholar] [CrossRef] [PubMed]
- Anderson, C.E.; Martinez, C.E.; Ritchie, L.D.; Paolicelli, C.; Reat, A.; Borger, C.; Whaley, S.E. Longer Special Supplemental Nutrition Program for Women, Infants, and Children (WIC) participation duration is associated with higher diet quality at age 5 years. J. Nutr. 2022, 152, 1974–1982. [Google Scholar] [CrossRef] [PubMed]
- Montville, J.B.; Ahuja, J.K.; Martin, C.L.; Heendeniya, K.Y.; Omolewa-Tomobi, G.; Steinfeldt, L.C.; Anand, J.; Adler, M.E.; LaComb, R.P.; Moshfegh, A. USDA food and nutrient database for dietary studies (FNDDS), 5.0. Procedia Food Sci. 2013, 2, 99–112. [Google Scholar] [CrossRef]
- Winham, D.M.; Tisue, M.E.; Palmer, S.M.; Cichy, K.A.; Shelley, M.C. Dry Bean Preferences and Attitudes among Midwest Hispanic and Non-Hispanic White Women. Nutrients 2019, 11, 178. [Google Scholar] [CrossRef] [PubMed]
- Martinez-Galiano, J.M.; Amezcua-Prieto, C.; Salcedo-Bellido, I.; Gonzalez-Mata, G.; Bueno-Cavanillas, A.; Delgado-Rodriguez, M. Maternal dietary consumption of legumes, vegetables and fruit during pregnancy, does it protect against small for gestational age? BMC Pregnancy Childbirth 2018, 18, 486. [Google Scholar] [CrossRef] [PubMed]
- Borger, C.; Weinfield, N.S.; Paolicelli, C.; Sun, B.; May, L. Prenatal and postnatal experiences predict breastfeeding patterns in the WIC Infant and Toddler Feeding Practices Study-2. Breastfeed. Med. 2021, 16, 869–877. [Google Scholar] [CrossRef] [PubMed]
- Chaparro, M.P.; Anderson, C.E. Differences in early childhood dietary behaviors by infant feeding type and sex. J. Nutr. 2021, 151, 2001–2009. [Google Scholar] [CrossRef]
- Thompson, H.J. The Dietary Guidelines for Americans (2020–2025): Pulses, Dietary Fiber, and Chronic Disease Risk—A Call for Clarity and Action; Multidisciplinary Digital Publishing Institute: Basel, Switzerland, 2021; Volume 13, p. 4034. [Google Scholar]
- Gidding, S.S.; Dennison, B.A.; Birch, L.L.; Daniels, S.R.; Gillman, M.W.; Lichtenstein, A.H.; Rattay, K.T.; Steinberger, J.; Stettler, N.; Van Horn, L.; et al. Dietary recommendations for children and adolescents: A guide for practitioners: Consensus statement from the American Heart Association. Circulation 2005, 112, 2061–2075. [Google Scholar] [CrossRef]
- Vieira, E.D.; Gomes, A.M.; Gil, A.M.; Vasconcelos, M.W. Pulses’ benefits in children’s diets: A narrative review. J. Obes. Chronic Dis. 2021, 5, 13–22. [Google Scholar]
- Gellar, L.; Rovner, A.J.; Nansel, T.R. Whole grain and legume acceptability among youths with type 1 diabetes. Diabetes Educ. 2009, 35, 422–427. [Google Scholar] [CrossRef] [PubMed]
- Anzman-Frasca, S.; Savage, J.S.; Marini, M.E.; Fisher, J.O.; Birch, L.L. Repeated exposure and associative conditioning promote preschool children’s liking of vegetables. Appetite 2012, 58, 543–553. [Google Scholar] [CrossRef] [PubMed]
- Nicklaus, S. Development of food variety in children. Appetite 2009, 52, 253–255. [Google Scholar] [CrossRef] [PubMed]
- Campbell, K.; Crawford, D. Family food environments as determinants of preschool-aged children’s eating behaviours: Implications for obesity prevention policy. A review. Aust. J. Nutr. Diet. 2001, 58, 19–26. [Google Scholar]
- Wiig, K.; Smith, C. The art of grocery shopping on a food stamp budget: Factors influencing the food choices of low-income women as they try to make ends meet. Public Health Nutr. 2009, 12, 1726–1734. [Google Scholar] [CrossRef]
- Henn, K.; Goddyn, H.; Olsen, S.B.; Bredie, W.L. Identifying behavioral and attitudinal barriers and drivers to promote consumption of pulses: A quantitative survey across five European countries. Food Qual. Prefer. 2022, 98, 104455. [Google Scholar] [CrossRef]
- Palmer, S.M.; Winham, D.M.; Oberhauser, A.M.; Litchfield, R.E. Socio-Ecological Barriers to Dry Grain Pulse Consumption among Low-Income Women: A Mixed Methods Approach. Nutrients 2018, 10, 1108. [Google Scholar] [CrossRef] [PubMed]
- Semba, R.D.; Rahman, N.; Du, S.; Ramsing, R.; Sullivan, V.; Nussbaumer, E.; Love, D.; Bloem, M.W. Patterns of Legume Purchases and Consumption in the United States. Front. Nutr. 2021, 8, 732237. [Google Scholar] [CrossRef]
- Schmidt, O.P. Taxonomy of bronchitis. Prax. Pneumol. 1973, 27, 281–288. [Google Scholar]
- Teshome, G.B.; Whiting, S.J.; Green, T.J.; Mulualem, D.; Henry, C.J. Scaled-up nutrition education on pulse-cereal complementary food practice in Ethiopia: A cluster-randomized trial. BMC Public Health 2020, 20, 1437. [Google Scholar] [CrossRef] [PubMed]
- Jayalath, V.H.; de Souza, R.J.; Sievenpiper, J.L.; Ha, V.; Chiavaroli, L.; Mirrahimi, A.; Di Buono, M.; Bernstein, A.M.; Leiter, L.A.; Kris-Etherton, P.M.; et al. Effect of dietary pulses on blood pressure: A systematic review and meta-analysis of controlled feeding trials. Am. J. Hypertens. 2014, 27, 56–64. [Google Scholar] [CrossRef] [PubMed]
- Winham, D.M.; Thompson, S.V.; Heer, M.M.; Davitt, E.D.; Hooper, S.D.; Cichy, K.A.; Knoblauch, S.T. Black Bean Pasta Meals with Varying Protein Concentrations Reduce Postprandial Glycemia and Insulinemia Similarly Compared to White Bread Control in Adults. Foods 2022, 11, 1652. [Google Scholar] [CrossRef] [PubMed]
- Bajka, B.H.; Pinto, A.M.; Perez-Moral, N.; Saha, S.; Ryden, P.; Ahn-Jarvis, J.; van der Schoot, A.; Bland, C.; Berry, S.E.; Ellis, P.R.; et al. Enhanced secretion of satiety-promoting gut hormones in healthy humans after consumption of white bread enriched with cellular chickpea flour: A randomized crossover study. Am. J. Clin. Nutr. 2022, 117, 477–489. [Google Scholar] [CrossRef] [PubMed]
- Papanikolaou, Y.; Fulgoni, V.L., 3rd. Bean consumption is associated with greater nutrient intake, reduced systolic blood pressure, lower body weight, and a smaller waist circumference in adults: Results from the National Health and Nutrition Examination Survey 1999–2002. J. Am. Coll. Nutr. 2008, 27, 569–576. [Google Scholar] [CrossRef] [PubMed]
- Hermsdorff, H.H.; Zulet, M.A.; Abete, I.; Martinez, J.A. A legume-based hypocaloric diet reduces proinflammatory status and improves metabolic features in overweight/obese subjects. Eur. J. Nutr. 2011, 50, 61–69. [Google Scholar] [CrossRef]
- Davies, M.J. Anatomic features in victims of sudden coronary death. Coronary artery pathology. Circulation 1992, 85, I19–I24. [Google Scholar]

Disclaimer/Publisher’s Note: The statements, opinions and data contained in all publications are solely those of the individual author(s) and contributor(s) and not of MDPI and/or the editor(s). MDPI and/or the editor(s) disclaim responsibility for any injury to people or property resulting from any ideas, methods, instructions or products referred to in the content. |
© 2024 by the authors. Licensee MDPI, Basel, Switzerland. This article is an open access article distributed under the terms and conditions of the Creative Commons Attribution (CC BY) license (https://creativecommons.org/licenses/by/4.0/).