
Validation of Nutritional Approaches to Modulate Cardiovascular and Diabetic Risk Factors in Patients with Hypertriglyceridemia or Prediabetes—The MoKaRi II Randomized Controlled Study


 and
and 
Abstract
:1. Introduction
2. Materials and Methods
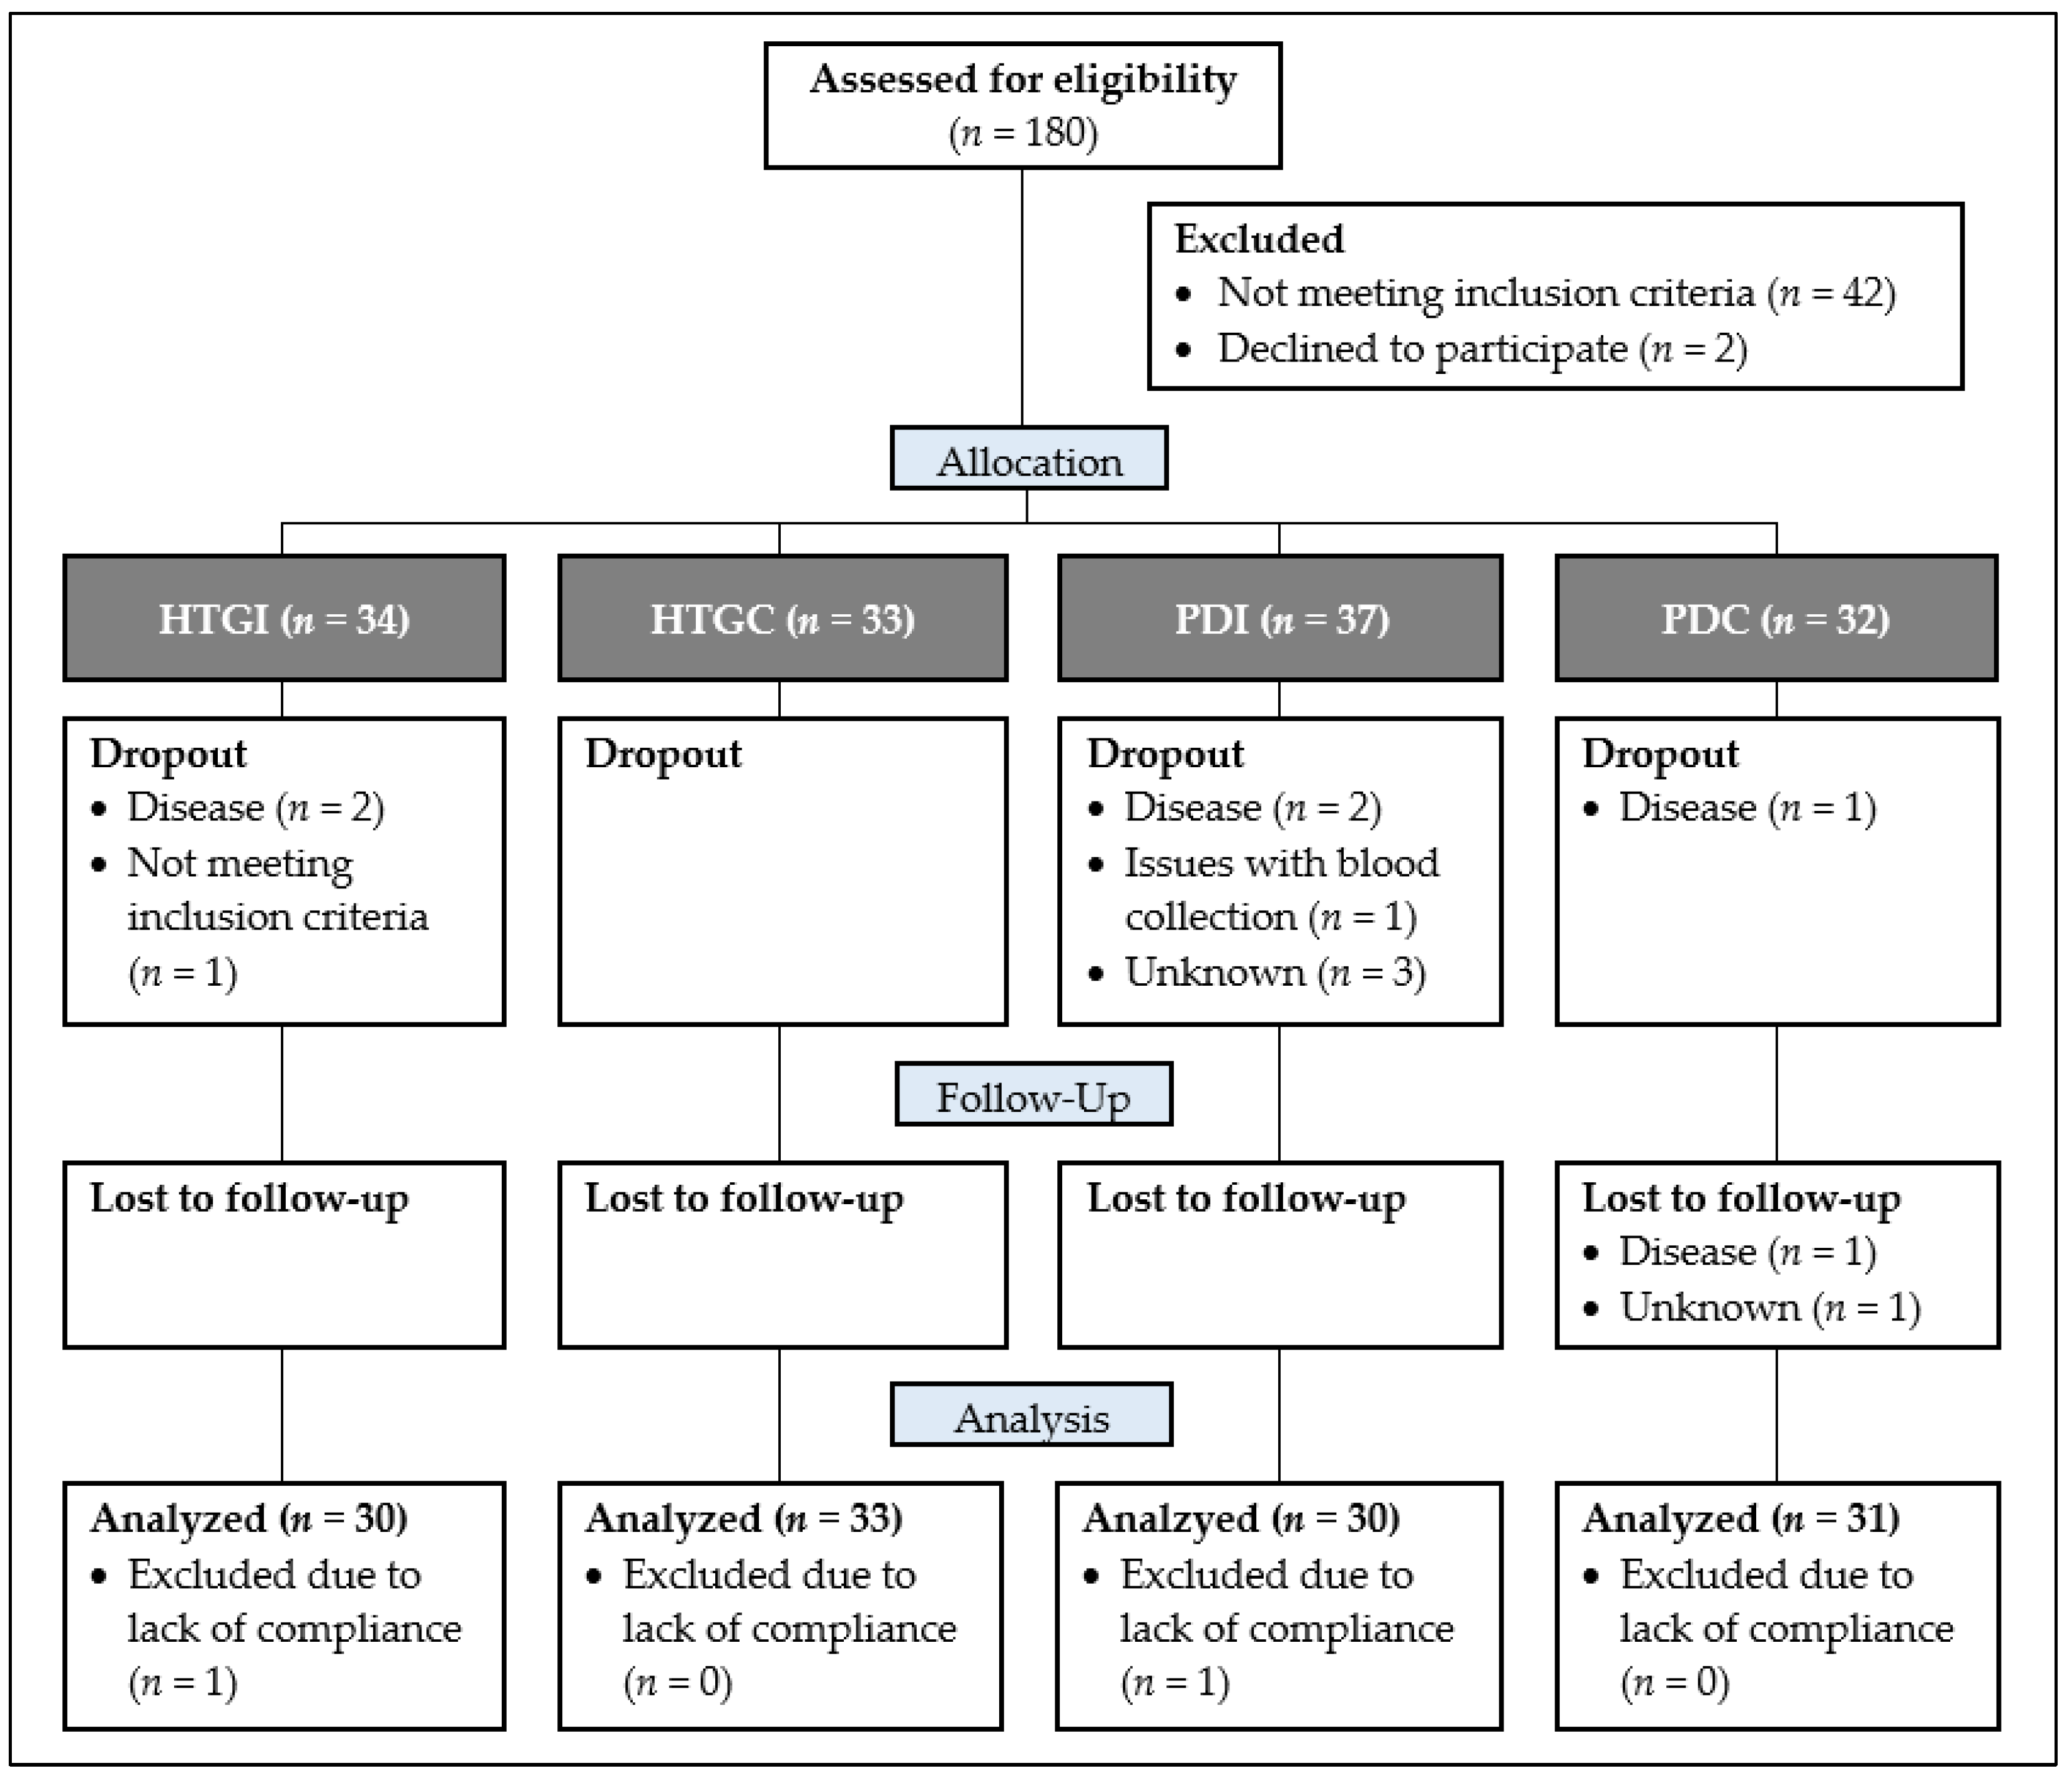
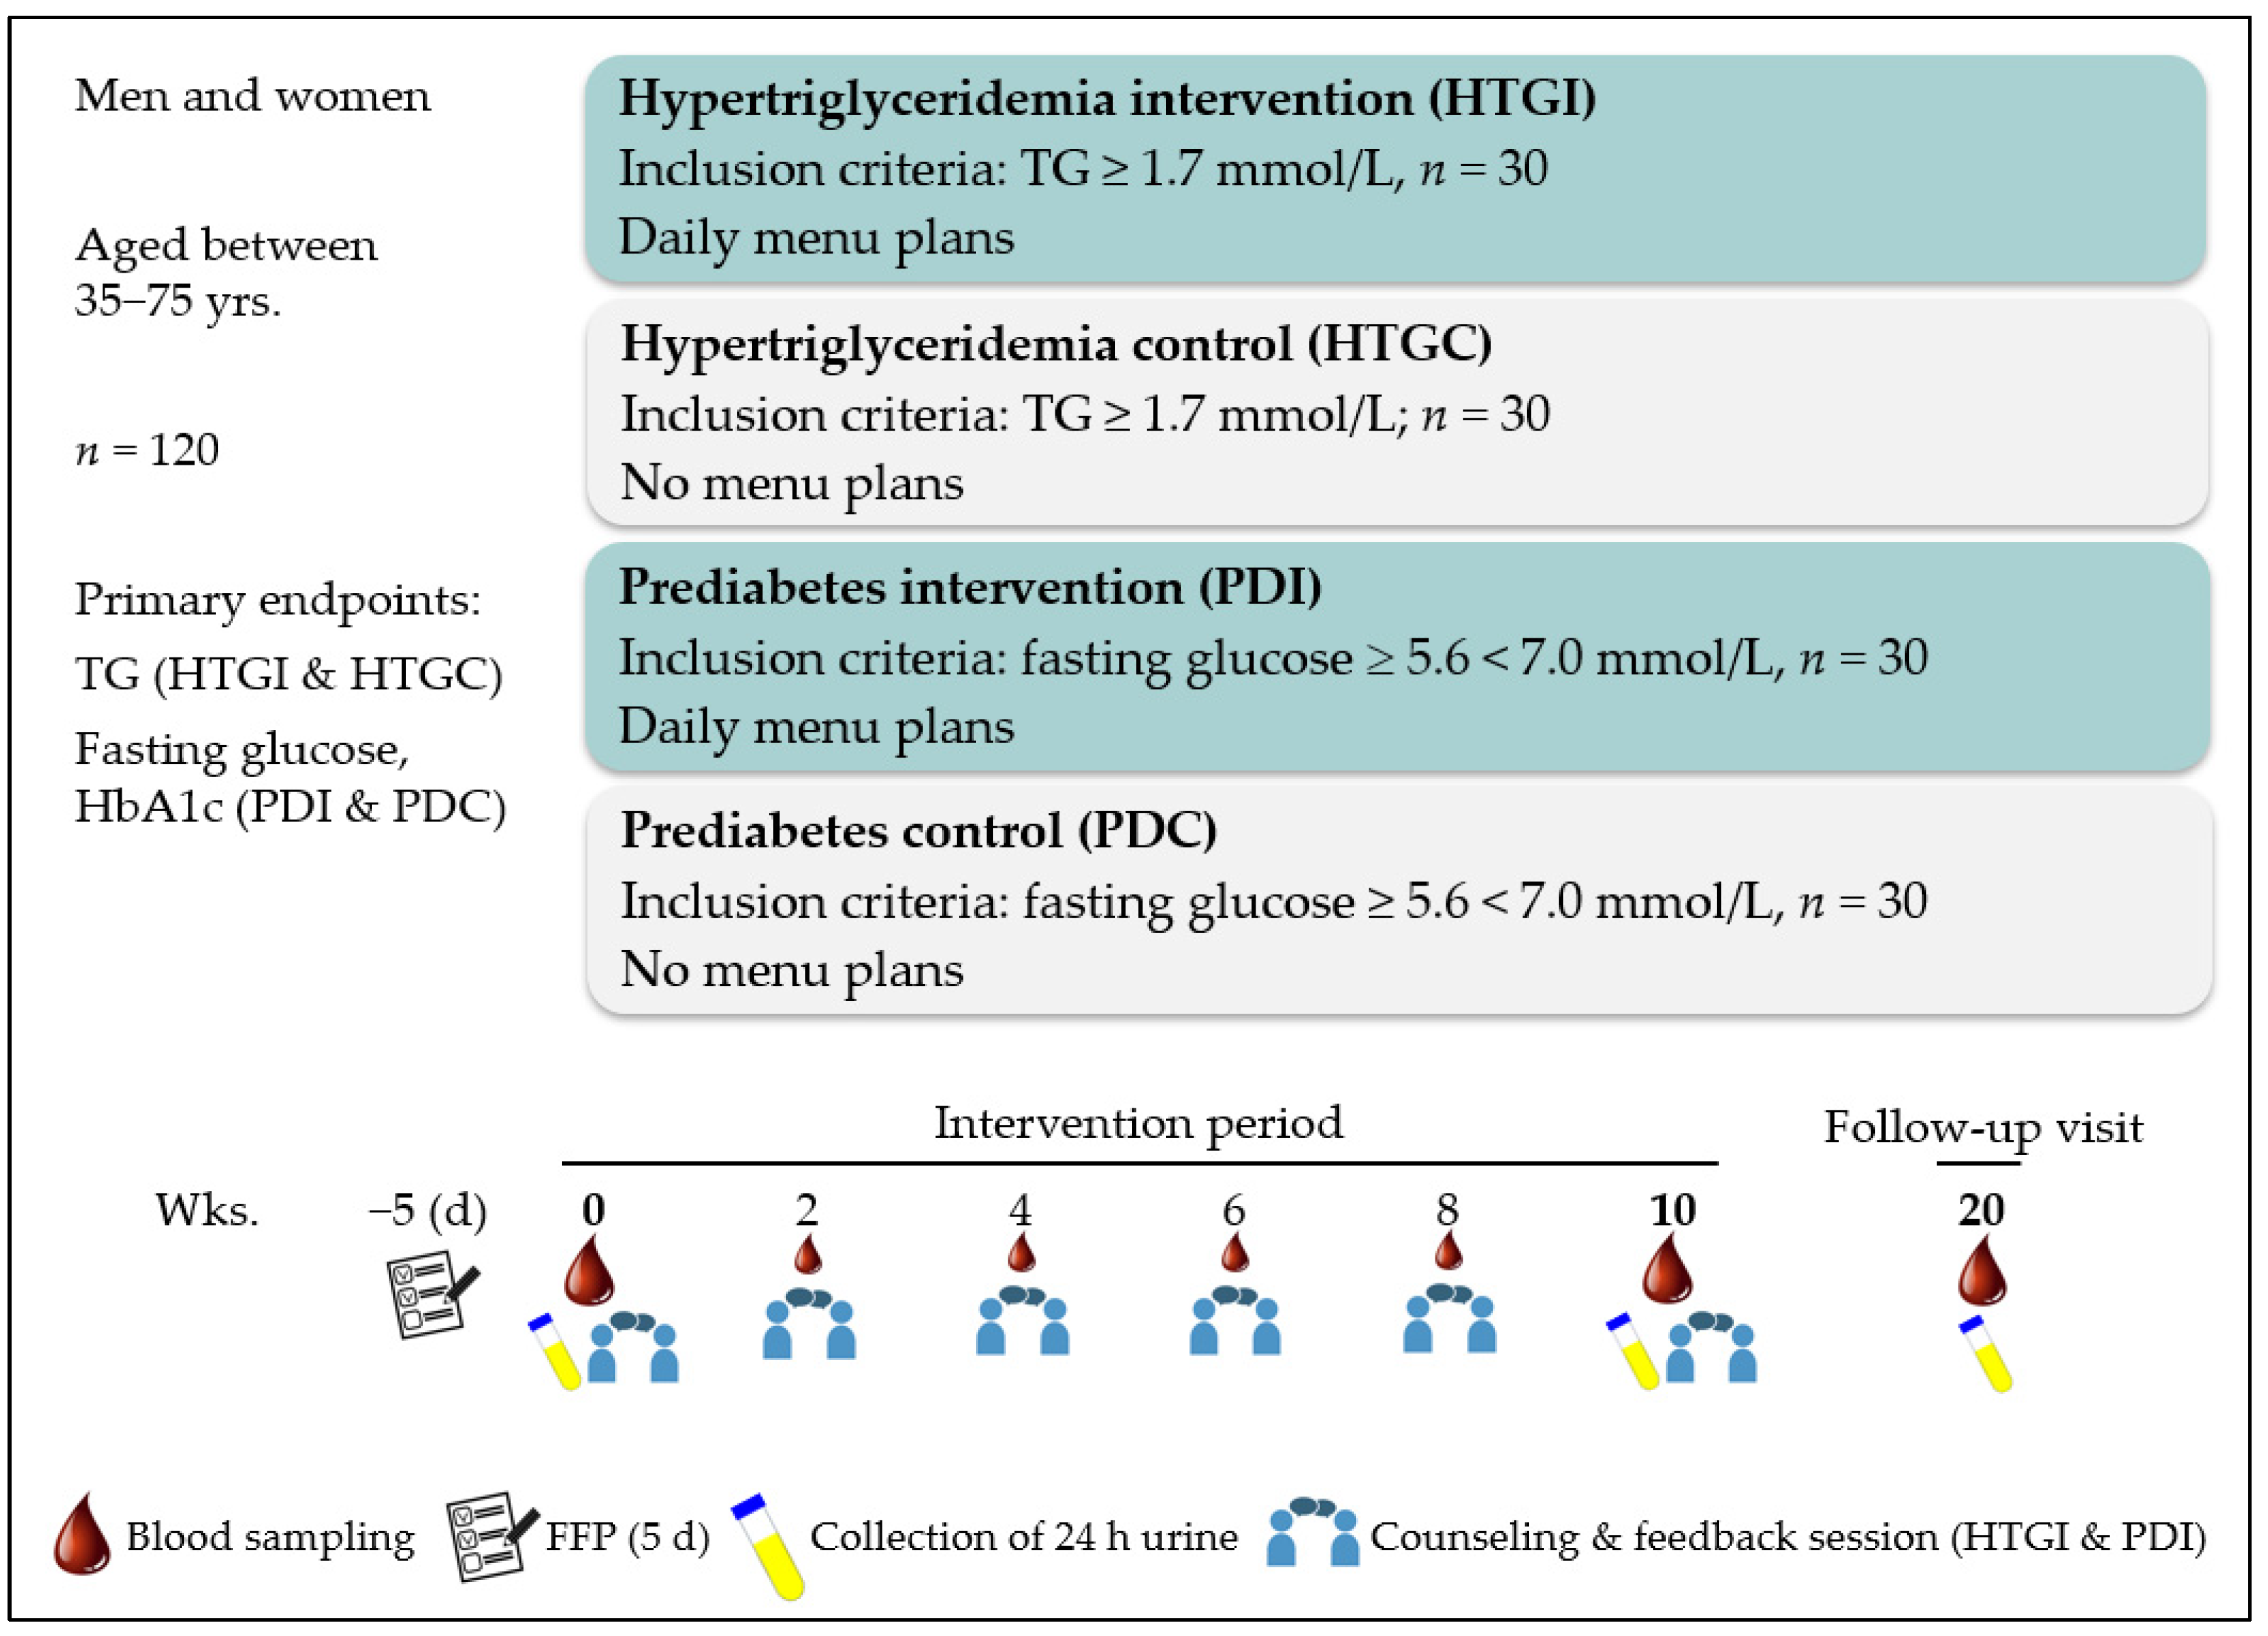
2.1. Study Design
- Consumption of a traditional “Western diet” composed of meat, sausage, dairy products, cereals, vegetables, fruits etc.
- Stable eating habits at least 1 year before enrollment
- No relevant food allergies (e.g., milk, nuts etc.)
- No antihypertensive medication or stable dose for >3 months prior to the start of the study and during the entire study period
- No acute or chronic diseases which could affect the results of the study
- No systemic glucocorticoids or lipid-lowering medication
- No use of dietary supplements, incl. multivitamins, fish oil capsules, minerals, and trace elements 3 months before and during the entire study period
- No weight loss or weight gain (>3 kg) during the last 3 months before study
- No pregnancy or lactation
2.2. Assessment of Nutritional Habits, Socio-Economic Status and Medication
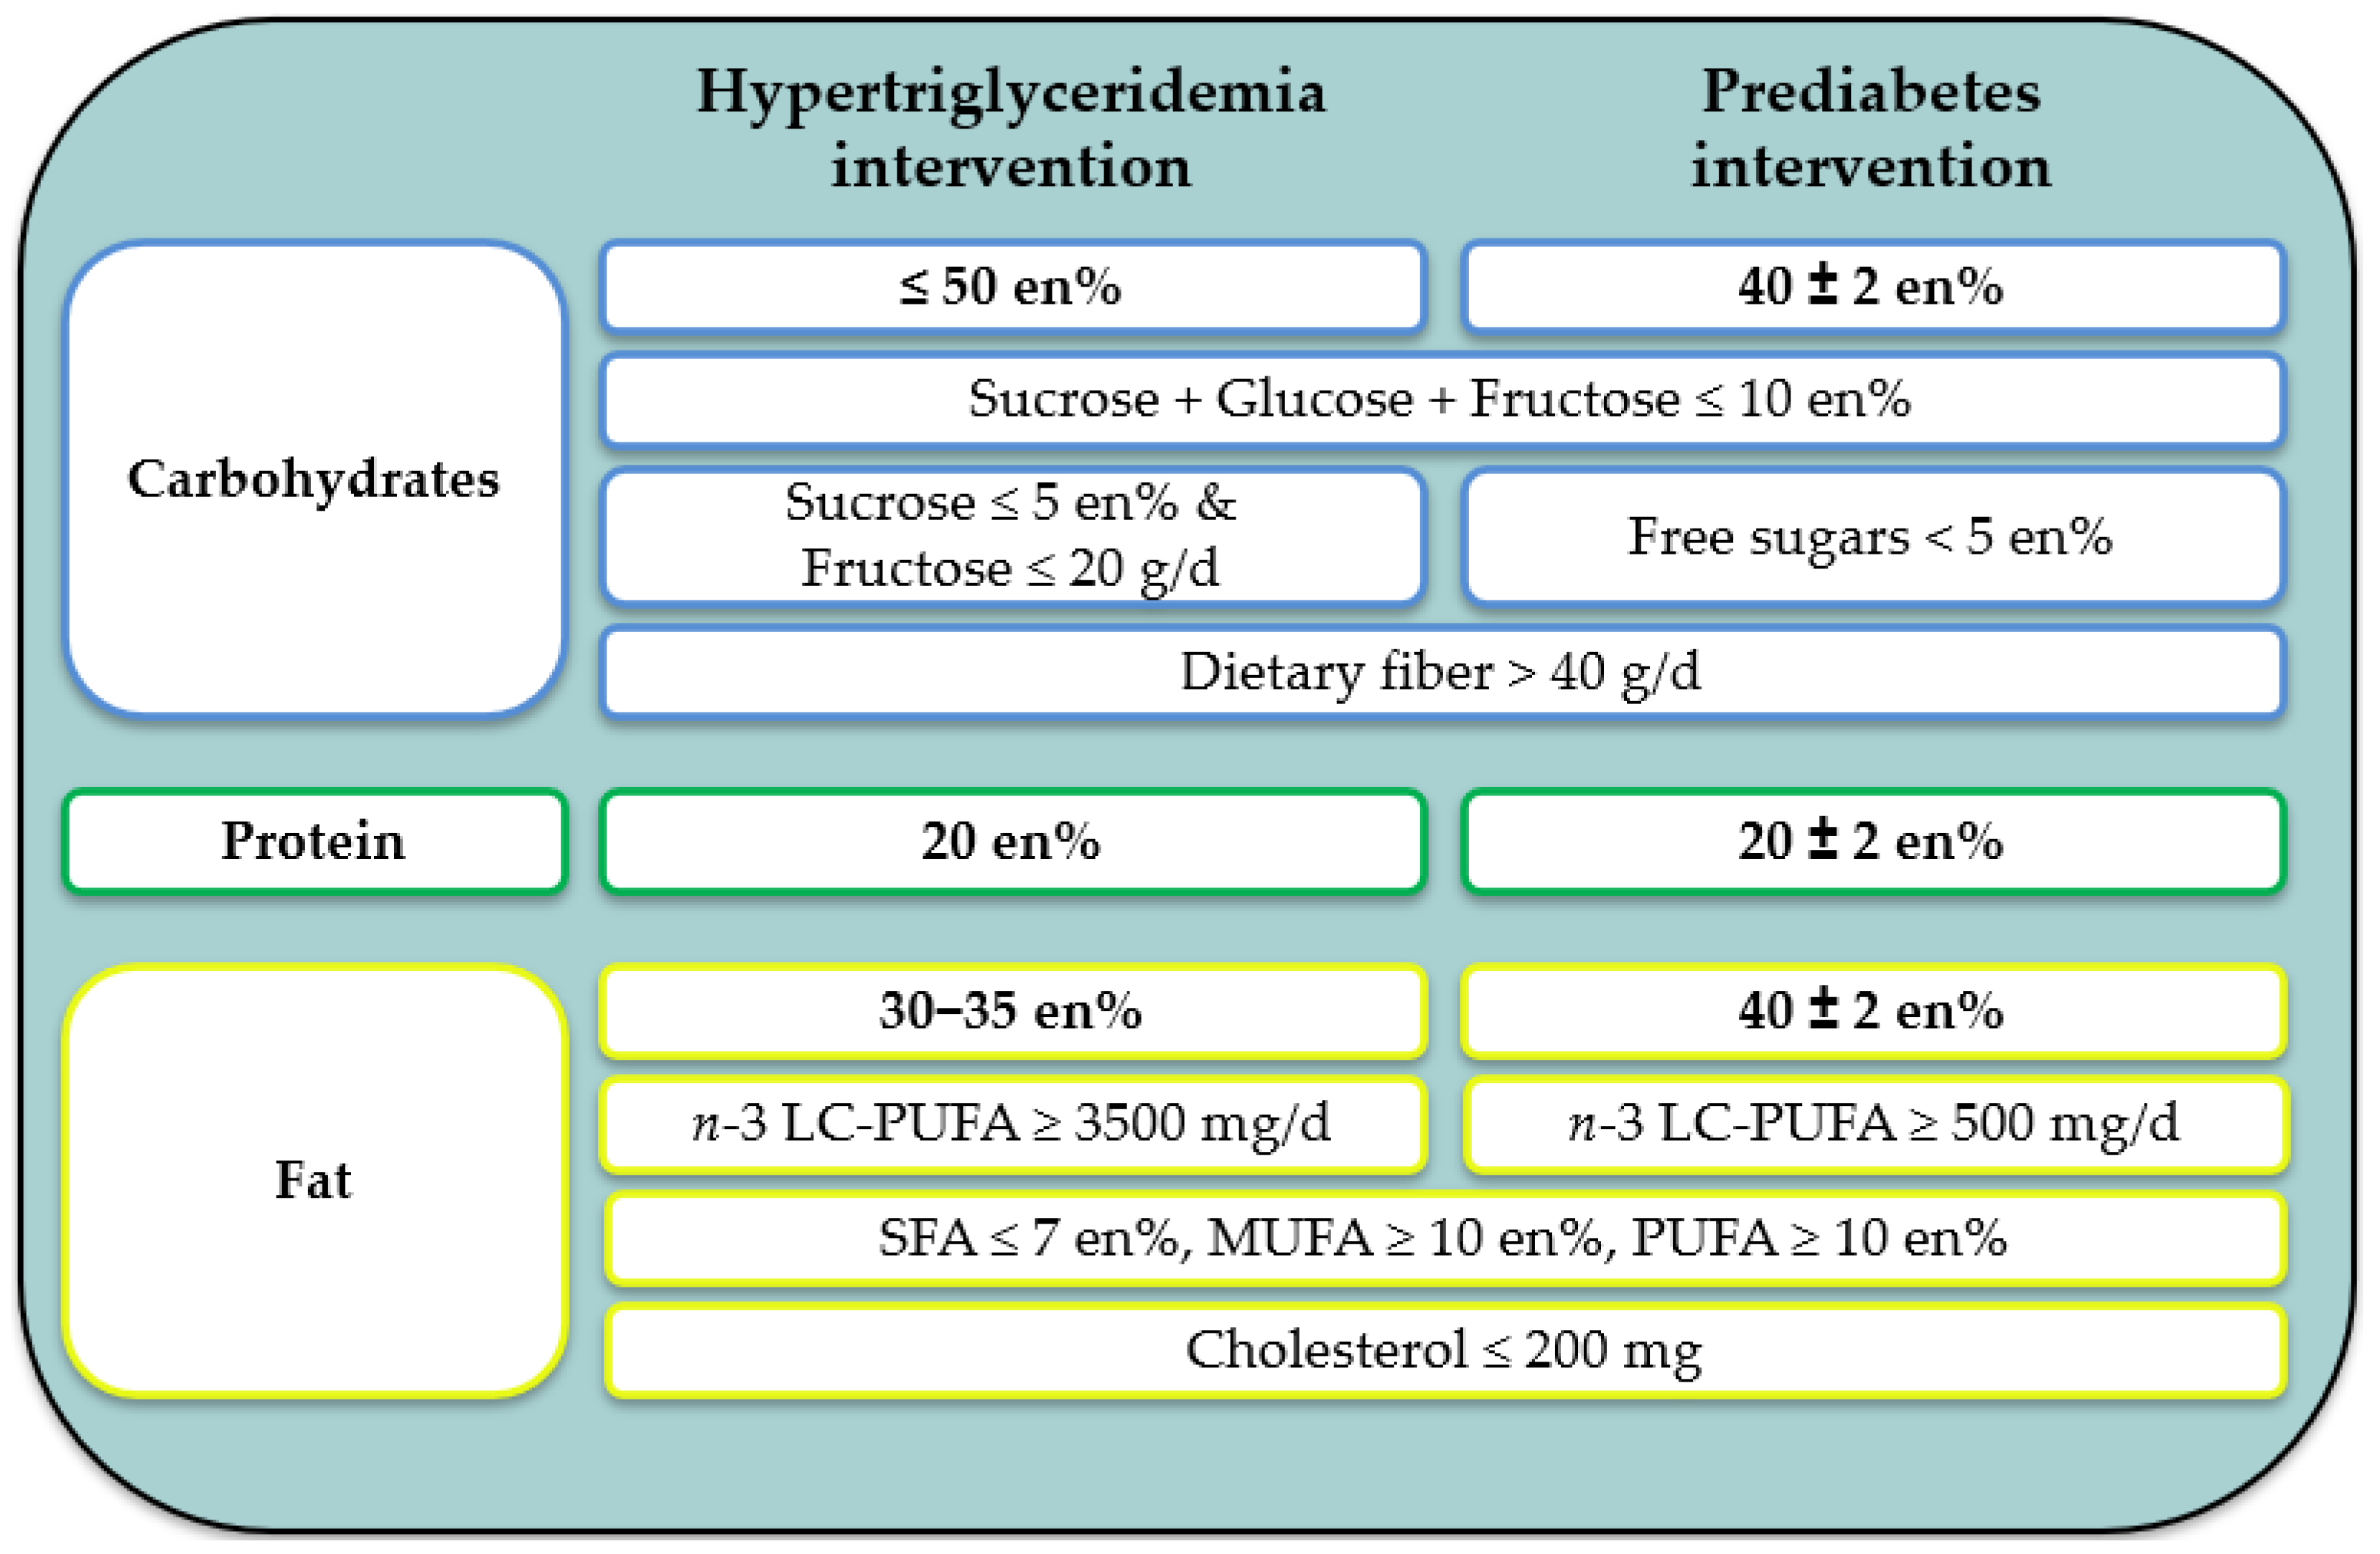
2.3. Study Diet—The MoKaRi II Concept
- Micronutrient intake according to the recommendations of the German Nutrition Society (DGE) (except for vitamin D (which is mainly covered by UVB radiation from sunlight), selenium (as no data on concentrations in food are available in the most recent database used), and iodine (as no iodized salt was specified in the menu plans))
- Reduced intake of salt and absence of alcohol
- Increased consumption of vegetables, fruits, and whole grains
- Reduced consumption of highly processed, calorie-dense, nutrient-poor foods
- Short counselling session on one topic or aspects of a healthy diet (e.g., nuts, berries, legumes, sugar, fats)
- Discussion of the trends of selected study parameters throughout the study (e.g., blood lipids, markers of glucose metabolism)
- Discussion and problem-solving regarding the implementation of the menu plans in everyday life, based on a protocol in which deviations from the menu plans had to be documented. This procedure was also used to verify and ensure the compliance of the subjects.
2.4. Sample Collection, Parameter Analyses and Further Measurements
2.5. Statistical Methods
3. Results
3.1. Subjects
3.2. Nutrient Intake
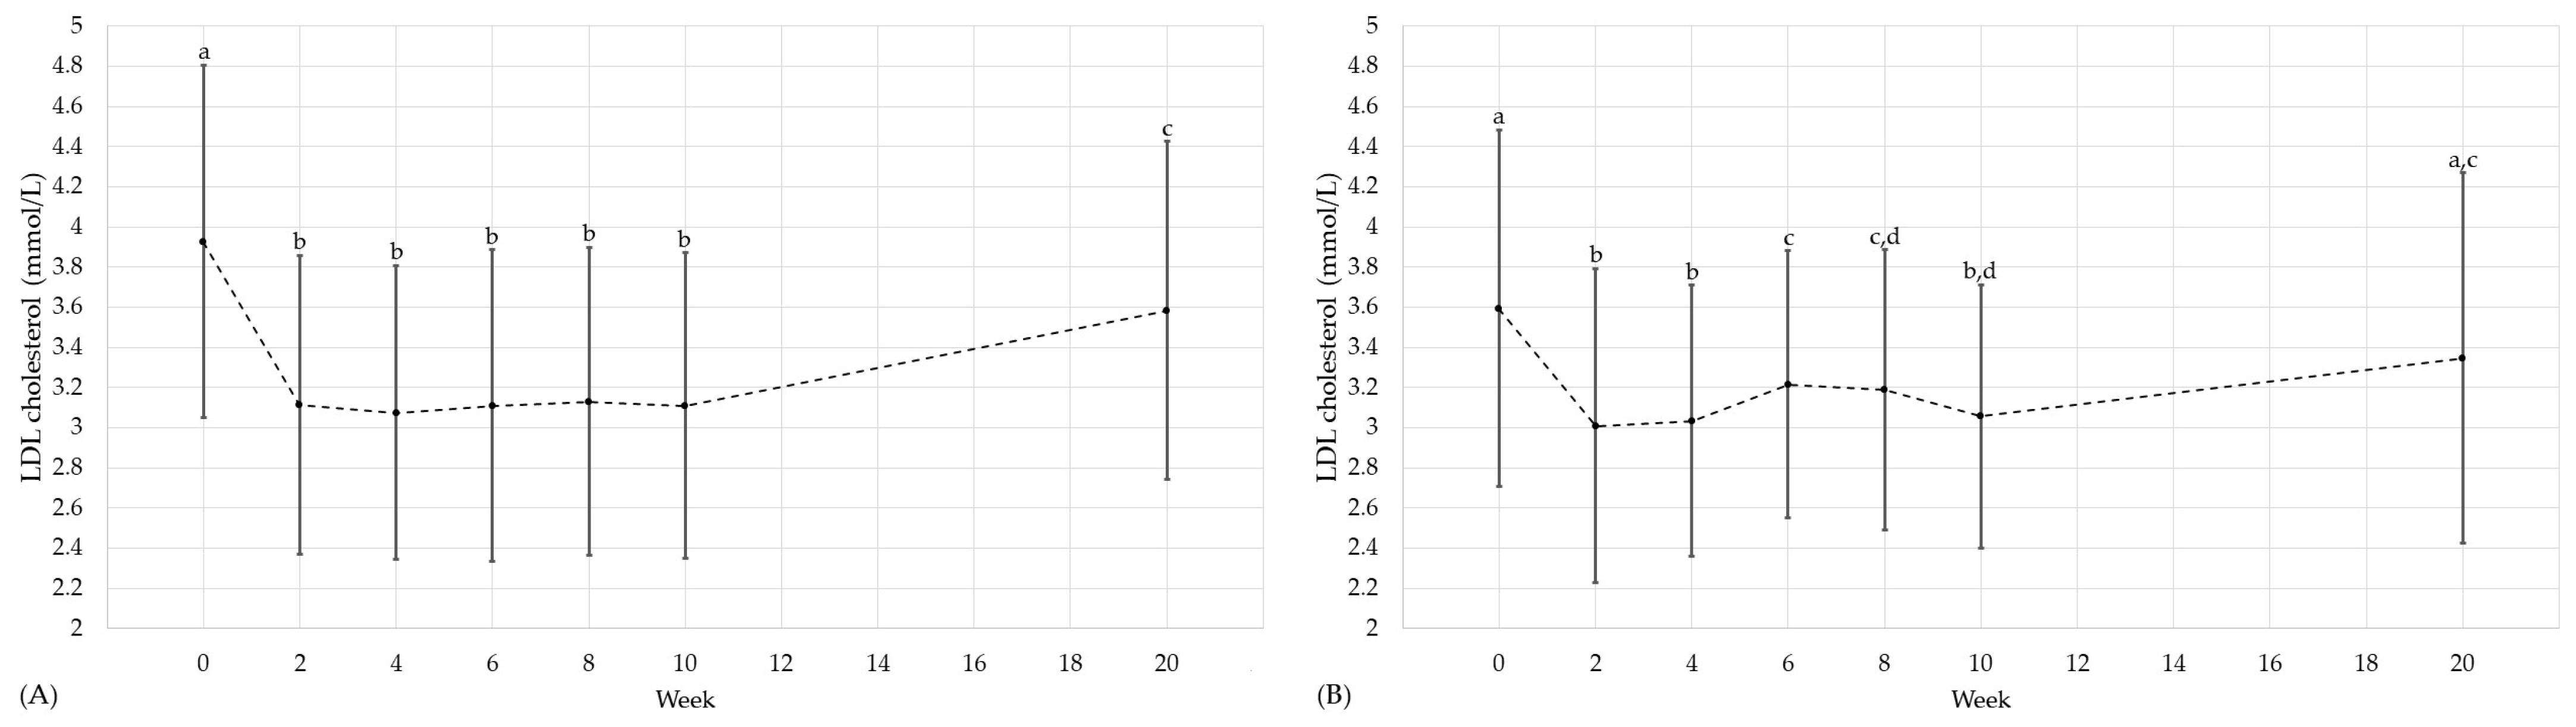
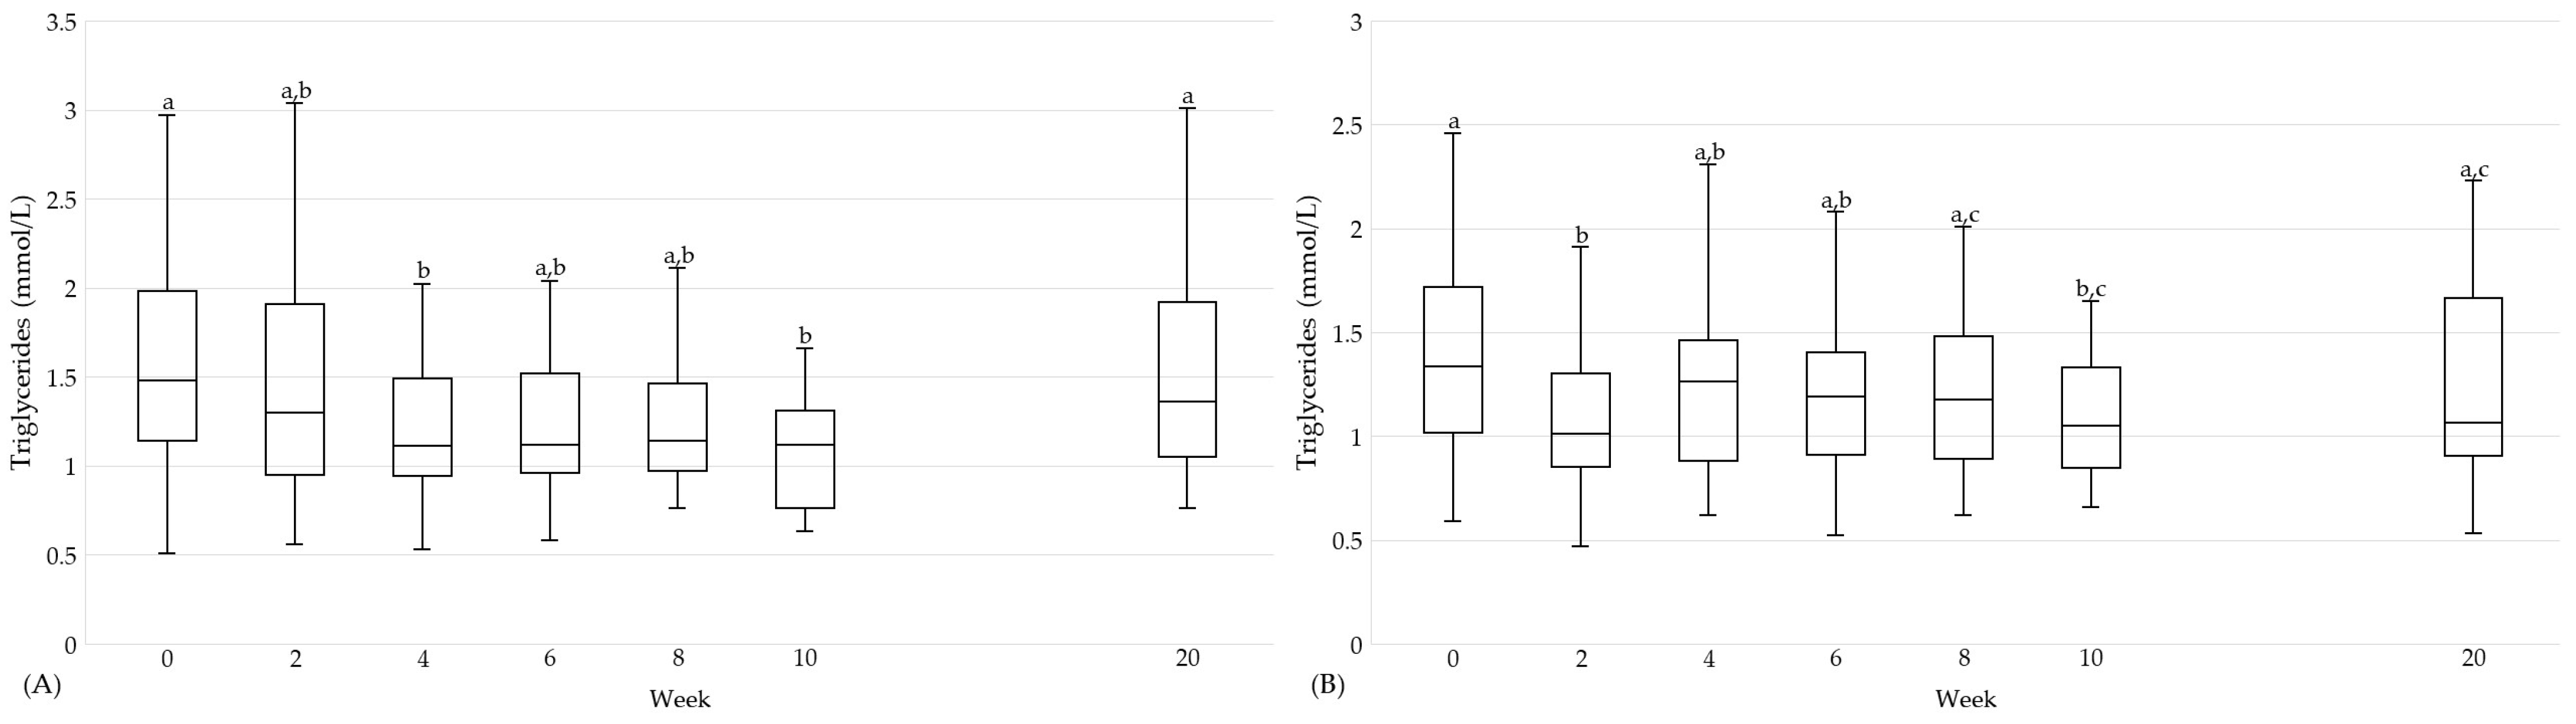
3.3. Cardiovascular and Diabetic Risk Factors
3.4. Nutrient Status
3.5. Fatty Acid Distribution in Erythrocyte Lipids
4. Discussion
4.1. Effects on Cardiovascular and Diabetic Risk Factors
4.2. Effects on Nutrient Status
5. Conclusions
6. Strengths and Limitations
Supplementary Materials
Author Contributions
Funding
Institutional Review Board Statement
Informed Consent Statement
Data Availability Statement
Acknowledgments
Conflicts of Interest
References
- Simha, V. Management of hypertriglyceridemia. BMJ 2020, 371, m3109. [Google Scholar] [CrossRef] [PubMed]
- Parhofer, K.G.; Laufs, U. The Diagnosis and Treatment of Hypertriglyceridemia. Dtsch. Arztebl. Int. 2019, 116, 825–832. [Google Scholar] [CrossRef]
- Ruiz-García, A.; Arranz-Martínez, E.; López-Uriarte, B.; Rivera-Teijido, M.; Palacios-Martínez, D.; Dávila-Blázquez, G.M.; Rosillo-González, A.; González-Posada Delgado, J.A.; Mariño-Suárez, J.E.; Revilla-Pascual, E.; et al. Prevalencia de hipertrigliceridemia en adultos y factores cardiometabólicos asociados. Estudio SIMETAP-HTG. Clin. Investig. Arterioscler. 2020, 32, 242–255. [Google Scholar] [CrossRef]
- Fan, W.; Philip, S.; Granowitz, C.; Toth, P.P.; Wong, N.D. Prevalence of US Adults with Triglycerides ≥150 mg/dL: NHANES 2007–2014. Cardiol. Ther. 2020, 9, 207–213. [Google Scholar] [CrossRef]
- Karpov, Y.; Khomitskaya, Y. PROMETHEUS: An observational, cross-sectional, retrospective study of hypertriglyceridemia in Russia. Cardiovasc. Diabetol. 2015, 14, 115. [Google Scholar] [CrossRef] [PubMed]
- Sakboonyarat, B.; Poovieng, J.; Jongcherdchootrakul, K.; Srisawat, P.; Hatthachote, P.; Mungthin, M.; Rangsin, R. Prevalence of hypertriglyceridemia among Royal Thai Army personnel and its related cardiometabolic risk factors, from 2017 to 2021. BMC Public Health 2022, 22, 1569. [Google Scholar] [CrossRef] [PubMed]
- Berglund, L.; Brunzell, J.D.; Goldberg, A.C.; Goldberg, I.J.; Sacks, F.; Murad, M.H.; Stalenhoef, A.F.H. Evaluation and treatment of hypertriglyceridemia: An Endocrine Society clinical practice guideline. J. Clin. Endocrinol. Metab. 2012, 97, 2969–2989. [Google Scholar] [CrossRef]
- Miller, M.; Stone, N.J.; Ballantyne, C.; Bittner, V.; Criqui, M.H.; Ginsberg, H.N.; Goldberg, A.C.; Howard, W.J.; Jacobson, M.S.; Kris-Etherton, P.M.; et al. Triglycerides and cardiovascular disease: A scientific statement from the American Heart Association. Circulation 2011, 123, 2292–2333. [Google Scholar] [CrossRef]
- Schienkiewitz, A.; Kuhnert, R.; Blume, M.; Mensink, G.B.M. Overweight and obesity among adults in Germany—Results from GEDA 2019/2020-EHIS. J. Health Monit. 2022, 7, 21–28. [Google Scholar] [CrossRef]
- Saklayen, M.G. The Global Epidemic of the Metabolic Syndrome. Curr. Hypertens. Rep. 2018, 20, 12. [Google Scholar] [CrossRef]
- Deutsche Diabetes Gesellschaft; Diabetesde—Deutsche Diabetes-Hilfe. Deutscher Gesundheitsbericht Diabetes 2023. Available online: https://www.ddg.info/fileadmin/user_upload/Gesundheitsbericht_2023_gesamt_offene_Datei.pdf (accessed on 5 February 2024).
- Karanchi, H.; Muppidi, V.; Wyne, K. Hypertriglyceridemia. Available online: https://www.ncbi.nlm.nih.gov/books/NBK459368/ (accessed on 5 February 2024).
- Jacobson, T.A.; Maki, K.C.; Orringer, C.E.; Jones, P.H.; Kris-Etherton, P.; Sikand, G.; La Forge, R.; Daniels, S.R.; Wilson, D.P.; Morris, P.B.; et al. National Lipid Association Recommendations for Patient-Centered Management of Dyslipidemia: Part 2. J. Clin. Lipidol. 2015, 9, 1–122.e1. [Google Scholar] [CrossRef] [PubMed]
- Custodis, F.; Laufs, U. Hypertriglyceridämie: Prognostische Bedeutung und Therapiemöglichkeiten. Dtsch. Med. Wochenschr. 2011, 136, 1533–1542. [Google Scholar] [CrossRef] [PubMed]
- Deutsche Diabetes Gesellschaft; diabetesDE—Deutsche Diabetes-Hilfe. Deutscher Gesundheitsbericht Diabetes 2022. Available online: https://www.ddg.info/fileadmin/user_upload/Gesundheitsbericht_2022_final.pdf (accessed on 5 February 2024).
- International Diabetes Federation. IDF Diabetes Atlas, 10th ed. Available online: https://diabetesatlas.org/atlas/tenth-edition/ (accessed on 5 February 2024).
- Glovaci, D.; Fan, W.; Wong, N.D. Epidemiology of Diabetes Mellitus and Cardiovascular Disease. Curr. Cardiol. Rep. 2019, 21, 21. [Google Scholar] [CrossRef]
- World Health Organization. Diabetes. Available online: https://www.who.int/news-room/fact-sheets/detail/diabetes (accessed on 5 February 2024).
- Robert Koch-Institut. Diabetes in Deutschland: Bericht der Nationalen Diabetes-Surveillance 2019. Available online: https://edoc.rki.de/handle/176904/6299 (accessed on 5 February 2024).
- Jacobs, E.; Hoyer, A.; Brinks, R.; Kuss, O.; Rathmann, W. Burden of Mortality Attributable to Diagnosed Diabetes: A Nationwide Analysis Based on Claims Data from 65 Million People in Germany. Diabetes Care 2017, 40, 1703–1709. [Google Scholar] [CrossRef] [PubMed]
- Schmidt, C.; Reitzle, L.; Heidemann, C.; Paprott, R.; Ziese, T.; Scheidt-Nave, C.; Baumert, J. Excess mortality in adults with documented diabetes in Germany: Routine data analysis of all insurance claims in Germany 2013–2014. BMJ Open 2021, 11, e041508. [Google Scholar] [CrossRef] [PubMed]
- Schwingshackl, L.; Chaimani, A.; Hoffmann, G.; Schwedhelm, C.; Boeing, H. A network meta-analysis on the comparative efficacy of different dietary approaches on glycaemic control in patients with type 2 diabetes mellitus. Eur. J. Epidemiol. 2018, 33, 157–170. [Google Scholar] [CrossRef] [PubMed]
- Schwingshackl, L.; Hoffmann, G.; Lampousi, A.-M.; Knüppel, S.; Iqbal, K.; Schwedhelm, C.; Bechthold, A.; Schlesinger, S.; Boeing, H. Food groups and risk of type 2 diabetes mellitus: A systematic review and meta-analysis of prospective studies. Eur. J. Epidemiol. 2017, 32, 363–375. [Google Scholar] [CrossRef] [PubMed]
- Uusitupa, M.; Khan, T.A.; Viguiliouk, E.; Kahleova, H.; Rivellese, A.A.; Hermansen, K.; Pfeiffer, A.; Thanopoulou, A.; Salas-Salvadó, J.; Schwab, U.; et al. Prevention of Type 2 Diabetes by Lifestyle Changes: A Systematic Review and Meta-Analysis. Nutrients 2019, 11, 2611. [Google Scholar] [CrossRef] [PubMed]
- Korsmo-Haugen, H.-K.; Brurberg, K.G.; Mann, J.; Aas, A.-M. Carbohydrate quantity in the dietary management of type 2 diabetes: A systematic review and meta-analysis. Diabetes Obes. Metab. 2019, 21, 15–27. [Google Scholar] [CrossRef]
- Sainsbury, E.; Kizirian, N.V.; Partridge, S.R.; Gill, T.; Colagiuri, S.; Gibson, A.A. Effect of dietary carbohydrate restriction on glycemic control in adults with diabetes: A systematic review and meta-analysis. Diabetes Res. Clin. Pract. 2018, 139, 239–252. [Google Scholar] [CrossRef]
- Augustin, L.S.A.; Kendall, C.W.C.; Jenkins, D.J.A.; Willett, W.C.; Astrup, A.; Barclay, A.W.; Björck, I.; Brand-Miller, J.C.; Brighenti, F.; Buyken, A.E.; et al. Glycemic index, glycemic load and glycemic response: An International Scientific Consensus Summit from the International Carbohydrate Quality Consortium (ICQC). Nutr. Metab. Cardiovasc. Dis. 2015, 25, 795–815. [Google Scholar] [CrossRef]
- Lindström, J.; Louheranta, A.; Mannelin, M.; Rastas, M.; Salminen, V.; Eriksson, J.; Uusitupa, M.; Tuomilehto, J. The Finnish Diabetes Prevention Study (DPS): Lifestyle intervention and 3-year results on diet and physical activity. Diabetes Care 2003, 26, 3230–3236. [Google Scholar] [CrossRef] [PubMed]
- Jannasch, F.; Kröger, J.; Schulze, M.B. Dietary Patterns and Type 2 Diabetes: A Systematic Literature Review and Meta-Analysis of Prospective Studies. J. Nutr. 2017, 147, 1174–1182. [Google Scholar] [CrossRef] [PubMed]
- Catapano, A.L.; Graham, I.; de Backer, G.; Wiklund, O.; Chapman, M.J.; Drexel, H.; Hoes, A.W.; Jennings, C.S.; Landmesser, U.; Pedersen, T.R.; et al. 2016 ESC/EAS Guidelines for the Management of Dyslipidaemias. Eur. Heart J. 2016, 37, 2999–3058. [Google Scholar] [CrossRef] [PubMed]
- Schleicher, E.; Gerdes, C.; Petersmann, A.; Müller-Wieland, D.; Müller, U.A.; Freckmann, G.; Heinemann, L.; Nauck, M.; Landgraf, R. Definition, Klassifikation und Diagnostik des Diabetes mellitus: Update 2021. Diabetologie und Stoffwechsel 2021, 16, S110–S118. [Google Scholar] [CrossRef]
- Bligh, E.G.; Dyer, W.J. A rapid method of total lipid extraction and purification. Can. J. Biochem. Physiol. 1959, 37, 911–917. [Google Scholar] [CrossRef] [PubMed]
- Folch, J.; Lees, M.; Sloane Stanley, G.H. A simple method for the isolation and purification of total lipides from animal tissues. J. Biol. Chem. 1957, 226, 497–509. [Google Scholar] [CrossRef] [PubMed]
- Degen, C.; Ecker, J.; Piegholdt, S.; Liebisch, G.; Schmitz, G.; Jahreis, G. Metabolic and growth inhibitory effects of conjugated fatty acids in the cell line HT-29 with special regard to the conversion of t11,t13-CLA. Biochim. Biophys. Acta 2011, 1811, 1070–1080. [Google Scholar] [CrossRef] [PubMed]
- Lee, Y.-M.; Kim, S.-A.; Lee, I.-K.; Kim, J.-G.; Park, K.-G.; Jeong, J.-Y.; Jeon, J.-H.; Shin, J.-Y.; Lee, D.-H. Effect of a Brown Rice Based Vegan Diet and Conventional Diabetic Diet on Glycemic Control of Patients with Type 2 Diabetes: A 12-Week Randomized Clinical Trial. PLoS ONE 2016, 11, e0155918. [Google Scholar] [CrossRef]
- Bays, H.E.; Ballantyne, C.M.; Kastelein, J.J.; Isaacsohn, J.L.; Braeckman, R.A.; Soni, P.N. Eicosapentaenoic acid ethyl ester (AMR101) therapy in patients with very high triglyceride levels (from the Multi-center, plAcebo-controlled, Randomized, double-blINd, 12-week study with an open-label Extension MARINE trial). Am. J. Cardiol. 2011, 108, 682–690. [Google Scholar] [CrossRef]
- Benjamini, Y.; Hochberg, Y. Controlling the False Discovery Rate: A Practical and Powerful Approach to Multiple Testing. J. R. Stat. Soc. Ser. B (Methodol.) 1995, 57, 289–300. [Google Scholar] [CrossRef]
- Packard, C.J.; Boren, J.; Taskinen, M.-R. Causes and Consequences of Hypertriglyceridemia. Front. Endocrinol. 2020, 11, 252. [Google Scholar] [CrossRef] [PubMed]
- Biesalski, H.K.; Bischoff, S.C.; Pirlich, M.; Weimann, A. Ernährungsmedizin, 5. vollständig überarbeitete und erweiterte Auflage; Georg Thieme Verlag: Stuttgart, Germany, 2018; p. 533. [Google Scholar]
- Parks, E.J.; Hellerstein, M.K. Carbohydrate-induced hypertriacylglycerolemia: Historical perspective and review of biological mechanisms. Am. J. Clin. Nutr. 2000, 71, 412–433. [Google Scholar] [CrossRef]
- Martínez-González, M.A.; Fernandez-Lazaro, C.I.; Toledo, E.; Díaz-López, A.; Corella, D.; Goday, A.; Romaguera, D.; Vioque, J.; Alonso-Gómez, Á.M.; Wärnberg, J.; et al. Carbohydrate quality changes and concurrent changes in cardiovascular risk factors: A longitudinal analysis in the PREDIMED-Plus randomized trial. Am. J. Clin. Nutr. 2020, 111, 291–306. [Google Scholar] [CrossRef]
- Levitan, E.B.; Cook, N.R.; Stampfer, M.J.; Ridker, P.M.; Rexrode, K.M.; Buring, J.E.; Manson, J.E.; Liu, S. Dietary glycemic index, dietary glycemic load, blood lipids, and C-reactive protein. Metabolism 2008, 57, 437–443. [Google Scholar] [CrossRef] [PubMed]
- Hannon, B.A.; Thompson, S.V.; Edwards, C.G.; Skinner, S.K.; Niemiro, G.M.; Burd, N.A.; Holscher, H.D.; Teran-Garcia, M.; Khan, N.A. Dietary Fiber Is Independently Related to Blood Triglycerides Among Adults with Overweight and Obesity. Curr. Dev. Nutr. 2019, 3, nzy094. [Google Scholar] [CrossRef]
- Archer, W.R.; Lamarche, B.; Dériaz, O.; Landry, N.; Corneau, L.; Després, J.-P.; Bergeron, J.; Couture, P.; Bergeron, N. Variations in body composition and plasma lipids in response to a high-carbohydrate diet. Obes. Res. 2003, 11, 978–986. [Google Scholar] [CrossRef] [PubMed]
- Rajaie, S.; Azadbakht, L.; Khazaei, M.; Sherbafchi, M.; Esmaillzadeh, A. Moderate replacement of carbohydrates by dietary fats affects features of metabolic syndrome: A randomized crossover clinical trial. Nutrition 2014, 30, 61–68. [Google Scholar] [CrossRef]
- Volk, B.M.; Kunces, L.J.; Freidenreich, D.J.; Kupchak, B.R.; Saenz, C.; Artistizabal, J.C.; Fernandez, M.L.; Bruno, R.S.; Maresh, C.M.; Kraemer, W.J.; et al. Effects of step-wise increases in dietary carbohydrate on circulating saturated Fatty acids and palmitoleic Acid in adults with metabolic syndrome. PLoS ONE 2014, 9, e113605. [Google Scholar] [CrossRef]
- Shin, M.-J.; Blanche, P.J.; Rawlings, R.S.; Fernstrom, H.S.; Krauss, R.M. Increased plasma concentrations of lipoprotein(a) during a low-fat, high-carbohydrate diet are associated with increased plasma concentrations of apolipoprotein C-III bound to apolipoprotein B-containing lipoproteins. Am. J. Clin. Nutr. 2007, 85, 1527–1532. [Google Scholar] [CrossRef]
- Appel, L.J.; Sacks, F.M.; Carey, V.J.; Obarzanek, E.; Swain, J.F.; Miller, E.R.; Conlin, P.R.; Erlinger, T.P.; Rosner, B.A.; Laranjo, N.M.; et al. Effects of protein, monounsaturated fat, and carbohydrate intake on blood pressure and serum lipids: Results of the OmniHeart randomized trial. JAMA 2005, 294, 2455–2464. [Google Scholar] [CrossRef] [PubMed]
- Chiu, S.; Bergeron, N.; Williams, P.T.; Bray, G.A.; Sutherland, B.; Krauss, R.M. Comparison of the DASH (Dietary Approaches to Stop Hypertension) diet and a higher-fat DASH diet on blood pressure and lipids and lipoproteins: A randomized controlled trial. Am. J. Clin. Nutr. 2016, 103, 341–347. [Google Scholar] [CrossRef] [PubMed]
- Schwingshackl, L.; Hoffmann, G. Comparison of effects of long-term low-fat vs high-fat diets on blood lipid levels in overweight or obese patients: A systematic review and meta-analysis. J. Acad. Nutr. Diet. 2013, 113, 1640–1661. [Google Scholar] [CrossRef] [PubMed]
- Cao, Y.; Mauger, D.T.; Pelkman, C.L.; Zhao, G.; Townsend, S.M.; Kris-Etherton, P.M. Effects of moderate (MF) versus lower fat (LF) diets on lipids and lipoproteins: A meta-analysis of clinical trials in subjects with and without diabetes. J. Clin. Lipidol. 2009, 3, 19–32. [Google Scholar] [CrossRef] [PubMed]
- Thorning, T.K.; Raziani, F.; Bendsen, N.T.; Astrup, A.; Tholstrup, T.; Raben, A. Diets with high-fat cheese, high-fat meat, or carbohydrate on cardiovascular risk markers in overweight postmenopausal women: A randomized crossover trial. Am. J. Clin. Nutr. 2015, 102, 573–581. [Google Scholar] [CrossRef]
- Zheng, C.; Khoo, C.; Furtado, J.; Ikewaki, K.; Sacks, F.M. Dietary monounsaturated fat activates metabolic pathways for triglyceride-rich lipoproteins that involve apolipoproteins E and C-III. Am. J. Clin. Nutr. 2008, 88, 272–281. [Google Scholar] [CrossRef]
- Elhayany, A.; Lustman, A.; Abel, R.; Attal-Singer, J.; Vinker, S. A low carbohydrate Mediterranean diet improves cardiovascular risk factors and diabetes control among overweight patients with type 2 diabetes mellitus: A 1-year prospective randomized intervention study. Diabetes Obes. Metab. 2010, 12, 204–209. [Google Scholar] [CrossRef]
- Skytte, M.J.; Samkani, A.; Petersen, A.D.; Thomsen, M.N.; Astrup, A.; Chabanova, E.; Frystyk, J.; Holst, J.J.; Thomsen, H.S.; Madsbad, S.; et al. A carbohydrate-reduced high-protein diet improves HbA1c and liver fat content in weight stable participants with type 2 diabetes: A randomised controlled trial. Diabetologia 2019, 62, 2066–2078. [Google Scholar] [CrossRef]
- Brunerova, L.; Smejkalova, V.; Potockova, J.; Andel, M. A comparison of the influence of a high-fat diet enriched in monounsaturated fatty acids and conventional diet on weight loss and metabolic parameters in obese non-diabetic and Type 2 diabetic patients. Diabet. Med. 2007, 24, 533–540. [Google Scholar] [CrossRef]
- Beavers, D.P.; Beavers, K.M.; Lyles, M.F.; Nicklas, B.J. Cardiometabolic risk after weight loss and subsequent weight regain in overweight and obese postmenopausal women. J. Gerontol. A Biol. Sci. Med. Sci. 2013, 68, 691–698. [Google Scholar] [CrossRef]
- Grimsgaard, S.; Bonaa, K.H.; Hansen, J.B.; Nordøy, A. Highly purified eicosapentaenoic acid and docosahexaenoic acid in humans have similar triacylglycerol-lowering effects but divergent effects on serum fatty acids. Am. J. Clin. Nutr. 1997, 66, 649–659. [Google Scholar] [CrossRef]
- Mori, T.A.; Burke, V.; Puddey, I.B.; Watts, G.F.; O’Neal, D.N.; Best, J.D.; Beilin, L.J. Purified eicosapentaenoic and docosahexaenoic acids have differential effects on serum lipids and lipoproteins, LDL particle size, glucose, and insulin in mildly hyperlipidemic men. Am. J. Clin. Nutr. 2000, 71, 1085–1094. [Google Scholar] [CrossRef]
- Nestel, P.; Shige, H.; Pomeroy, S.; Cehun, M.; Abbey, M.; Raederstorff, D. The n-3 fatty acids eicosapentaenoic acid and docosahexaenoic acid increase systemic arterial compliance in humans. Am. J. Clin. Nutr. 2002, 76, 326–330. [Google Scholar] [CrossRef] [PubMed]
- Zhou, Q.; Zhang, Z.; Wang, P.; Zhang, B.; Chen, C.; Zhang, C.; Su, Y. EPA+DHA, but not ALA, Improved Lipids and Inflammation Status in Hypercholesterolemic Adults: A Randomized, Double-Blind, Placebo-Controlled Trial. Mol. Nutr. Food Res. 2019, 63, e1801157. [Google Scholar] [CrossRef]
- Woodman, R.J.; Mori, T.A.; Burke, V.; Puddey, I.B.; Watts, G.F.; Beilin, L.J. Effects of purified eicosapentaenoic and docosahexaenoic acids on glycemic control, blood pressure, and serum lipids in type 2 diabetic patients with treated hypertension. Am. J. Clin. Nutr. 2002, 76, 1007–1015. [Google Scholar] [CrossRef]
- Bays, H.E.; Tighe, A.P.; Sadovsky, R.; Davidson, M.H. Prescription omega-3 fatty acids and their lipid effects: Physiologic mechanisms of action and clinical implications. Expert Rev. Cardiovasc. Ther. 2008, 6, 391–409. [Google Scholar] [CrossRef] [PubMed]
- Siri-Tarino, P.W.; Sun, Q.; Hu, F.B.; Krauss, R.M. Saturated fatty acids and risk of coronary heart disease: Modulation by replacement nutrients. Curr. Atheroscler. Rep. 2010, 12, 384–390. [Google Scholar] [CrossRef] [PubMed]
- Calder, P.C. Functional Roles of Fatty Acids and Their Effects on Human Health. J. Parenter. Enter. Nutr. 2015, 39, 18S–32S. [Google Scholar] [CrossRef]
- Clifton, P.M. Diet, exercise and weight loss and dyslipidaemia. Pathology 2019, 51, 222–226. [Google Scholar] [CrossRef]
- Wolfram, G.; Bechthold, A.; Boeing, H.; Ellinger, S.; Hauner, H.; Kroke, A.; Leschik-Bonnet, E.; Linseisen, J.; Lorkowski, S.; Schulze, M.; et al. Evidence-Based Guideline of the German Nutrition Society: Fat Intake and Prevention of Selected Nutrition-Related Diseases. Ann. Nutr. Metab. 2015, 67, 141–204. [Google Scholar] [CrossRef]
- Jia, L.; Betters, J.L.; Yu, L. Niemann-pick C1-like 1 (NPC1L1) protein in intestinal and hepatic cholesterol transport. Annu. Rev. Physiol. 2011, 73, 239–259. [Google Scholar] [CrossRef] [PubMed]
- Hollænder, P.L.B.; Ross, A.B.; Kristensen, M. Whole-grain and blood lipid changes in apparently healthy adults: A systematic review and meta-analysis of randomized controlled studies. Am. J. Clin. Nutr. 2015, 102, 556–572. [Google Scholar] [CrossRef] [PubMed]
- Brown, L.; Rosner, B.; Willett, W.W.; Sacks, F.M. Cholesterol-lowering effects of dietary fiber: A meta-analysis. Am. J. Clin. Nutr. 1999, 69, 30–42. [Google Scholar] [CrossRef] [PubMed]
- Hallfrisch, J.; Facn; Behall, K.M. Mechanisms of the effects of grains on insulin and glucose responses. J. Am. Coll. Nutr. 2000, 19, 320–325. [Google Scholar] [CrossRef] [PubMed]
- Fuller, S.; Beck, E.; Salman, H.; Tapsell, L. New Horizons for the Study of Dietary Fiber and Health: A Review. Plant Foods Hum. Nutr. 2016, 71, 1–12. [Google Scholar] [CrossRef]
- Sun, Y.; Neelakantan, N.; Wu, Y.; Lote-Oke, R.; Pan, A.; Dam, R.M. van. Palm Oil Consumption Increases LDL Cholesterol Compared with Vegetable Oils Low in Saturated Fat in a Meta-Analysis of Clinical Trials. J. Nutr. 2015, 145, 1549–1558. [Google Scholar] [CrossRef] [PubMed]
- Schoeneck, M.; Iggman, D. The effects of foods on LDL cholesterol levels: A systematic review of the accumulated evidence from systematic reviews and meta-analyses of randomized controlled trials. Nutr. Metab. Cardiovasc. Dis. 2021, 31, 1325–1338. [Google Scholar] [CrossRef] [PubMed]
- Xie, Y.; Gou, L.; Peng, M.; Zheng, J.; Chen, L. Effects of soluble fiber supplementation on glycemic control in adults with type 2 diabetes mellitus: A systematic review and meta-analysis of randomized controlled trials. Clin. Nutr. 2021, 40, 1800–1810. [Google Scholar] [CrossRef]
- Reynolds, A.N.; Akerman, A.P.; Mann, J. Dietary fibre and whole grains in diabetes management: Systematic review and meta-analyses. PLoS Med. 2020, 17, e1003053. [Google Scholar] [CrossRef]
- Dattilo, A.M.; Kris-Etherton, P.M. Effects of weight reduction on blood lipids and lipoproteins: A meta-analysis. Am. J. Clin. Nutr. 1992, 56, 320–328. [Google Scholar] [CrossRef]
- de Pergola, G.; Zupo, R.; Lampignano, L.; Bonfiglio, C.; Giannelli, G.; Osella, A.R.; Triggiani, V. Higher Body Mass Index, Uric Acid Levels, and Lower Cholesterol Levels are Associated with Greater Weight Loss. Endocr. Metab. Immune Disord. Drug Targets 2020, 20, 1268–1281. [Google Scholar] [CrossRef] [PubMed]
- Sönnichsen, A.C.; Richter, W.O.; Schwandt, P. Benefit from hypocaloric diet in obese men depends on the extent of weight-loss regarding cholesterol, and on a simultaneous change in body fat distribution regarding insulin sensitivity and glucose tolerance. Metabolism 1992, 41, 1035–1039. [Google Scholar] [CrossRef] [PubMed]
- Liu, X.-C.; He, G.-D.; Lo, K.; Huang, Y.-Q.; Feng, Y.-Q. The Triglyceride-Glucose Index, an Insulin Resistance Marker, Was Non-linear Associated with All-Cause and Cardiovascular Mortality in the General Population. Front. Cardiovasc. Med. 2020, 7, 628109. [Google Scholar] [CrossRef] [PubMed]
- Tao, L.-C.; Xu, J.-N.; Wang, T.-T.; Hua, F.; Li, J.-J. Triglyceride-glucose index as a marker in cardiovascular diseases: Landscape and limitations. Cardiovasc. Diabetol. 2022, 21, 68. [Google Scholar] [CrossRef]
- Araújo, S.P.; Juvanhol, L.L.; Bressan, J.; Hermsdorff, H.H.M. Triglyceride glucose index: A new biomarker in predicting cardiovascular risk. Prev. Med. Rep. 2022, 29, 101941. [Google Scholar] [CrossRef] [PubMed]
- Lopez-Jaramillo, P.; Gomez-Arbelaez, D.; Martinez-Bello, D.; Abat, M.E.M.; Alhabib, K.F.; Avezum, Á.; Barbarash, O.; Chifamba, J.; Diaz, M.L.; Gulec, S.; et al. Association of the triglyceride glucose index as a measure of insulin resistance with mortality and cardiovascular disease in populations from five continents (PURE study): A prospective cohort study. Lancet Healthy Longev. 2023, 4, e23–e33. [Google Scholar] [CrossRef] [PubMed]
- Xu, L.; Wu, M.; Chen, S.; Yang, Y.; Wang, Y.; Wu, S.; Tian, Y. Triglyceride-glucose index associates with incident heart failure: A cohort study. Diabetes Metab. 2022, 48, 101365. [Google Scholar] [CrossRef]
- Wang, X.; Xu, W.; Song, Q.; Zhao, Z.; Meng, X.; Xia, C.; Xie, Y.; Yang, C.; Jin, P.; Wang, F. Association between the triglyceride-glucose index and severity of coronary artery disease. Cardiovasc. Diabetol. 2022, 21, 168. [Google Scholar] [CrossRef]
- Koehler, E.M.; Schouten, J.N.L.; Hansen, B.E.; Hofman, A.; Stricker, B.H.; Janssen, H.L.A. External validation of the fatty liver index for identifying nonalcoholic fatty liver disease in a population-based study. Clin. Gastroenterol. Hepatol. 2013, 11, 1201–1204. [Google Scholar] [CrossRef]
- Bedogni, G.; Bellentani, S.; Miglioli, L.; Masutti, F.; Passalacqua, M.; Castiglione, A.; Tiribelli, C. The Fatty Liver Index: A simple and accurate predictor of hepatic steatosis in the general population. BMC Gastroenterol. 2006, 6, 33. [Google Scholar] [CrossRef]
- Seo, I.-H.; Lee, H.S.; Lee, Y.-J. Fatty liver index as a predictor for incident type 2 diabetes in community-dwelling adults: Longitudinal findings over 12 years. Cardiovasc. Diabetol. 2022, 21, 209. [Google Scholar] [CrossRef] [PubMed]
- Wargny, M.; Smati, S.; Pichelin, M.; Bigot-Corbel, E.; Authier, C.; Dierry, V.; Zaïr, Y.; Jacquin, V.; Hadjadj, S.; Boursier, J.; et al. Fatty liver index is a strong predictor of changes in glycemic status in people with prediabetes: The IT-DIAB study. PLoS ONE 2019, 14, e0221524. [Google Scholar] [CrossRef] [PubMed]
- Chung, T.-H.; Kim, J.-K.; Kim, J.-H.; Lee, Y.-J. Fatty Liver Index as a Simple and Useful Predictor for 10-year Cardiovascular Disease Risks Determined by Framingham Risk Score in the General Korean Population. J. Gastrointest. Liver Dis. 2021, 30, 221–226. [Google Scholar] [CrossRef] [PubMed]
- Gaede, P.; Vedel, P.; Larsen, N.; Jensen, G.V.H.; Parving, H.-H.; Pedersen, O. Multifactorial intervention and cardiovascular disease in patients with type 2 diabetes. N. Engl. J. Med. 2003, 348, 383–393. [Google Scholar] [CrossRef] [PubMed]
- Traber, M.G.; Jialal, I. Measurement of lipid-soluble vitamins-further adjustment needed? Lancet 2000, 355, 2013–2014. [Google Scholar] [CrossRef] [PubMed]
- Raederstorff, D.; Wyss, A.; Calder, P.C.; Weber, P.; Eggersdorfer, M. Vitamin E function and requirements in relation to PUFA. Br. J. Nutr. 2015, 114, 1113–1122. [Google Scholar] [CrossRef]
- Flock, M.R.; Skulas-Ray, A.C.; Harris, W.S.; Etherton, T.D.; Fleming, J.A.; Kris-Etherton, P.M. Determinants of erythrocyte omega-3 fatty acid content in response to fish oil supplementation: A dose-response randomized controlled trial. J. Am. Heart Assoc. 2013, 2, e000513. [Google Scholar] [CrossRef] [PubMed]
- Katan, M.B.; Deslypere, J.P.; van Birgelen, A.P.; Penders, M.; Zegwaard, M. Kinetics of the incorporation of dietary fatty acids into serum cholesteryl esters, erythrocyte membranes, and adipose tissue: An 18-month controlled study. J. Lipid Res. 1997, 38, 2012–2022. [Google Scholar] [CrossRef] [PubMed]
- Cartwright, I.J.; Pockley, A.G.; Galloway, J.H.; Greaves, M.; Preston, F.E. The effects of dietary omega-3 polyunsaturated fatty acids on erythrocyte membrane phospholipids, erythrocyte deformability and blood viscosity in healthy volunteers. Atherosclerosis 1985, 55, 267–281. [Google Scholar] [CrossRef]
- Sanders, T.A.; Vickers, M.; Haines, A.P. Effect on blood lipids and haemostasis of a supplement of cod-liver oil, rich in eicosapentaenoic and docosahexaenoic acids, in healthy young men. Clin. Sci. 1981, 61, 317–324. [Google Scholar] [CrossRef]
- Kuhnt, K.; Weiß, S.; Kiehntopf, M.; Jahreis, G. Consumption of echium oil increases EPA and DPA in blood fractions more efficiently compared to linseed oil in humans. Lipids Health Dis. 2016, 15, 32. [Google Scholar] [CrossRef] [PubMed]
- Barceló-Coblijn, G.; Murphy, E.J.; Othman, R.; Moghadasian, M.H.; Kashour, T.; Friel, J.K. Flaxseed oil and fish-oil capsule consumption alters human red blood cell n-3 fatty acid composition: A multiple-dosing trial comparing 2 sources of n-3 fatty acid. Am. J. Clin. Nutr. 2008, 88, 801–809. [Google Scholar] [CrossRef] [PubMed]
- Wilkinson, P.; Leach, C.; Ah-Sing, E.E.; Hussain, N.; Miller, G.J.; Millward, D.J.; Griffin, B.A. Influence of alpha-linolenic acid and fish-oil on markers of cardiovascular risk in subjects with an atherogenic lipoprotein phenotype. Atherosclerosis 2005, 181, 115–124. [Google Scholar] [CrossRef] [PubMed]
- Sun, Q.; Ma, J.; Campos, H.; Hankinson, S.E.; Hu, F.B. Comparison between plasma and erythrocyte fatty acid content as biomarkers of fatty acid intake in US women. Am. J. Clin. Nutr. 2007, 86, 74–81. [Google Scholar] [CrossRef] [PubMed]
- Poppitt, S.D.; Kilmartin, P.; Butler, P.; Keogh, G.F. Assessment of erythrocyte phospholipid fatty acid composition as a biomarker for dietary MUFA, PUFA or saturated fatty acid intake in a controlled cross-over intervention trial. Lipids Health Dis. 2005, 4, 30. [Google Scholar] [CrossRef] [PubMed]
- Sarkkinen, E.S.; Agren, J.J.; Ahola, I.; Ovaskainen, M.L.; Uusitupa, M.I. Fatty acid composition of serum cholesterol esters, and erythrocyte and platelet membranes as indicators of long-term adherence to fat-modified diets. Am. J. Clin. Nutr. 1994, 59, 364–370. [Google Scholar] [CrossRef] [PubMed]
- Romon, M.; Nuttens, M.C.; Théret, N.; Delbart, C.; Lecerf, J.M.; Fruchart, J.C.; Salomez, J.L. Comparison between fat intake assessed by a 3-day food record and phospholipid fatty acid composition of red blood cells: Results from the Monitoring of Cardiovascular Disease-Lille Study. Metabolism 1995, 44, 1139–1145. [Google Scholar] [CrossRef]
- Sun, Q.; Ma, J.; Campos, H.; Hu, F.B. Plasma and erythrocyte biomarkers of dairy fat intake and risk of ischemic heart disease. Am. J. Clin. Nutr. 2007, 86, 929–937. [Google Scholar] [CrossRef] [PubMed]
- Wennberg, M.; Vessby, B.; Johansson, I. Evaluation of relative intake of fatty acids according to the Northern Sweden FFQ with fatty acid levels in erythrocyte membranes as biomarkers. Public Health Nutr. 2009, 12, 1477–1484. [Google Scholar] [CrossRef]
- Pranger, I.G.; Joustra, M.L.; Corpeleijn, E.; Muskiet, F.A.J.; Kema, I.P.; Oude Elferink, S.J.W.H.; Singh-Povel, C.; Bakker, S.J.L. Fatty acids as biomarkers of total dairy and dairy fat intakes: A systematic review and meta-analysis. Nutr. Rev. 2019, 77, 46–63. [Google Scholar] [CrossRef]
- Risérus, U.; Marklund, M. Milk fat biomarkers and cardiometabolic disease. Curr. Opin. Lipidol. 2017, 28, 46–51. [Google Scholar] [CrossRef]
- Forouhi, N.G.; Koulman, A.; Sharp, S.J.; Imamura, F.; Kröger, J.; Schulze, M.B.; Crowe, F.L.; Huerta, J.M.; Guevara, M.; Beulens, J.W.J.; et al. Differences in the prospective association between individual plasma phospholipid saturated fatty acids and incident type 2 diabetes: The EPIC-InterAct case-cohort study. Lancet Diabetes Endocrinol. 2014, 2, 810–818. [Google Scholar] [CrossRef] [PubMed]
- Weitkunat, K.; Schumann, S.; Nickel, D.; Hornemann, S.; Petzke, K.J.; Schulze, M.B.; Pfeiffer, A.F.; Klaus, S. Odd-chain fatty acids as a biomarker for dietary fiber intake: A novel pathway for endogenous production from propionate. Am. J. Clin. Nutr. 2017, 105, 1544–1551. [Google Scholar] [CrossRef] [PubMed]
- Rosell, M.; Johansson, G.; Berglund, L.; Vessby, B.; de Faire, U.; Hellénius, M.-L. The relation between alcohol intake and physical activity and the fatty acids 14:0, 15:0 and 17:0 in serum phospholipids and adipose tissue used as markers for dairy fat intake. Br. J. Nutr. 2005, 93, 115–121. [Google Scholar] [CrossRef] [PubMed]
- Pertiwi, K.; Küpers, L.K.; Wanders, A.J.; de Goede, J.; Zock, P.L.; Geleijnse, J.M. Associations of dairy and fiber intake with circulating odd-chain fatty acids in post-myocardial infarction patients. Nutr. Metab. 2019, 16, 78. [Google Scholar] [CrossRef] [PubMed]
- Burdge, G.C.; Finnegan, Y.E.; Minihane, A.M.; Williams, C.M.; Wootton, S.A. Effect of altered dietary n-3 fatty acid intake upon plasma lipid fatty acid composition, conversion of 13Calpha-linolenic acid to longer-chain fatty acids and partitioning towards beta-oxidation in older men. Br. J. Nutr. 2003, 90, 311–321. [Google Scholar] [CrossRef] [PubMed]
- Burdge, G.C.; Calder, P.C. Conversion of alpha-linolenic acid to longer-chain polyunsaturated fatty acids in human adults. Reprod. Nutr. Dev. 2005, 45, 581–597. [Google Scholar] [CrossRef]
- Hodson, L.; Skeaff, C.M.; Fielding, B.A. Fatty acid composition of adipose tissue and blood in humans and its use as a biomarker of dietary intake. Prog. Lipid Res. 2008, 47, 348–380. [Google Scholar] [CrossRef]


| Parameters | Hypertriglyceridemia | Prediabetes |
|---|---|---|
| Sex | 43 w (68.3%), 20 m (31.7%) | 47 w (77.0%), 14 m (23.0%) |
| Age [years] | 57.0 (50.5, 63.5) | 60.0 (51.0, 66.0) |
| BMI [kg/m2] | 30.0 (27.1, 33.6) | 29.4 (25.9, 34.3) |
| Systolic blood pressure [mmHG] | 132.0 (123.5, 145.0) | 135.0 (125.0, 150.0) |
| Diastolic blood pressure [mmHG] | 88.0 (82.5, 96.0) | 87.0 (78.0, 94.0) |
| Total cholesterol [mmol/L] | 6.1 (5.3, 6.6) | 5.4 (4.7, 6.1) |
| LDL cholesterol [mmol/L] | 3.8 (3.4, 4.6) | 3.4 (2.9, 4.4) |
| HDL cholesterol [mmol/L] | 1.3 (1.2, 1.6) | 1.4 (1.3, 1.7) |
| Non-HDL cholesterol [mmol/L] | 4.4 (3.9, 5.3) | 3.7 (3.3, 4.7) |
| Triglycerides [mmol/L] | 1.6 (1.2, 2.0) | 1.1 (0.8, 1.4) |
| Blood glucose [mmol/L] | 5.8 (5.5, 6.2) | 5.8 (5.4, 6.4) |
| Insulin [mU/L] | 11.7 (8.5, 15.9) | 11.5 (8.0, 16.2) |
| C-peptide [ng/mL] | 2.5 (2.1, 3.1) | 2.5 (1.9, 3.2) |
| HbA1c [%] | 5.8 (5.6, 6.0) | 5.8 (5.5, 6.0) |
| Parameters | HTGI | HTGC | PDI | PDC |
|---|---|---|---|---|
| Sex | 21 w (70.0%) 9 m (30.0%) | 22 w (66.7%) 11 m (33.3%) | 23 w (76.7%) 7 m (23.3%) | 24 w (77.4%) 7 m (22.6%) |
| Age [years] | 56.5 (48.5, 66.0) | 57.0 (51.0, 61.0) | 62.5 (51.0, 66.8) | 58.0 (51.5, 64.5) |
| Parameters | Week | HTGI | HTGC | ◊ | PDI | PDC | ◊ | ● | ||||||||
|---|---|---|---|---|---|---|---|---|---|---|---|---|---|---|---|---|
| n | Characteristics * | ∆ | n | Characteristics * | ∆ | n | Characteristics * | ∆ | n | Characteristics * | ∆ | |||||
| Body weight [kg] | 0 | 29 | 83.4 (76.5, 90.4) | a | 27 | 86.8 (±11.7) 82.6 (78.5, 96.6) | a † | n.s. | 30 | 89.0 (±17.2) 88.2 (75.4, 100.3) | a † | 28 | 78.7 (±18.7) | a † | 0.033 † | n.s. |
| 10 | 75.9 (70.7, 87.1) | b | 86.4 (±11.8) 82.5 (78.8, 96.0) | a † | 0.021 | 83.1 (±15.4) 82.8 (71.0, 90.3) | b † | 78.1 (±18.5) | a † | n.s. † | n.s. | |||||
| 20 | 76.3 (68.3, 86.9) | b | 86.6 (±11.6) 83.3 (78.3, 96.4) | a † | 0.014 | 83.1 (±15.1) 83.0 (72.5, 88.5) | b † | 77.7 (±18.3) | a † | n.s. † | n.s. | |||||
| %A→F | 29 | −7.3 (±3.9) −7.6 (−9.7, −5.5) | 33 | −0.5 (±1.4) | <0.001 † | 30 | −7.5 (−9.3, −4.3) | 31 | −0.9 (−2.0, 0.6) | <0.001 | n.s. | |||||
| %A→G | 30 | −7.3 (±5.5) −6.4 (−9.4, −3.2) | 33 | −0.3 (−1.2, 0.4) | <0.001 | 30 | −6.3 (±4.6) | 29 | −1.2 (±3.3) | <0.001 † | n.s. † | |||||
| BMI [kg/m2] | 0 | 29 | 30.9 (±5.0) 30.7 (27.7, 32.9) | a | 27 | 30.7 (±5.1) | a † | n.s. † | 30 | 30.9 (±4.9) | a † | 28 | 28.4 (±6.3) | a † | n.s. † | n.s. † |
| 10 | 28.1 (25.6, 29.5) | b | 30.5 (±5.0) 29.3 (26.6, 33.8) | a † | n.s. | 29.0 (±4.6) 29.0 (25.6, 32.3) | b † | 28.2 (±6.2) | a † | n.s. † | n.s. | |||||
| 20 | 27.5 (25.2, 29.6) | b | 30.6 (±5.0) 29.8 (26.5, 33.8) | a † | n.s. | 28.9 (±4.6) 28.8 (25.6, 32.4) | b † | 28.0 (±5.9) | a † | n.s. † | n.s. | |||||
| %A→F | 29 | −7.4 (±3.9) | 33 | −0.8 (±1.6) | <0.001 † | 30 | −6.3 (±3.5) | 31 | −0.7 (±2.2) | <0.001 † | n.s. † | |||||
| %A→G | 30 | −7.4 (±5.6) −6.7 (−10.3, −3.6) | 33 | −0.3 (−1.2, 0.4) | <0.001 | 30 | −6.4 (±4.5) | 29 | −1.3 (±3.5) | <0.001 † | n.s. † | |||||
| Waist circumferences [cm] | 0 | 29 | 101.6 (±15.7) | a † | 27 | 103.6 (±13.2) | a † | n.s. † | 30 | 103.5 (±11.8) | a † | 28 | 96.1 (±14.6) | a † | 0.038 † | n.s. † |
| 10 | 95.3 (±15.2) | b † | 103.4 (±13.2) | a † | 0.039 † | 97.3 (±12.3) | b † | 95.6 (±14.7) | a † | n.s. † | n.s. † | |||||
| 20 | 94.9 (±15.5) | b † | 103.0 (±12.1) | a † | 0.033 † | 97.9 (±10.8) | b † | 95.4 (±14.6) | a † | n.s. † | n.s. † | |||||
| %A→F | 29 | −6.2 (±3.7) | 33 | 0.2 (±2.8) | <0.001 † | 30 | −6.1 (±4.3) | 31 | −0.5 (±2.7) | <0.001 † | n.s. † | |||||
| %A→G | 30 | −6.4 (±4.2) | 33 | −0.4 (±3.7) | <0.001 † | 30 | −5.3 (±4.2) | 29 | −1.0 (−2.4, 2.1) | <0.001 † | n.s. † | |||||
| Systolic blood pressure [mmHG] | 0 | 29 | 137.4 (±14.2) | a † | 27 | 132.0 (±16.1) 132.0 (119.5, 145.5) | a | n.s. † | 30 | 140.3 (±18.6) 137.0 (127.3, 150.8) | a † | 28 | 130.0 (122.0, 147.3) | a | n.s. | n.s. † |
| 10 | 125.4 (±14.0) | b † | 131.6 (±18.9) 127.0 (122.0, 138.5) | a | n.s. † | 128.6 (±18.0) 129.0 (115.3, 136.8) | b † | 126.5 (114.8, 141.0) | b | n.s. | n.s. † | |||||
| 20 | 129.8 (±11.5) | b † | 131.5 (±18.4) 129.0 (120.0, 139.0) | a | n.s. † | 137.2 (±16.8) | a † | 135.6 (±17.5) 134.5 (124.0, 144.3) | a | n.s. † | n.s. † | |||||
| %A→F | 29 | −8.4 (±9.2) | 33 | −0.5 (±10.2) | 0.002 † | 30 | −8.1 (±7.9) −8.4 (−12.6, −3.0) | 31 | −5.5 (−11.2, −1.6) | n.s. | n.s. † | |||||
| %A→G | 30 | −4.8 (±7.4) | 33 | 1.0 (±10.4) | 0.014 † | 30 | −1.7 (±8.9) −2.0 (−7.1, 2.7) | 29 | −1.7 (−6.9, 5.5) | n.s. | n.s. † | |||||
| Diastolic blood pressure [mmHG] | 0 | 29 | 87.0 (83.0, 97.0) | a | 27 | 89.0 (82.0, 95.5) | a | n.s. | 30 | 86.9 (±10.7) 88.0 (78.0, 94.8) | a † | 28 | 86.0 (±11.6) 85.0 (77.8, 92.3) | a | n.s. † | n.s. |
| 10 | 85.5 (±10.2) 85.0 (78.0, 92.0) | a | 89.0 (82.0, 94.5) | a | n.s. | 81.0 (±8.3) | b † | 80.9 (±9.3) 79.5 (73.8, 89.3) | b | n.s. † | n.s. † | |||||
| 20 | 90.1 (±9.8) 91.0 (82.0, 97.0) | a | 87.6 (±10.4) 85.0 (79.0, 95.5) | a | n.s. † | 85.3 (±9.7) | a † | 85.8 (±10.4) 85.5 (78.5, 93.0) | a | n.s. † | n.s. † | |||||
| %A→F | 29 | −2.7 (−13.8, 3.6) | 33 | 2.4 (−5.7, 7.5) | n.s. | 30 | −6.1 (±9.9) −6.3 (−11.1, −1.8) | 31 | −6.0 (±8.6) | n.s. † | n.s. | |||||
| %A→G | 30 | 1.6 (−7.7, 11.0) | 33 | −2.5 (−7.9, 6.6) | n.s. | 30 | −1.3 (±10.0) −3.6 (−9.0, 5.5) | 29 | 0.4 (±10.0) | n.s. † | n.s. | |||||
| Total cholesterol [mmol/L] | 0 | 29 | 6.1 (±1.2) | a † | 27 | 5.9 (±0.8) | a † | n.s. † | 30 | 5.5 (±0.8) | a † | 28 | 5.5 (±1.3) 5.3 (4.5, 6.4) | a | n.s. † | 0.025 † |
| 10 | 5.0 (±1.0) | b † | 5.9 (±0.8) | a † | <0.001 † | 4.7 (±0.7) 4.7 (4.2, 5.3) | b † | 5.3 (4.5, 6.3) | a | 0.038 | n.s. † | |||||
| 20 | 5.7 (±0.9) | c † | 6.0 (±0.9) | a † | n.s. † | 5.2 (±1.0) 5.0 (4.6, 5.8) | a † | 5.2 (4.7, 6.2) | a | n.s. | n.s. † | |||||
| %A→F | 29 | −17.8 (±13.1) | 33 | 0.1 (±9.6) | <0.001 † | 30 | −13.8 (±9.7) −13.7 (−19.5, −9.5) | 31 | −0.2 (−5.9, 5.2) | <0.001 | n.s. † | |||||
| %A→G | 30 | −6.1 (±12.1) | 33 | 1.1 (±8.4) | 0.008 † | 30 | −5.5 (±12.6) | 29 | 1.6 (±7.9) | 0.013 † | n.s. † | |||||
| LDL cholesterol [mmol/L] | 0 | 29 | 3.9 (±0.9) | a † | 27 | 4.0 (±0.8) | a † | n.s. † | 30 | 3.6 (±0.9) 3.7 (3.0, 4.3) | a † | 28 | 3.2 (2.8, 4.4) | a | n.s. | n.s. † |
| 10 | 3.1 (±0.8) | b † | 3.9 (±0.7) | a † | <0.001 † | 3.1 (±0.7) 3.2 (2.5, 3.6) | b † | 3.2 (2.8, 4.1) | a | n.s. | n.s. † | |||||
| 20 | 3.6 (±0.8) | c † | 4.0 (±0.8) | a † | n.s. † | 3.3 (±0.9) 3.3 (2.7, 4.1) | a † | 3.4 (2.8, 4.2) | a | n.s. | n.s. † | |||||
| %A→F | 29 | −19.8 (±16.6) −19.5 (−27.3, −11.0) | 33 | −1.3 (−7.0, 4.3) | <0.001 | 30 | −13.0 (±15.3) −14.3 (−22.1, −7.7) | 31 | 0.3 (−6.6, 7.8) | <0.001 | n.s. † | |||||
| %A→G | 30 | −4.7 (−16.0, 2.7) | 33 | 2.8 (−4.8, 8.8) | 0.006 | 30 | −5.7 (±17.3) −6.8 (−12.6, 4.7) | 29 | 4.1 (±11.2) | 0.013 † | n.s. | |||||
| HDL cholesterol [mmol/L] | 0 | 29 | 1.5 (±0.4) 1.4 (1.2, 1.7) | a | 27 | 1.3 (1.2, 1.6) | a | n.s. | 30 | 1.4 (±0.3) 1.4 (1.2, 1.6) | a † | 28 | 1.6 (1.3, 1.9) | a | 0.042 | n.s. † |
| 10 | 1.3 (±0.3) 1.3 (1.1, 1.5) | b | 1.3 (1.1, 1.6) | a | n.s. | 1.3 (±0.3) 1.3 (1.1, 1.5) | b † | 1.5 (1.3, 1.8) | a | 0.012 | n.s. † | |||||
| 20 | 1.5 (1.2, 1.7) | a | 1.4 (1.1, 1.7) | a | n.s. | 1.4 (±0.3) 1.4 (1.2, 1.6) | a † | 1.6 (±0.5) 1.5 (1.3, 1.8) | a | n.s. † | n.s. | |||||
| %A→F | 29 | −9.6 (±12.9) −7.3 (−17.8, −2.3) | 33 | −3.0 (±8.8) | 0.021 † | 30 | −8.5 (−14.0, 1.2) | 31 | −3.8 (−8.8, 0.0) | n.s. | n.s. | |||||
| %A→G | 30 | 0.2 (±9.3) −0.2 (−6.1, 8.3) | 33 | 1.8 (±13.9) | n.s. † | 30 | 1.7 (−6.0, 8.4) | 29 | −4.3 (−9.4, 1.2) | n.s. | n.s. | |||||
| Non-HDL cholesterol [mmol/L] | 0 | 29 | 4.4 (3.7, 5.3) | a | 27 | 4.5 (±0.8) 4.3 (4.0, 5.0) | a † | n.s. | 30 | 4.1 (±0.9) 4.2 (3.5, 4.7) | a † | 28 | 3.8 (±1.2) 3.5 (3.0, 4.9) | a | n.s. † | n.s. |
| 10 | 3.7 (±1.0) 3.8 (3.1, 4.2) | b | 4.5 (±0.8) | a † | 0.002 † | 3.4 (±0.7) 3.4 (2.9, 4.0) | b † | 3.5 (2.9, 4.6) | a | n.s. | n.s. † | |||||
| 20 | 4.2 (±0.9) 4.2 (3.5, 4.7) | a | 4.5 (±0.9) | a † | n.s. † | 3.8 (±1.0) 3.8 (3.1, 4.6) | b † | 3.6 (3.1, 4.4) | a | n.s. | n.s. † | |||||
| %A→F | 29 | −19.6 (±16.0) −18.5 (−28.1, −13.8) | 33 | 1.0 (−6.9, 9.1) | <0.001 | 30 | −15.8 (±12.2) −17.6 (−22.6, −7.3) | 31 | 1.7 (−7.3, 9.6) | <0.001 | n.s. † | |||||
| %A→G | 30 | −7.5 (±15.0) −5.5 (−16.3, −1.4) | 33 | 1.2 (±11.3) | 0.011 † | 30 | −7.9 (−13.1, −0.1) | 29 | 2.3 (−1.5, 11.1) | <0.001 | n.s. | |||||
| Triglycerides [mmol/L] | 0 | 29 | 1.5 (1.1, 2.0) | a | 27 | 1.7 (1.4, 2.1) | a | n.s. | 30 | 1.3 (1.0, 1.7) | a | 28 | 1.0 (0.8, 1.1) | a | 0.003 | n.s. |
| 10 | 1.1 (0.8, 1.3) | b | 1.9 (1.3, 2.5) | a | <0.001 | 1.1 (0.8, 1.3) | b | 1.1 (0.9, 1.4) | a | n.s. | n.s. | |||||
| 20 | 1.4 (1.1, 1.9) | a | 1.6 (1.2, 2.2) | a | n.s. | 1.1 (0.9, 1.7) | a,b | 1.1 (0.9, 1.3) | a | n.s. | n.s. | |||||
| %A→F | 29 | −18.2 (±44.4) −32.4 (−47.7, 3.6) | 33 | 20.5 (−16.4, 56.3) | 0.003 | 30 | −13.0 (±24.6) | 31 | 24.1 (±41.0) | <0.001 † | n.s. † | |||||
| %A→G | 30 | −6.6 (−36.8, 41.2) | 33 | 13.1 (−28.0, 44.7) | n.s. | 30 | −5.9 (±30.2) −10.8 (−24.4, 12.1) | 29 | 16.7 (±28.5) | 0.005 † | n.s. | |||||
| High-sensitivity CRP [mg/L] | 0 | 29 | 2.2 (1.4, 3.1) | a | 27 | 2.2 (1.6, 3.8) | a | n.s. | 30 | 2.3 (0.9, 3.1) | a | 28 | 1.3 (0.9, 1.8) | a | n.s. | n.s. |
| 10 | 1.9 (0.7, 3.2) | b | 2.2 (1.8, 4.0) | a | n.s. | 1.5 (0.7, 3.5) | a | 1.7 (1.0, 2.4) | a | n.s. | n.s. | |||||
| 20 | 2.0 (0.6, 4.7) | b | 2.4 (1.2, 4.1) | a | n.s. | 1.8 (0.4, 4.5) | a | 1.2 (0.8, 2.4) | a | n.s. | n.s. | |||||
| %A→F | 29 | −20.0 (−55.6, 17.7) | 33 | 20.0 (−5.9, 48.3) | 0.006 | 30 | 0.0 (−39.9, 10.2) | 31 | 27.3 (−12.4, 50.0) | 0.009 | n.s. | |||||
| %A→G | 30 | −17.0 (−53.1, 0.0) | 33 | 6.7 (−29.4, 33.3) | n.s. | 30 | −12.8 (−38.9, 43.8) | 29 | 0.0 (−28.6, 28.6) | n.s. | n.s. | |||||
| Blood glucose [mmol/L] | 0 | 29 | 5.8 (5.5, 6.1) | a | 27 | 6.0 (5.6, 6.6) | a | n.s. | 30 | 5.8 (5.4, 6.4) | a | 27 | 5.7 (5.4, 6.5) | a | n.s. | n.s. |
| 10 | 5.6 (5.3, 5.9) | b | 5.8 (5.6, 6.3) | a | 0.049 | 5.6 (5.3, 6.0) | b | 5.5 (5.4, 6.0) | a | n.s. | n.s. | |||||
| 20 | 5.6 (5.4, 6.2) | a,b | 5.8 (5.4, 6.5) | a | n.s. | 5.8 (5.5, 6.1) | a,b | 5.8 (5.4, 6.1) | a | n.s. | n.s. | |||||
| %A→F | 29 | −4.2 (±9.0) | 33 | −0.2 (±6.7) | 0.048 † | 30 | −5.1 (±9.8) | 31 | −1.4 (±7.8) | n.s. † | n.s. † | |||||
| %A→G | 30 | −0.3 (±8.4) | 33 | −0.9 (±7.6) | n.s. † | 30 | −1.9 (±6.6) | 29 | 0.5 (±7.3) | n.s. † | n.s. † | |||||
| Insulin [mU/L] | 0 | 29 | 13.3 (±6.3) 12.0 (8.4, 16.3) | a | 27 | 12.0 (±5.9) 10.4 (8.5, 15.5) | a | n.s. † | 30 | 10.2 (8.3, 16.2) | a | 28 | 12.0 (7.1, 16.0) | a | n.s. | n.s. |
| 10 | 7.7 (7.3, 10.2) | b | 10.7 (8.1, 14.9) | a | n.s. | 8.0 (6.1, 11.2) | b | 10.6 (8.7, 16.5) | a | 0.018 | n.s. | |||||
| 20 | 10.2 (8.2, 14.3) | a,b | 11.2 (6.9, 14.3) | a | n.s. | 9.4 (7.4, 10.8) | a,b | 10.2 (7.9, 17.3) | a | n.s. | n.s. | |||||
| %A→F | 29 | −26.8 (−41.2, −11.9) | 33 | 1.0 (−20.2, 19.2) | <0.001 | 30 | −17.7 (−46.9, −5.5) | 31 | 11.3 (−7.0, 39.9) | <0.001 | n.s. | |||||
| %A→G | 30 | −21.6 (−27.7, 15.6) | 33 | −9.3 (−24.4, 18.1) | n.s. | 30 | −8.0 (−29.9, 3.3) | 29 | 8.0 (−9.1, 23.9) | 0.017 | n.s. | |||||
| C-peptide [ng/mL] | 0 | 29 | 2.7 (±0.8) 2.6 (2.1, 3.0) | a | 27 | 2.7 (±0.9) | a † | n.s. † | 30 | 2.6 (±0.8) 2.5 (1.9, 3.2) | a | 28 | 2.5 (±1.0) 2.5 (1.7, 3.2) | a | n.s. † | n.s. † |
| 10 | 2.0 (1.8, 2.3) | b | 2.6 (±0.7) 2.7 (2.2, 3.1) | a † | 0.025 | 2.1 (1.8, 2.6) | b | 2.3 (1.9, 3.1) | a | n.s. | n.s. | |||||
| 20 | 2.4 (±0.9) 2.2 (1.9, 2.6) | b | 2.8 (±0.9) | a † | n.s. † | 2.2 (±0.6) 2.2 (1.9, 2.5) | b | 2.2 (1.7, 3.1) | a | n.s. | n.s. † | |||||
| %A→F | 29 | −14.8 (−25.0, −9.1) | 33 | 0.0 (−9.7, 11.8) | <0.001 | 30 | −15.1 (−25.8, −4.7) | 31 | 3.2 (−6.8, 20.1) | <0.001 | n.s. | |||||
| %A→G | 30 | −11.0 (±20.4) | 33 | 3.1 (±21.6) | 0.01 † | 30 | −11.9 (±14.6) | 29 | −0.6 (±19.4) | 0.015 † | n.s. † | |||||
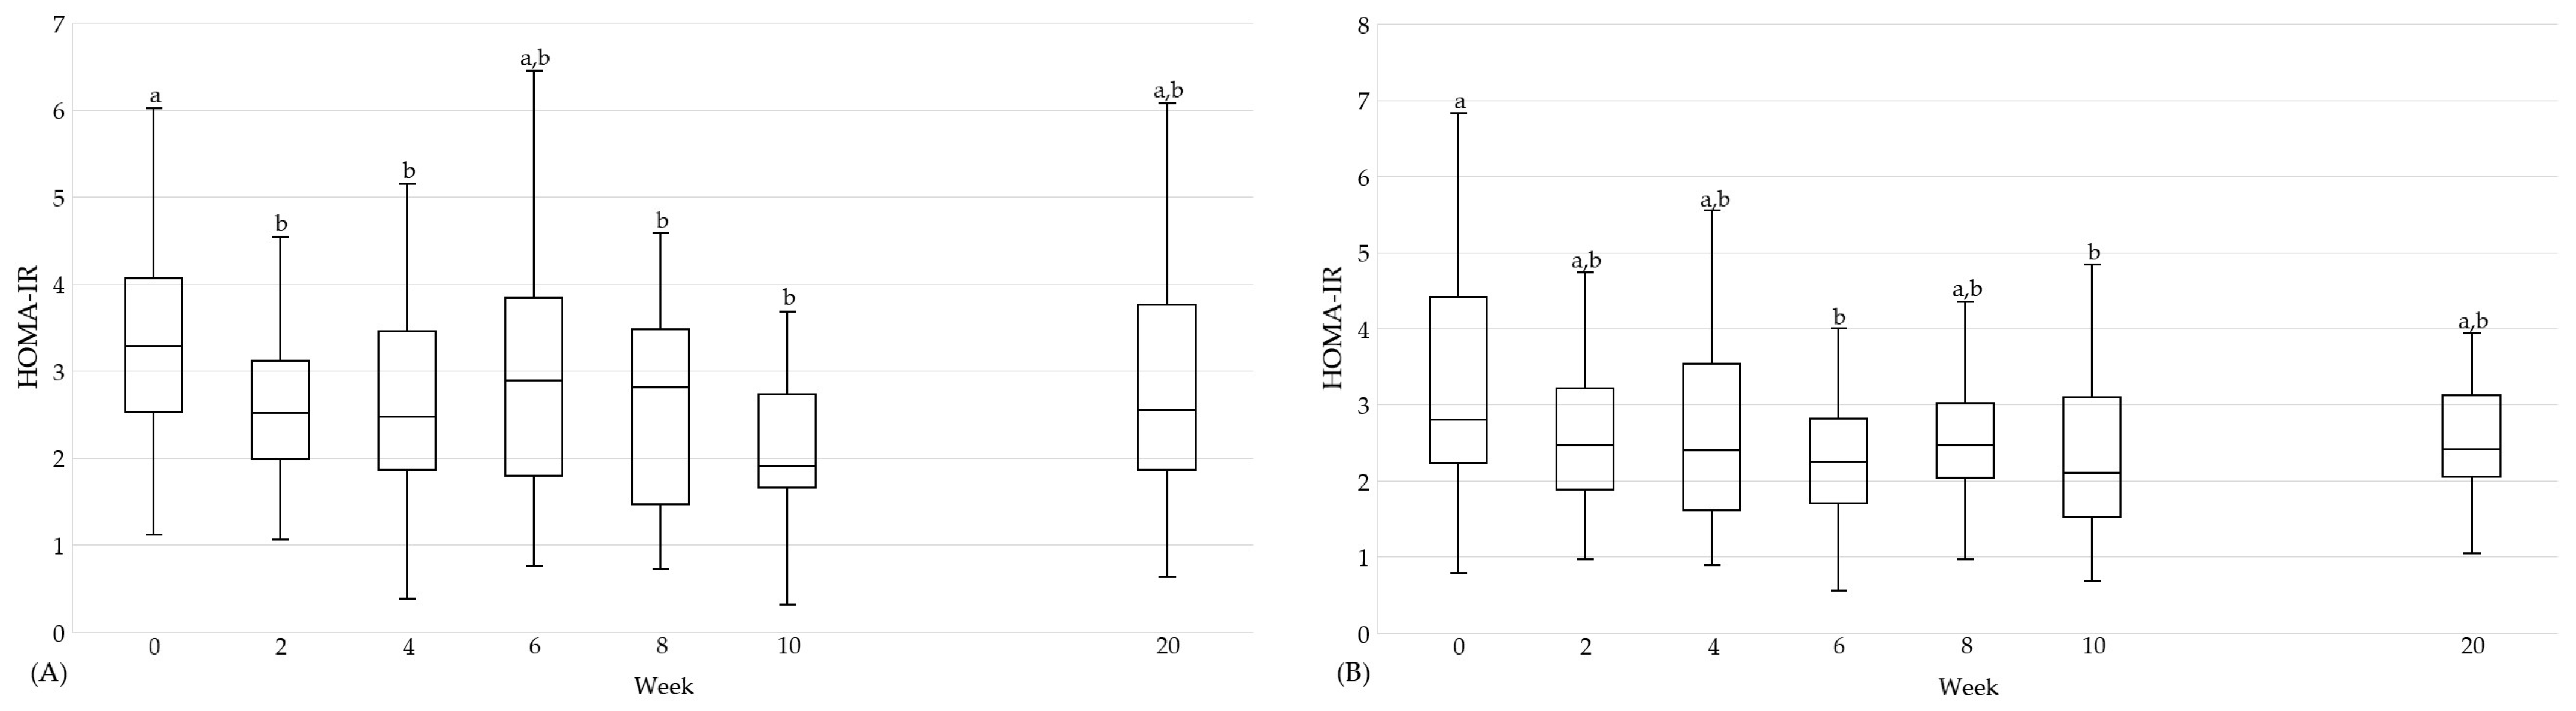
| HOMA-IR | 0 | 29 | 3.3 (2.5, 4.1) | a | 27 | 2.9 (2.0, 4.6) | a | n.s. | 30 | 2.8 (2.2, 4.4) | a | 27 | 3.4 (1.8, 4.6) | a | n.s. | n.s. |
| 10 | 1.9 (1.7, 2.7) | b | 3.0 (2.0, 3.8) | a | n.s. | 2.1 (1.5, 3.1) | b | 2.6 (2.1, 4.2) | a | 0.022 | n.s. | |||||
| 20 | 2.5 (1.9, 3.8) | a,b | 2.9 (1.9, 3.7) | a | n.s. | 2.4 (2.1, 3.1) | a,b | 2.7 (1.9, 4.3) | a | n.s. | n.s. | |||||
| %A→F | 29 | −31.8 (−46.1, −10.1) | 33 | 2.9 (−25.4, 23.2) | <0.001 | 30 | −26.4 (−48.3, −6.6) | 31 | 11.2 (−10.0, 45.3) | <0.001 | n.s. | |||||
| %A→G | 30 | −21.0 (−35.6, 11.2) | 33 | −9.3 (−23.8, 16.4) | n.s. | 30 | −12.2 (−33.4, 9.7) | 29 | 7.5 (−15.8, 30.7) | 0.029 | n.s. | |||||
| HbA1c [%] | 0 | 29 | 5.9 (5.7, 6.1) | a | 27 | 5.8 (5.7, 6.0) | a | n.s. | 30 | 5.8 (±0.4) 5.8 (5.6, 6.1) | a † | 28 | 5.7 (5.5, 5.9) | a | n.s. | n.s. |
| 10 | 5.7 (±0.3) 5.8 (5.6, 5.8) | b | 5.7 (±0.3) 5.8 (5.6, 5.9) | b | n.s. † | 5.6 (±0.3) 5.6 (5.4, 5.7) | b † | 5.7 (5.4, 5.8) | a | n.s. | n.s. † | |||||
| 20 | 5.7 (5.7, 5.9) | a | 5.8 (5.7, 6.0) | a | n.s. | 5.7 (±0.3) 5.7 (5.4, 5.9) | c † | 5.7 (±0.3) 5.7 (5.5, 5.9) | a | n.s. † | n.s. | |||||
| %A→F | 29 | −3.4 (−5.1, −1.8) | 33 | 0.0 (−3.3, 1.7) | 0.003 | 30 | −5.0 (−5.3, −2.3) | 31 | −1.7 (−3.3, 0.9) | <0.001 | n.s. | |||||
| %A→G | 30 | −1.7 (−3.3, 0.0) | 33 | 0.0 (0.0, 1.8) | 0.005 | 30 | −1.9 (−4.6, −1.6) | 29 | 0.0 (−1.8, 1.8) | 0.01 | n.s. | |||||
| TyG index [mg/dL] | 0 | 29 | 8.9 (±0.5) 8.8 (8.5, 9.2) | a | 27 | 9.0 (±0.5) | a † | n.s. † | 30 | 8.8 (±0.5) 8.8 (8.4, 9.0) | a | 28 | 8.4 (±0.4) | a † | 0.002 † | n.s. † |
| 10 | 8.5 (8.1, 8.7) | b | 9.0 (±0.5) 9.1 (8.6, 9.3) | a † | <0.001 | 8.5 (8.3, 8.7) | b | 8.5 (±0.5) 8.5 (8.2, 8.8) | a † | n.s. | n.s. | |||||
| 20 | 8.7 (8.4, 9.1) | a | 8.9 (±0.5) 8.9 (8.6, 9.3) | a † | n.s. | 8.6 (±0.6) 8.5 (8.3, 8.9) | a,b | 8.5 (±0.4) | a † | n.s. † | n.s. | |||||
| %A→F | 29 | −4.4 (±6.3) | 33 | 1.2 (±6.1) | 0.001 † | 30 | −2.6 (±3.3) | 31 | 1.8 (±4.1) | <0.001 † | n.s. † | |||||
| %A→G | 30 | −0.5 (±7.2) | 33 | −0.1 (±6.6) | n.s. † | 30 | −1.5 (±3.8) | 29 | 1.6 (±3.3) | 0.002 † | n.s. † | |||||
| FLI | 0 | 29 | 70.0 (45.8, 89.6) | a | 33 | 70.3 (53.1, 88.1) | a | n.s. | 30 | 71.6 (47.8, 91.4) | a | 29 | 48.1 (22.7, 78.9) | a | 0.022 | n.s. |
| 10 | 38.5 (16.3, 63.0) | b | 69.2 (54.2, 90.1) | a | 0.002 | 53.4 (25.8, 73.1) | b | 50.6 (22.4, 79.4) | a | n.s. | n.s. | |||||
| 20 | 50.9 (20.0, 78.9) | c | 65.0 (48.5, 90.6) | a | 0.029 | 58.4 (26.4, 81.2) | b | 44.3 (27.1, 77.4) | a | n.s. | n.s. | |||||
| %A→F | 29 | −38.3 (−64.8, −20.9) | 33 | 0.7 (−2.1, 14.5) | <0.001 | 30 | −25.3 (−44.6, −10.8) | 31 | 2.6 (−6.4, 24.5) | <0.001 | 0.035 | |||||
| %A→G | 30 | −15.9 (−55.2, −2.1) | 33 | 1.9 (−5.4, 9.3) | <0.001 | 30 | −12.8 (−30.5, −4.9) | 29 | 4.9 (−2.3, 24.9) | <0.001 | n.s. | |||||
| Parameters | Week | HTGI | HTGC | ◊ | PDI | PDC | ◊ | ||||||||
|---|---|---|---|---|---|---|---|---|---|---|---|---|---|---|---|
| n | Characteristics * | ∆ | n | Characteristics * | ∆ | n | Characteristics * | ∆ | n | Characteristics * | ∆ | ||||
| Body fat [kg] | 0 | 29 | 34.6 (27.6, 38.2) | a | 23 | 33.9 (±11.9) 33.7 (24.6, 40.2) | a † | n.s. | 30 | 33.8 (±12.4) | a † | 26 | 27.8 (±13.0) | a † | n.s. † |
| 10 | 29.4 (23.9, 31.1) | b | 32.7 (±11.5) 32.0 (24.7, 37.5) | a † | n.s. | 29.0 (±11.4) | b † | 27.3 (±12.6) | a † | n.s. † | |||||
| 20 | 28.2 (24.5, 35.4) | b | 34.1 (±12.2) 33.3 (25.5, 40.0) | a † | n.s. | 29.0 (±11.2) | b † | 26.8 (±12.3) | a † | n.s. † | |||||
| %A→F | 20 | −14.7 (−19.7, −12.1) | 30 | −2.3 (−5.3, 0.5) | <0.001 | 30 | −15.2 (±11.1) | 30 | −1.7 (±6.0) | <0.001 † | |||||
| %A→G | 30 | −12.9 (±11.0) | 31 | 0.2 (±4.8) | <0.001 † | 30 | −14.6 (−22.0, −6.6) | 28 | −4.3 (−7.2, 1.8) | <0.001 | |||||
| Body fat [%] | 0 | 29 | 40.5 (±8.1) | a † | 23 | 38.7 (±9.8) | a † | n.s. † | 30 | 39.4 (32.0, 43.9) | a | 26 | 33.9 (±10.1) 35.2 (28.2, 39.7) | a † | n.s. |
| 10 | 37.3 (±8.4) | b † | 37.6 (±9.4) | a † | n.s. † | 36.5 (27.4, 42.5) | b | 33.6 (±9.9) 34.9 (27.2, 39.1) | a † | n.s. | |||||
| 20 | 37.8 (±7.7) | b † | 38.8 (±10.1) | a † | n.s. † | 37.3 (26.7, 41.9) | b | 33.3 (±9.9) 33.3 (27.1, 38.8) | a † | n.s. | |||||
| %A→F | 20 | −7.6 (−12.2, −3.8) | 30 | −1.7 (−4.4, 0.4) | <0.001 | 30 | −8.3 (−13.3, −4.6) | 30 | −1.2 (−2.8, 0.4) | <0.001 | |||||
| %A→G | 30 | −6.4 (±7.0) | 31 | 0.3 (±3.9) | <0.001 † | 30 | −8.4 (−11.3, −3.8) | 28 | −2.3 (−3.9, 0.9) | <0.001 | |||||
| Body water [l] | 0 | 29 | 35.7 (32.3, 42.4) | a | 23 | 37.1 (34.5, 43.5) | a | n.s. | 30 | 37.7 (35.4, 44.1) | a | 26 | 35.4 (31.1, 40.7) | a | n.s. |
| 10 | 34.3 (31.6, 42.8) | b | 39.1 (34.8, 43.9) | a | n.s. | 37.4 (34.4, 43.7) | b | 34.9 (31.7, 40.3) | a | n.s. | |||||
| 20 | 34.4 (31.2, 41.0) | b | 38.2 (34.9, 44.0) | a | n.s. | 37.0 (34.6, 43.4) | b | 34.8 (31.6, 40.00) | a | n.s. | |||||
| %A→F | 20 | −2.8 (−3.9, −1.3) | 30 | 0.9 (0.1, 1.8) | <0.001 | 30 | −2.1 (−4.4, −0.7) | 30 | −0.7 (−1.9, 0.9) | 0.030 | |||||
| %A→G | 30 | −3.3 (−5.4, −1.1) | 31 | −0.3 (−1.7, 1.2) | <0.001 | 30 | −3.1 (±3.2) | 28 | −0.8 (±3.5) | 0.012 † | |||||
| Lean body mass [kg] | 0 | 29 | 47.5 (42.4, 57.6) | a | 23 | 48.9 (46.1, 58.7) | a | n.s. | 30 | 51.5 (48.3, 60.2) | a | 26 | 48.4 (42.6, 55.6) | a | n.s. |
| 10 | 46.1 (42.3, 58.4) | b | 51.3 (46.5, 59.5) | a | n.s. | 51.0 (46.9, 59.7) | b | 47.7 (43.3, 55.2) | a | n.s. | |||||
| 20 | 45.9 (41.9, 56.1) | b | 50.2 (46.1, 58.5) | a | n.s. | 50.5 (47.3, 59.3) | b | 47.4 (43.1, 54.7) | a | n.s. | |||||
| %A→F | 20 | −2.1 (−4.1, −1.0) | 30 | 0.7 (0.3, 1.9) | <0.001 | 30 | −2.1 (−4.2, −0.8) | 30 | −0.8 (−2.0, 0.7) | 0.020 | |||||
| %A→G | 30 | −2.4 (−5.2, −0.8) | 31 | −0.4 (−1.5, 0.5) | 0.001 | 30 | −3.1 (±3.3) | 28 | −0.8 (±3.5) | 0.013 † | |||||
| Parameters | Week | HTGI | HTGC | ◊ | ||||
|---|---|---|---|---|---|---|---|---|
| n | Characteristics * | ∆ | n | Characteristics * | ∆ | |||
| Visceral adipose tissue [l] | 0 | 23 | 2.6 (1.9, 3.6) | a | 19 | 2.4 (2.0, 4.4) | a | n.s. |
| 10 | 1.9 (1.4, 3.0) | b | 2.5 (1.9, 4.6) | a | 0.037 | |||
| 20 | 2.0 (1.2, 2.8) | b | 2.6 (1.8, 4.2) | a | 0.032 | |||
| %A→F | 29 | −22.8 (±14.4) | 29 | 0.7 (±13.0) | <0.001 † | |||
| %A→G | 30 | −24.0 (±15.8) | 30 | 0.1 (±17.5) | <0.001 † | |||
| Parameters | Week | HTGI (n = 29) | PDI (n = 30) | ● | ||
|---|---|---|---|---|---|---|
| Characteristics * | ∆ | Characteristics * | ∆ | |||
| Body weight [kg] | 0 | 83.4 (76.5, 90.4) | 89.0 (±17.2) 88.2 (75.4, 100.3) | n.s. | ||
| Min Int | 75.9 (70.7, 86.4) | <0.001 | 82.9 (±15.4) 82.8 (70.6, 90.3) | <0.001 † | n.s. | |
| Min Cfb | −6.6 (±3.4) | −6.1 (±3.4) | n.s. † | |||
| Min Cfb [%] | −7.6 (±3.6) | −6.7 (±3.2) | n.s. † | |||
| LDL cholesterol [mmol/L] | 0 | 3.9 (±0.9) | 3.6 (±0.9) | n.s. † | ||
| Min Int | 2.7 (±0.6) | <0.001 † | 2.8 (±0.7) | <0.001 † | n.s. † | |
| Min Cfb | −1.0 (−1.5, −0.8) | −0.7 (−1.0, −0.6) | 0.004 | |||
| Min Cfb [%] | −27.2 (−35.5, −23.0) | −20.5 (−27.6, −15.4) | 0.004 | |||
| Triglycerides [mmol/L] | 0 | 1.5 (1.1, 2.0) | 1.3 (1.0, 1.7) | n.s. | ||
| Min Int | 0.9 (0.7, 1.1) | <0.001 | 0.9 (0.8, 1.1) | <0.001 | n.s. | |
| Min Cfb | −0.6 (−1.1, −0.2) | −0.3 (−0.7, −0.1) | n.s. | |||
| Min Cfb [%] | −30.3 (±39.9) | −28.3 (±20.5) | n.s. † | |||
| HOMA-IR | 0 | 3.3 (2.5, 4.1) | 2.8 (2.2, 4.4) | n.s. | ||
| Min Int | 1.6 (1.2, 2.1) | <0.001 | 1.9 (1.3, 2.3) | <0.001 | n.s. | |
| Min Cfb | −1.3 (−2.1, −0.8) | −1.1 (−1.8, −0.5) | n.s. | |||
| Min Cfb [%] | −47.4 (±18.5) | −38.7 (±22.9) | n.s. † | |||
| Parameters | Week | HTGI | PDI | ||
|---|---|---|---|---|---|
| n | % | n | % | ||
| Body weight [kg] | 2 | 0 | 0.0 | 0 | 0.0 |
| 4 | 1 | 3.4 | 1 | 3.3 | |
| 6 | 2 | 6.9 | 1 | 3.3 | |
| 8 | 4 | 13.8 | 7 | 23.3 | |
| 10 | 22 | 75.9 | 21 | 70.0 | |
| LDL cholesterol [mmol/L] | 2 | 9 | 31.0 | 10 | 33.3 |
| 4 | 3 | 10.3 | 8 | 26.7 | |
| 6 | 5 | 17.2 | 3 | 10.0 | |
| 8 | 4 | 13.8 | 3 | 10.0 | |
| 10 | 8 | 27.6 | 6 | 20.0 | |
| Triglycerides [mmol/L] | 2 | 3 | 10.3 | 12 | 40.0 |
| 4 | 9 | 31.0 | 3 | 10.0 | |
| 6 | 4 | 13.8 | 6 | 20.0 | |
| 8 | 4 | 13.8 | 3 | 10.0 | |
| 10 | 9 | 31.0 | 6 | 20.0 | |
| HOMA-IR | 2 | 2 | 6.9 | 5 | 16.7 |
| 4 | 8 | 27.6 | 5 | 16.7 | |
| 6 | 2 | 6.9 | 8 | 26.7 | |
| 8 | 6 | 20.7 | 5 | 16.7 | |
| 10 | 11 | 37.9 | 7 | 23.3 | |
| Parameters [% FAME] | Week | HTGI | HTGC | ◊ | PDI | PDC | ◊ | ● | ||||||||
|---|---|---|---|---|---|---|---|---|---|---|---|---|---|---|---|---|
| n | Characteristics * | ∆ | n | Characteristics * | ∆ | n | Characteristics * | ∆ | n | Characteristics * | ∆ | |||||
| C14:0 | 0 | 26 | 0.3 (±0.1) 0.3 (0.3, 0.4) | a | 28 | 0.3 (±0.1) | a † | n.s. † | 29 | 0.3 (±0.1) 0.3 (0.3, 0.4) | a | 27 | 0.3 (±0.1) | a † | n.s. † | n.s. † |
| 10 | 0.2 (0.2, 0.2) | b | 0.3 (±0.1) 0.3 (0.3, 0.4) | b † | <0.001 | 0.2 (0.2, 0.3) | b | 0.31 (±0.1) 0.3 (0.3, 0.4) | a † | <0.001 | n.s. | |||||
| 20 | 0.3 (±0.1) 0.3 (0.2, 0.3) | a | 0.3 (±0.1) | b † | n.s. † | 0.3 (±0.1) 0.3 (0.2, 0.3) | a | 0.3 (±0.1) | a † | n.s. † | n.s. † | |||||
| %A→F | 27 | −34.6 (±19.9) −40.1 (−49.0, −18.0) | 28 | 9.7 (±22.6) | <0.001 † | 29 | −32.0 (−42.8, −11.9) | 29 | 24.0 (−5.9, 38.0) | <0.001 | n.s. | |||||
| %A→G | 28 | 1.5 (−17.5, 14.4) | 30 | 13.4 (−0.6, 32.3) | 0.032 | 29 | −15.5 (−33.2, 5.1) | 28 | 11.1 (−13.0, 32.6) | 0.013 | n.s. | |||||
| C15:0 | 0 | 28 | 0.2 (±0.0) 0.2 (0.1, 0.2) | a † | 30 | 0.2 (0.1, 0.2) | a | n.s. | 30 | 0.2 (0.2, 0.2) | a,b | 27 | 0.2 (±0.0) 0.2 (0.1, 0.2) | a † | n.s. | n.s. |
| 10 | 0.2 (±0.0) | b † | 0.2 (±0.0) 0.2 (0.1, 0.2) | a | n.s. † | 0.2 (±0.0) 0.2 (0.2, 0.2) | a | 0.2 (±0.0) | a † | n.s. † | 0.015 † | |||||
| 20 | 0.2 (±0.0) | a † | 0.2 (±0.0) 0.2 (0.1, 0.2) | a | n.s. † | 0.2 (±0.0) 0.2 (0.2, 0.2) | b | 0.2 (±0.0) | a † | n.s. † | n.s. † | |||||
| %A→F | 28 | −13.0 (−26.3, −4.2) | 30 | −2.4 (−10.8, 9.0) | 0.043 | 30 | 2.8 (−7.5, 11.6) | 29 | 7.4 (−4.8, 21.9) | n.s. | 0.003 | |||||
| %A→G | 30 | −4.5 (±17.4) −0.9 (−13.4, 4.7) | 32 | 1.4 (±22.8) | n.s. † | 30 | −3.8 (−12.1, 6.2) | 28 | 1.4 (−7.4, 9.7) | n.s. | n.s. | |||||
| C16:0 | 0 | 28 | 21.3 (20.8, 22.7) | a | 30 | 21.0 (19.5, 21.6) | a | n.s. | 30 | 20.2 (19.3, 21.5) | a | 27 | 20.3 (19.2, 22.3) | a | n.s. | 0.042 |
| 10 | 21.4 (±2.6) 21.4 (19.5, 23.3) | a | 20.8 (±2.0) 20.9 (19.2, 21.9) | a | n.s. † | 21.6 (20.8, 22.2) | b | 21.5 (20.6, 22.5) | a | n.s. | n.s. | |||||
| 20 | 20.6 (±1.4) 20.6 (19.8, 21.4) | a | 20.7 (19.3, 21.6) | a | n.s. | 19.7 (±1.1) 19.8 (19.0, 20.5) | c | 19.4 (±1.0) 19.6 (18.7, 20.0) | b | n.s. † | 0.005 † | |||||
| %A→F | 28 | −0.9 (±18.2) −2.0 (−11.7, 12.2) | 30 | 1.1 (±11.5) | n.s. † | 30 | 3.9 (−2.3, 14.8) | 29 | 5.0 (−3.9, 25.7) | n.s. | n.s. | |||||
| %A→G | 30 | −3.9 (−15.3, 3.3) | 32 | −2.0 (−7.0, 7.3) | n.s. | 30 | −6.6 (−8.8, 1.0) | 28 | −3.4 (−11.6, −1.3) | n.s. | n.s. | |||||
| C17:0 | 0 | 28 | 0.3 (±0.1) | a † | 30 | 0.3 (±0.0) | a † | 0.049 † | 30 | 0.3 (±0.0) 0.3 (0.2, 0.3) | a † | 27 | 0.3 (0.2, 0.3) | a | n.s. | n.s. † |
| 10 | 0.3 (±0.0) | a † | 0.3 (±0.0) | a † | 0.004 † | 0.3 (±0.0) 0.3 (0.3, 0.3) | b † | 0.3 (0.3, 0.3) | b | n.s. | n.s. † | |||||
| 20 | 0.3 (±0.0) | a † | 0.3 (±0.1) | a † | n.s. † | 0.3 (±0.0) | c † | 0.3 (±0.0) 0.3 (0.3, 0.3) | a,b | n.s. † | n.s. † | |||||
| %A→F | 28 | 8.0 (±21.0) | 30 | 2.9 (±13.2) | n.s. † | 30 | 18.0 (±21.2) 17.3 (10.2, 23.5) | 29 | 6.3 (2.7, 22.3) | n.s. | n.s. † | |||||
| %A→G | 30 | 4.8 (±17.2) 6.3 (−6.1, 16.6) | 32 | 5.7 (−0.1, 14.2) | n.s. | 30 | 9.6 (±14.0) 11.2 (2.4, 17.6) | 28 | 5.2 (−1.8, 10.3) | 0.032 | n.s. † | |||||
| C18:0 | 0 | 28 | 11.2 (10.5, 13.4) | a | 30 | 11.5 (10.4, 12.6) | a | n.s. | 30 | 11.2 (10.5, 12.3) | a,b | 27 | 12.4 (10.3, 13.3) | a | n.s. | n.s. |
| 10 | 11.9 (10.8, 12.6) | a | 12.4 (11.6, 13.2) | b | n.s. | 10.4 (9.7, 11.6) | a | 11.0 (10.4, 12.4) | a | 0.018 | 0.002 | |||||
| 20 | 11.0 (10.1, 12.1) | a | 11.4 (10.6, 13.7) | a,b | n.s. | 11.7 (±1.5) 11.5 (10.6, 12.8) | b | 12.0 (±1.3) 11.8 (10.9, 12.9) | a | n.s. † | n.s. | |||||
| %A→F | 28 | 7.0 (±28.8) | 30 | 9.0 (±21.1) | n.s. † | 30 | −10.0 (±23.2) −8.6 (−20.2, 2.6) | 29 | −4.1 (−16.0, 18.2) | n.s. | 0.016 † | |||||
| %A→G | 30 | 0.7 (±22.7) −1.3 (−16.7, 15.3) | 32 | 6.0 (±25.9) | n.s. † | 30 | 4.6 (−14.5, 15.7) | 28 | −0.7 (−12.9, 15.4) | n.s. | n.s. | |||||
| C18:1c9 | 0 | 27 | 14.5 (13.8, 15.3) | a | 30 | 14.4 (13.8, 15.1) | a | n.s. | 30 | 14.1 (12.9, 15.0) | a | 27 | 13.6 (13.0, 14.5) | a | n.s. | n.s. |
| 10 | 14.3 (13.8, 15.2) | a | 14.7 (13.6, 15.6) | a | n.s. | 15.2 (14.6, 15.7) | b | 14.7 (13.7, 15.4) | b | n.s. | 0.015 | |||||
| 20 | 14.8 (±1.5) 15.0 (14.0, 16.0) | a | 14.9 (13.2, 15.3) | a | n.s. | 14.9 (±1.1) 14.8 (14.4, 15.4) | a,b | 14.6 (±1.0) 14.7 (14.1, 15.1) | b | n.s. † | n.s. † | |||||
| %A→F | 27 | 0.1 (−10.5, 5.5) | 30 | 2.3 (−6.5, 7.2) | n.s. | 30 | 8.6 (0.1, 15.1) | 29 | 7.6 (2.7, 17.3) | n.s. | 0.006 | |||||
| %A→G | 29 | 2.6 (−2.5, 10.6) | 32 | −0.7 (−6.6, 6.7) | n.s. | 30 | 2.2 (−0.2, 9.2) | 28 | 4.0 (0.1, 16.9) | n.s. | n.s. | |||||
| C18:2c9,c12 (LA) | 0 | 28 | 10.1 (±1.5) | a † | 30 | 9.6 (±1.7) 10.0 (8.5, 10.4) | a | n.s. † | 30 | 9.8 (±2.3) | a † | 27 | 10.4 (±1.7) 10.2 (9.4, 11.5) | a | n.s. † | n.s. † |
| 10 | 8.4 (±1.7) 8.4 (7.2, 9.6) | b † | 10.2 (8.8, 11.2) | a | 0.003 | 11.2 (±1.8) 11.1 (9.8, 12.0) | b † | 11.0 (10.2, 12.2) | a | n.s. | <0.001 † | |||||
| 20 | 10.4 (±1.5) | a † | 10.0 (±1.4) 10.1 (9.1, 10.9) | a | n.s. † | 10.8 (±1.3) | a,b † | 10.8 (±1.4) 10.6 (9.9, 11.4) | a | n.s. † | n.s. † | |||||
| %A→F | 28 | −14.8 (±23.9) −14.5 (−32.2, −2.3) | 30 | 2.8 (±19.5) | 0.003 † | 30 | 10.8 (−2.0, 34.6) | 29 | 5.6 (−4.0, 20.3) | n.s. | <0.001 | |||||
| %A→G | 30 | 4.7 (−8.0, 13.2) | 32 | 1.9 (−8.1, 15.4) | n.s. | 30 | 6.5 (−0.5, 22.5) | 28 | 3.2 (−4.7, 16.1) | n.s. | n.s. | |||||
| aC18:3c9,c12,c15 (ALA) | 0 | 28 | 0.2 (0.1, 0.2) | a | 30 | 0.2 (0.2, 0.2) | a | n.s. | 30 | 0.2 (0.1, 0.2) | a | 27 | 0.2 (0.1, 0.2) | a | n.s. | n.s. |
| 10 | 0.2 (0.1, 0.2) | a | 0.2 (0.2, 0.2) | a | n.s. | 0.3 (0.2, 0.3) | b | 0.2 (0.1, 0.2) | a | <0.001 | <0.001 | |||||
| 20 | 0.2 (0.1, 0.2) | a | 0.2 (0.1, 0.2) | a | n.s. | 0.2 (0.2, 0.3) | c | 0.2 (0.1, 0.2) | a | 0.008 | 0.010 | |||||
| %A→F | 28 | −1.1 (±40.0) −6.1 (−28.0, 17.3) | 30 | 0.4 (−19.8, 18.5) | n.s. | 30 | 66.7 (±67.2) | 29 | 11.0 (±32.5) | <0.001 † | <0.001 † | |||||
| %A→G | 30 | −0.1 (±41.8) 1.1 (−33.7, 19.7) | 32 | −7.4 (±26.1) | n.s. † | 30 | 27.0 (−14.1, 50.2) | 28 | 1.2 (−22.2, 29.4) | n.s. | <0.001 | |||||
| CLA-c9,t11/t8,c10 | 0 | 28 | 0.1 (0.1, 0.2) | a | 29 | 0.1 (0.1, 0.2) | a | n.s. | 30 | 0.1 (0.1, 0.2) | a | 27 | 0.1 (0.1, 0.1) | a | n.s. | n.s. |
| 10 | 0.1 (0.1, 0.1) | a,b | 0.1 (0.1, 0.1) | a | n.s. | 0.1 (0.1, 0.1) | b | 0.1 (0.1, 0.1) | a | n.s. | n.s. | |||||
| 20 | 0.1 (±0.0) 0.1 (0.1, 0.1) | b | 0.1 (±0.0) 0.1 (0.1, 0.1) | a | 0.032 † | 0.1 (±0.0) 0.1 (0.1, 0.1) | a,b | 0.1 (±0.0) 0.1 (0.1, 0.1) | a | n.s. † | n.s. † | |||||
| %A→F | 28 | −16.0 (−52.5, 37.2) | 29 | −10.7 (−39.5, 17.1) | n.s. | 30 | −22.1 (−46.9, 10.2) | 29 | −14.4 (−29.1, 1.0) | n.s. | n.s. | |||||
| %A→G | 30 | −25.5 (−42.3, −0.4) | 31 | −22.0 (−43.6, 20.2) | n.s. | 30 | −11.7 (−33.5, 10.0) | 28 | −1.9 (−20.7, 8.7) | n.s. | n.s. | |||||
| DGLA | 0 | 28 | 1.7 (1.6, 1.9) | a | 30 | 1.7 (1.4, 2.0) | a | n.s. | 30 | 1.7 (±0.4) 1.7 (1.4, 1.9) | a | 27 | 1.6 (±0.3) 1.6 (1.4, 1.8) | a | n.s. † | n.s. |
| 10 | 1.2 (±0.4) 1.2 (1.0, 1.5) | b | 1.6 (±0.3) 1.6 (1.4, 1.8) | a | <0.001 † | 1.5 (±0.4) 1.5 (1.2, 1.6) | b | 1.5 (±0.3) 1.5 (1.3, 1.7) | b | n.s. † | 0.019 † | |||||
| 20 | 1.5 (±0.3) 1.5 (1.3, 1.7) | c | 1.6 (±0.3) 1.6 (1.4, 1.8) | a | n.s. † | 1.6 (1.4, 1.9) | a | 1.5 (1.4, 1.8) | a | n.s. | n.s. | |||||
| %A→F | 28 | −30.0 (−49.0, −14.9) | 30 | −8.4 (−14.0, 5.1) | <0.001 | 30 | −11.2 (−24.9, 1.7) | 29 | −8.1 (−17.2, 2.7) | n.s. | 0.001 | |||||
| %A→G | 30 | −14.3 (±18.7) | 32 | −2.3 (±22.6) | 0.027 † | 30 | 2.9 (±20.1) −1.3 (−10.1, 14.7) | 28 | −0.4 (−6.2, 14.5) | n.s. | 0.001 † | |||||
| C20:4c5,c8,c11,c14 (ARA) | 0 | 28 | 13.0 (±1.5) 13.2 (12.2, 13.9) | a † | 30 | 13.3 (±1.7) 13.5 (11.8, 14.3) | a | n.s. † | 30 | 13.4 (11.7, 14.3) | a,b | 27 | 12.9 (11.5, 14.5) | a,b | n.s. | n.s. |
| 10 | 11.1 (±1.6) 11.2 (9.6, 12.3) | b † | 12.4 (±1.5) 12.3 (11.8, 13.6) | a | 0.002 † | 11.9 (11.1, 12.8) | a | 12.3 (11.5, 13.2) | a | n.s. | n.s. | |||||
| 20 | 11.9 (±1.3) 12.0 (11.2, 12.7) | c † | 12.9 (11.5, 13.8) | a | 0.034 | 13.1 (±1.1) 13.4 (12.1, 13.9) | b | 13.3 (±1.6) 13.3 (12.5, 13.8) | b | n.s. † | <0.001 † | |||||
| %A→F | 28 | −12.4 (±19.7) −16.4 (−22.0, −3.8) | 30 | −5.8 (±13.8) | n.s. † | 30 | −7.7 (−15.2, 0.4) | 29 | −5.0 (−18.1, 4.2) | n.s. | n.s. | |||||
| %A→G | 30 | −5.9 (±13.8) −7.4 (−13.9, 5.5) | 32 | −4.8 (±16.2) | n.s. † | 30 | 1.6 (−9.4, 10.9) | 28 | 0.8 (−7.1, 10.0) | n.s. | 0.043 | |||||
| C20:4n3 (ETA) | 0 | 26 | 0.1 (0.1, 0.2) | a | 28 | 0.1 (0.1, 0.2) | a | n.s. | 30 | 0.1 (0.1, 0.2) | a | 27 | 0.1 (0.1, 0.2) | a | n.s. | n.s. |
| 10 | 0.1 (0.1, 0.2) | a | 0.1 (0.1, 0.2) | a | n.s. | 0.1 (0.1, 0.2) | a | 0.1 (0.1, 0.1) | a | n.s. | n.s. | |||||
| 20 | 0.1 (0.1, 0.1) | a | 0.1 (0.1, 0.2) | a | 0.002 | 0.1 (0.1, 0.2) | a | 0.1 (0.1, 0.1) | a | n.s. | n.s. | |||||
| %A→F | 26 | −5.1 (−55.1, 75.2) | 28 | −36.2 (−56.8, 70.8) | n.s. | 30 | −8.9 (−37.9, 41.7) | 29 | −16.7 (−54.7, 19.6) | n.s. | n.s. | |||||
| %A→G | 29 | −36.1 (−62.1, 27.0) | 31 | 3.1 (−40.6, 70.3) | n.s. | 30 | −23.7 (−46.4, 23.6) | 28 | −23.2 (−40.4, 60.7) | n.s. | n.s. | |||||
| C20:5n3 (EPA) | 0 | 28 | 0.8 (0.7, 1.1) | a | 30 | 0.9 (0.7, 1.1) | a | n.s. | 30 | 0.7 (0.7, 0.9) | a | 27 | 0.8 (0.5, 1.0) | a | n.s. | n.s. |
| 10 | 2.7 (±0.8) 2.8 (2.2, 3.1) | b | 0.9 (0.7, 1.0) | a | <0.001 | 0.8 (±0.2) 0.8 (0.7, 1.0) | a,b | 0.7 (0.6, 0.9) | a | n.s. | <0.001 † | |||||
| 20 | 1.6 (1.1, 1.9) | c | 1.0 (0.8, 1.2) | a | <0.001 | 0.9 (0.7, 1.1) | b | 0.8 (0.7, 1.0) | a | n.s. | <0.001 | |||||
| %A→F | 28 | 211.4 (±122.2) 219.1 (119.7, 270.0) | 30 | −3.4 (−21.9, 18.0) | <0.001 | 30 | 3.7 (±33.4) 3.7 (−25.2, 19.0) | 29 | −2.2 (−21.5, 16.2) | n.s. | <0.001 † | |||||
| %A→G | 30 | 61.8 (28.7, 149.5) | 32 | 11.5 (−8.7, 26.1) | <0.001 | 30 | 19.5 (−8.0, 34.5) | 28 | 6.1 (−6.0, 23.1) | n.s. | <0.001 | |||||
| C22:4n6 | 0 | 28 | 2.5 (2.1, 3.4) | a | 30 | 2.9 (2.3, 3.5) | a | n.s. | 30 | 3.1 (2.3, 3.5) | a | 27 | 3.1 (2.7, 3.7) | a,b | n.s. | n.s. |
| 10 | 2.7 (±0.9) 2.6 (2.1, 3.1) | a,b | 3.0 (2.6, 3.4) | a | n.s. | 3.1 (±0.7) 3.0 (2.7, 3.5) | a | 3.6 (3.0, 3.7) | a | n.s. | n.s. † | |||||
| 20 | 2.4 (±0.6) 2.4 (2.1, 2.9) | b | 2.9 (±0.6) 3.0 (2.5, 3.3) | a | <0.001 † | 2.9 (±0.5) 2.8 (2.5, 3.2) | a | 3.1 (2.7, 3.4) | b | n.s. | 0.001 † | |||||
| %A→F | 28 | −1.4 (−30.1, 8.5) | 30 | 6.1 (−1.3, 23.1) | 0.037 | 30 | −3.0 (−9.8, 29.8) | 29 | 3.9 (−8.1, 24.1) | n.s. | n.s. | |||||
| %A→G | 30 | −19.4 (−30.0, −3.2) | 32 | −0.9 (−10.6, 16.5) | 0.001 | 30 | −7.3 (−16.0, 17.1) | 28 | −2.4 (−14.9, 11.8) | n.s. | 0.044 | |||||
| C22:5n6 | 0 | 28 | 0.4 (0.4, 0.9) | a | 30 | 0.4 (0.3, 0.6) | a | n.s. | 30 | 0.6 (0.4, 1.0) | a | 27 | 0.8 (0.5, 1.1) | a,b | n.s. | n.s. |
| 10 | 0.8 (0.5, 1.1) | a | 0.7 (0.5, 1.0) | b | n.s. | 0.9 (0.7, 1.0) | a | 0.9 (0.8, 1.1) | a | n.s. | n.s. | |||||
| 20 | 0.6 (0.6, 0.7) | a | 0.7 (0.5, 0.9) | b | n.s. | 0.7 (±0.2) 0.7 (0.6, 0.8) | a | 0.7 (±0.2) 0.7 (0.6, 0.8) | b | n.s. † | n.s. | |||||
| %A→F | 28 | 49.7 (−15.0, 150.3) | 30 | 99.5 (2.6, 165.8) | n.s. | 30 | 8.8 (−28.7, 109.1) | 29 | 15.3 (−24.0, 93.8) | n.s. | n.s. | |||||
| %A→G | 30 | 20.8 (−38.8, 59.7) | 32 | 39.7 (−14.5, 127.0) | n.s. | 30 | −5.2 (−42.4, 66.4) | 28 | −11.2 (−45.8, 85.1) | n.s. | n.s. | |||||
| C22:5n3 (DPA) | 0 | 28 | 2.3 (2.0, 2.6) | a | 30 | 2.2 (2.0, 2.7) | a | n.s. | 30 | 2.3 (±0.7) 2.3 (2.0, 2.7) | a † | 27 | 2.5 (±0.6) | a † | n.s. † | n.s. |
| 10 | 3.4 (2.9, 3.9) | b | 2.4 (2.1, 2.9) | a,b | <0.001 | 2.5 (±0.6) 2.6 (2.2, 2.9) | a,b † | 2.5 (±0.6) | a † | n.s. † | <0.001 | |||||
| 20 | 3.2 (±0.5) 3.1 (2.9, 3.5) | b | 2.6 (±0.4) 2.6 (2.3, 2.8) | b | <0.001 † | 2.6 (±0.3) | b † | 2.7 (±0.3) | a † | n.s. † | <0.001 † | |||||
| %A→F | 28 | 53.4 (15.4, 94.5) | 30 | 4.7 (−7.5, 15.8) | 0.001 | 30 | 5.3 (−4.5, 35.1) | 29 | 10.5 (−16.8, 20.1) | n.s. | 0.003 | |||||
| %A→G | 30 | 34.6 (19.4, 58.8) | 32 | 7.5 (−0.6, 20.1) | <0.001 | 30 | 16.1 (−0.6, 27.7) | 28 | 11.6 (−6.5, 23.1) | n.s. | 0.005 | |||||
| C22:6n3 (DHA) | 0 | 28 | 3.8 (3.2, 4.4) | a | 30 | 3.9 (±1.2) 3.7 (3.1, 4.7) | a † | n.s. | 30 | 3.9 (±1.0) 3.9 (3.3, 4.7) | a † | 26 | 4.0 (±0.9) | a † | n.s. † | n.s. |
| 10 | 5.0 (4.5, 5.7) | b | 4.0 (±1.1) 4.0 (3.1, 4.8) | a † | 0.001 | 4.4 (±0.9) 4.5 (3.8, 4.8) | a,b † | 3.9 (±0.9) | a † | n.s. † | 0.010 | |||||
| 20 | 4.9 (±0.8) 4.8 (4.4, 5.4) | b | 4.1 (±0.9) | a † | <0.001 † | 4.3 (±0.7) | b † | 4.3 (±0.7) | a † | n.s. † | 0.004 † | |||||
| %A→F | 28 | 35.1 (±41.5) 37.4 (1.1, 66.4) | 30 | 0.7 (−12.4, 15.7) | 0.006 | 30 | 18.6 (±39.4) | 28 | 0.3 (±25.9) | 0.043 † | n.s. † | |||||
| %A→G | 30 | 30.0 (±31.5) 25.8 (10.5, 40.1) | 32 | 9.1 (±22.3) | 0.003 † | 30 | 6.6 (−2.8, 21.1) | 27 | 12.0 (−7.9, 20.4) | n.s. | 0.010 | |||||
| n-3 index | 0 | 28 | 4.7 (4.1, 5.4) | a | 30 | 4.4 (3.8, 5.8) | a | n.s. | 30 | 4.8 (±1.2) 4.7 (4.0, 5.5) | a † | 26 | 4.9 (±1.1) | a † | n.s. † | n.s. |
| 10 | 7.8 (±1.9) 7.8 (6.9, 8.8) | b | 4.9 (±1.4) 5.2 (3.9, 5.9) | a | <0.001 † | 5.2 (±1.0) | a,b † | 4.7 (±1.1) | a † | n.s. † | <0.001 † | |||||
| 20 | 6.6 (±1.1) 6.7 (5.9, 7.3) | c | 5.0 (4.4, 5.6) | a | <0.001 | 5.3 (±0.8) | b † | 5.3 (±1.1) | a † | n.s. † | <0.001 † | |||||
| %A→F | 28 | 64.6 (±45.0) 61.1 (37.6, 100.0) | 30 | −1.8 (−7.5, 18.6) | <0.001 | 30 | 15.1 (±35.0) | 28 | −0.5 (±22.4) | 0.049 † | <0.001 † | |||||
| %A→G | 30 | 39.2 (±32.3) 36.3 (16.1, 59.2) | 32 | 9.5 (±22.4) | <0.001 † | 30 | 6.3 (−1.3, 22.5) | 27 | 10.9 (−6.0, 21.8) | n.s. | <0.001 | |||||
| SFA | 0 | 27 | 34.9 (33.1, 38.2) | a | 28 | 34.4 (33.6, 35.4) | a | n.s. | 29 | 33.9 (32.5, 35.3) | a | 27 | 34.0 (32.8, 36.9) | a | n.s. | n.s. |
| 10 | 35.1 (33.8, 38.1) | a | 35.3 (33.8, 36.9) | a | n.s. | 33.5 (33.1, 34.9) | a | 34.4 (33.5, 37.3) | a | n.s. | 0.037 | |||||
| 20 | 34.0 (33.2, 35.4) | a | 34.5 (33.8, 36.3) | a | n.s. | 34.1 (±1.2) 33.8 (33.4, 34.9) | a | 34.2 (±1.3) 34.3 (33.4, 35.1) | a | n.s. † | n.s. | |||||
| %A→F | 27 | 1.7 (±18.3) | 28 | 3.1 (±11.1) | n.s. † | 29 | −1.0 (±19.0) −0.4 (−6.5, 4.8) | 29 | 2.4 (−6.2, 12.5) | n.s. | n.s. † | |||||
| %A→G | 29 | −0.4 (−13.73 7.5) | 30 | 1.5 (−2.5, 7.6) | n.s. | 29 | 0.7 (−4.2, 5.5) | 28 | 1.2 (−10.6, 4.0) | n.s. | n.s. | |||||
| MUFA | 0 | 27 | 17.1 (16.3, 17.7) | a | 30 | 17.0 (16.3, 17.5) | a | n.s. | 30 | 16.3 (15.7, 17.6) | a | 27 | 16.2 (15.4, 17.1) | a | n.s. | n.s. |
| 10 | 17.0 (16.2, 17.8) | a | 17.0 (16.3, 18.1) | a | n.s. | 17.8 (17.2, 18.5) | b | 17.2 (16.1, 17.9) | b | n.s. | 0.008 | |||||
| 20 | 17.3 (±1.5) 17.5 (16.4, 18.5) | a | 17.4 (15.5, 18.0) | a | n.s. | 17.3 (±1.2) 17.3 (16.8, 18.0) | a,b | 17.1 (±1.0) 17.2 (16.5, 17.7) | a,b | n.s. † | n.s. † | |||||
| %A→F | 27 | −0.4 (−8.3, 5.0) | 30 | 0.6 (−5.5, 4.1) | n.s. | 30 | 8.8 (1.3, 16.5) | 29 | 5.0 (0.2, 10.7) | n.s. | 0.002 | |||||
| %A→G | 29 | 2.5 (−2.7, 9.1) | 32 | 0.0 (−5.0, 5.1) | n.s. | 30 | 1.8 (−0.9, 8.7) | 28 | 2.6 (−1.2, 12.1) | n.s. | n.s. | |||||
| C18:1c9/C18:0 | 0 | 27 | 1.3 (±0.3) 1.2 (1.1, 1.4) | a | 30 | 1.3 (1.1, 1.4) | a | n.s. | 30 | 1.2 (±0.4) | a † | 27 | 1.1 (±0.3) 1.1 (0.9, 1.4) | a | n.s. † | n.s. † |
| 10 | 1.2 (1.1, 1.4) | a | 1.2 (1.1, 1.3) | a | n.s. | 1.5 (±0.2) 1.4 (1.3, 1.6) | b † | 1.3 (1.2, 1.4) | a | 0.005 | <0.001 | |||||
| 20 | 1.3 (±0.3) 1.3 (1.2, 1.5) | a | 1.3 (1.0, 1.4) | a | n.s. | 1.3 (±0.2) | a † | 1.2 (±0.2) 1.2 (1.1, 1.4) | a | n.s. † | n.s. † | |||||
| %A→F | 27 | −8.8 (−22.4, 16.0) | 30 | −8.1 (−17.1, 9.2) | n.s. | 30 | 16.8 (2.8, 39.5) | 29 | 17.3 (−6.5, 32.6) | n.s. | 0.004 | |||||
| %A→G | 29 | 2.4 (−16.0, 34.9) | 32 | −2.9 (−18.2, 22.6) | n.s. | 30 | −1.0 (−12.3, 29.2) | 28 | 6.9 (−6.7, 20.8) | n.s. | n.s. | |||||
| PUFA | 0 | 26 | 37.6 (36.7, 38.7) | a | 28 | 37.8 (36.3, 38.8) | a | n.s. | 29 | 38.8 (36.9, 39.2) | a | 26 | 38.4 (36.2, 39.6) | a | n.s. | n.s. |
| 10 | 37.6 (36.0, 38.7) | a | 37.1 (35.3, 38.9) | a | n.s. | 38.3 (37.4, 39.1) | a | 38.1 (36.4, 39.7) | a | n.s. | n.s. | |||||
| 20 | 38.1 (36.8, 38.5) | a | 37.7 (36.9, 38.4) | a | n.s. | 38.1 (±1.0) 38.1 (37.4, 38.9) | a | 38.4 (±1.0) 38.5 (37.9, 38.7) | a | n.s. † | n.s. | |||||
| %A→F | 26 | 0.2 (−8.8, 5.4) | 28 | 1.0 (−5.7, 5.3) | n.s. | 29 | 1.0 (−3.0, 3.7) | 28 | 1.2 (−6.9, 3.6) | n.s. | n.s. | |||||
| %A→G | 29 | 1.1 (−3.7, 4.8) | 31 | −0.1 (−4.0, 2.5) | n.s. | 30 | −0.5 (−2.4, 2.6) | 27 | 0.3 (−1.7, 6.4) | n.s. | n.s. | |||||
| n-6 PUFA | 0 | 28 | 29.3 (±2.9) 29.9 (27.7, 31.0) | a † | 29 | 29.0 (±2.9) | a † | n.s. † | 29 | 30.7 (29.4, 31.5) | a | 27 | 30.3 (28.1, 31.4) | a | n.s. | n.s. |
| 10 | 25.1 (±2.7) 25.2 (23.5, 26.3) | b † | 28.7 (±2.2) | a † | <0.001 † | 29.6 (28.3, 30.1) | a | 30.1 (29.1, 31.2) | a | n.s. | <0.001 | |||||
| 20 | 27.3 (±1.8) | c † | 28.6 (±2.5) | a † | 0.032 † | 29.6 (±1.0) 29.8 (29.3, 30.4) | a | 30.2 (29.4, 30.8) | a | n.s. | <0.001 † | |||||
| %A→F | 28 | −15.0 (−21.1, −9.9) | 29 | 1.0 (−7.8, 4.1) | <0.001 | 29 | −2.5 (−6.6, 1.7) | 29 | −0.8 (−7.9, 3.7) | n.s. | <0.001 | |||||
| %A→G | 30 | −6.4 (−9.1, −2.0) | 32 | −2.2 (−6.7, 1.6) | n.s. | 30 | −1.7 (−5.0, 1.2) | 28 | −0.6 (−2.9, 4.5) | n.s. | 0.004 | |||||
| n-3 PUFA | 0 | 26 | 7.7 (6.9, 8.8) | a | 28 | 7.7 (6.8, 8.7) | a | n.s. | 30 | 7.6 (±1.6) 7.4 (6.8, 8.4) | a | 26 | 7.9 (±1.5) | a † | n.s. † | n.s. |
| 10 | 12.0 (11.0, 13.0) | b | 8.1 (6.8, 9.1) | a | <0.001 | 8.7 (7.7, 9.2) | b | 7.8 (±1.6) 7.9 (7.3, 8.7) | a † | 0.040 | <0.001 | |||||
| 20 | 10.5 (±1.4) 10.6 (9.6, 11.6) | c | 8.1 (7.4, 8.9) | a | <0.001 | 8.5 (±0.9) 8.5 (7.9, 9.2) | b | 8.4 (±1.2) | a † | n.s. † | <0.001 † | |||||
| %A→F | 26 | 57.0 (23.6, 88.3) | 28 | −1.2 (−10.0, 10.5) | <0.001 | 30 | 12.3 (−0.5, 22.7) | 28 | 4.9 (−12.7, 16.0) | n.s. | <0.001 | |||||
| %A→G | 29 | 35.1 (15.2, 51.8) | 31 | 6.6 (−2.8, 20.7) | <0.001 | 30 | 9.5 (0.2, 15.9) | 27 | 12.4 (−5.5, 17.8) | n.s. | <0.001 | |||||
| n-6/n-3 PUFA | 0 | 26 | 3.8 (±0.9) 3.9 (3.3, 4.3) | a | 28 | 3.8 (±0.8) | a † | n.s. † | 29 | 3.9 (±0.6) 3.9 (3.5, 4.3) | a | 26 | 3.8 (±0.7) | a † | n.s. † | n.s. † |
| 10 | 2.1 (±0.4) 2.0 (1.9, 2.4) | b | 3.8 (±0.9) | a,b † | <0.001 † | 3.5 (3.1, 3.8) | b | 3.8 (±0.7) 3.7 (3.4, 4.1) | a † | n.s. | <0.001 | |||||
| 20 | 2.5 (2.3, 3.0) | c | 3.5 (±0.7) 3.4 (3.2, 3.9) | b † | <0.001 | 3.5 (±0.4) 3.6 (3.1, 3.9) | b | 3.7 (±0.7) | a † | n.s. † | <0.001 | |||||
| %A→F | 26 | −42.1 (±16.2) | 28 | 0.2 (±20.9) | <0.001 † | 29 | −6.8 (±16.5) −9.7 (−18.6, 1.2) | 28 | −4.2 (−9.2, 13.3) | n.s. | <0.001 † | |||||
| %A→G | 29 | −29.1 (−38.2, −18.5) | 31 | −6.9 (−15.9, 2.8) | <0.001 | 30 | −7.2 (±10.9) −7.7 (−12.5, 1.5) | 27 | −4.0 (±15.7) | n.s. † | <0.001 | |||||
| LA/ALA | 0 | 28 | 56.8 (±21.3) | a † | 30 | 49.7 (±14.7) | a † | n.s. † | 30 | 55.2 (±18.5) 52.9 (41.9, 67.4) | a | 27 | 58.5 (±19.7) | a † | n.s. † | n.s. † |
| 10 | 50.1 (±17.9) 47.5 (39.0, 61.4) | a † | 49.4 (±11.1) | a † | n.s. † | 37.8 (33.6, 46.7) | b | 57.6 (±20.0) 58.3 (49.6, 70.3) | a † | <0.001 | 0.026 | |||||
| 20 | 61.1 (±21.2) 59.3 (44.2, 78.7) | a † | 57.2 (±11.0) | b † | n.s. † | 46.8 (40.7, 53.9) | a,b | 61.7 (±17.4) 62.4 (49.3, 72.6) | a † | 0.001 | 0.008 | |||||
| %A→F | 28 | −6.7 (−38.6, 24.5) | 30 | −6.0 (−19.6, 35.5) | n.s. | 30 | −28.7 (−38.2, −6.6) | 29 | −9.0 (−17.8, 22.1) | 0.003 | n.s. | |||||
| %A→G | 30 | −0.2 (−22.1, 49.6) | 32 | 5.7 (−8.9, 44.8) | n.s. | 30 | −18.9 (−27.9, 18.8) | 28 | 6.8 (−22.6, 27.6) | n.s. | 0.046 | |||||
| TFA | 0 | 28 | 0.6 (0.5, 0.8) | a | 30 | 0.6 (0.5, 0.7) | a | n.s. | 30 | 0.5 (0.5, 0.6) | a | 27 | 0.5 (0.5, 0.6) | a | n.s. | 0.040 |
| 10 | 0.6 (±0.1) 0.5 (0.5, 0.6) | b | 0.5 (0.5, 0.6) | a | n.s. | 0.6 (±0.2) 0.6 (0.5, 0.7) | a | 0.5 (0.5, 0.6) | a | n.s. | n.s. † | |||||
| 20 | 0.6 (0.5, 0.7) | a | 0.6 (0.5, 0.7) | a | n.s. | 0.6 (0.5, 0.6) | a | 0.6 (0.5, 0.7) | a | n.s. | n.s. | |||||
| %A→F | 28 | −13.1 (±33.8) | 30 | 4.0 (±37.1) | n.s. † | 30 | 11.6 (±33.1) | 29 | 3.9 (±32.8) | n.s. † | 0.007 † | |||||
| %A→G | 30 | −2.6 (±43.3) −8.4 (−37.9, 17.0) | 32 | 11.3 (−8.9, 31.7) | n.s. | 30 | 6.9 (±23.3) 10.6 (−10.3, 19.3) | 28 | 16.5 (−5.8, 30.0) | n.s. | n.s. † | |||||
| EPA/ALA | 0 | 28 | 4.7 (3.6, 6.3) | a | 30 | 4.4 (2.8, 6.4) | a | n.s. | 30 | 4.3 (3.32 5.5) | a | 27 | 3.9 (3.4, 5.1) | a,b | n.s. | n.s. |
| 10 | 14.9 (12.0, 18.9) | b | 4.2 (3.5, 5.6) | a | <0.001 | 2.9 (2.3, 3.3) | b | 3.9 (3.2, 4.8) | a | <0.001 | <0.001 | |||||
| 20 | 8.4 (6.9, 10.1) | c | 5.8 (4.5, 7.0) | b | <0.001 | 4.0 (3.2, 5.0) | a | 4.9 (3.4, 6.0) | b | n.s. | <0.001 | |||||
| %A→F | 28 | 222.8 (141.2, 307.3) | 30 | −3.2 (−22.8, 22.6) | <0.001 | 30 | −31.2 (−49.8, −23.4) | 29 | −13.7 (−23.9, 1.6) | <0.001 | <0.001 | |||||
| %A→G | 30 | 75.7 (32.8, 157.1) | 32 | 19.7 (−4.6, 56.6) | <0.001 | 30 | −2.8 (−32.9, 16.4) | 28 | 10.2 (−12.0, 35.8) | 0.048 | <0.001 | |||||
| DPA/ALA | 0 | 28 | 13.0 (9.0, 16.0) | a | 30 | 12.4 (8.6, 16.5) | a | n.s. | 30 | 11.7 (9.0, 17.1) | a | 27 | 14.6 (±6.9) 14.1 (9.9, 17.1) | a † | n.s. | n.s. |
| 10 | 21.3 (±9.6) 18.6 (15.3, 26.8) | b | 12.9 (9.9, 14.8) | a | <0.001 | 9.5 (±3.8) 9.1 (6.3, 11.4) | b | 13.5 (±5.5) | a † | 0.003 † | <0.001 † | |||||
| 20 | 19.1 (±8.4) 16.9 (12.7, 23.2) | b | 15.1 (±3.9) 14.8 (13.6, 17.2) | a | 0.025 † | 11.9 (±3.6) 12.0 (9.4, 14.2) | a,b | 15.2 (±4.5) | a † | 0.003 † | <0.001 † | |||||
| %A→F | 28 | 38.5 (14.9, 134.9) | 30 | 0.6 (−25.7, 55.4) | 0.007 | 30 | −30.4 (−51.7, −0.4) | 29 | −4.9 (−29.0, 24.4) | 0.035 | <0.001 | |||||
| %A→G | 30 | 44.1 (2.1, 115.9) | 32 | 14.3 (−11.6, 73.1) | n.s. | 30 | −13.3 (−31.4, 41.3) | 28 | 2.6 (−9.1, 37.7) | n.s. | 0.002 | |||||
| DHA/ALA | 0 | 28 | 22.6 (14.2, 28.9) | a | 30 | 19.1 (13.1, 25.8) | a | n.s. | 30 | 23.0 (±10.5) 22.0 (13.1, 30.9) | a † | 26 | 22.4 (±8.9) | a † | n.s. † | n.s. |
| 10 | 30.8 (±12.3) 28.2 (22.5, 35.6) | b | 20.4 (±7.6) 18.9 (15.6, 24.4) | a | <0.001 † | 16.4 (±6.6) | b † | 20.6 (±8.7) | a † | 0.047 † | <0.001 † | |||||
| 20 | 29.4 (±12.1) 27.2 (22.4, 35.6) | b | 23.8 (±6.4) 24.6 (19.9, 28.1) | a | 0.035 † | 19.9 (±7.2) | a † | 24.5 (±9.0) | a † | 0.036 † | <0.001 † | |||||
| %A→F | 28 | 36.2 (−2.1, 98.5) | 30 | −8.4 (−27.7, 38.3) | 0.023 | 30 | −24.8 (−51.1, −9.9) | 28 | −4.0 (−18.1, 12.6) | 0.031 | <0.001 | |||||
| %A→G | 30 | 35.6 (4.1, 84.8) | 32 | 12.2 (−10.1, 60.9) | n.s. | 30 | −15.3 (−30.4, 26.1) | 27 | 5.7 (−6.5, 27.8) | n.s. | 0.004 | |||||
| ARA/LA | 0 | 28 | 1.3 (±0.2) | a † | 30 | 1.4 (±0.3) | a † | n.s. † | 30 | 1.3 (±0.3) | a † | 27 | 1.3 (±0.3) | a † | n.s. † | n.s. † |
| 10 | 1.4 (±0.3) | a † | 1.3 (±0.3) | b † | n.s. † | 1.1 (±0.2) | b † | 1.1 (±0.2) | b † | n.s. † | <0.001 † | |||||
| 20 | 1.2 (±0.2) | b † | 1.3 (±0.2) | b † | n.s. † | 1.2 (±0.2) | c † | 1.3 (±0.2) | a † | n.s. † | n.s. † | |||||
| %A→F | 28 | 6.8 (±23.6) | 30 | −6.2 (±17.5) | 0.020 † | 30 | −17.3 (±21.5) | 29 | −9.8 (±19.7) | n.s. † | <0.001 † | |||||
| %A→G | 30 | −8.7 (±20.3) | 32 | −7.9 (±20.4) | n.s. † | 30 | −5.0 (±18.5) | 28 | 1.2 (±19.4) | n.s. † | n.s. † | |||||
| ARA/EPA | 0 | 28 | 15.9 (11.6, 19.8) | a | 30 | 15.0 (12.9, 19.2) | a | n.s. | 30 | 15.9 (13.8, 18.1) | a | 27 | 17.6 (±7.0) 16.8 (12.3, 22.3) | a † | n.s. | n.s. |
| 10 | 4.1 (3.4, 5.1) | b | 15.7 (11.6, 18.0) | a | <0.001 | 14.8 (12.6, 17.1) | a | 16.5 (±6.5) 15.7 (12.5, 19.9) | a † | n.s. | <0.001 | |||||
| 20 | 8.1 (5.8, 11.1) | c | 13.1 (10.8, 16.0) | a | <0.001 | 15.0 (±4.4) 14.7 (11.7, 17.3) | a | 16.8 (±7.0) | a † | n.s. † | <0.001 | |||||
| %A→F | 28 | −73.7 (−77.2, −61.7) | 30 | 1.7 (−21.7, 21.6) | <0.001 | 30 | −5.0 (−23.1, 12.0) | 29 | −7.2 (−15.8, 10.3) | n.s. | <0.001 | |||||
| %A→G | 30 | −41.5 (±24.8) | 32 | −10.7 (±25.5) | <0.001 † | 30 | −4.3 (±30.7) | 28 | −2.0 (±32.5) | n.s. † | <0.001 † | |||||
| ARA/DHA | 0 | 28 | 3.5 (±1.0) | a † | 30 | 3.7 (±1.0) 3.7 (3.0, 4.3) | a | n.s. † | 30 | 3.4 (±0.7) | a † | 26 | 3.3 (±0.8) | a † | n.s. † | n.s. † |
| 10 | 2.3 (±0.7) | b † | 3.4 (±1.2) 3.2 (2.5, 4.0) | a,b | <0.001 † | 2.8 (±0.5) | b † | 3.1 (±0.7) | a † | 0.035 † | 0.004 † | |||||
| 20 | 2.5 (±0.5) 2.4 (2.2, 2.7) | b † | 3.3 (2.4, 3.5) | b | 0.004 | 3.1 (±0.4) | c † | 3.2 (±0.8) | a † | n.s. † | <0.001 † | |||||
| %A→F | 28 | −34.7 (−45.3, −19.1) | 30 | −3.5 (−20.1, 4.9) | <0.001 | 30 | −16.2 (−28.2, −4.3) | 28 | −6.2 (−20.3, 1.0) | n.s. | 0.007 | |||||
| %A→G | 30 | −28.3 (−38.8, −14.6) | 32 | −13.7 (−20.4, −3.6) | 0.003 | 30 | −6.9 (−13.5, −1.4) | 27 | −3.4 (−14.6, 10.1) | n.s. | <0.001 | |||||
Disclaimer/Publisher’s Note: The statements, opinions and data contained in all publications are solely those of the individual author(s) and contributor(s) and not of MDPI and/or the editor(s). MDPI and/or the editor(s) disclaim responsibility for any injury to people or property resulting from any ideas, methods, instructions or products referred to in the content. |
© 2024 by the authors. Licensee MDPI, Basel, Switzerland. This article is an open access article distributed under the terms and conditions of the Creative Commons Attribution (CC BY) license (https://creativecommons.org/licenses/by/4.0/).
Share and Cite
Braun, T.S.; Drobner, T.; Kipp, K.; Kiehntopf, M.; Schlattmann, P.; Lorkowski, S.; Dawczynski, C. Validation of Nutritional Approaches to Modulate Cardiovascular and Diabetic Risk Factors in Patients with Hypertriglyceridemia or Prediabetes—The MoKaRi II Randomized Controlled Study. Nutrients 2024, 16, 1261. https://doi.org/10.3390/nu16091261
Braun TS, Drobner T, Kipp K, Kiehntopf M, Schlattmann P, Lorkowski S, Dawczynski C. Validation of Nutritional Approaches to Modulate Cardiovascular and Diabetic Risk Factors in Patients with Hypertriglyceridemia or Prediabetes—The MoKaRi II Randomized Controlled Study. Nutrients. 2024; 16(9):1261. https://doi.org/10.3390/nu16091261
Chicago/Turabian StyleBraun, Theresa S., Timo Drobner, Kristin Kipp, Michael Kiehntopf, Peter Schlattmann, Stefan Lorkowski, and Christine Dawczynski. 2024. "Validation of Nutritional Approaches to Modulate Cardiovascular and Diabetic Risk Factors in Patients with Hypertriglyceridemia or Prediabetes—The MoKaRi II Randomized Controlled Study" Nutrients 16, no. 9: 1261. https://doi.org/10.3390/nu16091261
APA StyleBraun, T. S., Drobner, T., Kipp, K., Kiehntopf, M., Schlattmann, P., Lorkowski, S., & Dawczynski, C. (2024). Validation of Nutritional Approaches to Modulate Cardiovascular and Diabetic Risk Factors in Patients with Hypertriglyceridemia or Prediabetes—The MoKaRi II Randomized Controlled Study. Nutrients, 16(9), 1261. https://doi.org/10.3390/nu16091261