Abstract
Background/Objectives: Glucose and lipid metabolism during pregnancy are crucial for perinatal outcomes. Recently, chrono-nutritional factors have been partially identified as influencing pregnancy metabolism. This study aimed to investigate overnight fasting duration and meal frequency during pregnancy and to clarify their associations with glucose and lipid metabolism. Methods: This cross-sectional study was conducted at a university hospital in Tokyo, Japan, between February 2020 and June 2021. A self-administered questionnaire was used to evaluate overnight fasting duration and meal frequency in 144 pregnant women in their second trimester. Nutrient intake was assessed using the brief-type self-administered diet history questionnaire. Non-fasting blood samples were collected and analyzed for levels of total cholesterol, triglycerides, high-density lipoprotein cholesterol, low-density lipoprotein cholesterol, and glycated albumin. Results: The mean ± standard deviation of overnight fasting duration was 12.1 ± 1.5 h, meal frequency was 3.8 ± 0.9 times per day, and glycated albumin level was 13.3 ± 1.0%. Multivariate analysis revealed that a longer overnight fasting duration was significantly associated with lower glycated albumin levels (β = −0.167, p = 0.030). Conclusions: These findings suggest that, in addition to meal content and quantity, overnight fasting may be effective in appropriately managing glycated albumin levels during the second trimester of pregnancy.
1. Introduction
Glucose and lipid metabolism change significantly during pregnancy. Gestational hyperglycemia has been associated with perinatal outcomes such as fetal macrosomia, neonatal hypoglycemia, neonatal adiposity, and increased risk of childhood obesity. These outcomes are present even when blood glucose levels are below the standard diagnostic values for gestational diabetes mellitus (GDM) [1,2]. Maintaining an adequate level of blood glucose can improve perinatal outcomes [3,4].
Dyslipidemia during pregnancy is associated with GDM, preeclampsia, premature birth, and other adverse outcomes [5,6]. Elevated high-density lipoprotein cholesterol (HDL-C) levels during pregnancy reduce the risk of GDM and macrosomia, while increased triglycerides (TG) during the third trimester increase the risk of GDM, preeclampsia, large for gestational age (LGA), macrosomia, and premature birth [5]. Furthermore, TG levels during early pregnancy are linearly associated with an increased risk of pregnancy-induced hypertension (PIH), preeclampsia, LGA, and premature birth [7]. Low-density lipoprotein cholesterol (LDL-C) in the second trimester is correlated with a higher risk of macrosomia [6]. Therefore, appropriate control of glucose and lipid metabolism during pregnancy is crucial for preventing adverse perinatal outcomes.
Recently, chrono-nutrition has become noticeable. Circadian rhythms are synchronized by light-induced and light-dark cycles and environmental factors. Furthermore, synchronization by mealtime has been studied extensively as an important factor [8,9,10,11]. Since humans’ circadian rhythm regulates glucose and lipid metabolism [12,13], dietary habits, such as intervals between meals (fasting duration) and meal frequency, may have important effects on metabolism. However, in previous studies, the metabolic effects of fasting duration and meal frequency were inconsistent. A meta-analysis suggested that increased meal frequency may be associated with decreased fat mass, decreased body fat percentage, and increased fat-free mass in adults [14]. Nevertheless, a review suggested that a lower meal frequency (without skipping breakfast) with regular fasting times may have physiological benefits such as reduced inflammation, improved circadian rhythm, increased autophagy and stress resistance, and modulation of gut microbiota [15]. These findings indicate that the effects of fasting duration and meal frequency on metabolism remain controversial and require further investigation.
Most studies have focused on diet amount and content to improve glucose and lipid metabolism during pregnancy [16]. Only a few studies have focused on the impact of chrono-nutritional variables such as fasting duration and meal frequency, which should also be considered in pregnant women. A cross-sectional cohort study in Singapore reported that increased overnight fasting duration and decreased meal frequency reduced fasting blood glucose and 2 h oral glucose tolerance test (OGTT) glucose levels, respectively [17]. To assess the effects of overnight fasting duration and meal frequency on glucose metabolism accurately, it is essential to conduct studies over several weeks using biomarkers that remain stable regardless of blood glucose fluctuations (e.g., those caused by recent meals or physical activity) and are not influenced by circadian rhythms. Additionally, there is a lack of previous research examining the impact of these factors on lipid metabolism. Considering that changes in both glucose and lipid metabolism significantly influence the health outcomes of pregnant women and their offspring, further investigation into these effects is warranted.
This study aimed to identify the overnight fasting duration and meal frequency during pregnancy and clarify their effects on glucose and lipid metabolism. This study hypothesized that nutrition intake along the circadian rhythm can be achieved in pregnant women with a long overnight fasting period, and that glucose and lipid metabolism could be successfully maintained. Moreover, this study considered that a higher meal frequency would correspond to a shorter meal interval, and a higher energy intake would result in a higher glucose and lipid metabolism index.
2. Materials and Methods
2.1. Study Design and Participants
This study is a part of the Japan Pregnancy Eating and Activity Cohort (J-PEACH) study, which was initiated in 2020. The J-PEACH study is a multicenter study (Yamagata, Tokyo, Osaka, and Fukuoka) of lifestyle and health during and after pregnancy [18]. In this study, participants were limited to those from Tokyo because blood samples could only be obtained during antenatal check-ups at the hospital in the city.
This cross-sectional study was conducted at the obstetric outpatient department of a university hospital in Tokyo, Japan, which performs approximately 1000 labors per year. Participants were recruited from February 2020 to June 2021. Due to the novel coronavirus disease 2019 (COVID-19) pandemic, recruitments at the outpatient department were suspended between 2 April and 6 July. The eligibility criteria included pregnant women above the age of 18 years in the first to second trimester, who visited the hospital for antenatal check-ups and could read and write in Japanese. The exclusion criteria were defined as pregnant women who were not scheduled for delivery at the study hospital or were judged by the medical staff as not suitable for participation in the research. Data from women with a history of dyslipidemia or glucose intolerance, those diagnosed with gestational diabetes mellitus (GDM) at the time of questionnaire response or blood sampling, those experiencing severe nausea and vomiting at the time of questionnaire response, and those with multiple pregnancies were excluded from the data analysis to eliminate potential confounding factors.
The required sample size was determined using G*Power 3.1 [19]. The required sample size for performing multiple regression analysis was calculated to be 92 participants, assuming an effect size of 0.15 and five covariates. For comparisons among groups, sample size calculations were based on TG and GA values from previous studies [7,20]. Specifically, a one-way analysis of variance (ANOVA) was used, assuming an effect size of 0.30, an alpha level of 0.05, 80% power, and three groups. This resulted in a final required sample size of 111 women for this study.
2.2. Procedures
The eligible participants were recruited by researchers in the outpatient waiting room. Moreover, an e-mail address was obtained from the agreed participants. The self-administered questionnaire survey and blood tests were performed in the second trimester of pregnancy. The questionnaire was initially prepared on paper and filled out while waiting for antenatal check-ups but was switched to an online version in May 2020 due to the COVID-19-triggered suspension of in-hospital surveys. The online questionnaires were e-mailed to participants after gestational week 18, and their responses were received by gestational week 26. The questionnaire was resent only once to participants who did not respond within 2 weeks of the initial e-mail.
2.3. Data Collection and Measurements
2.3.1. Overnight Fasting Duration and Meal Frequency
Meal frequencies were defined as events in which the participant consumed ≥50 kcal, with a time interval between eating episodes of ≥15 min, as described in previous studies [17,21,22]. This definition of meal frequency predicts the total energy intake sufficiently [23]. In this study, the participants answered a questionnaire regarding their habitual eating habits over the previous month. Overnight fasting duration was calculated as the time from the last finished meal (on a typical day) to the first meal of the next day. The meal frequency was estimated based on the number of eating episodes (including light meals and snacks). The two participants who reported zero or one meal were excluded from the analysis using the meal frequency variable, as their responses to other questions indicated they had eaten at least twice, suggesting invalid responses.
2.3.2. Biomarker Analyses
Non-fasting blood samples were collected as part of antenatal check-up blood draws from participants in the second trimester of pregnancy (17–22 gestational weeks). All serum samples were assayed for total cholesterol (TC), TG, HDL-C, LDL-C, and glycated albumin (GA) concentrations. The biomarkers were measured by a contract laboratory (SRL, Inc., Tokyo, Japan). TC, TG, and GA were analyzed by enzymatic methods, and HDL-C and LDL-C were analyzed by direct methods, all using an Ultra High Throughput Clinical Chemistry Analyzer, JCA-BM8000 series (JEOL Ltd., Tokyo, Japan).
Fasting blood glucose and glycosylated hemoglobin (HbA1c), which are used as diagnostic criteria for GDM, are the indicators of glucose metabolism during pregnancy. However, in this study, GA was measured because, unlike HbA1c, GA is not affected by iron deficiency anemia [24], and GA reflects 2–4 weeks of glucose status (compared to 1–2 months of HbA1c screening), indicating the ability to measure short-term glycemic changes [20]. GA is also considered a useful predictor of neonatal outcomes in pregnant women with GDM [25,26].
2.3.3. Dietary Assessment
Dietary intake was assessed using a brief-type self-administered diet history questionnaire (BDHQ) [27,28] which was validated for Japanese pregnant women [29]. The BDHQ is a questionnaire designed to examine habitual nutrient intake and obtain information on individual nutrient intake, food intake, and other qualitative food behavioral indicators. The BDHQ consists of questions regarding eating habits over the previous month and requires 15 min to complete. The estimates of the dietary intakes of 58 foods and beverages, along with energy and selected nutrients, were calculated by an ad hoc computer algorithm (including weighting factors for BDHQ). In the analyses, food group and nutrient intakes were energy-adjusted using the density method to reduce intra-individual measurement errors. Participants with unrealistic energy intake were excluded from the analysis. The exclusion criteria included an energy intake value of less than 0.5 and an energy requirement of more than 1.5 times compared to the average for pregnant women who were moderately physically active [30].
2.3.4. Other Measurements
Demographic characteristics: Data on age, parity, medical history, and the expected date of delivery were collected from medical records. The gestational age at the time of questionnaire response and at the time of blood sampling was calculated based on the respective dates and the expected delivery date. Moreover, marital status, educational status, annual household income, working status, night shift, bedtime, and sleep duration information were collected from questionnaires. In the questionnaire, time was estimated using the 24-hour system, but the values were revised accordingly for cases in which time was estimated using the 12-hour system. Moreover, sleep duration was calculated using wake-up time and bedtime.
Pre-pregnancy body mass index (BMI): Pre-pregnancy weight and height were collected from medical records or questionnaire data in case of unavailability of the former. BMI was calculated by dividing weight (kg) by height (m2). BMI was classified into three groups: underweight (<18.5 kg/m2), normal weight (18.5–24.9 kg/m2), and overweight (≥25.0 kg/m2) groups on the World Health Organization BMI classification [31].
Physical symptoms and activity: Nausea and vomiting were evaluated using a modified Pregnancy-Unique Quantification of Emesis and Nausea (m-PUQE) for symptoms over the past 1 month [32,33]. Participants were divided into two groups according to m-PUQE total scores: (a) mild (≤6) and (b) moderate (7–12). Women classified as having severe symptoms (≥13) were excluded from the analysis to account for the potential impact on eating behavior.
Physical activity was evaluated using the Pregnancy Physical Activity Questionnaire translated into Japanese 2020 (PPAQ-J 2020) with some modifications of the validated PPAQ-J [34,35]. The activity levels classified as moderate and vigorous, were summed, and then classified into two groups: the inactive group with a total activity level of <7.5 metabolic equivalents of task (METs)-hours/week and the active group with a total activity level of ≥7.5 METs-hours/week [36].
2.4. Statistical Analysis
Categorical data were presented as frequencies and percentages, while normally distributed continuous data and non-normally distributed continuous data were, respectively, presented as means ± standard deviation (SD) and median (interquartile range, IQR). Normality was checked using a histogram, boxplot, q-norm plot, kurtosis, and skewness. In terms of overnight fasting duration, individuals were grouped into tertiles. With respect to meal frequency, the groups were 2–3, 4, and 5–7 times/day. ANOVA was used to compare the averages of normally distributed continuous variables, the Kruskal–Wallis test to compare non-normally continuous variables, and Pearson’s chi-square test and Fisher’s exact test to compare the proportions of categorical variables between the groups. Pearson’s correlation coefficients were calculated to examine the associations between GA, overnight fasting duration, meal frequency, BMI, and age, as well as the associations between overnight fasting duration, meal frequency, and lipid metabolism parameters. Multiple linear regressions were performed to examine the associations of overnight fasting duration and meal frequency with GA. Duration of overnight fasting and meal frequency were included as continuous variables in the same model and adjusted for covariates. The covariates used for adjustment were BMI and age, as identified in previous studies [37,38]. Any missing data were excluded from analyses, while p < 0.05 was considered statistically significant. All the statistical analyses were performed using SPSS version 29.0 for Microsoft Windows (IBM Corp., Armonk, NY, USA).
3. Results
3.1. Participants’ Characteristics
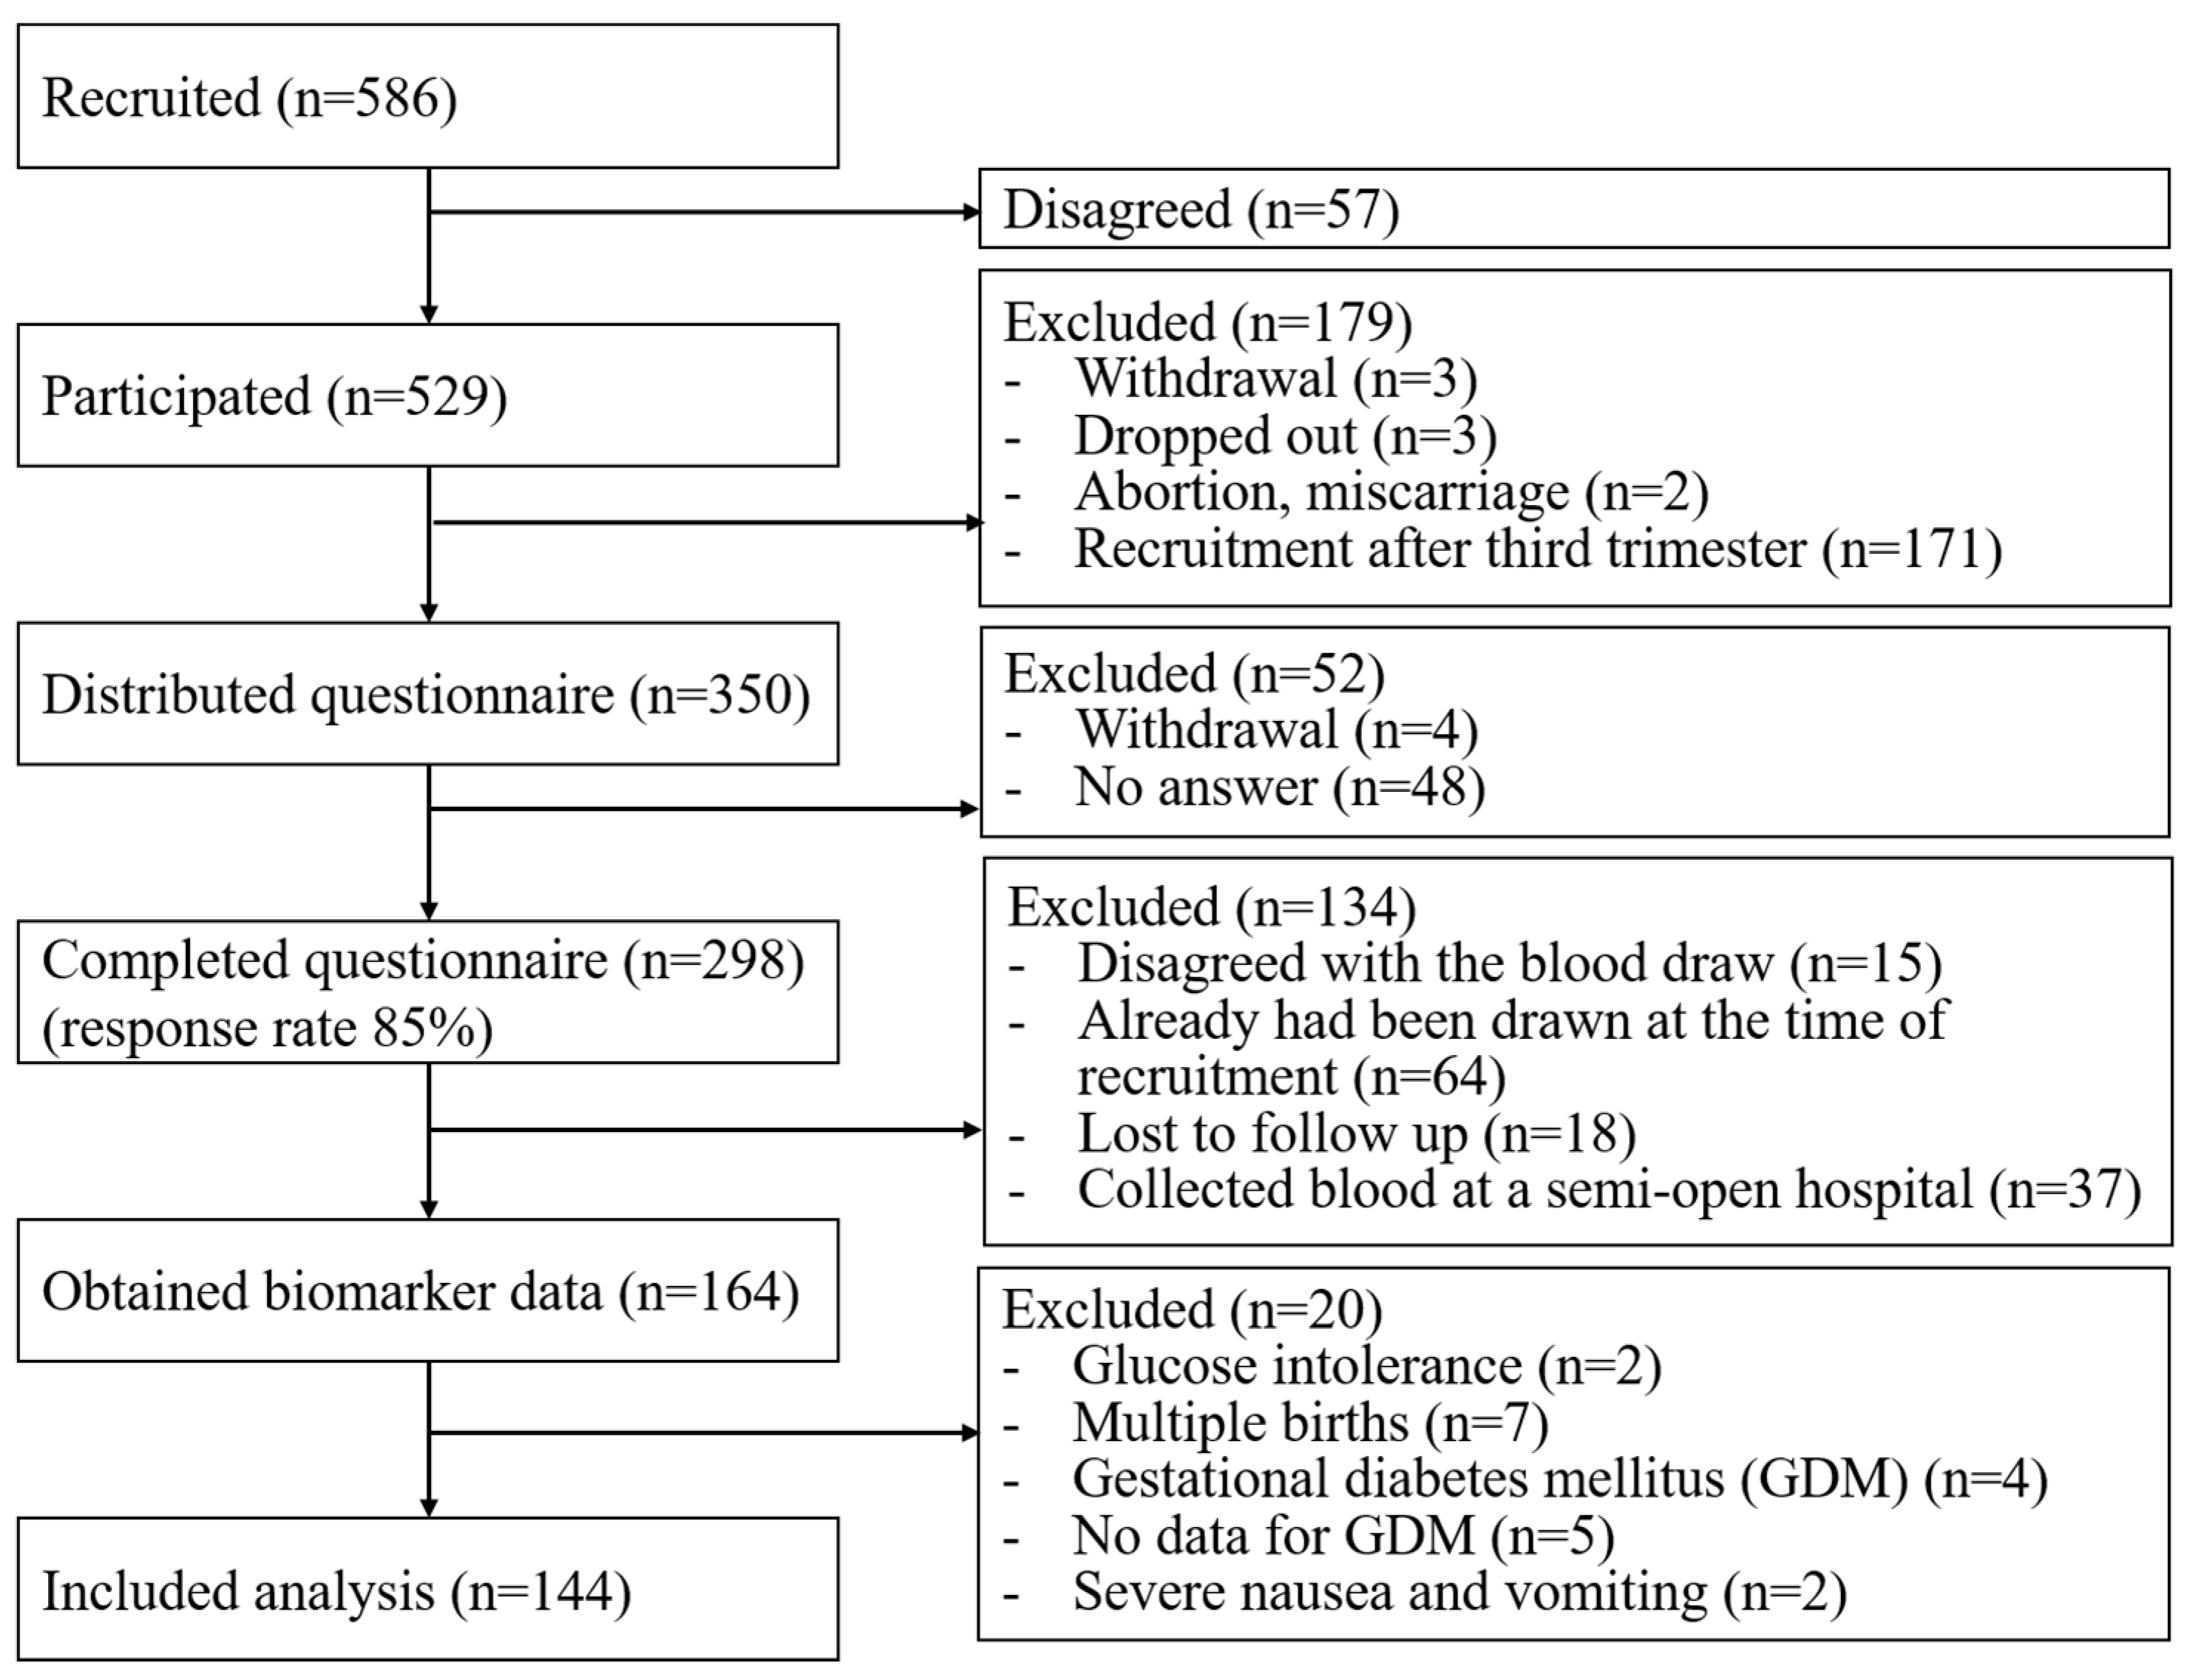
In the present study, 586 women were recruited for the J-PEACH study and 529 (90%) women consented to participate in the study. Consent was not obtained from 57 women. The questionnaire was distributed to 350 women between 18 and 24 weeks of gestation. Among them, 293 women completed the questionnaire online, while five of them provided hard copies. Hence, the overall response rate was 85%. Biomarker data were obtained from 164 respondents, and 20 of them were excluded owing to a history of glucose intolerance in two participants, multiple pregnancies in six participants, GDM in five participants, no data available to diagnose GDM in two participants, and severe nausea and vomiting in two participants. Finally, 144 pregnant women were included in this study (Figure 1). There were no significant differences in any characteristics between the populations with and without biomarker data.
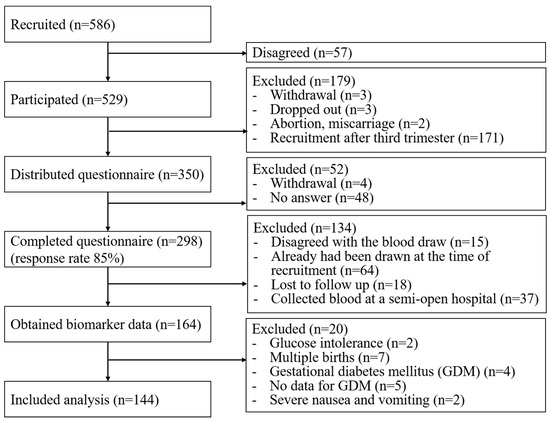
Figure 1.
Flowchart of the study participants.
Table 1 describes the participants’ characteristics. The mean ± SD time of overnight fasting duration was 12.1 ± 1.5 h, and the mean ± SD number of meal frequency was 3.8 ± 0.9 times/day. Women with a longer overnight fasting duration were more likely not to be working (p = 0.002) and physically inactive (p = 0.012) and had a longer sleep duration (p < 0.001). No significant differences in any characteristics were observed among the three meal frequency groups.

Table 1.
Participant Characteristics Stratified by Overnight Fasting Duration and Meal Frequency.
3.2. Associations of Overnight Fasting Duration and Meal Frequency on Lipid and Glucose Metabolism
The data presented in Table 2 are the mean ± SD of metabolic biomarkers for all participants, categorized by three groups of overnight fasting duration and meal frequency. No significant differences were observed among the groups in lipid parameters (TC, TG, HDL-C, and LDL-C) or in the glucose parameter GA.
Table 2.
Values of lipid and glucose parameters in the total population and stratified by overnight fasting duration and meal frequency.
The Pearson’s correlations between GA levels, overnight fasting duration, meal frequency, pre-pregnancy BMI, and maternal age are shown in Table 3. Meal frequency was positively correlated with GA levels (r = 0.196, p = 0.010). In contrast, overnight fasting duration and pre-pregnancy BMI were inversely correlated with GA levels (r = −0.185, p = 0.014, and r = −0.450, p < 0.001, respectively). No correlations were found among overnight fasting duration, meal frequency, and lipid metabolism parameters.
Table 3.
Pearson’s correlation coefficient between GA, overnight fasting duration, meal frequency, BMI, and age.
The association between overnight fasting duration, meal frequency, and GA levels is shown in Table 4. Univariate regression analysis revealed that overnight fasting duration and meal frequency were significantly associated with GA levels. However, in multivariate regression analysis adjusted for BMI and age, only overnight fasting duration showed a significant association with GA levels (β = −0.167, p = 0.030).
Table 4.
Associations of overnight fasting duration and meal frequency with GA.
3.3. Association Between Overnight Fasting Duration, Meal Frequency, and Dietary Intake
Table 5 presents the differences in energy, nutrient, and food intake values according to overnight fasting duration and meal frequency. No significant differences were observed in energy or macronutrient intake between the groups. Significant differences were noted in the intake of oils and fats by overnight fasting duration (p = 0.016), fruits by overnight fasting duration (p = 0.025), and soy products by meal frequency (p = 0.032).
Table 5.
Comparison of energy-adjusted nutrient intakes and food group intakes by overnight fasting duration and meal frequency.
4. Discussion
To the best of our knowledge, this study is one of the first to investigate the effects of overnight fasting duration and meal frequency during pregnancy on glucose and lipid metabolism. The results indicated that women in the second trimester had a mean overnight fasting duration of 12.1 h and a mean meal frequency of 3.8 meals per day. Furthermore, longer overnight fasting duration was associated with lower GA levels. In contrast, differences in meal frequency did not influence GA levels, and neither overnight fasting duration nor meal frequency affected lipid metabolism. Additionally, no significant differences in energy or macronutrient intake were observed across groups stratified by overnight fasting duration or meal frequency. However, significant differences were identified in the intakes of oils and fats, fruits, and soy products, whereas most other food groups showed no differences.
4.1. Characteristics of Study Participants Compared with Other Japanese Cohorts
In this study, glucose and lipid metabolism markers in serum were investigated during the second trimester of pregnancy (17–22 gestational weeks). In a large cohort study in Japan that used non-fasting blood tests similar to this study, the results of median values (IQR) of TC, TG, HDL-C, and LDL-C at 20–23 weeks of gestation were 211 (189–235), 133 (103–171), 79 (70–89), and 115 (97–135) mg/dL, respectively [39]. The values observed in this study were within the indicative ranges. In another Japanese study, the mean ± SD of the GA level in 196 women in the second trimester (14–27 weeks of gestation) was 13.7 ± 1.9% [20], which was higher than the value of 13.3 ± 1.0% observed in this study. Thus, GA levels in this study were lower than those reported in the second-trimester population in Japan. However, the previous study excluded women with a BMI < 18.5 or ≥25, whereas the present study included them. Given that higher BMI is associated with associated GA levels, this difference should be taken into account when comparing results. Compared with the National Health and Nutrition Examination Survey (30–39 years old) and the large cohort study in Japan [40,41], the proportions of pre-pregnancy BMI in this study were lower for participants classified as underweight and obese, and higher for those classified as having normal weight. Moreover, participants in this study were older, more highly educated, and had higher incomes compared to the previous study [40]. Therefore, they might have had prior knowledge regarding diet and sleep, as well as a high level of health consciousness.
4.2. Overnight Fasting Duration and Meal Frequency in Pregnant Japanese Women
This study is the first in Japan in which the overnight fasting duration of pregnant women has been documented; therefore, direct comparisons with the typical overnight fasting duration in Japan are not feasible. However, sleep duration was positively associated with overnight fasting duration and could be compared with national averages. According to a national survey, the mean sleep duration for women aged 35–39 years in Japan is 7.5 h [42]. Similarly, based on a large cohort study in Japan, it was reported that 7–8 h was the most common sleep duration both before and during pregnancy [43]. In our study population, the average sleep duration was 8.0 h, reflecting the lifestyle patterns of the general Japanese population. In contrast, meal frequency among pregnant Japanese women in this study tended to be lower than that reported in two studies from other countries in which the same definition of meal frequency applies. In Singapore, the average meal frequency during 26–28 weeks of gestation is 4.2 times [17], whereas in Brazil, it is 4.7 times during the first trimester [22].
4.3. Effect of Overnight Fasting Duration on GA
The GA values of all the participants were within the normal glycemic reference range (15.7% or less) defined by the Japan Diabetes Society [44]. However, even when GA values are within the acceptable range, variations in these values may affect perinatal outcomes. In a previous study, it was suggested that a GA value below the GDM threshold could increase the risk of adverse perinatal outcomes, such as respiratory disorders and large-for-date status [45]. Thus, even within the reference range, a further reduction in GA levels may be clinically relevant for minimizing the risk of such complications. In this study, a longer overnight fasting duration was associated with lower GA values, suggesting a potential benefit. This finding is consistent with previous studies examining the relationship between overnight fasting duration and glucose metabolism indicators during pregnancy, which reported that a longer overnight fasting duration was linked to lower fasting glucose levels [17]. In the present study, which focused on GA, a similar trend was observed, indicating that a longer overnight fasting duration was associated with lower glucose metabolism indicators. Analysis based on the tertiles of overnight fasting duration revealed no impact on meal frequency or energy intake. This suggests that the longer overnight fasting duration was not due to skipping meals, nor did it result in a reduction in energy intake. In experimental studies using mice, time-restricted eating (TRE) has been shown to improve glucose tolerance by reducing insulin resistance [12,46]. Similarly, a longer overnight fasting duration, which results in a more restricted eating window, may have contributed to improved glucose tolerance, leading to lower GA levels. Since glucose metabolism undergoes significant changes during pregnancy, including increased insulin resistance and enhanced insulin secretion to support fetal growth and development [47,48], the influence of overnight fasting duration may be even more significant during pregnancy compared to the non-pregnant state.
It is important to emphasize that a longer overnight fasting duration is not necessarily beneficial. Previous studies have reported no serious adverse effects when pregnant women in the second trimester practiced 10 h of TRE, equivalent to a 14 h overnight fast, for five weeks [49]. Conversely, prolonged fasting durations of 14–18 h, such as skipping breakfast during pregnancy, have been reported to potentially lead to accelerated starvation [50]. These findings suggest that excessively long fasting periods may be harmful.
No significant effect of meal frequency on GA was observed. However, this outcome may be attributed to the fact that the participants in this study reported fewer meals than those in a previous study [17]. Additionally, there were few participants with a meal frequency of 5–10 meals, a range that was associated with changes in glucose metabolism in a previous study [17].
4.4. Effects of Meal Frequency and Overnight Fasting Duration on Lipid Metabolism
The results of this study suggest that overnight fasting and meal frequency do not affect lipid metabolism. To date, no other study has investigated the relationship between eating behaviors and lipid metabolism parameters in pregnant women. Several studies have examined TRE and lipid metabolism in adults. However, review articles have concluded that the associations between triglycerides, cholesterol subtypes, and TRE are inconsistent [51,52]. Further research is required to explore the effects of overnight fasting and meal frequency on lipid metabolism during pregnancy.
4.5. Effects of Overnight Fasting Duration and Meal Frequency on Dietary Intake
Dietary habits investigated using BDHQ had similar results to a Singapore study that also found no differences in the energy intake of macronutrients by overnight fasting duration or meal frequency [17]. Although a study from Singapore and a study from Brazil revealed that daily energy intake decreased with longer overnight fasting and increased with more frequent meals [17,22], the present study had a different trend in energy intake. In our study population, participants received the necessary nutrients even if the fasting time had been increased, and the total energy intake was suppressed even if the meal frequency had been increased. Furthermore, the group with longer overnight fasting duration tended to have lower GA values; however, there were no observed changes in dietary content, such as avoidance of confectionery and fruits. Additionally, oils, fats, and fruits, which showed significant differences among the tertile groups, did not demonstrate a tendency to explain the decrease in GA values.
4.6. Limitations and Strengths
This study has several limitations. First, as a cross-sectional study, causality is not clear. However, this study is part of a cohort study with further ongoing longitudinal studies being conducted to determine causality. Second, there might have been reporting errors, specifically since overnight fasting durations and meal frequencies are based on self-reported results. However, this bias was mitigated by measures, such as providing 50 kcal food samples in the questionnaire. Moreover, although a validated dietary assessment was used, the estimates of energy intake reporting errors [53] require careful interpretation. To reduce this bias for nutrients and food groups, adjustments were made with estimated declaration errors and comparisons were made using density methods. In this way, the bias was minimized. Third, the study population consisted of highly educated, high-income, pregnant women in a metropolitan hospital. Nutrient and food group intake may differ depending on household income, and the content of dietary intake may differ from that of the general population [41]. Furthermore, it is possible that there are many people who pay attention to health and nutrition because they are highly educated on the subject. Additionally, COVID-19 might have affected the participants’ lifestyle by increasing the time spent at home and decreasing the time spent commuting, which may have affected the time for sleeping and eating. This effect should be tested in the cohort when the COVID-19 effects are no longer applicable.
Despite these limitations, this is the first study to examine the actual conditions of overnight fasting duration and meal frequency during pregnancy and their effects on glucose and lipid metabolism in Japan. The strength of the study is that the effect of eating time on biomarker index was quantitatively examined. Furthermore, the analysis of the meal quality, as well as the timing of meals by the BDHQ, was also considered as an important point. Therefore, further studies regarding their effects on perinatal outcomes are required.
5. Conclusions
This study is the first to clarify the status of overnight fasting duration and meal frequency among pregnant women in Japan. The findings suggest that overnight fasting duration during the second trimester may influence GA values. This suggests that fasting duration could play a crucial role in enhancing glucose metabolism and potentially reducing the risk of adverse outcomes, even when GA values remain within the normal range. To optimize glycemic control in the second trimester, providing appropriate guidance on managing overnight fasting duration, alongside meal quantity and composition, may be beneficial. Further research is warranted to elucidate the underlying mechanisms and clinical significance of these findings in pregnant populations, particularly in relation to neonatal health outcomes.
Author Contributions
K.N., M.T., N.N., Y.U., K.Y., N.H., E.T.-S., S.S. and M.H. designed the study. K.N., M.T., N.N. and T.N. contributed to the collection of the data. K.N. carried out the statistical analysis in consultation with Y.U., K.Y., E.T.-S., S.S., M.H. and K.N. prepared the first draft of the manuscript, and Y.U., K.Y., N.H, E.T.-S., S.S. and M.H. critically revised it for important intellectual content. All authors have revised and approved the final draft and agree to be accountable for all aspects of the work in ensuring that questions related to the accuracy or integrity of any part of the work are appropriately investigated and resolved. All authors have read and agreed to the published version of the manuscript.
Funding
This research was funded by the JSPS KAKENHI Grant Numbers 19H03940, 19K22741, 22H03399, and 23K24657.
Institutional Review Board Statement
The study was conducted according to the guidelines of the Declaration of Helsinki and approved by the Ethics Committee of the Graduate School of Medicine at the University of Tokyo (No. 2019318NI-(10), 9 March 2020).
Informed Consent Statement
Informed consent was obtained from all participants involved in the study.
Data Availability Statement
The data presented in this study are not publicly available due to ethical considerations and the protection of personal information. However, these data will be made available upon reasonable request to the corresponding author.
Acknowledgments
We are deeply grateful to all the participants and hospital staff for their cooperation.
Conflicts of Interest
The authors declare no conflicts of interest. The funders had no role in the design of the study; in the collection, analyses, or interpretation of data; in the writing of the manuscript, or in the decision to publish the results.
Appendix A
Members in Tokyo area of the J-PEACH Study as of 2019–2022: Megumi Haruna (Principal Investigator), Satoshi Sasaki, Naoko Hikita, Emi Sasagawa, Kaori Yonezawa, Yuriko Usui, Keiko Nakano, Moeko Tanaka, Nao Nishihara, Riko Ohori, Nana Wakabayashi, Satoko Aoyama, and Tomomi Ohyama (The University of Tokyo, Japan).
References
- Metzger, B.E.; Lowe, L.P.; Dyer, A.R.; Trimble, E.R.; Chaovarindr, U.; Coustan, D.R.; Hadden, D.R.; McCance, D.R.; Hod, M.; McIntyre, H.D.; et al. Hyperglycemia and adverse pregnancy outcomes. N. Engl. J. Med. 2008, 358, 199–2002. [Google Scholar]
- Scholtens, D.M.; Kuang, A.; Lowe, L.P.; Hamilton, J.; Lawrence, J.M.; Lebenthal, Y.; Brickman, W.J.; Clayton, P.; Ma, R.C.; McCance, D.; et al. Hyperglycemia and adverse pregnancy outcome follow-up study (HAPO FUS): Maternal glycemia and childhood glucose metabolism. Diabetes Care 2019, 42, 381–392. [Google Scholar] [CrossRef]
- Berggren, E.K.; Boggess, K.A.; Jonsson Funk, M. Population health: Modest glycaemic improvements in a pregnant cohort with mild glucose intolerance decreased adverse outcomes. Paediatr. Perinat. Epidemiol. 2014, 28, 280–286. [Google Scholar] [CrossRef] [PubMed]
- Selen, D.J.; Edelson, P.K.; James, K.; Corelli, K.; Hivert, M.F.; Meigs, J.B.; Thadhani, R.; Ecker, J.; Powe, C.E. Physiological subtypes of gestational glucose intolerance and risk of adverse pregnancy outcomes. Am. J. Obstet. Gynecol. 2022, 226, 241.e1–241.e14. [Google Scholar] [CrossRef] [PubMed]
- Jin, W.-Y.; Lin, S.-L.; Hou, R.-L.; Chen, X.-Y.; Han, T.; Jin, Y.; Tang, L.; Zhu, Z.-W.; Zhao, Z.-Y. Associations between maternal lipid profile and pregnancy complications and perinatal outcomes: A population-based study from China. BMC Pregnancy Childbirth 2016, 16, 60. [Google Scholar] [CrossRef] [PubMed]
- Wu, Q.; Zhang, L.; Huang, L.; Lei, Y.; Chen, L.; Liang, Z.; Zhou, M.; Xu, H.; Zhou, Y.; Wang, F.; et al. Second-trimester maternal lipid profiles predict pregnancy complications in an age-dependent manner. Arch. Gynecol. Obstet. 2019, 299, 1253–1260. [Google Scholar] [CrossRef]
- Vrijkotte, T.G.; Krukziener, N.; Hutten, B.A.; Vollebregt, K.C.; van Eijsden, M.; Twickler, M.B. Maternal lipid profile during early pregnancy and pregnancy complications and outcomes: The ABCD study. J. Clin. Endocrinol. Metab. 2012, 97, 3917–3925. [Google Scholar] [CrossRef] [PubMed]
- Stenvers, D.J.; Jonkers, C.F.; Fliers, E.; Bisschop, P.H.; Kalsbeek, A. Nutrition and the circadian timing system. Prog. Brain Res. 2012, 199, 359–376. [Google Scholar]
- Potter, G.D.; Cade, J.E.; Grant, P.J.; Hardie, L.J. Nutrition and the circadian system. Br. J. Nutr. 2016, 116, 434–442. [Google Scholar] [CrossRef]
- Yoshizaki, T.; Tada, Y.; Hida, A.; Sunami, A.; Yokoyama, Y.; Yasuda, J.; Nakai, A.; Togo, F.; Kawano, Y. Effects of feeding schedule changes on the circadian phase of the cardiac autonomic nervous system and serum lipid levels. Eur. J. Appl. Physiol. 2013, 113, 2603–2611. [Google Scholar] [CrossRef] [PubMed]
- Franzago, M.; Alessandrelli, E.; Notarangelo, S.; Stuppia, L.; Vitacolonna, E. Chrono-Nutrition: Circadian Rhythm and Personalized Nutrition. Int. J. Mol. Sci. 2023, 24, 2571. [Google Scholar] [CrossRef] [PubMed]
- Asher, G.; Sassone-Corsi, P. Time for food: The intimate interplay between nutrition, metabolism, and the circadian clock. Cell 2015, 161, 84–92. [Google Scholar] [CrossRef]
- Speksnijder, E.M.; Bisschop, P.H.; Siegelaar, S.E.; Stenvers, D.J.; Kalsbeek, A. Circadian desynchrony and glucose metabolism. J. Pineal Res. 2024, 76, e12956. [Google Scholar] [CrossRef]
- Schoenfeld, B.J.; Aragon, A.A.; Krieger, J.W. Effects of meal frequency on weight loss and body composition: A meta-analysis. Nutr. Rev. 2015, 73, 69–82. [Google Scholar] [CrossRef] [PubMed]
- Paoli, A.; Tinsley, G.; Bianco, A.; Moro, T. The influence of meal frequency and timing on health in humans: The role of fasting. Nutrients 2019, 11, 719. [Google Scholar] [CrossRef] [PubMed]
- Schoenaker, D.A.; Mishra, G.D.; Callaway, L.K.; Soedamah-Muthu, S.S. The role of energy, nutrients, foods, and dietary patterns in the development of gestational diabetes mellitus: A systematic review of observational studies. Diabetes Care. 2016, 39, 16–23. [Google Scholar] [CrossRef]
- Loy, S.L.; Chan, J.K.; Wee, P.H.; Colega, M.T.; Cheung, Y.B.; Godfrey, K.M.; Kwek, K.; Saw, S.M.; Chong, Y.S.; Natarajan, P.; et al. Maternal circadian eating time and frequency are associated with blood glucose concentrations during pregnancy. J. Nutr. 2017, 147, 70–77. [Google Scholar] [CrossRef]
- Japan, Pregnancy, Eating, and Activity, Cohort Study (J-Peach Study). Available online: https://j-peach.jpn.org (accessed on 17 December 2024).
- Faul, F.; Erdfelder, E.; Lang, A.; Buchner, A. G*Power 3: A flexible statistical power analysis program for the social. behavioral, and biomedical sciences. Behav. Res. Methods 2007, 39, 175–191. [Google Scholar] [CrossRef] [PubMed]
- Hiramatsu, Y.; Shimizu, I.; Omori, Y.; Nakabayashi, M. Determination of reference intervals of glycated albumin and hemoglobin A1c in healthy pregnant Japanese women and analysis of their time courses and influencing factors during pregnancy. Endocr. J. 2012, 59, 145–151. [Google Scholar] [CrossRef]
- Gibney, M.J.; Wolever, T.M. Periodicity of eating and human health: Present perspective and future directions. Br. J. Nutr. 1997, 77 (Suppl. S1), S3–S5. [Google Scholar] [CrossRef] [PubMed]
- Gontijo, C.A.; Cabral, B.B.M.; Balieiro, L.C.T.; Teixeira, G.P.; Fahmy, W.M.; Maia, Y.C.d.P.; Crispim, C.A. Time-related eating patterns and chronotype are associated with diet quality in pregnant women. Chronobiol. Int. 2019, 36, 75–84. [Google Scholar] [CrossRef] [PubMed]
- Leech, R.M.; Worsley, A.; Timperio, A.; McNaughton, S.A. Characterizing eating patterns: A comparison of eating occasion definitions. Am. J. Clin. Nutr. 2015, 102, 1229–1237. [Google Scholar] [CrossRef] [PubMed]
- Hashimoto, K.; Osugi, T.; Noguchi, S.; Morimoto, Y.; Wasada, K.; Imai, S.; Waguri, M.; Toyoda, R.; Fujita, T.; Kasayama, S.; et al. A1C but not serum glycated albumin is elevated because of iron deficiency in late pregnancy in diabetic women. Diabetes Care 2010, 33, 509–511. [Google Scholar] [CrossRef] [PubMed]
- Shimizu, I.; Hiramatsu, Y.; Omori, Y.; Nakabayashi, M.; The JGA (Japan Glycated Albumin) Study Group. Comparison of HbA1c and glycated albumin as a control marker for newborn complications in diabetic women in a multicentre study in Japan (Japan glycated albumin study group: Study 2). Ann. Clin. Biochem. 2018, 55, 639–646. [Google Scholar] [CrossRef] [PubMed]
- Sugawara, D.; Sato, H.; Ichihashi, K.; Nagai, K.; Kawano, A. Glycated albumin level during late pregnancy as a predictive factor for neonatal outcomes of women with diabetes. J. Matern. Fetal Neonatal Med. 2018, 31, 2007–2012. [Google Scholar] [CrossRef] [PubMed]
- Kobayashi, S.; Murakami, K.; Sasaki, S.; Okubo, H.; Hirota, N.; Notsu, A.; Fukui, M.; Date, C. Comparison of relative validity of food group intakes estimated by comprehensive and brief-type self-administered diet history questionnaires against 16 d dietary records in Japanese adults. Public Health Nutr. 2011, 14, 1200–1211. [Google Scholar] [CrossRef]
- Kobayashi, S.; Honda, S.; Murakami, K.; Sasaki, S.; Okubo, H.; Hirota, N.; Notsu, A.; Fukui, M.; Date, C. Both comprehensive and brief self-administered diet history questionnaires satisfactorily rank nutrient intakes in Japanese adults. J. Epidemiol. 2012, 22, 151–159. [Google Scholar] [CrossRef]
- Shiraishi, M.; Haruna, M.; Matsuzaki, M.; Murayama, R.; Sasaki, S. Availability of two self-administered diet history questionnaires for pregnant Japanese women: A validation study using 24-hour urinary markers. J. Epidemiol. 2017, 27, 172–179. [Google Scholar] [CrossRef]
- Takei, H.; Shiraishi, M.; Matsuzaki, M.; Haruna, M. Factors related to vegetable intake among pregnant Japanese women: A cross-sectional study. Appetite 2019, 132, 175–181. [Google Scholar] [CrossRef] [PubMed]
- World Health Organization. Obesity: Preventing and managing the global epidemic. In Report of a WHO Consultation; World Health Organization Technical Report Series; World Health Organization: Geneva, Switzerland, 2000; Volume 894, pp. 1–253. [Google Scholar]
- Lacasse, A.; Rey, E.; Ferreira, E.; Morin, C.; Berard, A. Validity of a modified pregnancy-unique quantification of emesis and nausea (PUQE) scoring index to assess severity of nausea and vomiting of pregnancy. Obstet. Gynecol. 2008, 198, 71.e1–71.e7. [Google Scholar]
- Hada, A.; Minatani, M.; Wakamatsu, M.; Koren, G.; Kitamura, T. The Pregnancy-Unique Quantification of Emesis and Nausea (PUQE-24): Configural, Measurement, and Structural Invariance between Nulliparas and Multiparas and across Two Measurement Time Points. Healthcare 2021, 9, 1553. [Google Scholar] [CrossRef] [PubMed]
- Matsuzaki, M.; Haruna, M.; Ota, E.; Yeo, S.; Murayama, R.; Murashima, S. Translation and cross-cultural adaptation of the Pregnancy Physical Activity Questionnaire (PPAQ) to Japanese. Biosci. Trends. 2010, 4, 170–177. [Google Scholar] [PubMed]
- Matsuzaki, M.; Haruna, M.; Nakayama, K.; Shiraishi, M.; Ota, E.; Murayama, R.; Murashima, S.; Yeo, S. Adapting the pregnancy physical activity questionnaire for Japanese pregnant women. JOGN Nurs. 2014, 43, 107–116. [Google Scholar] [CrossRef]
- Committee on Obstetric Practice. Physical activity and exercise during pregnancy and the postpartum period: ACOG committee opinion, Number 804. Obstet. Gynecol. 2020, 135, e178–e188. [Google Scholar] [CrossRef] [PubMed]
- Rooney, M.R.; Zhang, S.; Fang, M.; Minhas, A.S.; Wallace, A.S.; Grams, M.E.; Echouffo-Tcheugui, J.B.; Christenson, R.H.; Selvin, E. Performance of glycated albumin as a biomarker of hyperglycemia in pregnancy: Results from the National Health and Nutrition Examination Survey 1999–2004. Clin. Biochem. 2023, 112, 67–70. [Google Scholar] [CrossRef]
- Bellia, C.; Zaninotto, M.; Cosma, C.; Agnello, L.; Sasso, B.L.; Bivona, G.; Plebani, M.; Ciaccio, M. Definition of the upper reference limit of glycated albumin in blood donors from Italy. Clin. Chem. Lab. Med. 2017, 56, 120–125. [Google Scholar] [CrossRef]
- Sasaki, H.; Arata, N.; Tomotaki, A.; Yamamoto-Hanada, K.; Mezawa, H.; Konishi, M.; Ishitsuka, K.; Saito-Abe, M.; Sato, M.; Nishizato, M.; et al. Time course of metabolic status in pregnant women: The Japan environment and children’s study. J. Diabetes Investig. 2020, 11, 1318–1325. [Google Scholar] [CrossRef] [PubMed]
- Michikawa, T.; Nitta, H.; Nakayama, S.F.; Ono, M.; Yonemoto, J.; Tamura, K.; Suda, E.; Ito, H.; Takeuchi, A.; Kawamoto, T. The Japan environment and children’s study (JECS): A preliminary report on selected characteristics of approximately 10 000 pregnant women recruited during the first year of the study. J. Epidemiol. 2015, 25, 452–458. [Google Scholar] [CrossRef] [PubMed]
- Ministry of Health, Labor and Welfare. The National Health and Nutrition Survey in Japan. 2019. Available online: https://www.mhlw.go.jp/content/001066903.pdf (accessed on 25 February 2025).
- Statistics Bureau, Ministry of Internal Affairs and Communications. Survey on Time Use and Leisure Activities. 2016. Available online: https://www.e-stat.go.jp/stat-search/files?stat_infid=000031617830 (accessed on 17 December 2024).
- Nakahara, K.; Michikawa, T.; Morokuma, S.; Ogawa, M.; Kato, K.; Sanefuji, M.; Shibata, E.; Tsuji, M.; Shimono, M.; Kawamoto, T.; et al. Association of maternal sleep before and during pregnancy with preterm birth and early infant sleep and temperament. Sci. Rep. 2020, 10, 11084. [Google Scholar] [CrossRef] [PubMed]
- Japan Diabetes Society (Ed.) Diabetes Practice Guidelines 2019; Nankodo: Tokyo, Japan, 2019. (In Japanese) [Google Scholar]
- Mendes, N.; Alves, M.; Andrade, R.; Ribeiro, R.T.; Papoila, A.L.; Serrano, F. Association between glycated albumin, fructosamine, and HbA1c with neonatal outcomes in a prospective cohort of women with gestational diabetes mellitus. Int. J. Gynaecol. Obstet. 2019, 146, 326–332. [Google Scholar] [CrossRef] [PubMed]
- Chaix, A.; Zarrinpar, A.; Miu, P.; Panda, S. Time-restricted feeding is a preventative and therapeutic intervention against diverse nutritional challenges. Cell Metab. 2014, 20, 991. [Google Scholar] [CrossRef] [PubMed]
- Lain, K.Y.; Catalano, P.M. Metabolic changes in pregnancy. Clin. Obstet. Gynaecol. 2007, 50, 938–948. [Google Scholar] [CrossRef] [PubMed]
- Hadden, D.R.; Mclaughlin, C. Normal and abnormal maternal metabolism during pregnancy. Semin. Fetal Neonat. Med. 2009, 14, 66. [Google Scholar] [CrossRef] [PubMed]
- Skarstad, H.M.; Haganes, K.L.; Sujan, A.J.; Gellein, T.M.; Johansen, M.K.; Salvesen, K.Å.; Hawley, J.A.; Moholdt, T. A randomized feasibility trial of time-restricted eating during pregnancy in people with increased risk of gestational diabetes. Sci. Rep. 2024, 14, 22476. [Google Scholar] [CrossRef] [PubMed]
- Metzger, B.E.; Ravnikar, V.; Vileisis, R.A.; Freinkel, N. “Accelerated starvation” and the skipped breakfast in late normal pregnancy. Lancet 1982, 1, 588–592. [Google Scholar] [CrossRef] [PubMed]
- Zhu, S.; Surampudi, P.; Rosharavan, B.; Chondronikola, M. Intermittent fasting as a nutrition approach against obesity and metabolic disease. Curr. Opin. Clin. Nutr. Metab. Care 2020, 23, 387–394. [Google Scholar] [CrossRef] [PubMed]
- Schuppelius, B.; Peters, B.; Ottawa, A.; Pivovarova-Ramich, O. Time Restricted Eating: A Dietary Strategy to Prevent and Treat Metabolic Disturbances. Front. Endocrinol. 2021, 12, 683140. [Google Scholar] [CrossRef]
- Murakami, K.; Sasaki, S.; Uenishi, K.; Japan Dietetic Students’ Study for Nutrition and Biomarkers Group. The degree of misreporting of the energy-adjusted intake of protein, potassium, and sodium does not differ among under-, acceptable, and over-reporters of energy intake. Nutr. Res. 2012, 32, 741–750. [Google Scholar] [CrossRef] [PubMed]
Disclaimer/Publisher’s Note: The statements, opinions and data contained in all publications are solely those of the individual author(s) and contributor(s) and not of MDPI and/or the editor(s). MDPI and/or the editor(s) disclaim responsibility for any injury to people or property resulting from any ideas, methods, instructions or products referred to in the content. |
© 2025 by the authors. Licensee MDPI, Basel, Switzerland. This article is an open access article distributed under the terms and conditions of the Creative Commons Attribution (CC BY) license (https://creativecommons.org/licenses/by/4.0/).