Article

The Impact of Tartrazine on DNA Methylation, Histone Deacetylation, and Genomic Stability in Human Cell Lines

1
Department of Public Health Medicine, Medical School, University of Pécs, 7624 Pécs, Hungary
2
Doctoral School of Health Sciences, Faculty of Health Sciences, University of Pécs, 7621 Pécs, Hungary
3
Preclinical Research Center, Medical School, University of Pécs, 7624 Pécs, Hungary
4
Institute of Basics of Health Sciences, Midwifery and Health Visiting, Faculty of Health Sciences, University of Pécs, 7621 Pécs, Hungary
*
Author to whom correspondence should be addressed.
Nutrients 2025, 17(5), 913; https://doi.org/10.3390/nu17050913
Submission received: 1 February 2025 / Revised: 21 February 2025 / Accepted: 22 February 2025 / Published: 6 March 2025
(This article belongs to the Special Issue Advances in Gene–Diet Interactions and Human Health)

Abstract

:
Background/Objectives: Tartrazine (TRZ), a synthetic red azo dye derived from coal tar, is widely used as a food colorant in various food products, pharmaceuticals, and cosmetics. This study aims to investigate the impact of TRZ on the expression levels of DNA methyltransferases (DNMT1, DNMT3a, and DNMT3b) and histone deacetylases (HDAC5 and HDAC6). Additionally, we evaluate genomic DNA stability using the alkaline comet assay in three human cell lines: immortalized human keratinocyte (HaCaT), human hepatocellular carcinoma (HepG2), and human lung adenocarcinoma (A549). The research question focuses on whether TRZ exposure alters epigenetic regulation and DNA integrity, potentially implicating its role in carcinogenesis. Methods: The selected human cell lines were exposed to different concentrations of TRZ (20 µM, 40 µM, and 80 µM), with DMBA serving as a positive control. After treatment, we quantified the expression levels of DNMT1, DNMT3a, DNMT3b, HDAC5, and HDAC6 using quantitative real-time PCR. Additionally, we assessed DNA fragmentation via the alkaline comet assay to determine the extent of DNA damage resulting from TRZ exposure. Results: Our findings indicate that TRZ significantly upregulates the expression of HDAC5, HDAC6, DNMT1, DNMT3a, and DNMT3b in comparison to the control group. Furthermore, TRZ exposure leads to a notable increase in DNA damage, as evidenced by elevated tail moments across all examined human cell lines. Conclusions: These results suggest that TRZ may play a role in carcinogenesis and epigenetic modifications. The observed upregulation of DNMTs and HDACs, coupled with increased DNA damage, highlights the potential risks associated with TRZ exposure. Further research is necessary to explore these mechanisms and assess their implications for human health.

Graphical Abstract

1. Introduction

Food coloring encompasses dyes, pigments, or compounds that provide color to food, drugs, or cosmetics. These substances are regulated by the Food and Drug Administration (FDA) colorants to ensure their safety. Dyes are classified based on certification requirements. According to FDA and European Food Safety Authority (EFSA) guidelines, these colorants restore lost color and improve the aesthetic appeal of food items [1,2]. The beverage and food sectors employ a lot of colorants, such as synthetic azo dyes and pigments derived from natural sources, to enhance sensory aspects and visual appeal [3]. Due to their appealing coloring qualities, variety of colors, endurance, and affordability, there has been an estimate that over eight million tons of artificial food colorants are made each year [4].
These colorants are often present in commonly consumed foods, typically without the consumer’s awareness, highlighting the need to investigate their biological impacts. Given the established link between nutrition and health and the increasing emphasis on quality of life, many studies have identified dyes that pose health risks, potentially contributing to conditions like childhood hyperactivity, urticaria, asthma, and allergic rhinitis [5].
Azo dyes have drawn significant interest because of their potential health hazards, such as negative consequences on the liver, kidneys, and neurological system [6,7,8], and their role in promoting inflammation [3]. The harmful impact of azo dyes is primarily due to the production of aromatic amines from the breakdown of the aryl-N=N-aryl group by gut microbiota [9]. It is believed that aromatic amines are harmful, carcinogenic, and mutagenic [10].
One of the most popular food colorants is tartrazine (TRZ, E102) (Figure 1), a synthetic azo dye with a lemon-yellow hue. TRZ is found in various grocery items like soft and sports drinks, jellies, dressings, chewing gums, and non-food products like beauty and pharmaceutical products [11,12]. Moreover, TRZ is also an affordable substitute for saffron in some regions [13]. The EFSA’s 1964 assessment outlined TRZ’s characteristics, purity standards, and toxicological data, establishing an acceptable daily intake (ADI) of 0–7.5 mg/kg body weight. In 2016, the ADI for TRZ was increased to 0–10 mg/kg body weight, due to no observed adverse effect level (NOAEL) of 984 mg, as there is insufficient evidence of adverse effects [14]. However, studies on the health impacts of TRZ have been controversial, with severe concerns, including DNA damage [15], hyperactivity [16], central nervous system alterations [17], and allergic reactions [18,19,20,21].
Numerous studies have examined TRZ’s effects on experimental animals. For example, administering 700 mg/kg of TRZ caused cell growth dysregulation and brain hemorrhage in adult rats without resulting in lipid peroxidation [6]. In our previous research, we discussed TRZ’s histopathological effects on rat liver and kidney tissues, showing vacuolation, swelling, necrosis, and pyknosis. This red-azo dye has the potential to damage DNA in both in vivo and in vitro environments. Research utilizing the comet assay method has shown genotoxic effects in the white blood cells of rats exposed to tartrazine [22]. Both TRZ and its metabolites demonstrate genotoxic effects and cytotoxicity when present in high concentrations. The harmful effects of azo dyes stem from the formation of aromatic amines, which occur due to the cleavage of aryl-N=N-aryl bonds [23]. These byproducts undergo oxidation to N-hydroxy derivatives, leading to redox balance disturbances and neurotoxicity, as indicated by increased levels of malondialdehyde (MDA) and inhibition of the activity of antioxidant enzymes. In one study, Rats given TRZ had higher brain concentrations of acetylcholine (Ach) and gamma-aminobutyric acid (GABA) as well as lower levels of dopamine (DA). TRZ caused oxidative destruction of the liver and kidneys of rats at dosages of 10 and 100 mg/kg [8]. Furthermore, adults who were administered 125–500 mg/kg TRZ for 30 days showed alterations in memory and learning, as well as lowered protective antioxidants [24].
DNA methyltransferases (DNMTs) and histone deacetylases (HDACs) are enzyme groups with significant roles in epigenetics. A class of enzymes called DNMTs adds a methyl group to DNA cytosine residues at position five, which is vital to genomic stability and integrity. DNA methylation regulates gene expression by suppressing specific genes through transcription inhibition, often by methylating gene promoter regions [25]. Three active DNMT members exist: DNMT1, DNMT3A, and DNMT3B. Through abnormal DNA methylation, dysregulation of these enzymes can result in chromosomal instability and cancer. Research indicates that excessive expression of DNMTs may lead to tumor-suppressor gene methylation, silencing them and contributing to cancer [26]. There is a clear correlation between several tumors in humans, such as lung, breast, and colon cancers, and excessive methylation of DNA repair gene promoters [27].
HDACs, tasked with removing acetyl groups from histones, influence the expression of many genes. Research shows HDACs are pivotal in modulating acetylation levels, a phenomenon thoroughly examined in diverse cancer cells. HDACs are vital in initiating, advancing, and promoting carcinogenesis [28]. HDAC2, HDAC3, and HDAC8, part of the HDAC enzyme family, are crucial in controlling cell proliferation. They interact with different co-repressors and transcriptional repressors, which include polycomb group proteins, to inhibit the expression of genes that encourage cell division. Research suggests HDAC genes stimulate angiogenesis, invasion, and migration while suppressing cell cycle inhibitors, distinction, and apoptosis [29,30].
This research explored the relationship between TRZ and the expression levels of HDAC5, HDAC6, DNMT1, DNMT3a, and DNMT3b. The assessment was carried out using qRT-PCR analysis on various cell lines, including immortalized keratinocyte (HaCaT), lung carcinoma (A549), and human liver cancer (HepG2).

2. Materials and Methods

2.1. Cell Culture

HaCat: The HaCat human immortalized keratinocyte cell lines (Cytion catalog number 300493, Eppelheim, Germany) particularly derived from adult human skin, these cells demonstrate comparable biological characteristics to normal human keratinocytes, making them an ideal cellular model for investigating dermal toxicity [31]. The HepG2 cell line (ATCC; Manassas, VA, USA) originated from a liver cancer case of a Caucasian suffering from hepatocellular carcinoma. HepG2 cells were chosen for this study due to their retention of morphological and biochemical features like those of regular human hepatocytes, as reported in the literature [32,33]. The A549 cell line (representing human lung cancer) was purchased from the American Type Culture Collection (ATCC; Manassas, VA, USA), which is representative of lung cancer in humans. A549 cells are ideal for research on the biology of cancer [34]. The Dulbecco’s altered Eagle’s medium (DMEM) (Merck-Sigma-Aldrich, Budapest, Hungary, catalog number D6429) was used to cultivate these cells, supplemented with an additional 10% Fetal Bovine Serum (FBS) from Biosera, Cholet, France, and 1× penicillin/streptomycin solution (Thermo Fisher Scientific, Budapest, Hungary catalog number 15140122). Cultures were kept at 37 °C in a 5% CO2 atmosphere. Following the guidelines provided by the manufacturer, the designated cell lines were seeded onto 6-well plates. A TC20 automated cell counter (Bio-Rad Inc., Hercules, CA, USA) was used to measure the percentage of seeded cells. The experiment was conducted when reaching 50–60% confluence.

2.2. Tartrazine Treatment

Three different concentrations of TRZ mixed with DMEM medium—20 µM, 40 µM, and 80 µM (Table 1)—were freshly prepared and exposed to HaCaT, A549, and HepG2 cells for 24 h. We selected 20 µM of dimethyl-benzanthracene (DMBA) (39570 Merck-Sigma-Aldrich, Budapest, Hungary) dissolved in 1% dimethyl sulfoxide (DMSO) (Merck-Sigma-Aldrich, Budapest, Hungary, catalog number D2650) for positive control. Each experiment was repeated three times (biological replicates) to ensure reproducibility of the results. The medium containing TRZ was aspirated after 24 h, and then to stop the treatment, phosphate buffer saline was used to rinse the cells.

2.3. RNA Extraction and Quantitative Real-Time PCR Analysis

Following the manufacturer’s instructions, total RNA was extracted using a semiauto-mated procedure made possible by the Maxwell® RSC Instrument (Promega, Fitchburg, WI, USA) and a Maxwell® RSC RNA FFPE Kit (AS1440, Promega, Fitchburg, WI, USA). Thermo Scientific NanoDropTM 2000 (Thermo Fisher Scientific, Grand Island, NY, USA) was utilized to assess the purity of the RNA. The final step involved dissolving RNA in 50 µL of RNase-free water.
A Roche 480 system was used to perform quantitative real-time PCR tests (Roche, Basel, Switzerland) using the GoTaq® 1-Step RT-qPCR System (Promega GmbH), following the manufacturer’s instructions. The protocol included switch transcribing at 37 °C for 15 min, followed by reverse transcriptase deactivation and hot-start activation at 95 °C for 10 min. Subsequently, 40 cycles were performed, including 10 s of denaturation at 95 °C, 30 s of annealing at 60 °C, and elongation at 72 °C for 30 s. The target genes DNMT1, DNMT3A, DNMT3B, HDAC5, and HDAC6 were furthermore utilized as internal controls in addition to the housekeeping gene hypoxanthine-guanine Phosphoribosyl transferase 1 (HPRT1), the detailed forward and reverse primer sequences for the mentioned genes are available in our previous study [35]. The primers and the basic sequences of these genes were created with Integrated DNA Technologies (Bio-Sciences, Budapest, Hungary) and Primer Express TM 3.0.1 Software (Applied Biosystems, Budapest, Hungary). The results were analyzed using the relative quantification technique known as (2−∆∆CT) [36].

2.4. Assessment of Genomic DNA Stability

Prior to performing the comet assay, cell viability was determined using the trypan blue exclusion method in accordance with the manufacturer’s instructions. Briefly, 10 µL of the cell suspension was mixed with 10 µL of 0.4% trypan blue dye (Merck-Sigma-Aldrich, Budapest, Hungary, catalog number T8154). The mixture was then loaded onto a dual-chamber cell counting slide (Bio-Rad, Budapest, Hungary), and the percentage of viable cells was quantified using the TC20™ automated cell counter (Bio-Rad Inc., Hercules, CA, USA). The viability assay was performed in Duplicate for each sample, and cell viability were above 75%. Using the alkaline comet assay, the effect of various concentrations of tartrazine on genomic DNA integrity was evaluated in HaCat, HepG2, and A549 cells, and for control, the seeded cells received only the medium. A total of 0.5 mL of the cell culture was resuspended in physiological saline. For slide preparation, 150 μL of 0.5% normal melting point agarose (NMA) was spread on each slide and covered with a coverslip to allow solidification. Next, 500 μL of 1% low melting point agarose (LMPA) was mixed with 50 μL of cell culture, and 100 μL of this mixture was layered onto the first agarose coating. A third layer, consisting only of 100 μL 1% LMPA, was then applied on top. After each layer, a coverslip was gently placed to ensure even distribution of the agarose. The slides were incubated in a dark, humid chamber at 37 °C for at least 60 min, followed by immersion in a lysis solution (2.5 M NaCl, 1% sodium sarcosinate, 100 mM Na2 -EDTA, 10% DMSO, 10 mM Tris, and 1% Triton X-100) for 1 h at 4 °C. Subsequently, they were placed in an electrophoresis buffer containing 200 mM EDTA and 10 mM NaOH (pH 10) for 20 min. Electrophoresis was then carried out in the dark for 40 min at 132 mA and 0.46 V/cm. After electrophoresis, in 5 min intervals, the slides were neutralized three times with a 0.4 M Tris solution and stained with 50 μL ethidium bromide. At least 50 nuclei per slide were analyzed using Comet Assay IV Imaging Software, Version 4.3.1 (400× magnification; Perceptive Instruments Ltd., Bury St Edmunds, UK), and DNA damage was quantified based on the tail moment parameter evaluated and measured my comet assay IV software (Perceptive Instruments Ltd., Bury St Edmunds, UK).

2.5. Statistical Analysis

For the qRT-PCR results, Kolmogorov-Smirnov Test was performed to test normality, the Levene statistic to assess the homogeneity of variance, the one-way ANOVA test to compare means, and the Tukey and Tamhane tests to identify significant differences during the post hoc analysis. Additionally, for the comet assay results, we performed the Mann–Whitney U test to evaluate statistical significance. Statistical analysis was executed using IBM SPSS Statistics for Windows, Version 26.0 (Armonk, NY, USA). Differences were considered significant at p < 0.05.

3. Results

The research evaluated the expression levels of epigenetic-associated enzymes, specifically DNMT1, DNMT3a, DNMT3b, HDAC5, and HDAC6, in HaCaT, HepG2, and A549 cell cultures. Relative mRNA expression was measured using HPRT1 as the reference gene for normalization. We present the results of relative gene expression following exposure to TRZ concentrations ranging from 20 to 80 µM compared to 20 µM DMBA as positive control.
Overall, our findings indicate that TRZ has increased the gene expression of the mentioned genes by 0.5 to 1-fold compared to DMBA, a well-known carcinogen.

3.1. TRZ Exposure Significantly Upregulates DNMT1, DNMT3a, and DNMT3b Gene Expression in a Dose-Dependent Manner Across HaCaT, HepG2, and A549 Cell Lines

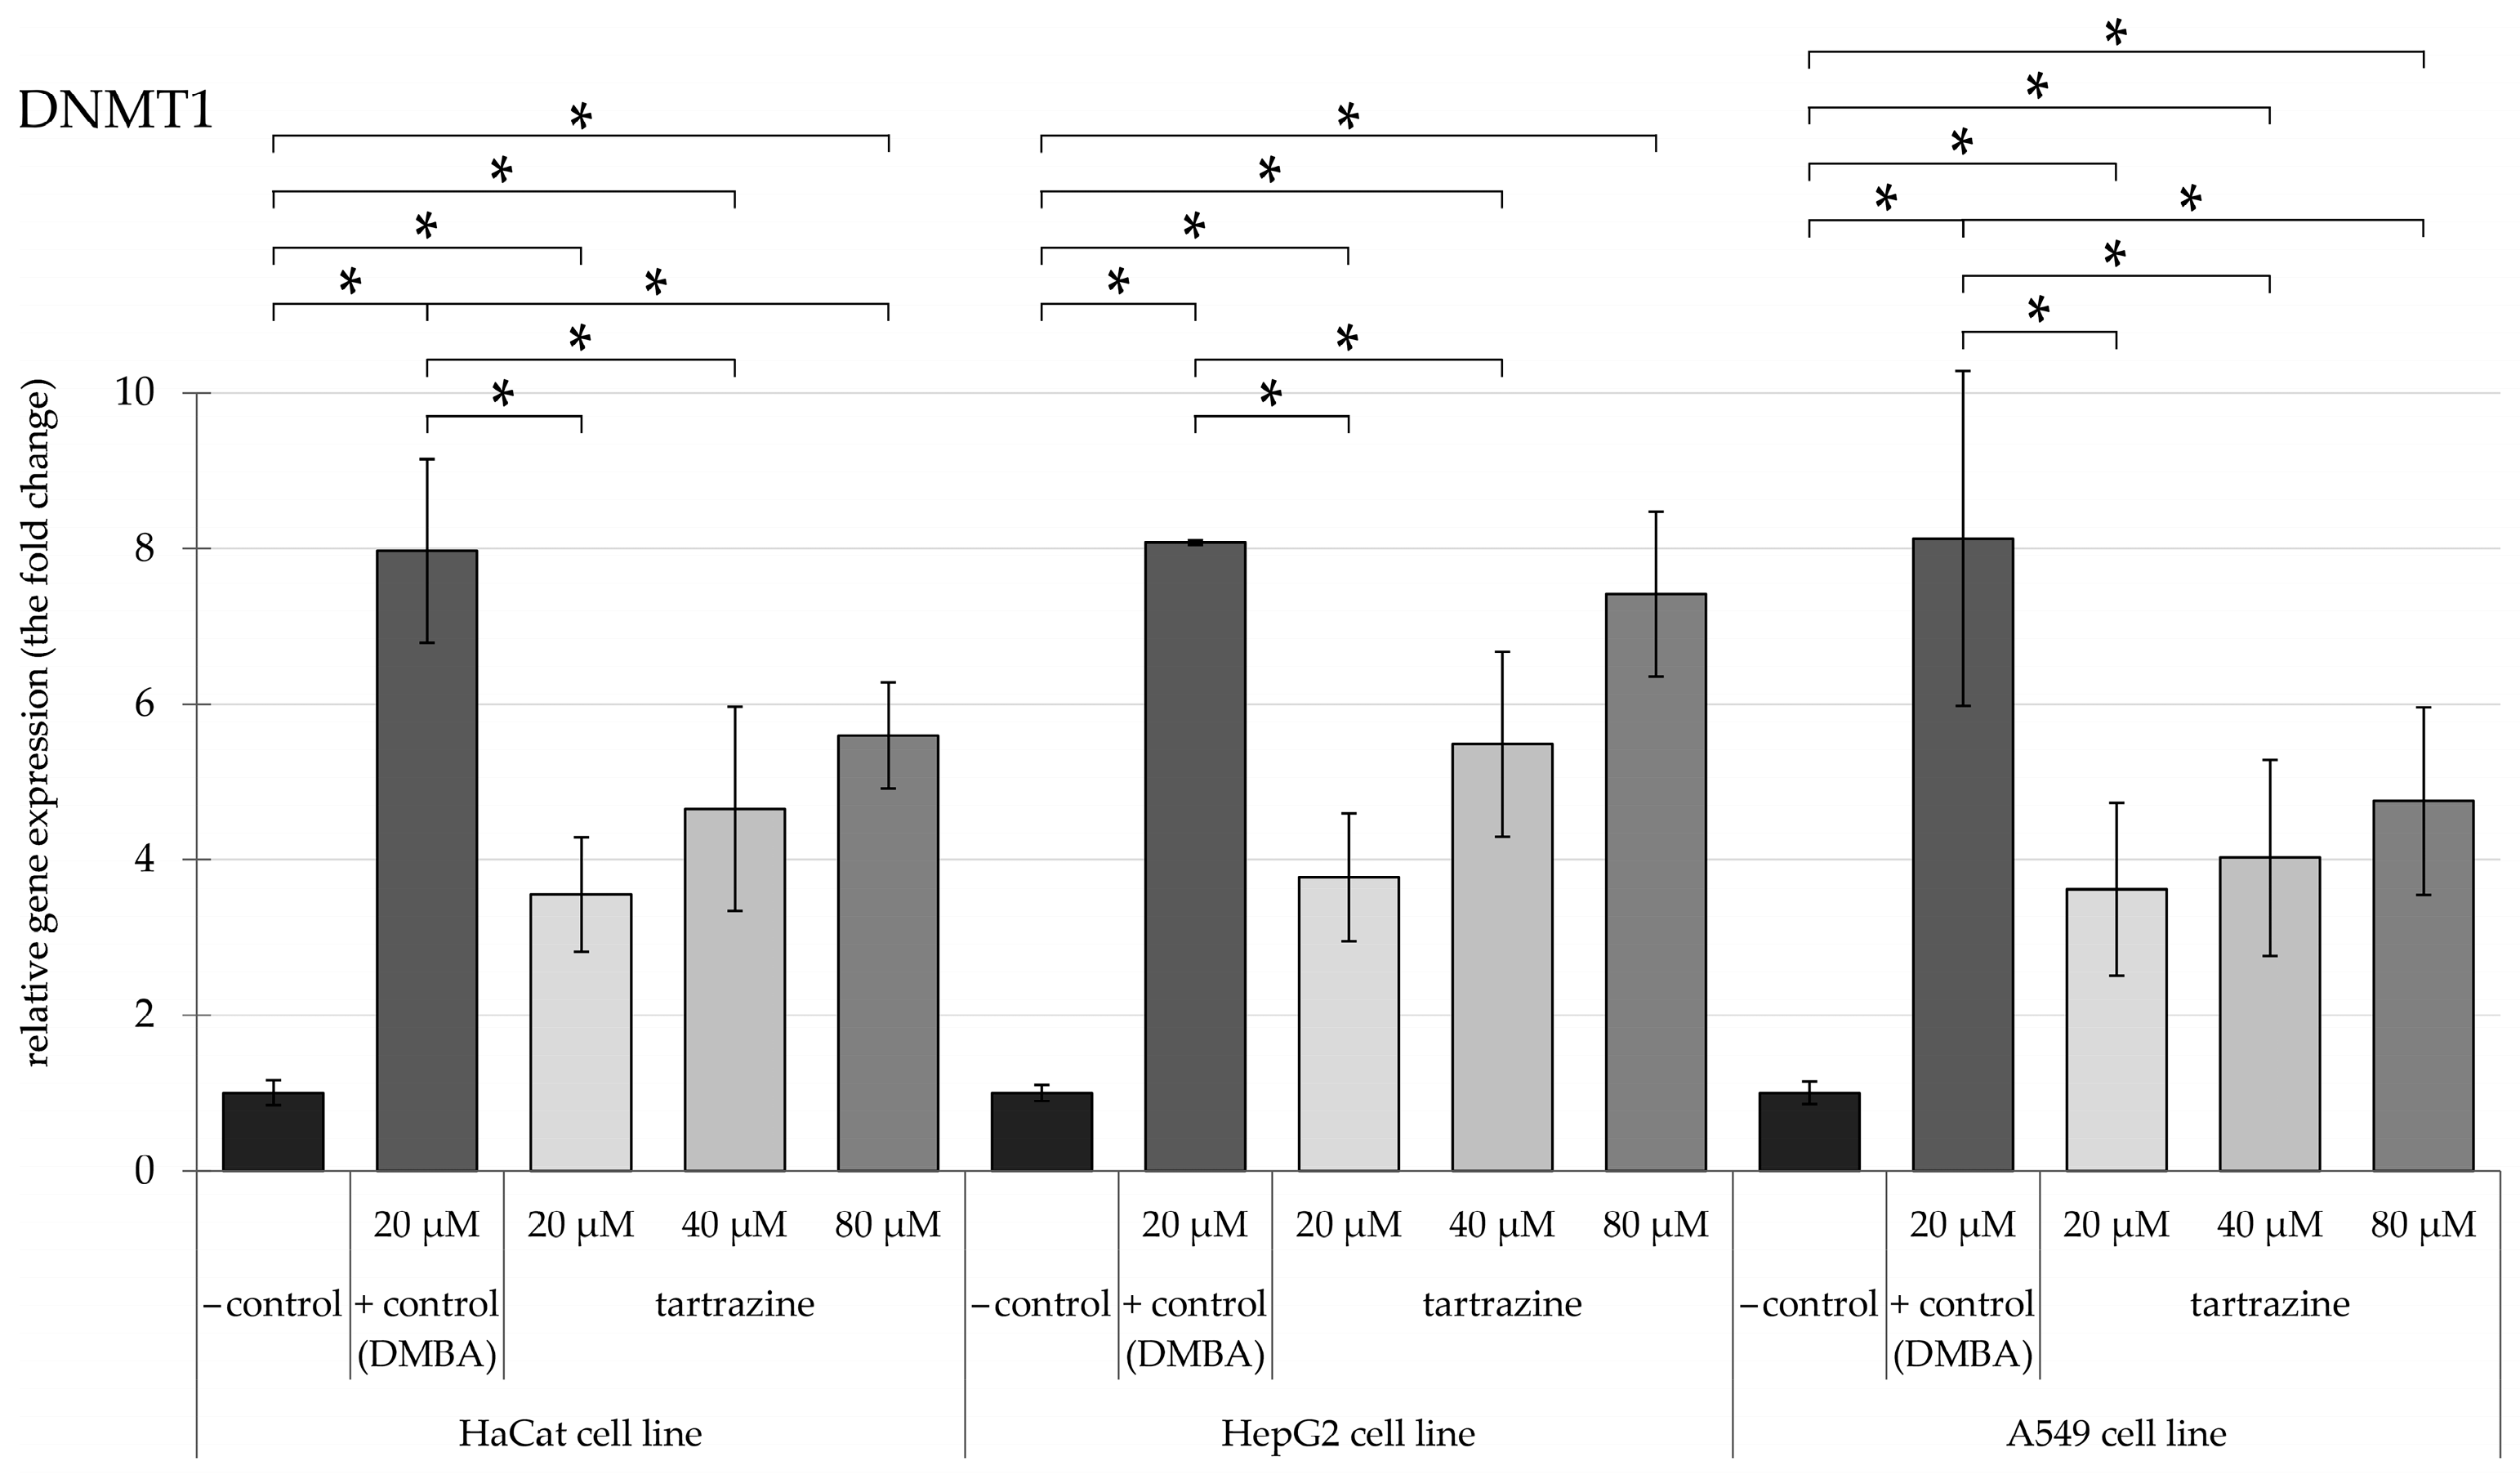
Concerning DNMT1 (Figure 2), TRZ significantly elevated the DNMT1 relative gene expression level compared to the negative control across all cell lines. In HaCaT cells, TRZ at 20 µM increased gene expression significantly compared to the control. There was a significant increase in the relative gene expression level in the HepG2 cell line, with increases of over 4-fold, 6-fold, and notably 8-fold after administering the 20, 40, and 80 µM of TRZ, respectively. However, in the A549 cell line, the level of DNMT1 exhibited a consistent 4-fold significant increase in all the mentioned concentrations.
Derived from the analysis of DNMT3a (Figure 3), the findings revealed a dose-dependent, statistically significant elevation in the HaCaT cell line following exposure to varied TRZ doses. When compared to the group under control, there was a 4-fold increase following the administration of 80 µM of TRZ. In the HepG2 cell line, the level of DNMT3a gene expression also exhibited a significant dose-dependent elevation, ranging from 2-fold to 4-fold, respectively. The A549 cell line exhibited a significant 3-fold increase relative to the negative control at all selected TRZ concentrations.
Exposure to TRZ resulted in an elevated level of DNMT3b (Figure 4) across all tested cell lines. In HaCaT cells, the expression of this enzyme gene increased in a dose-dependent manner, reaching an approximately 6-fold rise at 80 µM concentrations. Even the lowest concentration of tartrazine in HepG2 cells quadrupled the mRNA gene expression level compared to the control; however, increasing the dose did not cause any further increase in DNMT3b expression levels.
Additionally, in the A549 cell line, the level of DNMT3b gene expression nearly reached an almost 8-fold increase at an 80 µM concentration, standing for a 6-fold higher.

3.2. TRZ Exposure Induces Significant Overexpression of HDAC5 and HDAC6 Genes in HaCaT, HepG2, and A549 Cell Lines

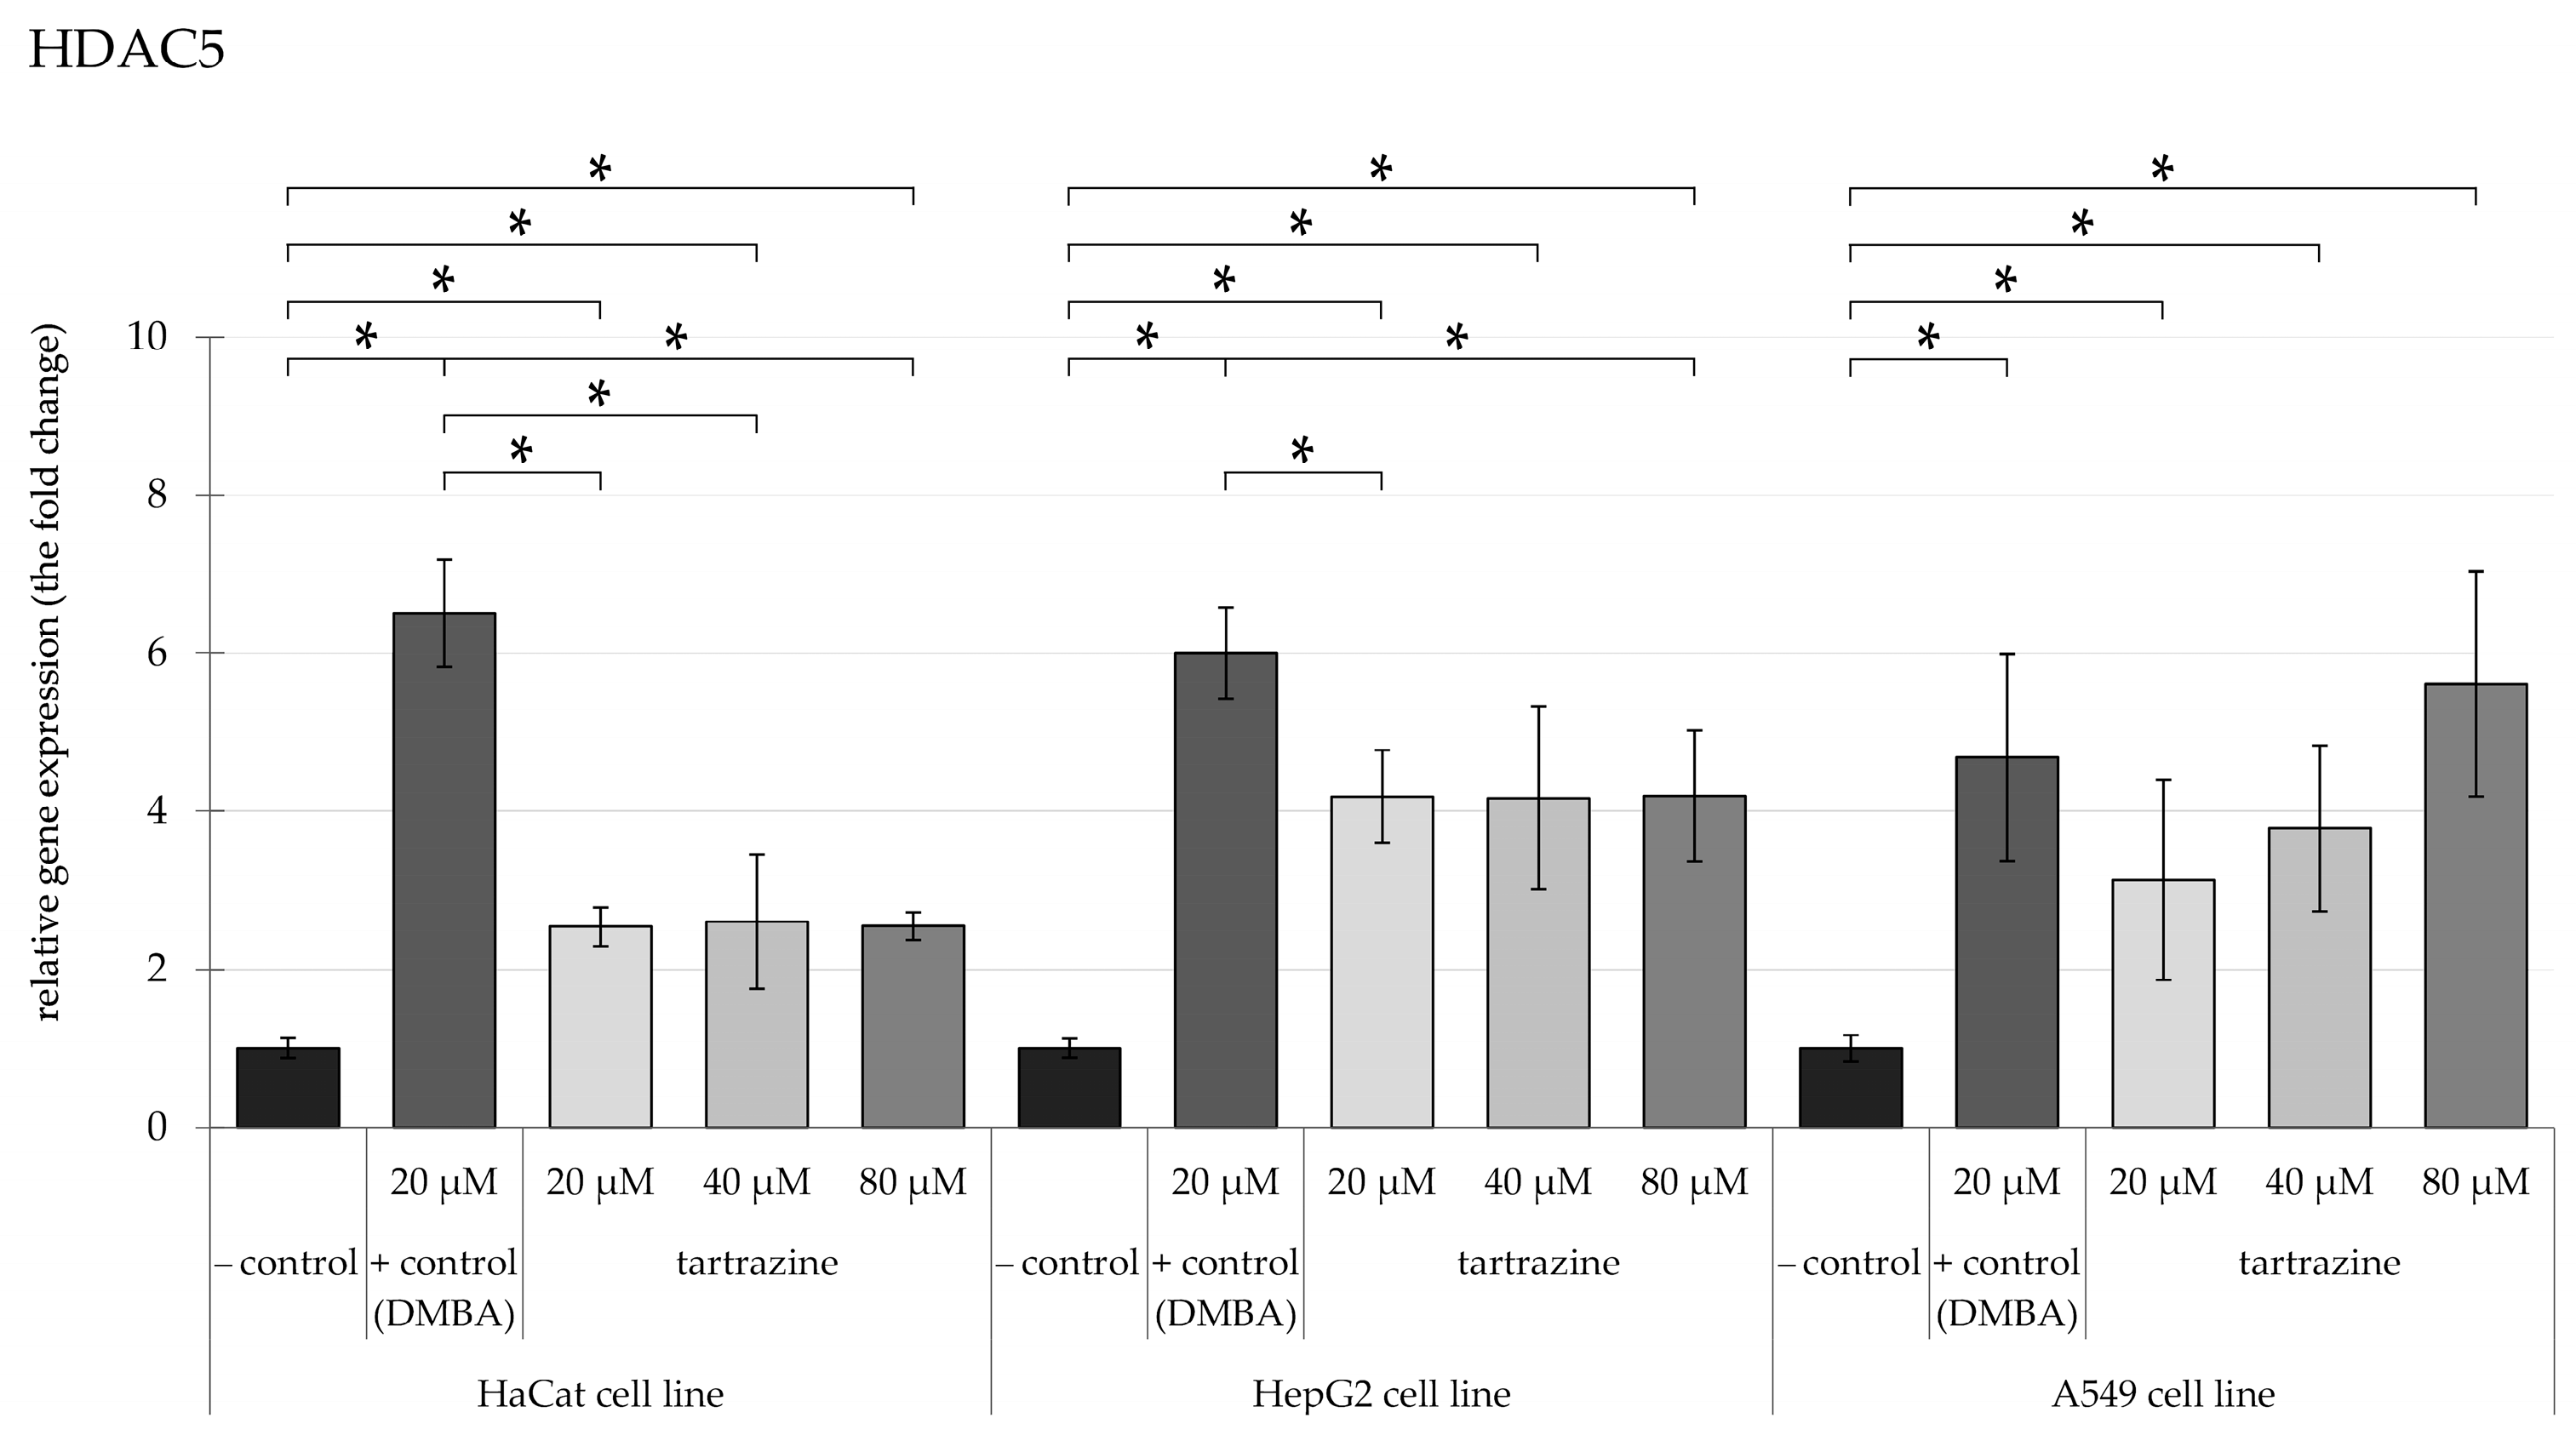
Expression at 40 µM concentration. Concerning the impact of TRZ on HDAC5 (Figure 5), gene expression in HaCaT and HepG2 cell lines, a nearly a 3-4-fold significant increase was observed after exposure to 20 µM, reaching a plateau even at the higher concentration. Meanwhile, in A549 cells, the gene expression of HDAC5 reached an almost 6-fold increase after exposure to 80 µM of TRZ.
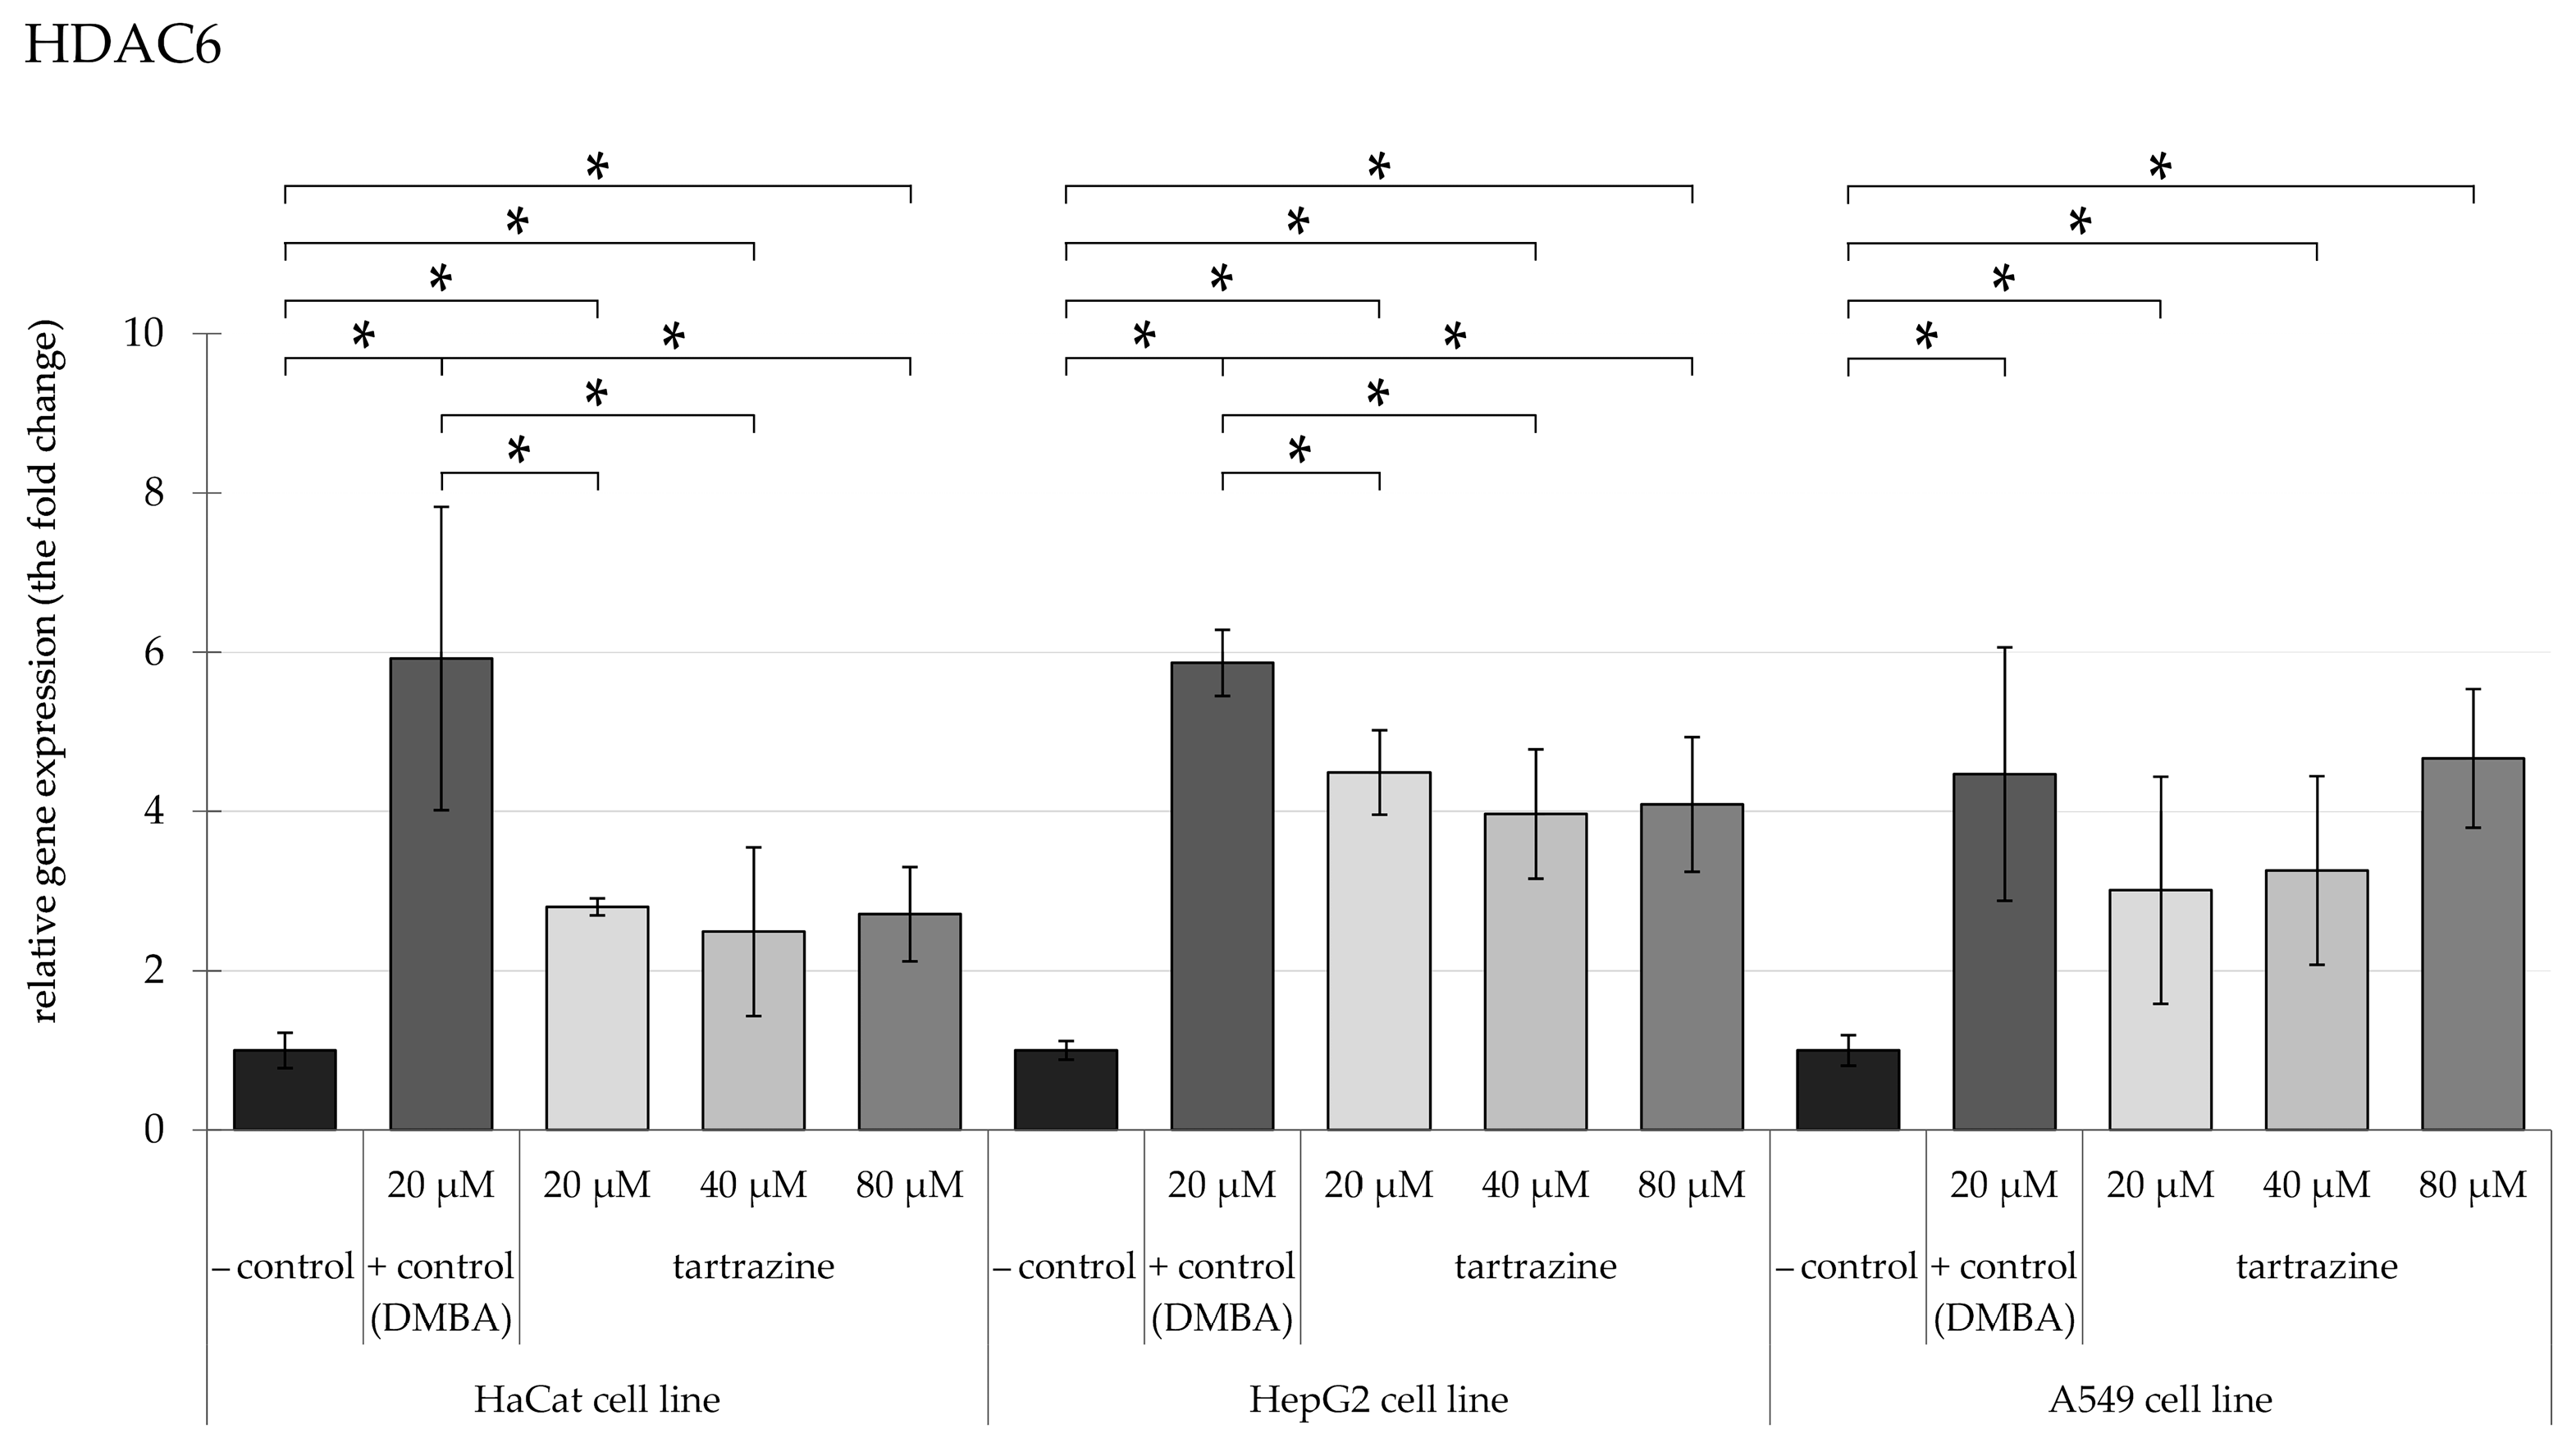
A comparable outcome was noted in the expression of the HDAC6 (Figure 6) gene, mirroring the pattern observed for HDAC5 expression in HaCaT and HepG2 cell lines. There was a significant overexpression of nearly 4-fold. In the A549 cell line, the overexpression was measured fivefold, and after exposure to 20 µM and 40 µM of TRZ, a following less than 1.5-fold significant increase was observed after 80 µM of TRZ.

3.3. TRZ Induces Dose-Dependent DNA Damage in HaCaT, A549, and HepG2 Cell Lines

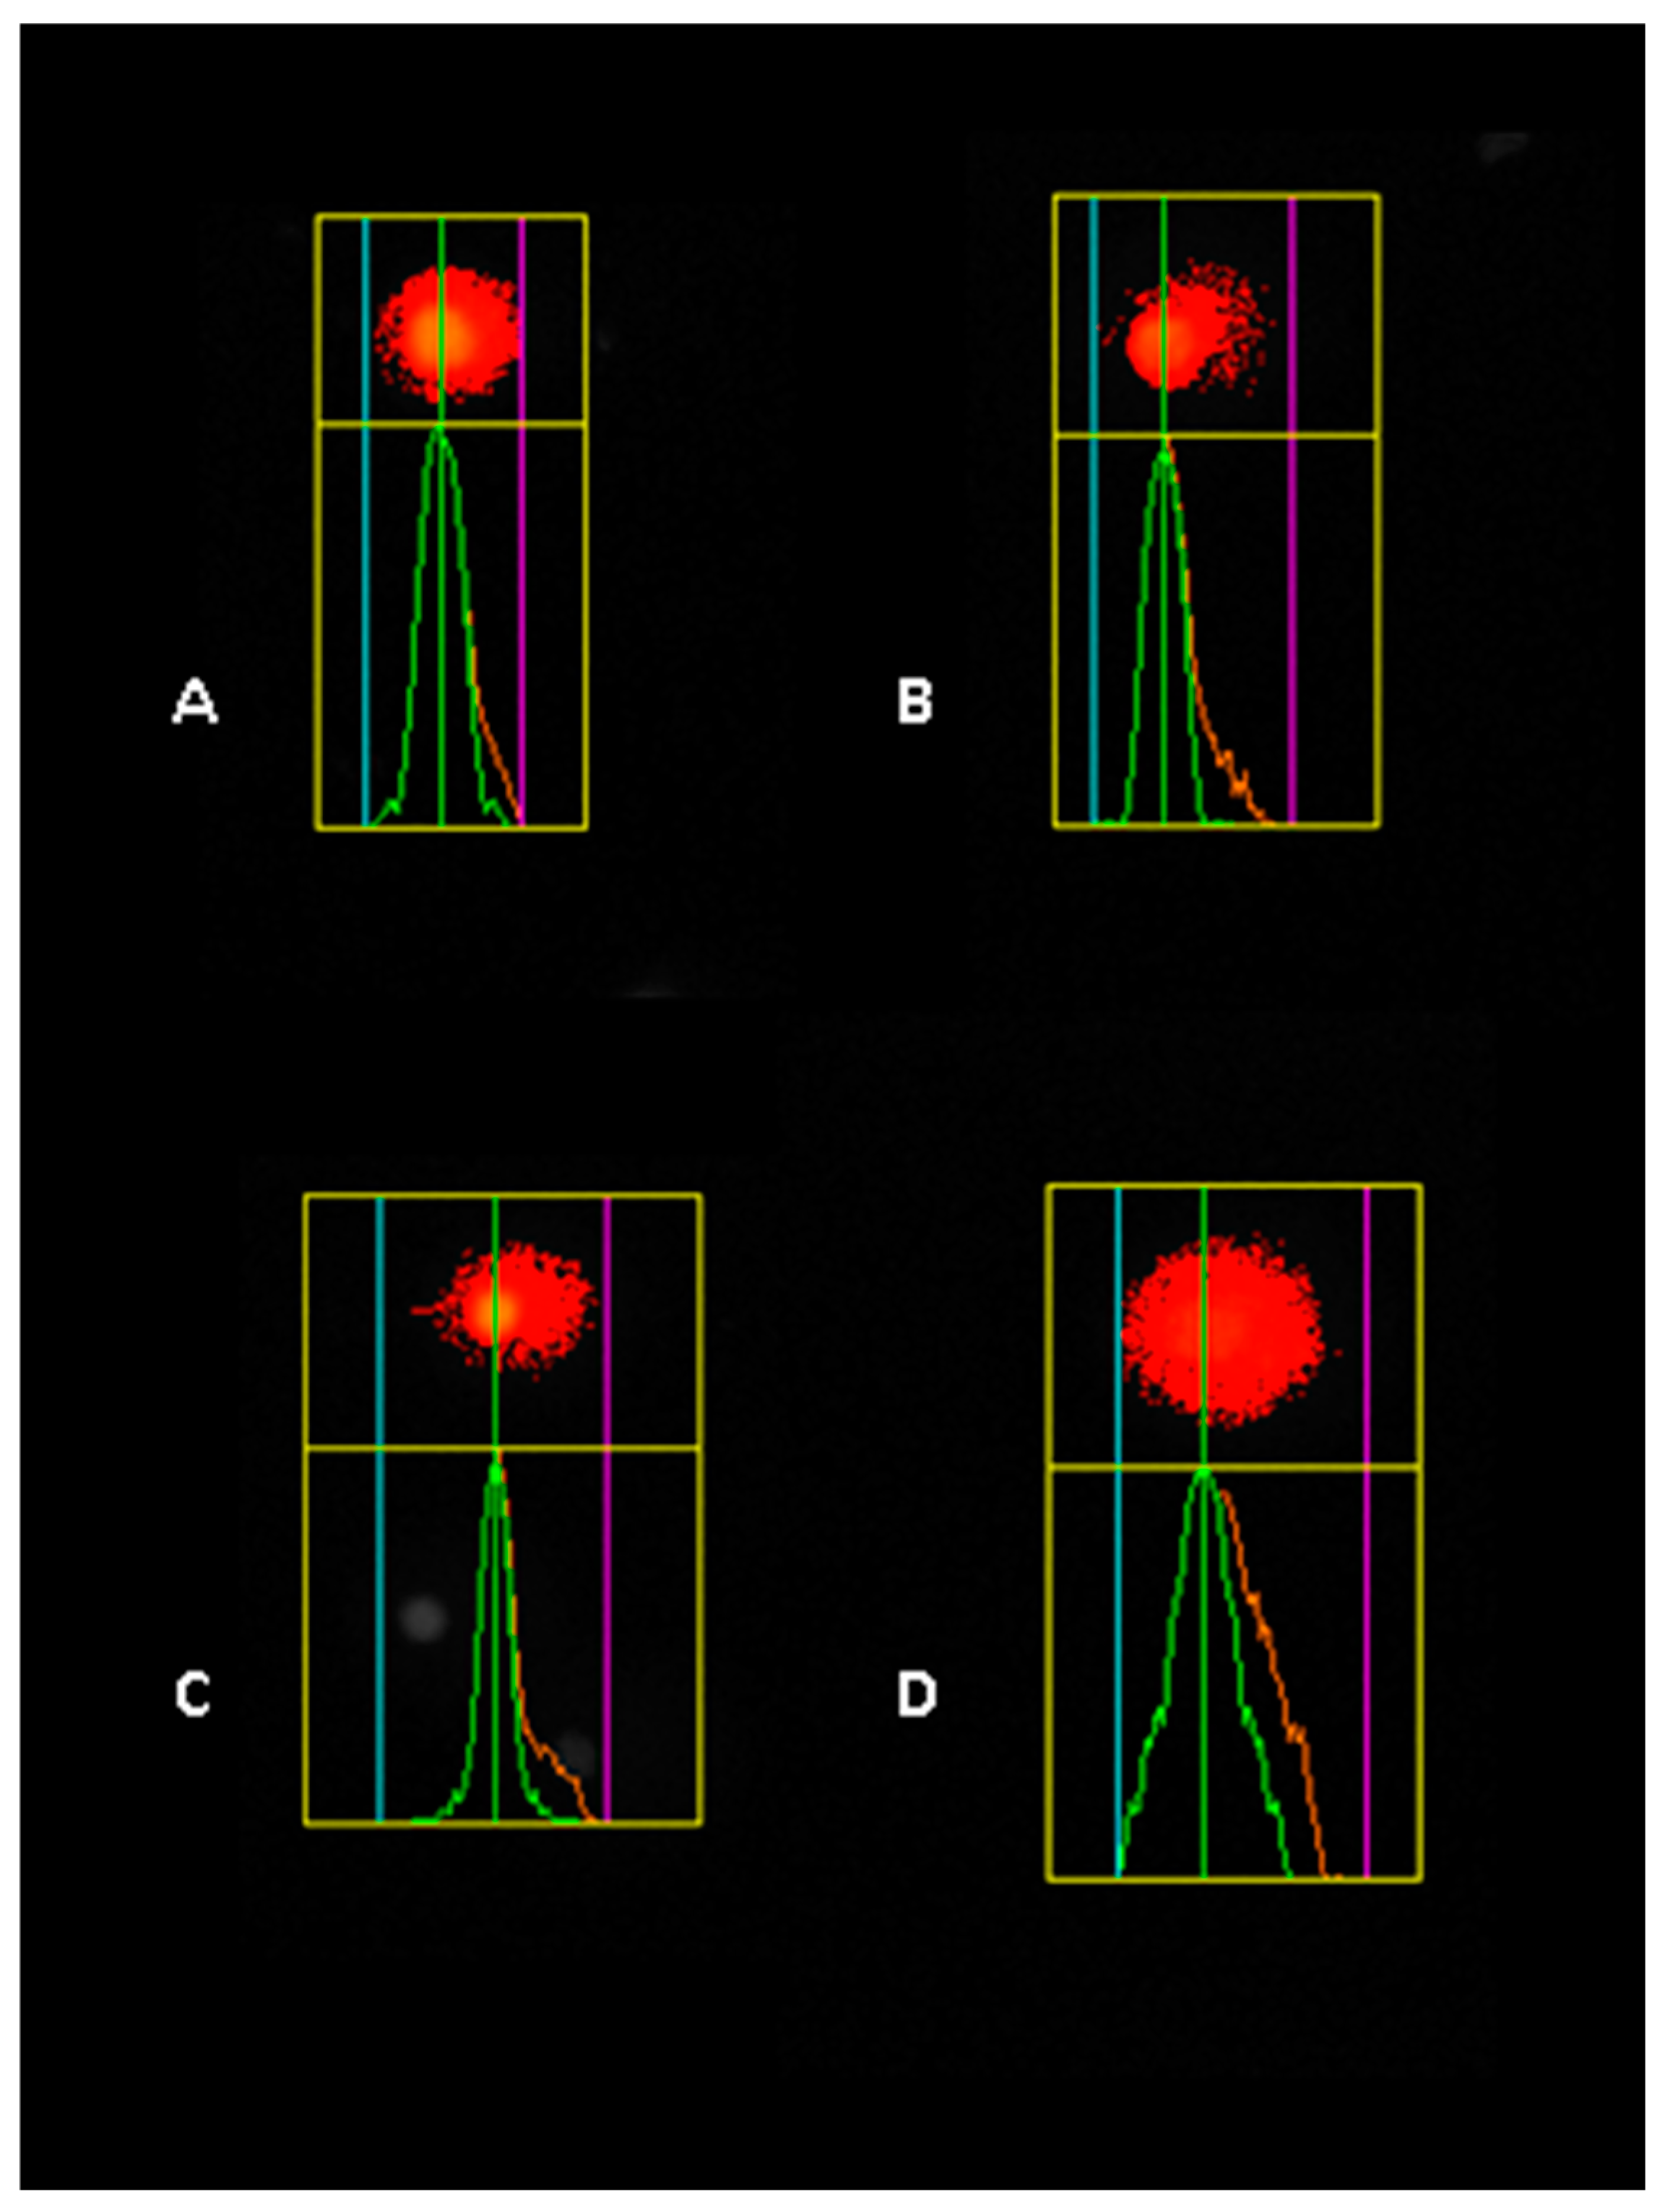
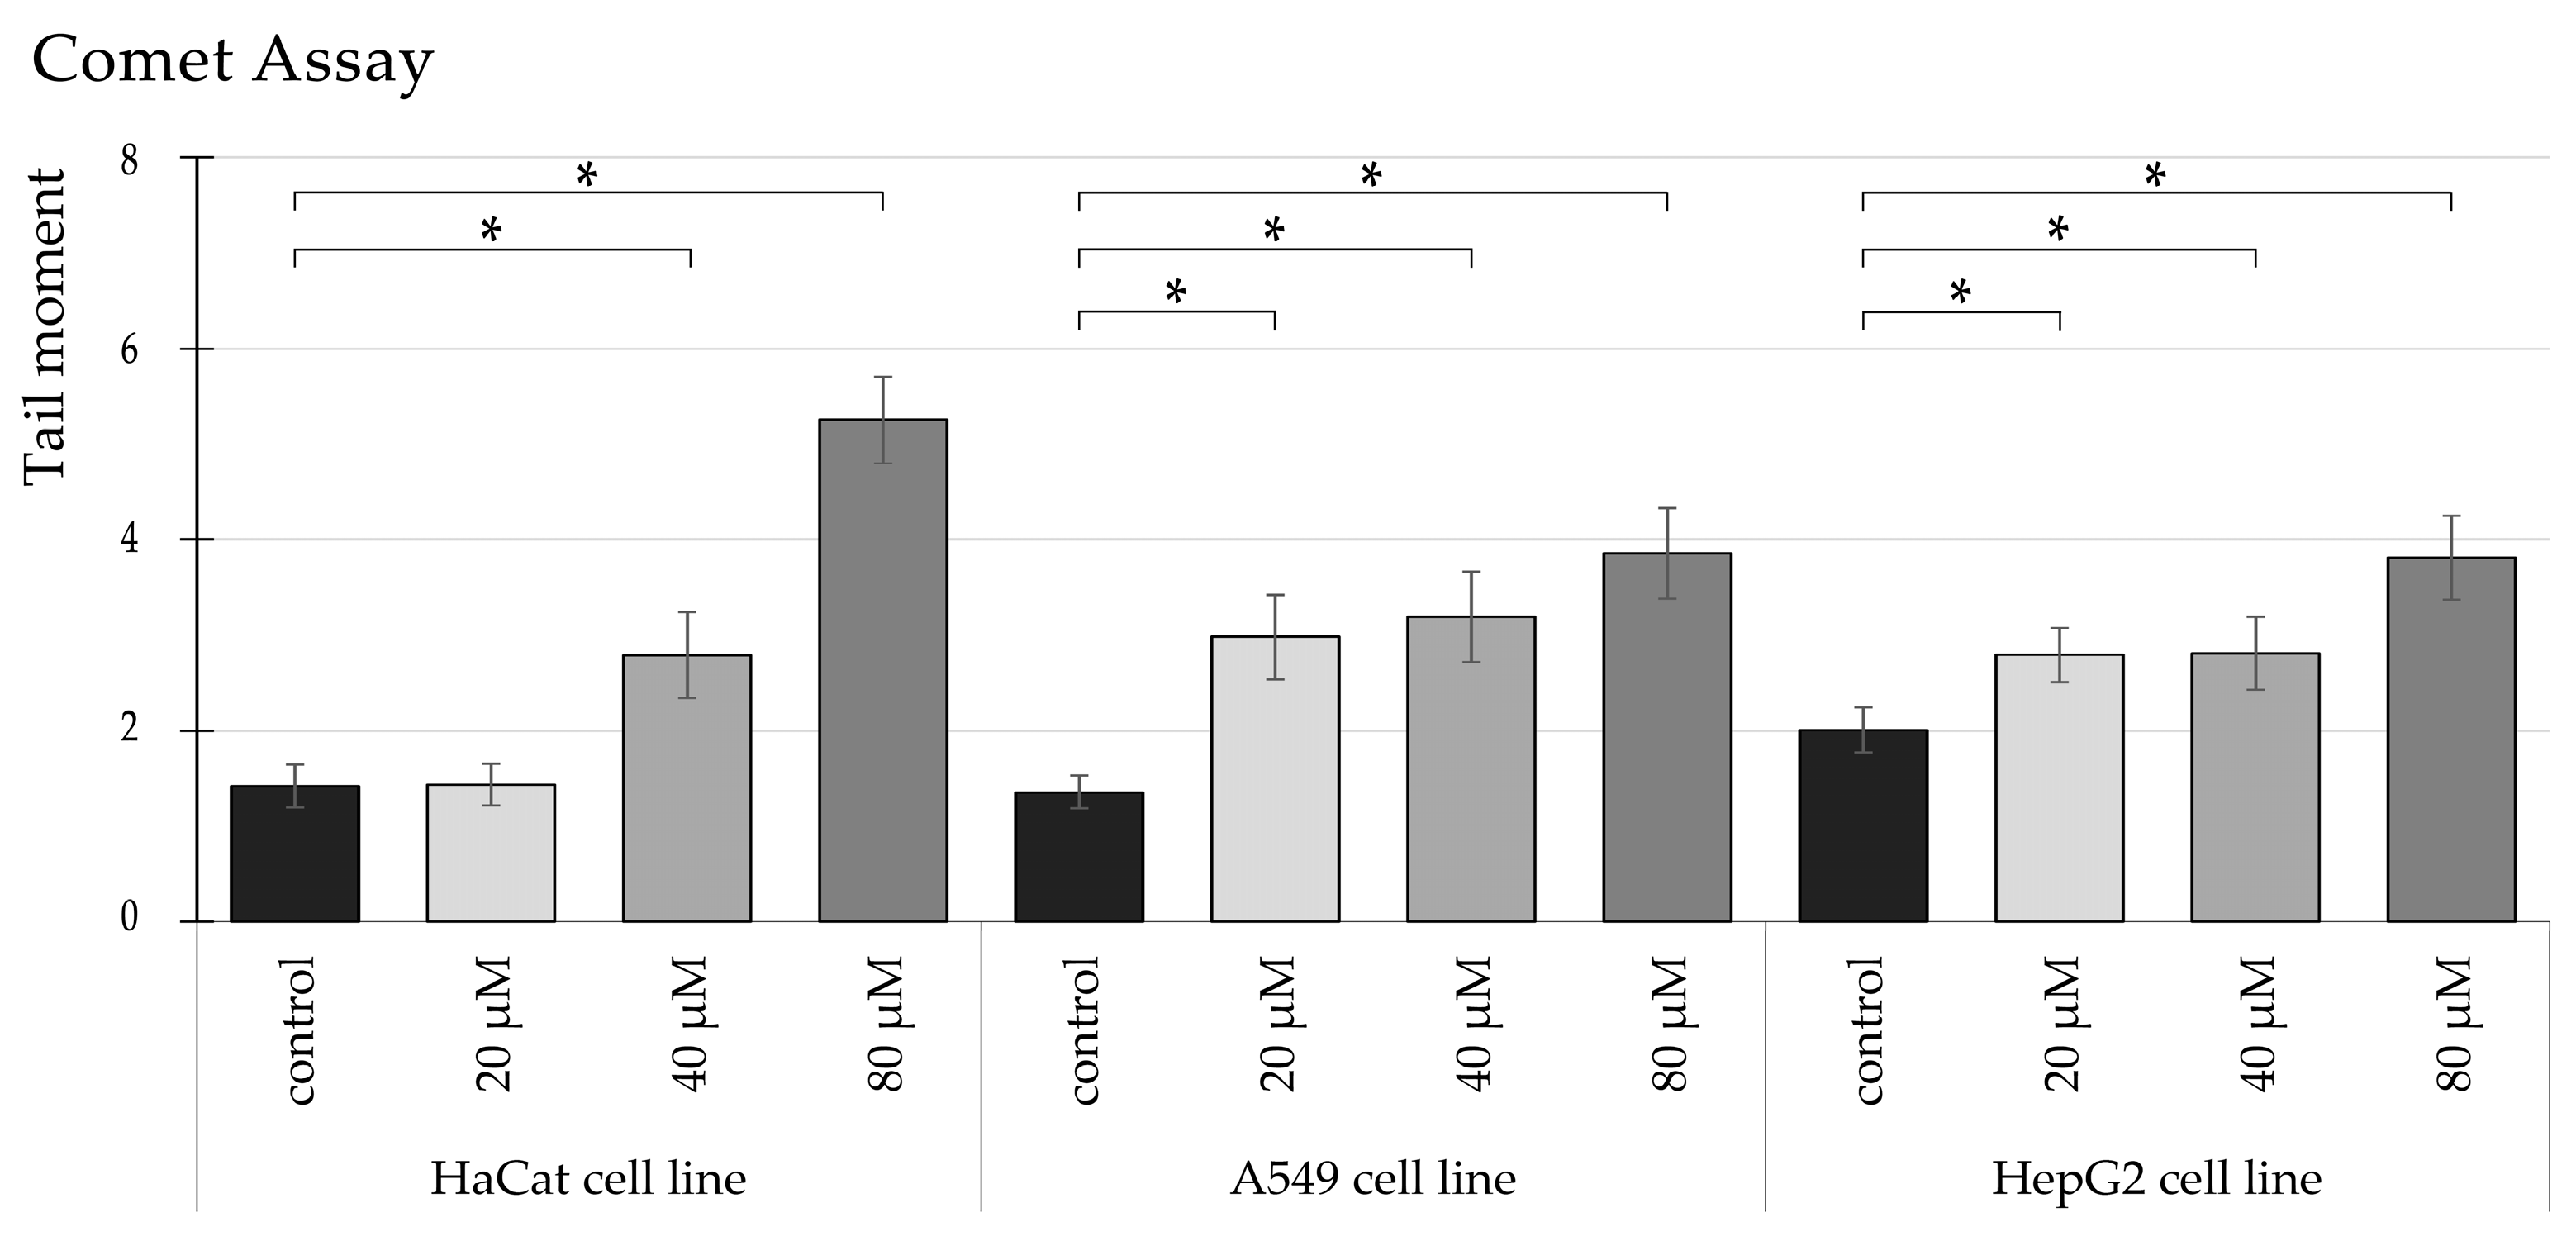
Our study highlights that Tartrazine exposure significantly increases DNA damage, measured as tail moments, in HaCaT, A549, and HepG2 cell lines, pointing to its potential genotoxic effects. In HaCaT cells, we observed a clear dose-dependent pattern, with DNA damage significantly higher by 2-fold at 40 µM and nearly 3.7-fold at 80 µM compared to both the control group and the 20 µM treatment (Figure 7).
In A549 cells, the impact of tartrazine was equally notable (Figure 8), with statistically significant increases in DNA damage across all tested concentrations (* p < 0.05). At 20 µM and 40 µM, tail moments nearly doubled compared to the control, while at 80 µM, the damage increased to a nearly 3-fold increase, highlighting the compound’s amplified genotoxic potential at higher doses.
HepG2 cells also showed a dose-dependent increase in DNA damage (Figure 9), with a nearly two-fold rise observed at 80 µM relative to the control group. However, the extent of DNA damage at 80 µM in HepG2 cells was slightly lower than in HaCaT and A549 cells, suggesting that HepG2 cells may exhibit reduced sensitivity or a distinct response to Tartrazine exposure.
In summary, our results confirm that tartrazine induces significant DNA damage in a concentration-dependent manner across all three cell lines (Figure 10). The variations in the magnitude of DNA damage suggest cell-line-specific differences, possibly influenced by their unique metabolic or repair mechanisms.

4. Discussion

Our research investigated how the presence of TRZ, a food azo dye, affects a specific group of genes involved in DNA epigenetic modification, namely DNMTs and HDACs, across various human cell lines. DNMTs represent a crucial category of enzymes that regulate epigenetic expression. They are responsible for the regular endogenous alteration of eukaryotic DNA, known as DNA methylation, which is essential to life. This process does not alter the DNA sequence or the gene product. However, it may modify how a gene is expressed [37]. After DNA synthesis, DNMT1s primary role is to keep the methylation state intact. De novo DNA methylation is catalyzed by DNMT3a and DNMT3b, which also catalyzes the methylation of several genomic DNA locations in vivo [38]. Compared to DNMT3a, DNMT3b has more methylation activity on nucleosomal DNA and bare DNA. The core region of nucleosomes contains DNA that is little methylated by DNMT3a, but DNMT3b methylates this DNA considerably, albeit with little activity. Studies have shown that the significant methylation activity of DNMT3b on the DNA in the nucleosome core and the preferential methylation activity of DNMT3a on bare nucleosomal DNA facilitate the remarkable methylation of genomic DNA in vivo [39].
In a recent study, administering TRZ at both low and high levels for a duration of 56 days resulted in elevated levels of alanine aminotransferase (ALT) and aspartate aminotransferase (AST) enzymes in male rats. Prior research has indicated that food coloring agents like TRZ could elevate oxidative stress by promoting the excessive generation of ROS in the liver [40]. In vivo, research has shown that both low and high doses of TRZ result in elevated levels of hepatic serum enzymes specifically ALT and AST, and oxidative stress biomarkers in rodent models [41].
Tartrazine induces oxidative stress in Chinese hamster ovary cells by lowering GSH levels and elevating MDA levels. This may compromise cellular defenses, potentially leading to various diseases connected to oxidative stress, such as cell death [42].
One study by Shakoor and colleagues demonstrates the increased level of reactive oxygen species, as well as glutathione reductase, compared to the control group following exposure of rats to oral TRZ. Research exploring the precise molecular pathways in the lungs impacted by TRZ remains limited. Certain studies have indicated that TRZ might trigger oxidative stress and inflammation [43]. Nevertheless, it could play a role in lung injury and worsen respiratory conditions like asthma. Increased DNMT activity in epithelial cells was discovered to be correlated with higher levels of prostaglandin E2 and cyclooxygenase-2 (Cox-2) by Ram Prasad’s research team [44]. According to this study, TRZ has elevated the relative expression of HDACs and DNMTs in A549 cells, suggesting a possible negative effect on lung health via inducing inflammation, oxidative stress, and the elevation of pro-inflammatory cytokines.
Recent findings propose that even minor quantities of azo dyes absorbed via tattoos could prompt an immune reaction [45]. Upon treatment of the different cancer cell lines (HaCaT, HepG2, and A549 cells) with TRZ in our study, DNMT1, DNMT3a, and DNMT3b were significantly upregulated at concentrations of 20, 40, and 80 µM for a duration of 24 h. While DNMT1 methylates DNA to maintain methylation patterns during cell division, DNMT3a and DNMT3b are essential for the establishment of de novo DNA methylation [46]. Our study depicts that increased expression of DNMT 1 in HaCaT, HepG2, and A549 cells is crucial for certain cancer categorization, early detection, therapy, and the forecasting of metastasis and recurrence [47,48,49]. These findings have been supported by Zhang and colleagues, who investigated similar DNA methylation in cervical cancer. Moreover, reports have said that DNMT1 silencing induces apoptosis and suppresses proliferation [50]. Certain bioactive dietary ingredients can exhibit anti-cancer effects by inhibiting DNA methyltransferase and reducing DNA hypermethylation of key genes. Examples include genistein (soybeans), dietary polyphenols (various plant sources), certain isothiocyanates, and (−)-epigallocatechin-3-gallate (EGCG) from green tea. Their cancer-suppressive activity is partly due to the reactivation of genes, including tumor suppressors, through the demethylation of previously silenced promoters [51]. Dietary polyphenols, such as EGCG, can directly inhibit DNMT1 by interacting with its catalytic site and may also indirectly influence methylation through metabolic pathways. Consequently, dietary DNMT inhibitors hold promise for supplementary cancer treatment and prevention by reversing the hypermethylation-induced silencing of key tumor suppressor genes [51]. Synthetic food colorants like tartrazine have been linked to DNA methylation changes that contribute to genomic instability. In contrast, natural dietary compounds, such as indicaxanthin—a betalain pigment found in prickly pear—have shown beneficial effects by inducing autophagy and facilitating DNA demethylation in colorectal cancer cells. These findings highlight the dual role of dietary components in epigenetic regulation, with their impact varying based on their chemical composition and metabolic interactions, potentially promoting either carcinogenic or protective outcomes [52]. Our findings, therefore, explicitly demonstrate the potential activity of TRZ on critical gene expression common in HaCaT, HepG2, and A549 cells.
Histone deacetylases (HDACs) are chromatin-modifying enzymes that control epigenetic gene expression. Numerous cellular functions depend on HDACs, which deacetylate histone and nonhistone proteins. There are reports of HDAC overexpression in various cancer forms associated with faster cell division and survival [53]. HDAC5 (a class IIa HDAC) is one of the eighteen human HDACs that has been identified to be involved in dynamic processes like myoblast differentiation [54], neuronal regrowth and restoration, and synoviocyte activation. Nowadays, research has shown that hepatocellular carcinoma and high-risk medulloblastoma exhibit aberrant overexpression of HDAC5, while colon cancer [55] and lung cancer patients’ poor prognosis are linked to HDAC5 downregulation [56]. In human breast cancer, HDAC5 stimulates proliferation, invasion, and migration, making it a possible therapeutic target and prognostic indicator [57]. Our findings demonstrated a generalized upregulation of HDAC5 and HDAC6 genes in HaCaT, HepG2, and A549 after treatment exposure with TRZ, indicating that HDAC5 and HDAC6 are potential lung, liver, and skin cancers therapeutic targets and prognostic biomarkers.
The comet assay is a powerful tool for monitoring human and environmental exposures to genotoxic substances and can aid in hazard characterization for risk assessment [58,59]. In our previous research, we have discussed that, gastrointestinal microflora can metabolize tartrazine into the aromatic amine sulfanilic acid, which may generate reactive oxygen species (ROS) and lead to oxidative stress. In rats, tartrazine induces dose-dependent DNA damage in the colon, potentially leading to tumor formation. Peroxynitrite, formed by the reaction of nitric oxide with ROS, may further contribute to DNA damage [60]. In this study, we observed a significant increase in DNA damage from tartrazine exposure in all studied human cell lines, measured by comet assay. Long-term studies by Himri et al. show that acceptable daily intake (ADI) levels of tartrazine and its byproducts can produce ROS, inducing oxidative stress that affects hepatic and renal structures and their biochemical profiles. Notably, tartrazine exposure also significantly reduces total antioxidant capacity [61]. El-Desoky and colleagues observed a genotoxic effect of tartrazine on bone marrow cells in treated rats, as indicated by the comet assay. Compared to controls, the percentage of DNA in comet tails rose significantly (p < 0.01) following tartrazine exposure [62].
Azo dyes like tartrazine are the most commonly utilized colorants in the cosmetics industry. They are found in lipsticks, facial products, toothpaste, mouthwash, shampoos, detergents, and other everyday items. Moreover, they serve as dyes for wool and silk [47]. Human skin can directly absorb azo dye from clothing [48]. Direct contact of the skin with azo dyes such as TRZ could result in allergic responses like urticaria and eczema [49]. Urticaria has been directly associated with abnormal expression of DNMT; research indicates that DNA methylation alterations can impact T cells’ multiplication, stimulation, and specialization [50,51]. Another study found that HDAC inhibitors can inhibit mast cell activation, which also plays a crucial role in allergic reactions [52]. Elevated expression of DNMTs and HDACs induced by TRZ may exacerbate conditions like urticaria and eczema. Therefore, we encapsulate the detrimental effects of TRZ applied as a colorant in various human applications, in relation to specific cancer types’ of growth and proliferation.

5. Conclusions

This study, to the best of our knowledge, is the first to examine the impact of tartrazine on DNMTs as well as HDACs genes in human cell lines. Tartrazine significantly upregulates the gene expression of DNMTs and HDACs in the experimented cell lines, which play a role in cell proliferation. Comparing our data with existing literature, we propose a hypothesis that the consumption of tartrazine might promote the growth of cells and potentially elevate the risk of cancer development. These findings highlight the urgent need for further investigation in this area to better understand the potential health risks associated with tartrazine consumption.

Author Contributions

Conceptualization, A.Z. and T.V.; methodology A.Z. and T.V.; software A.Z.; validation, T.V. and I.S.; formal analysis, A.Z.; investigation, A.Z., I.S., G.G. and Á.M.; resources, T.V.; data curation, T.V.; writing—original draft preparation, A.Z. and J.M.M.; writing—review and editing, T.V. and B.L.R.; visualization A.Z. and T.V.; supervision, T.V.; project administration, A.Z. and T.V.; funding acquisition, T.V. All authors have read and agreed to the published version of the manuscript.

Funding

This research received no external funding.

Institutional Review Board Statement

Not applicable.

Informed Consent Statement

Not applicable.

Data Availability Statement

Data will be made available upon request due to the fact that this manuscript is part of a multiple study.

Conflicts of Interest

The authors declare no conflicts of interest.

Abbreviations

The following abbreviations are used in this manuscript:
ADIlinear dichroism
EFSAEuropean Food Safety Authority
FDAFood and Drug Administration
A549human lung adenocarcinoma
Achacetylcholine
ALTalanine aminotransferase
ASTaspartate aminotransferase
Cox-2cyclooxygenase-2
DMBAdimethyl-benzanthracene
DMEMDulbecco’s altered Eagle’s medium
DMSOdimethyl sulfoxide
DNMTDNA methyltransferases
DNMT1DNA methyltransferases 1
DNMT3DNA methyltransferases 3b
DNMT3aDNA methyltransferases 3a
EGCG(−)-epigallocatechin-3-gallate
FBSfetal bovine serum
GABAgamma-aminobutyric acid
GSHglutathione
HaCaTimmortalized human keratinocyte
HepG2human hepatocellular carcinoma
HPRT1hypoxanthine-guanine Phosphoribosyl transferase 1
MDAmalondialdehyde
NOAELNo observed adverse effect level
ROSreactive oxygen species
RT-qPCRreverse transcription-quantitative polymerase chain reaction
TRZtartrazine
TSGstumor suppressor gene

References

  1. Color Additives in Foods|FDA. Available online: https://www.fda.gov/food/color-additives-information-consumers/color-additives-foods (accessed on 18 March 2024).
  2. EFSA Panel on Food Additives and Nutrient Sources AddTives Nutrient Sources Added to Food. Scientific Opinion on the Re-Evaluation Tartrazine (E 102). EFSA J. 2009, 7, 1331. [Google Scholar] [CrossRef]
  3. Leo, L.; Loong, C.; Ho, X.L.; Raman, M.F.B.; Suan, M.Y.T.; Loke, W.M. Occurrence of Azo Food Dyes and Their Effects on Cellular Inflammatory Responses. Nutrition 2018, 46, 36–40. [Google Scholar] [CrossRef] [PubMed]
  4. Revankar, M.S.; Lele, S.S. Synthetic Dye Decolorization by White Rot Fungus, Ganoderma Sp. WR-1. Bioresour. Technol. 2007, 98, 775–780. [Google Scholar] [CrossRef] [PubMed]
  5. Amin, K.A.; Al-Shehri, F.S. Toxicological and Safety Assessment of Tartrazine as a Synthetic Food Additive on Health Biomarkers: A Review. Afr. J. Biotechnol. 2018, 17, 139–149. [Google Scholar] [CrossRef]
  6. Alsalman, N.; Aljafari, A.; Wani, T.A.; Zargar, S. High-Dose Aspirin Reverses Tartrazine-Induced Cell Growth Dysregulation Independent of P53 Signaling and Antioxidant Mechanisms in Rat Brain. BioMed Res. Int. 2019, 2019, 9096404. [Google Scholar] [CrossRef]
  7. Meyer, S.K.; Probert, P.M.E.; Lakey, A.F.; Axon, A.R.; Leitch, A.C.; Williams, F.M.; Jowsey, P.A.; Blain, P.G.; Kass, G.E.N.; Wright, M.C. Hepatic Effects of Tartrazine (E 102) after Systemic Exposure Are Independent of Oestrogen Receptor Interactions in the Mouse. Toxicol. Lett. 2017, 273, 55–68. [Google Scholar] [CrossRef]
  8. Amin, K.A.; Abdel Hameid, H.; Abd Elsttar, A.H. Effect of Food Azo Dyes Tartrazine and Carmoisine on Biochemical Parameters Related to Renal, Hepatic Function and Oxidative Stress Biomarkers in Young Male Rats. Food Chem. Toxicol. 2010, 48, 2994–2999. [Google Scholar] [CrossRef]
  9. Moutinho, I.L.D.; Bertges, L.C.; Assis, R.V.C. Prolonged Use of the Food Dye Tartrazine (FD&C Yellow N° 5) and Its Effects on the Gastric Mucosa of Wistar Rats. Braz. J. Biol. 2007, 67, 141–145. [Google Scholar] [CrossRef]
  10. Chung, K. Mutagenicity and Carcinogenicity of Aromatic Amines Metabolically Produced from Azo Dyes. J. Environ. Sci. Health Part C 2000, 18, 51–74. [Google Scholar] [CrossRef]
  11. Walton, K.; Walker, R.; Van De Sandt, J.J.M.; Castell, J.V.; Knapp, A.G.A.A.; Kozianowski, G.; Roberfroid, M.; Schilter, B. The Application of in Vitro Data in the Derivation of the Acceptable Daily Intake of Food Additives. Food Chem. Toxicol. 1999, 37, 1175–1197. [Google Scholar] [CrossRef]
  12. Ardern, K.; Ram, F.S.F.; Lasserson, T.J. Tartrazine Exclusion for Allergic Asthma. Cochrane Database Syst. Rev. 2001, 2001, CD000460. [Google Scholar] [CrossRef]
  13. Mohamed, A.A.R.; Galal, A.A.A.; Elewa, Y.H.A. Comparative Protective Effects of Royal Jelly and Cod Liver Oil against Neurotoxic Impact of Tartrazine on Male Rat Pups Brain. Acta Histochem. 2015, 117, 649–658. [Google Scholar] [CrossRef] [PubMed]
  14. Joint FAO/WHO Expert Committee on Food Additives. Evaluation of Certain Food Additives. World Health Organ. Technol. Rep. Ser. 2009, 1–208. [Google Scholar]
  15. Sasaki, Y.F.; Kawaguchi, S.; Kamaya, A.; Ohshita, M.; Kabasawa, K.; Iwama, K.; Taniguchi, K.; Tsuda, S. The Comet Assay with 8 Mouse Organs: Results with 39 Currently Used Food Additives. Mutat. Res. Genet. Toxicol. Environ. Mutagen. 2002, 519, 103–119. [Google Scholar] [CrossRef] [PubMed]
  16. McCann, D.; Barrett, A.; Cooper, A.; Crumpler, D.; Dalen, L.; Grimshaw, K.; Kitchin, E.; Lok, K.; Porteous, L.; Prince, E.; et al. Food Additives and Hyperactive Behaviour in 3-Year-Old and 8/9-Year-Old Children in the Community: A Randomised, Double-Blinded, Placebo-Controlled Trial. Lancet 2007, 370, 1560–1567. [Google Scholar] [CrossRef]
  17. Novembre, E.; Dini, L.; Bernardini, R.; Resti, M.; Vierucci, A. Manifestazioni cliniche “inusuali” da additivi alimentari. [Unusual Reactions to Food Additives]. Pediatr. Med. Chir. 1992, 14, 39–42. (In Italian) [Google Scholar]
  18. Bhatia, M.S. Allergy to Tartrazine in Psychotropic Drugs. J. Clin. Psychiatry 2000, 61, 473–476. [Google Scholar] [CrossRef]
  19. Nettis, E.; Colanardi, M.; Ferrannini, A.; Tursi, A. Suspected Tartrazine—Induced Acute Urticaria/Angioedema Is Only Rarely Reproducible by Oral Rechallenge. Clin. Exp. Allergy 2003, 33, 1725–1729. [Google Scholar] [CrossRef]
  20. Worm, M.; Vieth, W.; Ehlers, I.; Sterry, W.; Zuberbier, T. Increased Leukotriene Production by Food Additives in Patients with Atopic Dermatitis and Proven Food Intolerance. Clin. Exp. Allergy 2001, 31, 265–273. [Google Scholar] [CrossRef]
  21. Inomata, N.; Osuna, H.; Fujita, H.; Ogawa, T.; Ikezawa, Z. Multiple Chemical Sensitivities Following Intolerance to Azo Dye in Sweets in a 5-Year-Old Girl. Allergol. Int. 2006, 55, 203–205. [Google Scholar] [CrossRef]
  22. Khayyat, L.; Essawy, A.; Sorour, J.; Soffar, A. Tartrazine Induces Structural and Functional Aberrations and Genotoxic Effects in Vivo. PeerJ 2017, 5, e3041. [Google Scholar] [CrossRef]
  23. dos Santos, J.R.; de Sousa Soares, L.; Soares, B.M.; de Gomes Farias, M.; de Oliveira, V.A.; de Sousa, N.A.B.; Negreiros, H.A.; da Silva, F.C.C.; Peron, A.P.; Pacheco, A.C.L.; et al. Cytotoxic and Mutagenic Effects of the Food Additive Tartrazine on Eukaryotic Cells. BMC Pharmacol. Toxicol. 2022, 23, 95. [Google Scholar] [CrossRef] [PubMed]
  24. Gao, Y.; Li, C.; Shen, J.; Yin, H.; An, X.; Jin, H. Effect of Food Azo Dye Tartrazine on Learning and Memory Functions in Mice and Rats, and the Possible Mechanisms Involved. J. Food Sci. 2011, 76, T125–T129. [Google Scholar] [CrossRef] [PubMed]
  25. Taylor, R.W.; Turnbull, D.M. Mitochondrial DNA Mutations in Human Disease. Nat. Rev. Genet. 2005, 6, 389–402. [Google Scholar] [CrossRef]
  26. Esteller, M. Epigenetics in Cancer. N. Engl. J. Med. 2008, 358, 1148–1159. [Google Scholar] [CrossRef] [PubMed]
  27. Poh, W.J.; Wee, C.P.P.; Gao, Z. DNA Methyltransferase Activity Assays: Advances and Challenges. Theranostics 2016, 6, 369–391. [Google Scholar] [CrossRef]
  28. De Ruijter, A.J.M.; Van Gennip, A.H.; Caron, H.N.; Kemp, S.; Van Kuilenburg, A.B.P. Histone Deacetylases (HDACs): Characterization of the Classical HDAC Family. Biochem. J. 2003, 370, 737–749. [Google Scholar] [CrossRef]
  29. Park, S.Y.; Kim, J.S. A Short Guide to Histone Deacetylases Including Recent Progress on Class II Enzymes. Exp. Mol. Med. 2020, 52, 204–212. [Google Scholar] [CrossRef]
  30. Glozak, M.A.; Seto, E. Histone Deacetylases and Cancer. Oncogene 2007, 26, 5420–5432. [Google Scholar] [CrossRef]
  31. Şenkal, S.; Burukçu, D.; Bartu Hayal, T.; Kiratli, B.; Burcu Şişli, H.; Sağraç, D.; Burçin Asutay, A.; Sümer, E.; Şahin, F.; Doğan, A.; et al. 3D CULTURE OF HaCaT KERATINOCYTE CELL LINE AS AN in Vitro TOXICITY MODEL. Trak. Univ. J. Nat. Sci. 2022, 23, 211–220. [Google Scholar] [CrossRef]
  32. Aden, D.; Fogel, A.; Plotkin, S.; Damjanov, I.; Knowles, B.B. Controlled Synthesis of HBsAg in a Differentiated Human Liver Carcinoma-Derived Cell Line. Nature 1979, 282, 615–616. [Google Scholar] [CrossRef] [PubMed]
  33. Donato, M.T.; Tolosa, L.; Gómez-Lechón, M.J. Culture and Functional Characterization of Human Hepatoma HepG2 Cells. Methods Mol. Biol. 2015, 1250, 77–93. [Google Scholar] [CrossRef]
  34. Cooper, J.R.; Abdullatif, M.B.; Burnett, E.C.; Kempsell, K.E.; Conforti, F.; Tolley, H.; Collins, J.E.; Davies, D.E. Long Term Culture of the A549 Cancer Cell Line Promotes Multilamellar Body Formation and Differentiation towards an Alveolar Type II Pneumocyte Phenotype. PLoS ONE 2016, 11, e0164438. [Google Scholar] [CrossRef]
  35. Zand, A.; Enkhbilguun, S.; Macharia, J.M.; Varajti, K.; Szabó, I.; Gerencsér, G.; Tisza, B.B.; Raposa, B.L.; Gyöngyi, Z.; Varjas, T. Betanin Attenuates Epigenetic Mechanisms and UV-Induced DNA Fragmentation in HaCaT Cells: Implications for Skin Cancer Chemoprevention. Nutrients 2024, 16, 860. [Google Scholar] [CrossRef] [PubMed]
  36. Gene Quantification & Real Time PCR Quantification Strategy. Available online: https://www.gene-quantification.com/strategy.html (accessed on 18 February 2025).
  37. Hermann, A.; Gowher, H.; Jeltsch, A. Biochemistry and Biology of Mammalian DNA Methyltransferases. Cell. Mol. Life Sci. 2004, 61, 2571–2587. [Google Scholar] [CrossRef]
  38. Tuorto, F.; Herbst, F.; Alerasool, N.; Bender, S.; Popp, O.; Federico, G.; Reitter, S.; Liebers, R.; Stoecklin, G.; Gröne, H.; et al. The tRNA Methyltransferase Dnmt2 Is Required for Accurate Polypeptide Synthesis during Haematopoiesis. EMBO J. 2015, 34, 2350–2362. [Google Scholar] [CrossRef]
  39. Jurkowska, R.Z.; Anspach, N.; Urbanke, C.; Jia, D.; Reinhardt, R.; Nellen, W.; Cheng, X.; Jeltsch, A. Formation of Nucleoprotein Filaments by Mammalian DNA Methyltransferase Dnmt3a in Complex with Regulator Dnmt3L. Nucleic Acids Res. 2008, 36, 6656–6663. [Google Scholar] [CrossRef] [PubMed]
  40. Al-Seeni, M.; Rabey, H.E.; Al-Hamed, A.M.; Zamazami, M.A. Nigella sativa Oil Protects against Tartrazine Toxicity in Male Rats. Toxicol. Rep. 2017, 5, 146–155. [Google Scholar] [CrossRef]
  41. Saxena, B.; Sharma, S. Food Color Induced Hepatotoxicity in Swiss Albino Rats, Rattus Norvegicus. Toxicol Int. 2015, 22, 152–157. [Google Scholar] [CrossRef]
  42. Demirkol, O.; Zhang, X.; Ercal, N. Oxidative Effects of Tartrazine (CAS No. 1934-21-0) and New Coccin (CAS No. 2611-82-7) Azo Dyes on CHO Cells. J. Consum. Prot. Food Saf. 2012, 7, 229–236. [Google Scholar] [CrossRef]
  43. Shakoor, S.; Ismail, A.; Zia-Ur-Rahman; Sabran, M.R.; Mohtarrudin, N. Effect of Food Colorants Supplementation on Reactive Oxygen Species, Antioxidant Vitamins Level and DNA Damage. Sains Malays. 2021, 50, 1343–1356. [Google Scholar] [CrossRef]
  44. Prasad, R.; Katiyar, S.K. Prostaglandin E2 Promotes UV Radiation-Induced Immune Suppression through DNA Hypermethylation. Neoplasia 2013, 15, 795–804. [Google Scholar] [CrossRef] [PubMed]
  45. Serup, J.; Kluger, N.; Bäumler, W. Absorption, Distribution, Metabolism and Excretion of Tattoo Colorants and Ingredients in Mouse and Man: The Known and the Unknown. Curr. Probl. Dermatol. 2015, 48, 176–184. [Google Scholar] [CrossRef]
  46. Wang, Q.; Liang, N.; Yang, T.; Li, Y.; Li, J.; Huang, Q.; Wu, C.; Sun, L.; Zhou, X.; Cheng, X.; et al. DNMT1-Mediated Methylation of BEX1 Regulates Stemness and Tumorigenicity in Liver Cancer. J. Hepatol. 2021, 75, 1142–1153. [Google Scholar] [CrossRef]
  47. Saito, Y.; Kanai, Y.; Nakagawa, T.; Sakamoto, M.; Saito, H.; Ishi, H.; Hirohashi, S. Increased Protein Expression of DNA Methyltransferase (DNMT) 1 Is Significantly Correlated with the Malignant Potential and Poor Prognosis of Human Hepatocellular Carcinomas. Int. J. Cancer 2003, 105, 527–532. [Google Scholar] [CrossRef]
  48. Lin, R.K.; Wu, C.Y.; Chang, J.W.; Juan, L.J.; Hsu, H.S.; Chen, C.Y.; Lu, Y.Y.; Tang, Y.A.; Yang, Y.C.; Yang, P.C.; et al. Dysregulation of P53/Sp1 Control Leads to DNA Methyltransferase-1 Overexpression in Lung Cancer. Cancer Res. 2010, 70, 5807–5817. [Google Scholar] [CrossRef]
  49. Micevic, G.; Theodosakis, N.; Bosenberg, M. Aberrant DNA Methylation in Melanoma: Biomarker and Therapeutic Opportunities. Clin. Epigenet. 2017, 9, 34. [Google Scholar] [CrossRef] [PubMed]
  50. Zhang, Y.; Chen, F.Q.; Sun, Y.H.; Zhou, S.Y.; Li, T.Y.; Chen, R. Effects of DNMT1 Silencing on Malignant Phenotype and Methylated Gene Expression in Cervical Cancer Cells. J. Exp. Clin. Cancer Res. 2011, 30, 98. [Google Scholar] [CrossRef]
  51. Li, Y.; Tollefsbol, T.O. Impact on DNA Methylation in Cancer Prevention and Therapy by Bioactive Dietary Components. Curr. Med. Chem. 2010, 17, 2141–2151. [Google Scholar] [CrossRef]
  52. Ragusa, M.A.; Naselli, F.; Cruciata, I.; Volpes, S.; Schimmenti, C.; Serio, G.; Mauro, M.; Librizzi, M.; Luparello, C.; Chiarelli, R.; et al. Indicaxanthin Induces Autophagy in Intestinal Epithelial Cancer Cells by Epigenetic Mechanisms Involving DNA Methylation. Nutrients 2023, 15, 3495. [Google Scholar] [CrossRef]
  53. Yang, H.; Salz, T.; Zajac-Kaye, M.; Liao, D.; Huang, S.; Qiu, Y. Overexpression of Histone Deacetylases in Cancer Cells Is Controlled by Interplay of Transcription Factors and Epigenetic Modulators. FASEB J. 2014, 28, 4265–4279. [Google Scholar] [CrossRef]
  54. Duarte, J.H. Inflammation Feeds Inflammation—HDAC5 Downregulation Leads to Activation of Fibroblast-like Synoviocytes in RA. Nat. Rev. Rheumatol. 2014, 11, 64. [Google Scholar] [CrossRef]
  55. Özdaǧ, H.; Teschendorff, A.E.; Ahmed, A.A.; Hyland, S.J.; Blenkiron, C.; Bobrow, L.; Veerakumarasivam, A.; Burtt, G.; Subkhankulova, T.; Arends, M.J.; et al. Differential Expression of Selected Histone Modifier Genes in Human Solid Cancers. BMC Genom. 2006, 7, 90. [Google Scholar] [CrossRef] [PubMed]
  56. Osada, H.; Tatematsu, Y.; Saito, H.; Yatabe, Y.; Mitsudomi, T.; Takahashi, T. Reduced Expression of Class II Histone Deacetylase Genes Is Associated with Poor Prognosis in Lung Cancer Patients. Int. J. Cancer 2004, 112, 26–32. [Google Scholar] [CrossRef] [PubMed]
  57. Li, A.; Liu, Z.; Li, M.; Zhou, S.; Xu, Y.; Xiao, Y.; Yang, W. HDAC5, a Potential Therapeutic Target and Prognostic Biomarker, Promotes Proliferation, Invasion and Migration in Human Breast Cancer. Oncotarget 2016, 7, 37966–37978. [Google Scholar] [CrossRef]
  58. Collins, A.; Koppen, G.; Valdiglesias, V.; Dusinska, M.; Kruszewski, M.; Møller, P.; Rojas, E.; Dhawan, A.; Benzie, I.; Coskun, E.; et al. The Comet Assay as a Tool for Human Biomonitoring Studies: The ComNet Project. Mutat. Res. Rev. Mutat. Res. 2014, 759, 27–39. [Google Scholar] [CrossRef]
  59. Araldi, R.P.; de Melo, T.C.; Mendes, T.B.; de Sá Júnior, P.L.; Nozima, B.H.N.; Ito, E.T.; de Carvalho, R.F.; de Souza, E.B.; de Cassia Stocco, R. Using the Comet and Micronucleus Assays for Genotoxicity Studies: A Review. Biomed. Pharmacother. 2015, 72, 74–82. [Google Scholar] [CrossRef] [PubMed]
  60. Pacher, P.; Beckman, J.S.; Liaudet, L. Nitric Oxide and Peroxynitrite in Health and Disease. Physiol. Rev. 2007, 87, 315–424. [Google Scholar] [CrossRef]
  61. Himri, I.; Souna, F.; Belmekki, F.; Aziz, M.; Bnouham, M.; Zoheir, J.; Berkia, Z.; Mekhfi, H.; Saalaoui, E. A 90 day Oral Toxicity Study of Tartrazine, a Synthetic Food Dye, in Wistar Rats. Int. J. Pharm. Pharm. Sci. 2011, 3 (Suppl. 3), 159–169. [Google Scholar]
  62. El-Desoky, G.E.; Wabaidur, S.M.; Alothman, Z.A.; Habila, M.A. Regulatory Role of Nano-Curcumin against Tartrazine-Induced Oxidative Stress, Apoptosis-Related Genes Expression, and Genotoxicity in Rats. Molecules 2020, 25, 5801. [Google Scholar] [CrossRef]
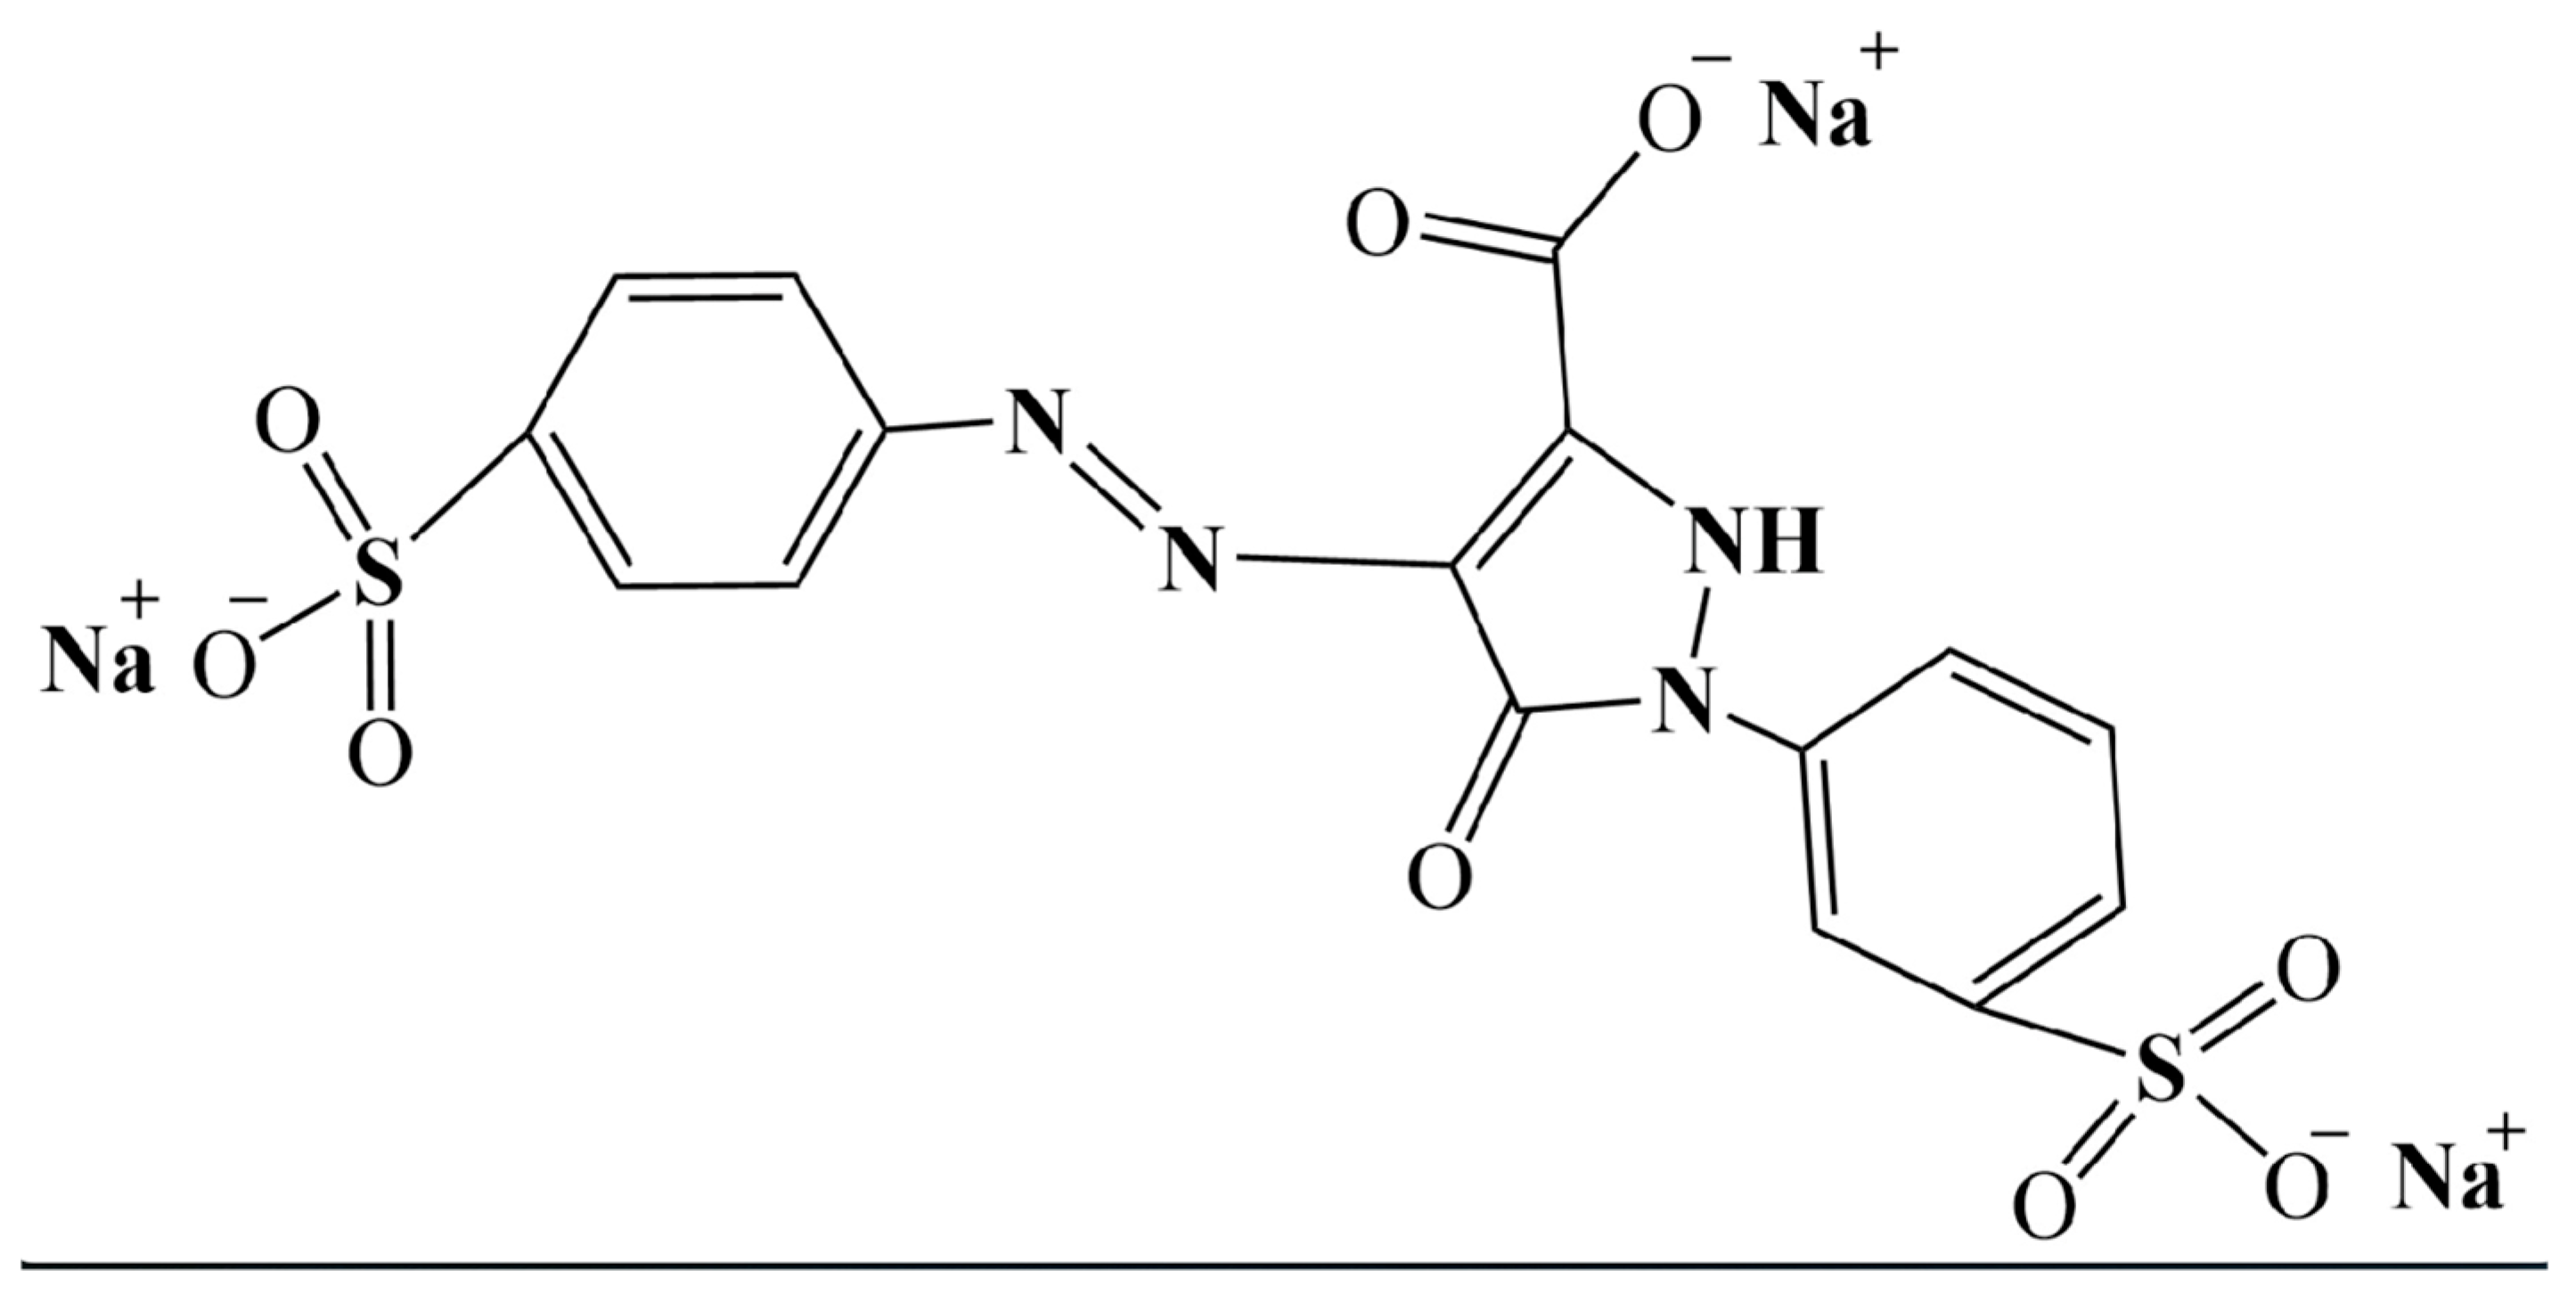
Figure 1. Chemical structure of tartrazine.
Nutrients 17 00913 g001
Figure 2. Highlights changes in DNMT1 gene expression in HaCaT, HepG2, and A549 cells, with significance at p < 0.05, following exposure to TRZ at concentrations of 20, 40, and 80 µM over 24 h (* = p < 0.05).
Nutrients 17 00913 g002
Figure 3. Highlights changes in DNMT3a gene expression in HaCaT, HepG2, and A549 cells, with significance at p < 0.05, following exposure to TRZ at concentrations of 20, 40, and 80 µM over 24 h (* = p < 0.05).
Nutrients 17 00913 g003
Figure 4. Highlights changes in DNMT3b gene expression in HaCaT, HepG2, and A549 cells, with significance at p < 0.05, following exposure to TRZ at concentrations of 20, 40, and 80 µM over 24 h (* = p < 0.05).
Nutrients 17 00913 g004
Figure 5. Highlights changes in HDAC5 gene expression in HaCaT, HepG2, and A549 cells, with significance at p < 0.05, following exposure to TRZ at concentrations of 20, 40, and 80 µM over 24 h (* = p < 0.05).
Nutrients 17 00913 g005
Figure 6. Highlights changes in HDAC6 gene expression in HaCaT, HepG2, and A549 cells, with significance at p < 0.05, following exposure to TRZ at concentrations of 20, 40, and 80 µM over 24 h (* = p < 0.05).
Nutrients 17 00913 g006
Figure 7. Representative image of the comet assay illustrating DNA damage in HaCaT cells exposed to different concentrations of tartrazine: (A) control, (B) 20 µM, (C) 40 µM, and (D) 80 µM.
Nutrients 17 00913 g007
Figure 8. Representative image of the comet assay illustrating DNA damage in A549 cells exposed to different concentrations of tartrazine: (A) control, (B) 20 µM, (C) 40 µM, and (D) 80 µM.
Nutrients 17 00913 g008
Figure 9. Representative image of the comet assay illustrating DNA damage in HepG2 cells exposed to different concentrations of tartrazine: (A) control, (B) 20 µM, (C) 40 µM, and (D) 80 µM.
Nutrients 17 00913 g009
Figure 10. Highlights changes in DNA fragmentation (tail moments) in HaCaT, A549, HepG2 cells treated with TRZ at 20, 40, and 80 µM over 24 h (* = p < 0.05).
Nutrients 17 00913 g010
Table 1. Tartrazine treatment protocol.
Group IDGroup NameFood Colorant Concentration (μM)Description
1Negative Control (Medium)0Baseline control group with no treatment
2Treated Group 1 (Low Dose)20Low-concentration treatment group
3Treated Group 2 (Medium Dose)40Medium concentration treatment group
4Treated Group 3 (High Dose)80High-concentration treatment group
5Positive Control (DMBA)-Control group treated with DMBA as a positive reference
6Untreated Control (1% DMSO)-Control group treated with DMSO as a solvent control
Disclaimer/Publisher’s Note: The statements, opinions and data contained in all publications are solely those of the individual author(s) and contributor(s) and not of MDPI and/or the editor(s). MDPI and/or the editor(s) disclaim responsibility for any injury to people or property resulting from any ideas, methods, instructions or products referred to in the content.