

Associations Between Inflammatory Potential of Diet with the Risk of All-Cause Mortality and Greenhouse Gas Emissions in Chinese Adults

Abstract
1. Introduction
2. Methods
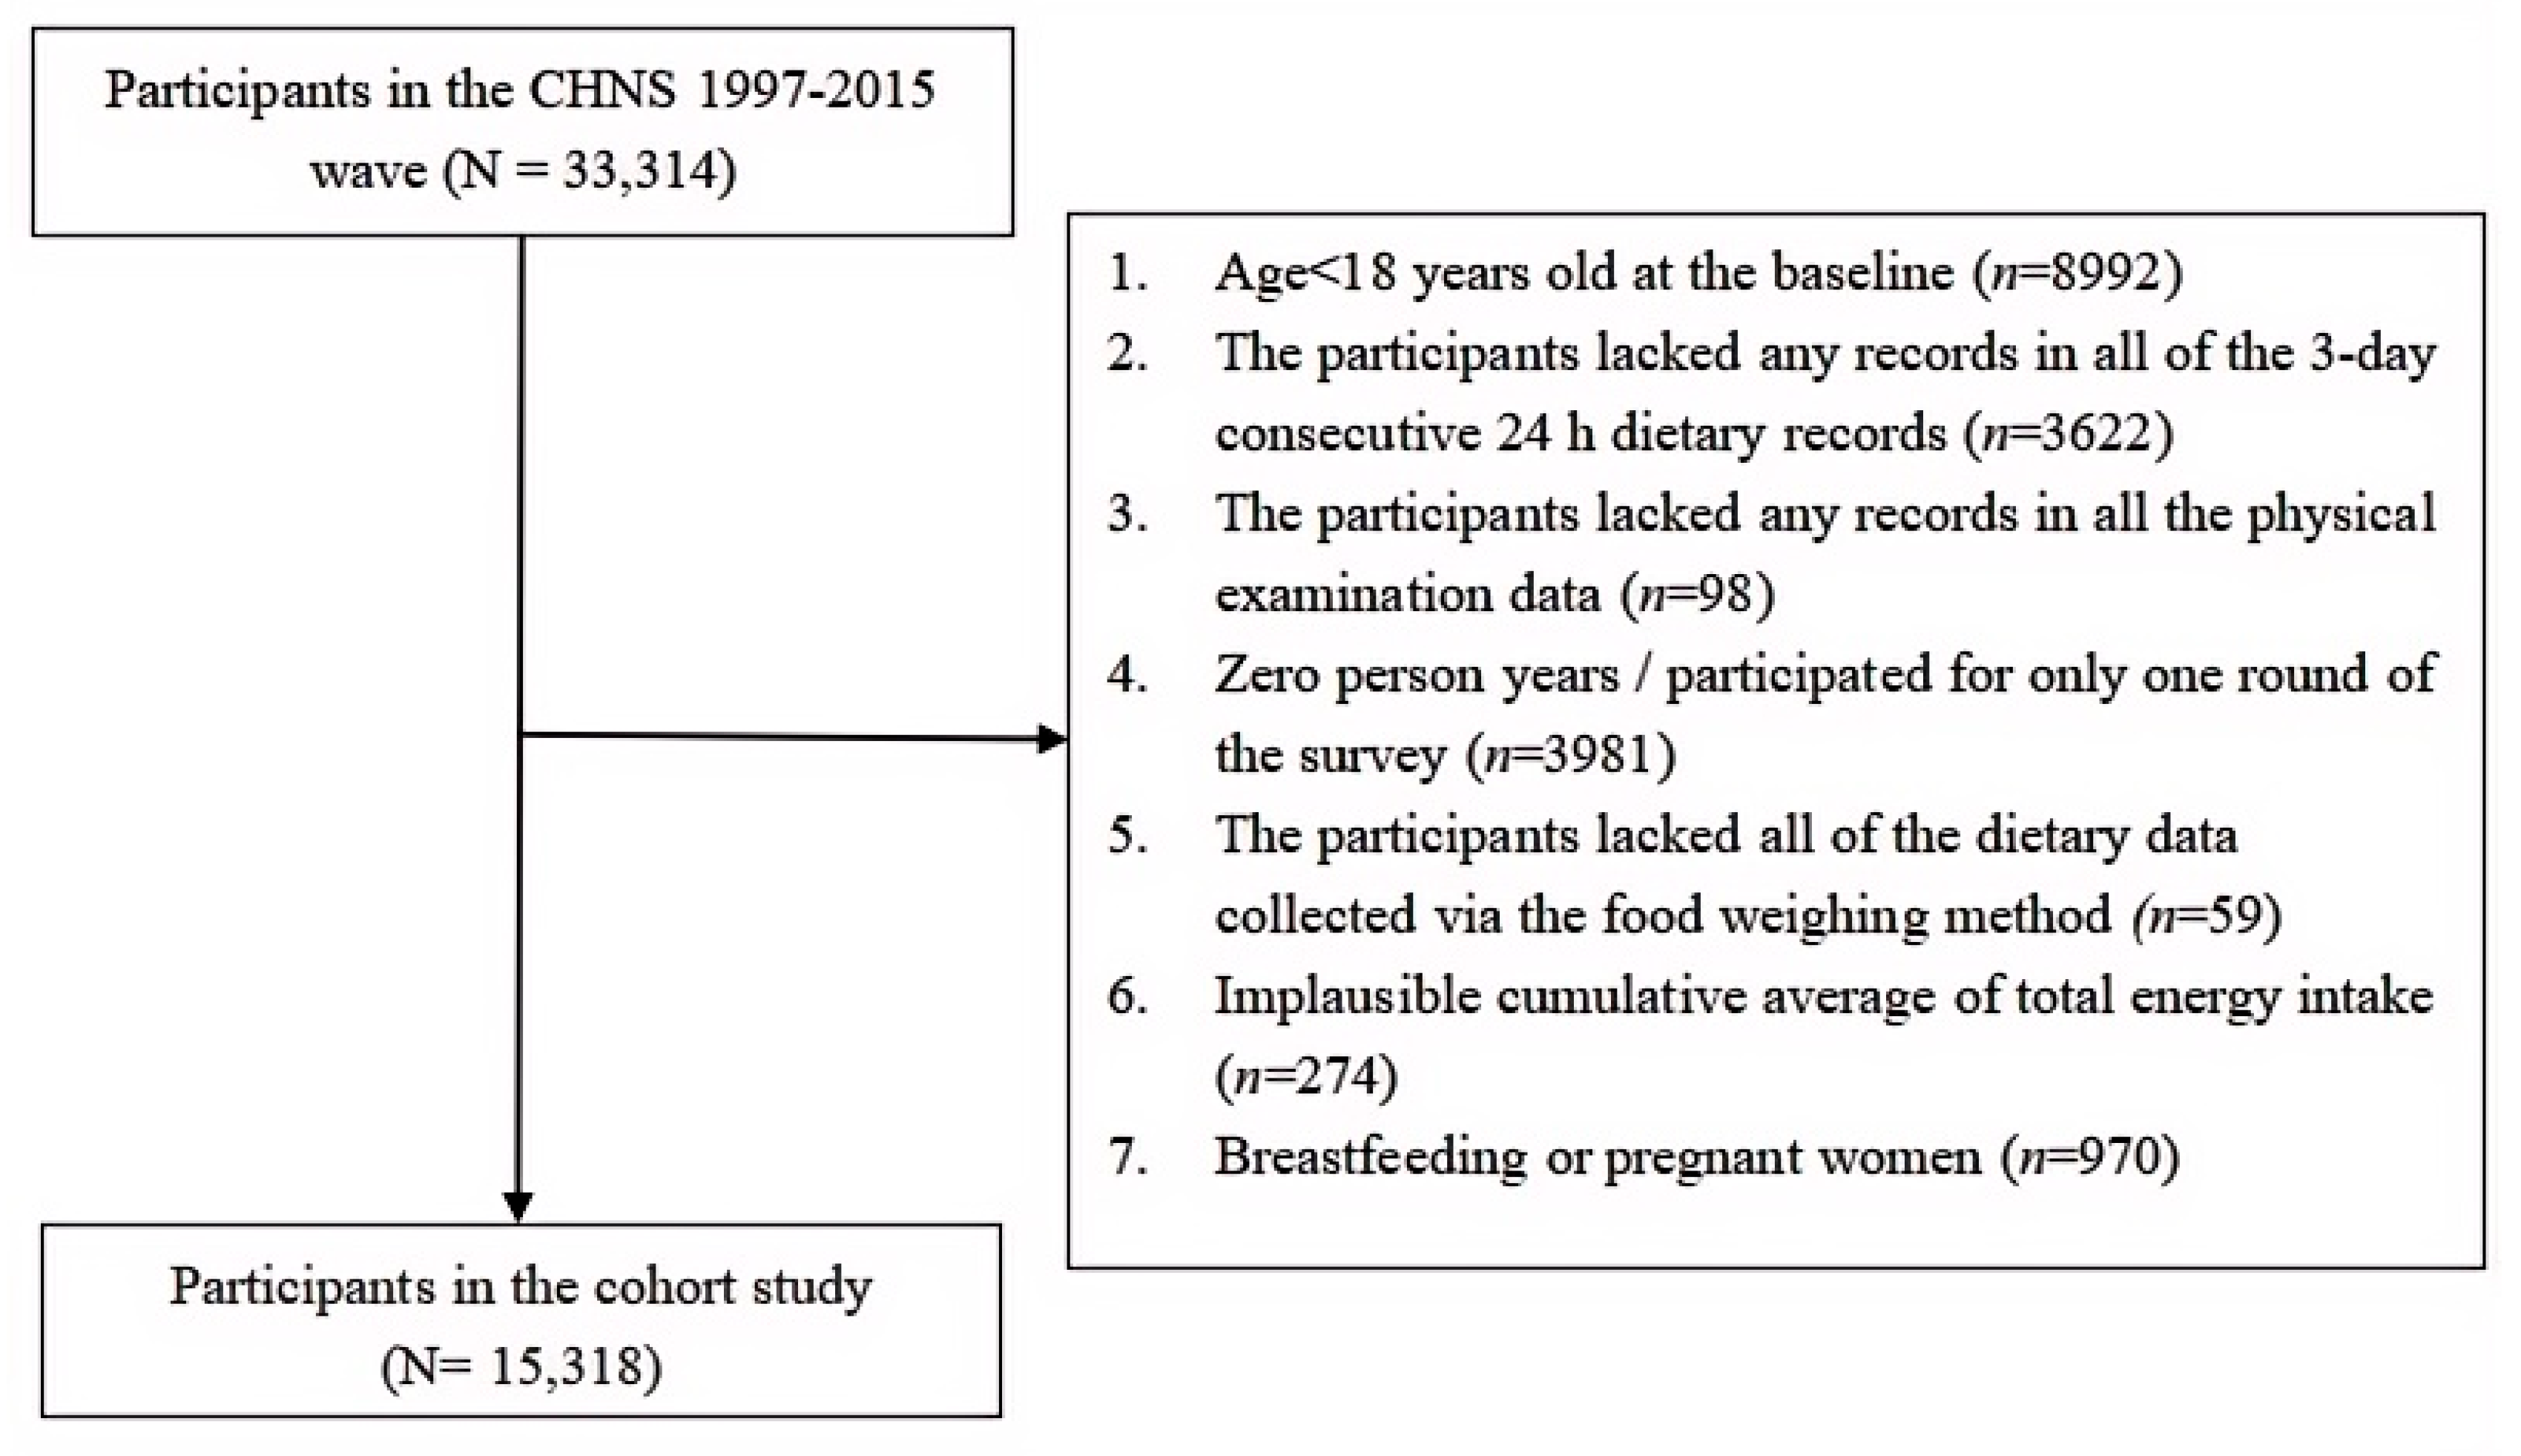
2.1. Study Population
2.2. Dietary Intake Assessment and Calculation of the DII and E-DII
2.3. Assessment of GHG Emissions
2.4. Ascertainment of Death
2.5. Assessment of Covariates
2.6. Statistical Analysis
3. Results
3.1. Sociodemographic, Anthropometric, and Lifestyle Characteristics and Dietary Intakes of the Study Participants at the Baseline
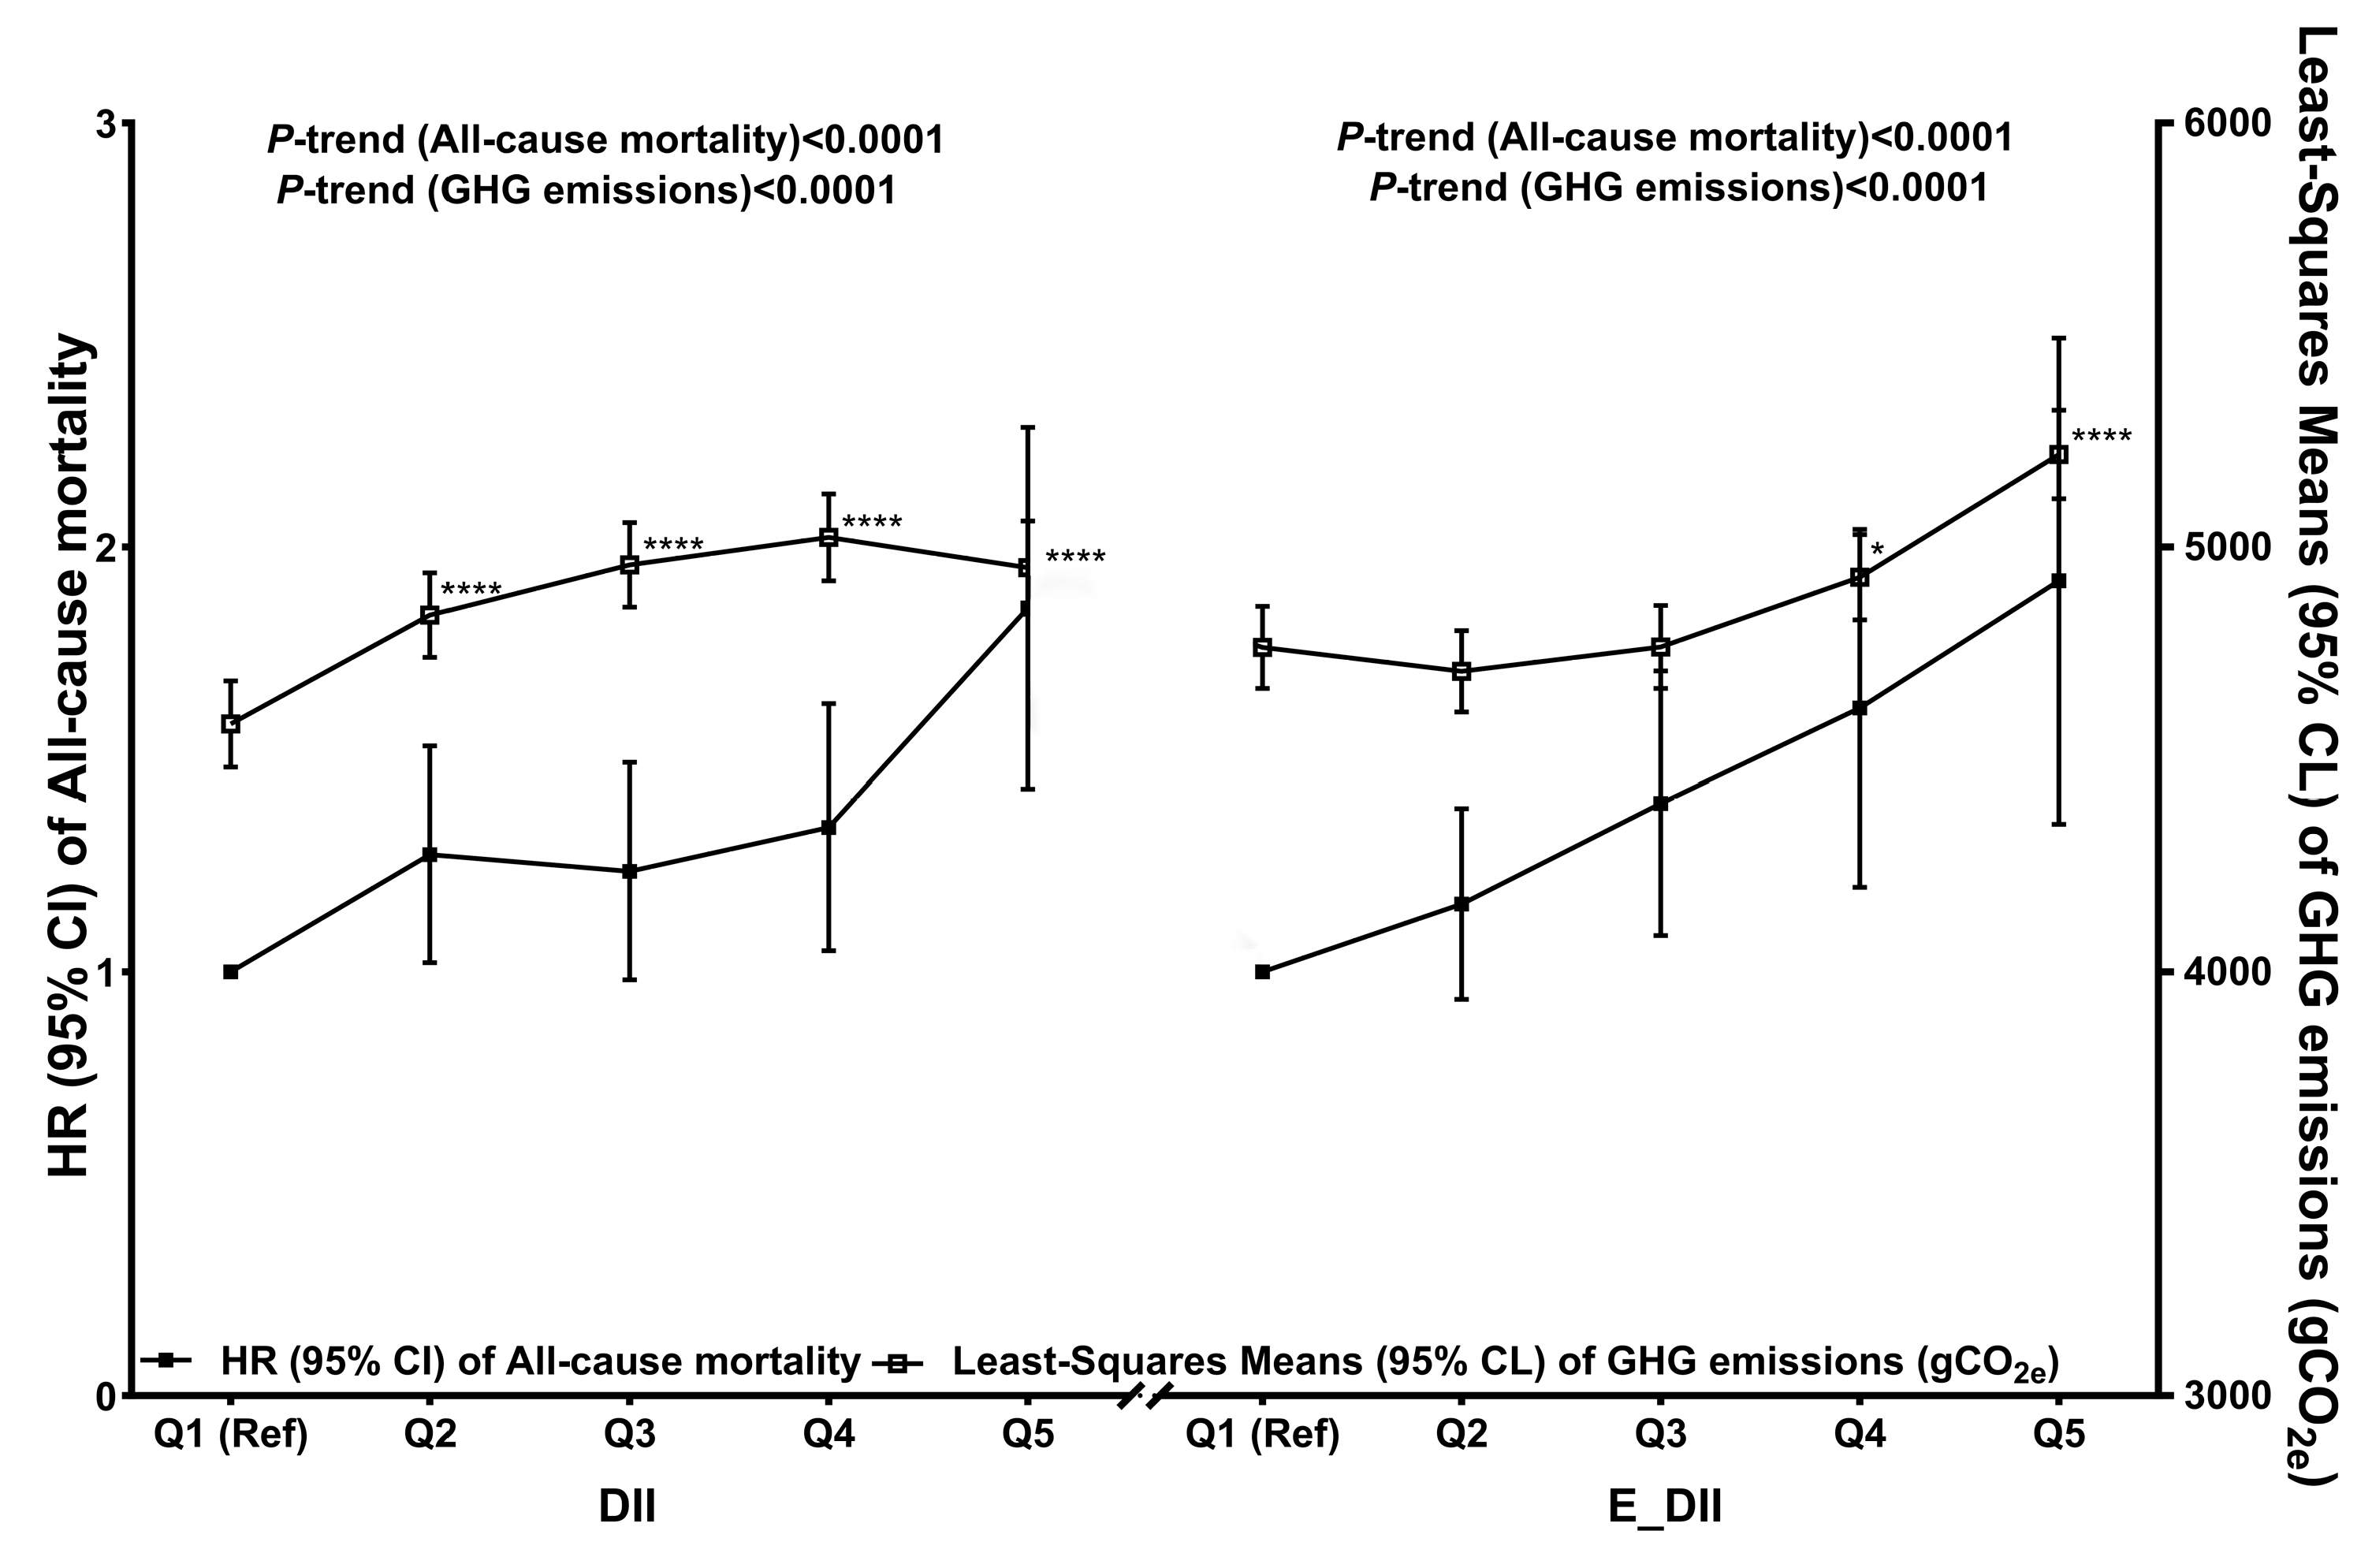
3.2. Associations Between the DII, E-DII, and Risk of All-Cause Mortality
3.3. Associations Between the DII, E-DII, and GHG Emissions
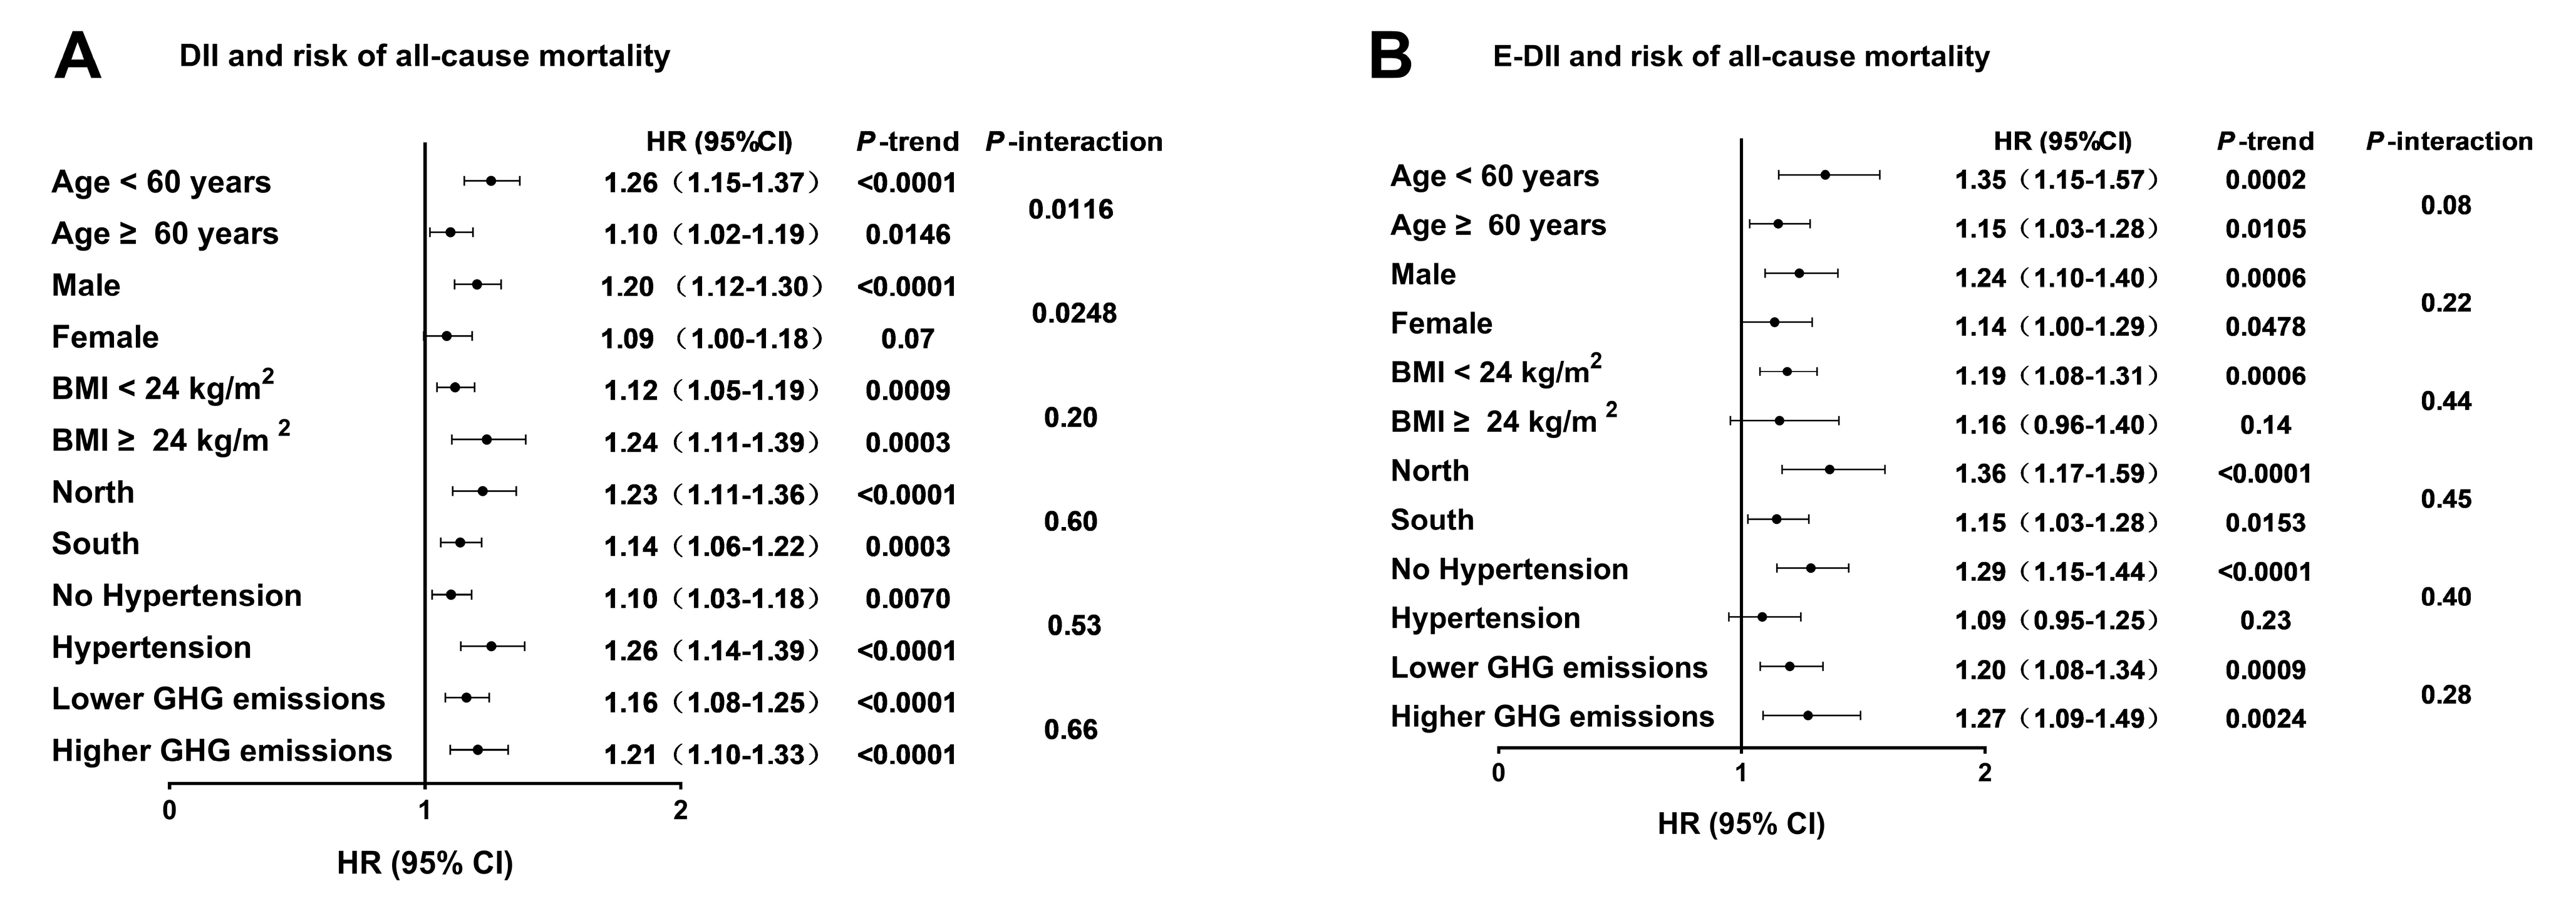
3.4. Associations Between the DII, E-DII, and Risk of All-Cause Mortality on the Basis of Potential Effect Modifiers
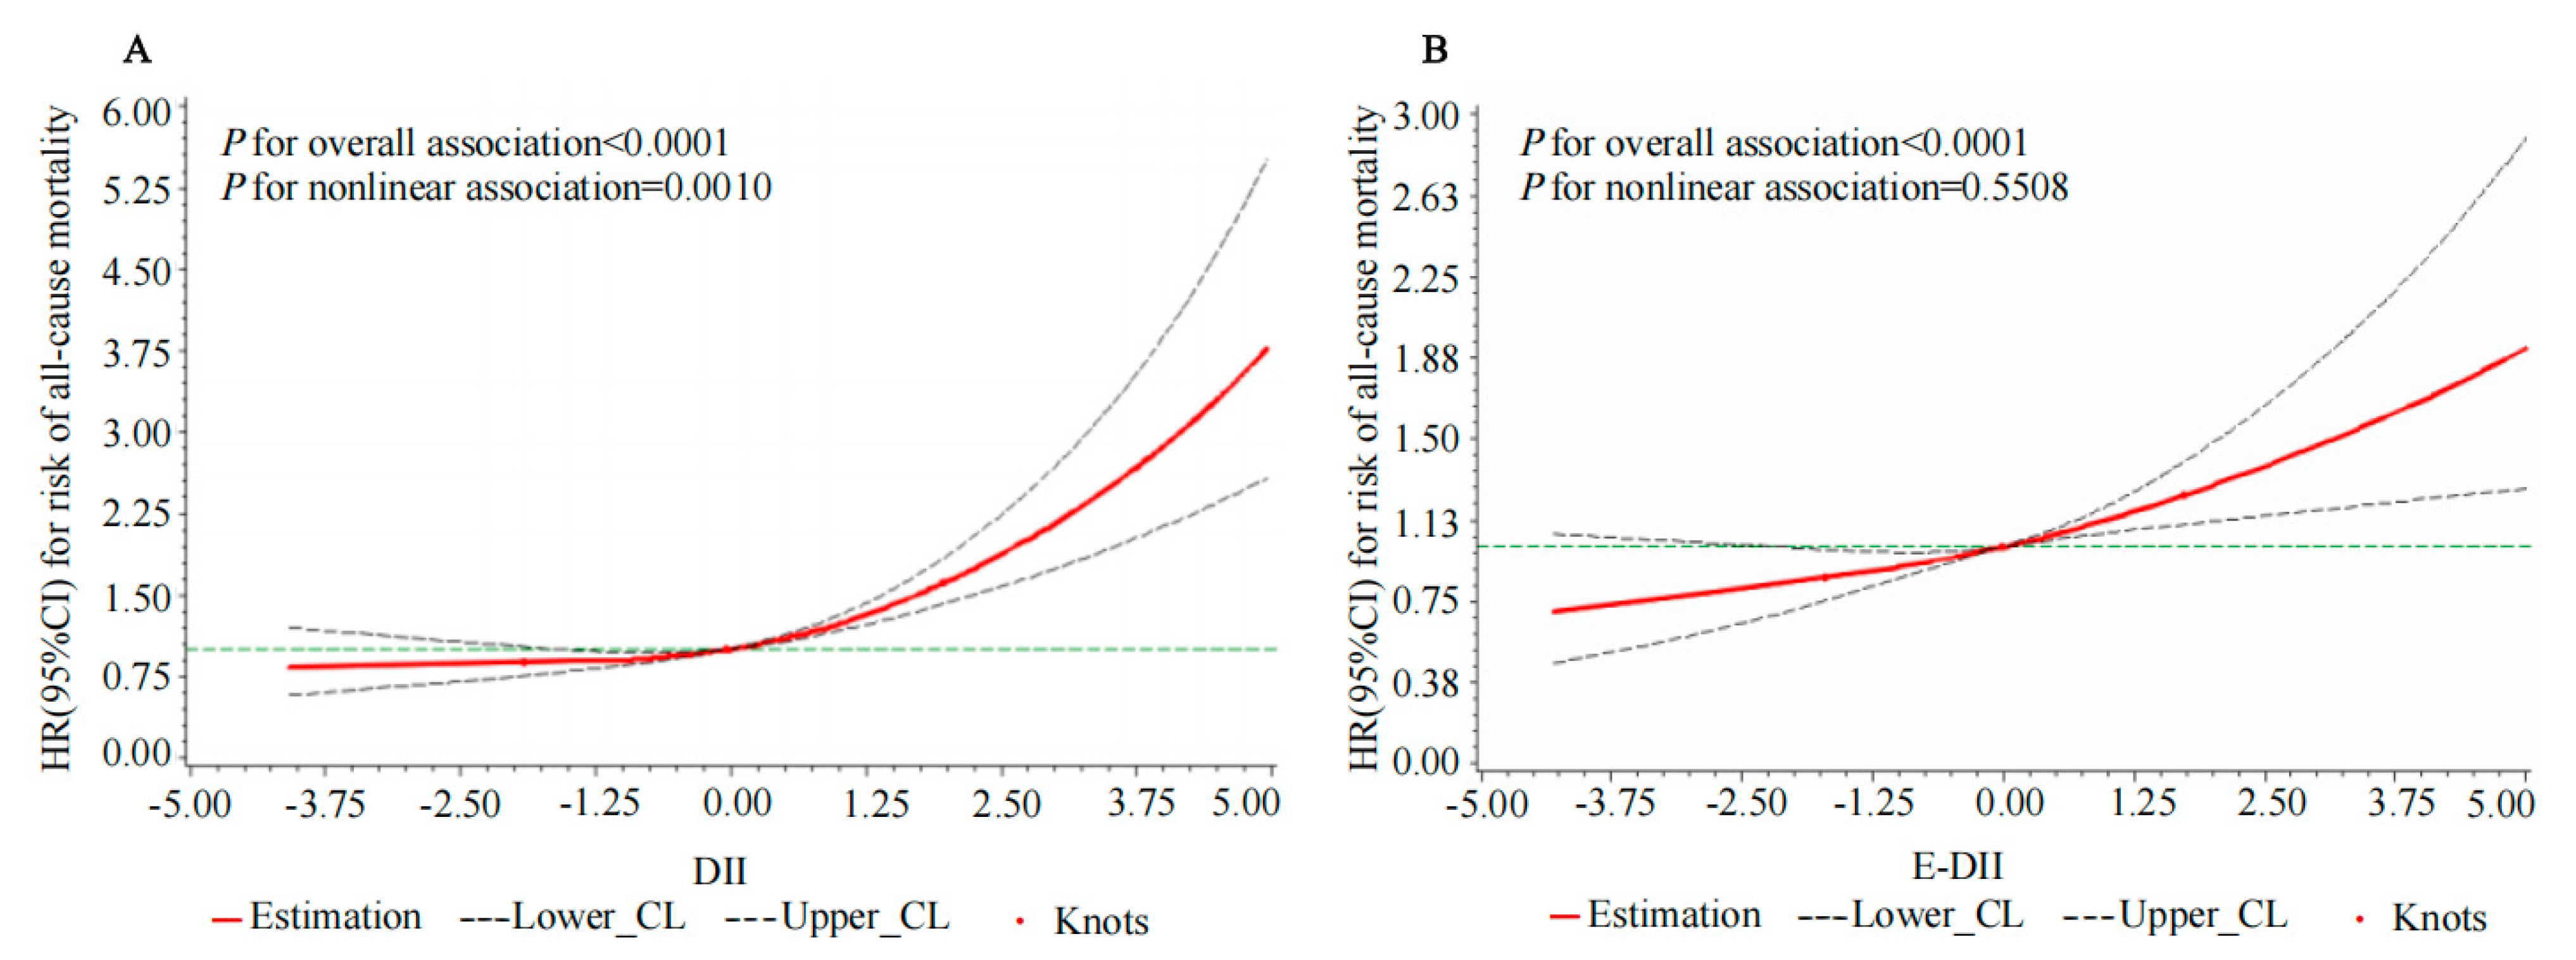
3.5. The Nonlinear and Dose–Response Relationships Between the DII, E-DII, and Risk of All-Cause Mortality
4. Discussion
5. Conclusions
Supplementary Materials
Author Contributions
Funding
Institutional Review Board Statement
Informed Consent Statement
Data Availability Statement
Acknowledgments
Conflicts of Interest
References
- GBD 2019 Diseases and Injuries Collaborators. Global burden of 369 diseases and injuries in 204 countries and territories, 1990-2019: A systematic analysis for the Global Burden of Disease Study 2019. Lancet 2020, 396, 1204–1222. [Google Scholar] [CrossRef]
- Kocarnik, J.M.; Compton, K.; Dean, F.E.; Fu, W.; Gaw, B.L.; Harvey, J.D.; Henrikson, H.J.; Lu, D.; Pennini, A.; Xu, R.; et al. Cancer Incidence, Mortality, Years of Life Lost, Years Lived With Disability, and Disability-Adjusted Life Years for 29 Cancer Groups From 2010 to 2019: A Systematic Analysis for the Global Burden of Disease Study 2019. JAMA Oncol. 2022, 8, 420–444. [Google Scholar] [CrossRef] [PubMed]
- Zhou, M.; Wang, H.; Zeng, X.; Yin, P.; Zhu, J.; Chen, W.; Li, X.; Wang, L.; Wang, L.; Liu, Y.; et al. Mortality, morbidity, and risk factors in China and its provinces, 1990–2017: A systematic analysis for the Global Burden of Disease Study 2017. Lancet 2019, 394, 1145–1158. [Google Scholar] [CrossRef] [PubMed]
- Furman, D.; Campisi, J.; Verdin, E.; Carrera-Bastos, P.; Targ, S.; Franceschi, C.; Ferrucci, L.; Gilroy, D.W.; Fasano, A.; Miller, G.W.; et al. Chronic inflammation in the etiology of disease across the life span. Nat. Med. 2019, 25, 1822–1832. [Google Scholar] [CrossRef]
- Tsalamandris, S.; Antonopoulos, A.S.; Oikonomou, E.; Papamikroulis, G.A.; Vogiatzi, G.; Papaioannou, S.; Deftereos, S.; Tousoulis, D. The Role of Inflammation in Diabetes: Current Concepts and Future Perspectives. Eur. Cardiol. 2019, 14, 50–59. [Google Scholar] [CrossRef]
- Ferrucci, L.; Fabbri, E. Inflammageing: Chronic inflammation in ageing, cardiovascular disease, and frailty. Nat. Rev. Cardiol. 2018, 15, 505–522. [Google Scholar] [CrossRef]
- Wang, X.; Bao, W.; Liu, J.; Ouyang, Y.Y.; Wang, D.; Rong, S.; Xiao, X.; Shan, Z.L.; Zhang, Y.; Yao, P.; et al. Inflammatory markers and risk of type 2 diabetes: A systematic review and meta-analysis. Diabetes Care 2013, 36, 166–175. [Google Scholar] [CrossRef]
- Kaptoge, S.; Di Angelantonio, E.; Lowe, G.; Pepys, M.B.; Thompson, S.G.; Collins, R.; Danesh, J. C-reactive protein concentration and risk of coronary heart disease, stroke, and mortality: An individual participant meta-analysis. Lancet 2010, 375, 132–140. [Google Scholar] [CrossRef]
- Li, X.; Li, C.; Zhang, W.; Wang, Y.; Qian, P.; Huang, H. Inflammation and aging: Signaling pathways and intervention therapies. Signal Transduct. Target. Ther. 2023, 8, 239. [Google Scholar] [CrossRef]
- Tristan Asensi, M.; Napoletano, A.; Sofi, F.; Dinu, M. Low-Grade Inflammation and Ultra-Processed Foods Consumption: A Review. Nutrients 2023, 15, 1546. [Google Scholar] [CrossRef]
- Farré, R.; Fiorani, M.; Abdu Rahiman, S.; Matteoli, G. Intestinal Permeability, Inflammation and the Role of Nutrients. Nutrients 2020, 12, 1185. [Google Scholar] [CrossRef] [PubMed]
- Coëffier, M.; Marion, R.; Ducrotté, P.; Déchelotte, P. Modulating effect of glutamine on IL-1beta-induced cytokine production by human gut. Clin. Nutr. 2003, 22, 407–413. [Google Scholar] [CrossRef] [PubMed]
- Galland, L. Diet and inflammation. Nutr. Clin. Pract. 2010, 25, 634–640. [Google Scholar] [CrossRef] [PubMed]
- Gisterå, A.; Hansson, G.K. The immunology of atherosclerosis. Nat. Rev. Nephrol. 2017, 13, 368–380. [Google Scholar] [CrossRef]
- Landman, G.W.; Kleefstra, N.; Groenier, K.H.; Bakker, S.J.; Groeneveld, G.H.; Bilo, H.J.; van Hateren, K.J. Inflammation biomarkers and mortality prediction in patients with type 2 diabetes (ZODIAC-27). Atherosclerosis 2016, 250, 46–51. [Google Scholar] [CrossRef]
- Giugliano, D.; Ceriello, A.; Esposito, K. The effects of diet on inflammation: Emphasis on the metabolic syndrome. J. Am. Coll. Cardiol. 2006, 48, 677–685. [Google Scholar] [CrossRef]
- Nettleton, J.A.; Steffen, L.M.; Mayer-Davis, E.J.; Jenny, N.S.; Jiang, R.; Herrington, D.M.; Jacobs, D.R., Jr. Dietary patterns are associated with biochemical markers of inflammation and endothelial activation in the Multi-Ethnic Study of Atherosclerosis (MESA). Am. J. Clin. Nutr. 2006, 83, 1369–1379. [Google Scholar] [CrossRef]
- Barbaresko, J.; Koch, M.; Schulze, M.B.; Nöthlings, U. Dietary pattern analysis and biomarkers of low-grade inflammation: A systematic literature review. Nutr. Rev. 2013, 71, 511–527. [Google Scholar] [CrossRef]
- Koelman, L.; Rodrigues, C.E.; Aleksandrova, K. Effects of Dietary Patterns on Biomarkers of Inflammation and Immune Responses: A Systematic Review and Meta-Analysis of Randomized Controlled Trials. Adv. Nutr. 2022, 13, 101–115. [Google Scholar] [CrossRef]
- Shivappa, N.; Steck, S.E.; Hurley, T.G.; Hussey, J.R.; Hébert, J.R. Designing and developing a literature-derived, population-based dietary inflammatory index. Public. Health Nutr. 2014, 17, 1689–1696. [Google Scholar] [CrossRef]
- Shivappa, N.; Wirth, M.D.; Murphy, E.A.; Hurley, T.G.; Hébert, J.R. Association between the Dietary Inflammatory Index (DII) and urinary enterolignans and C-reactive protein from the National Health and Nutrition Examination Survey-2003-2008. Eur. J. Nutr. 2019, 58, 797–805. [Google Scholar] [CrossRef] [PubMed]
- Kotemori, A.; Sawada, N.; Iwasaki, M.; Yamaji, T.; Shivappa, N.; Hebert, J.R.; Ishihara, J.; Inoue, M.; Tsugane, S. Validating the dietary inflammatory index using inflammatory biomarkers in a Japanese population: A cross-sectional study of the JPHC-FFQ validation study. Nutrition 2020, 69, 110569. [Google Scholar] [CrossRef] [PubMed]
- Lécuyer, L.; Laouali, N.; Viallon, V.; Artaud, F.; Hébert, J.R.; Shivappa, N.; Agudo, A.; Tjønneland, A.; Mellemkjær, L.; Kaaks, R.; et al. Associations between dietary inflammatory scores and biomarkers of inflammation in the European Prospective Investigation into Cancer and Nutrition (EPIC) cohort. Clin. Nutr. 2023, 42, 1115–1125. [Google Scholar] [CrossRef]
- Wu, M.; Li, S.; Lv, Y.; Liu, K.; Wang, Y.; Cui, Z.; Wang, X.; Meng, H. Associations between the inflammatory potential of diets with adherence to plant-based dietary patterns and the risk of new-onset cardiometabolic diseases in Chinese adults: Findings from a nation-wide prospective cohort study. Food Funct. 2023, 14, 9018–9034. [Google Scholar] [CrossRef]
- Phillips, C.M.; Chen, L.W.; Heude, B.; Bernard, J.Y.; Harvey, N.C.; Duijts, L.; Mensink-Bout, S.M.; Polanska, K.; Mancano, G.; Suderman, M.; et al. Dietary Inflammatory Index and Non-Communicable Disease Risk: A Narrative Review. Nutrients 2019, 11, 1873. [Google Scholar] [CrossRef]
- Edwards, M.K.; Shivappa, N.; Mann, J.R.; Hébert, J.R.; Wirth, M.D.; Loprinzi, P.D. The association between physical activity and dietary inflammatory index on mortality risk in U.S. adults. Phys. Sportsmed. 2018, 46, 249–254. [Google Scholar] [CrossRef]
- Shivappa, N.; Schneider, A.; Hébert, J.R.; Koenig, W.; Peters, A.; Thorand, B. Association between dietary inflammatory index, and cause-specific mortality in the MONICA/KORA Augsburg Cohort Study. Eur. J. Public. Health 2018, 28, 167–172. [Google Scholar] [CrossRef]
- Wang, X.; Hu, J.; Liu, L.; Zhang, Y.; Dang, K.; Cheng, L.; Zhang, J.; Xu, X.; Li, Y. Association of Dietary Inflammatory Index and Dietary Oxidative Balance Score with All-Cause and Disease-Specific Mortality: Findings of 2003-2014 National Health and Nutrition Examination Survey. Nutrients 2023, 15, 2760. [Google Scholar] [CrossRef]
- Garcia-Arellano, A.; Martínez-González, M.A.; Ramallal, R.; Salas-Salvadó, J.; Hébert, J.R.; Corella, D.; Shivappa, N.; Forga, L.; Schröder, H.; Muñoz-Bravo, C.; et al. Dietary inflammatory index and all-cause mortality in large cohorts: The SUN and PREDIMED studies. Clin. Nutr. 2019, 38, 1221–1231. [Google Scholar] [CrossRef]
- Zhang, Y.; Wu, Y.; Zhang, Y.; Cao, D.; He, H.; Cao, X.; Wang, Y.; Jia, Z.; Jiang, J. Dietary inflammatory index, and depression and mortality risk associations in U.S. adults, with a special focus on cancer survivors. Front. Nutr. 2022, 9, 1034323. [Google Scholar] [CrossRef]
- Shivappa, N.; Hebert, J.R.; Kivimaki, M.; Akbaraly, T. Alternative Healthy Eating Index 2010, Dietary Inflammatory Index and risk of mortality: Results from the Whitehall II cohort study and meta-analysis of previous Dietary Inflammatory Index and mortality studies. Br. J. Nutr. 2017, 118, 210–221. [Google Scholar] [CrossRef] [PubMed]
- Namazi, N.; Larijani, B.; Azadbakht, L. Dietary Inflammatory Index and its Association with the Risk of Cardiovascular Diseases, Metabolic Syndrome, and Mortality: A Systematic Review and Meta-Analysis. Horm. Metab. Res. 2018, 50, 345–358. [Google Scholar] [CrossRef] [PubMed]
- Brlek, A.; Gregorič, M. Diet quality indices and their associations with all-cause mortality, CVD and type 2 diabetes mellitus: An umbrella review. Br. J. Nutr. 2023, 130, 709–718. [Google Scholar] [CrossRef] [PubMed]
- Liu, F.H.; Liu, C.; Gong, T.T.; Gao, S.; Sun, H.; Jiang, Y.T.; Zhang, J.Y.; Zhang, M.; Gao, C.; Li, X.Y.; et al. Dietary Inflammatory Index and Health Outcomes: An Umbrella Review of Systematic Review and Meta-Analyses of Observational Studies. Front. Nutr. 2021, 8, 647122. [Google Scholar] [CrossRef]
- Zhang, J.; Feng, Y.; Yang, X.; Li, Y.; Wu, Y.; Yuan, L.; Li, T.; Hu, H.; Li, X.; Huang, H.; et al. Dose-Response Association of Dietary Inflammatory Potential with All-Cause and Cause-Specific Mortality. Adv. Nutr. 2022, 13, 1834–1845. [Google Scholar] [CrossRef]
- Zhang, J.; Wu, Y.; Yuan, L.; Li, T.; Hu, H.; Li, X.; Fu, X.; Wang, M.; Huo, W.; Gao, Y.; et al. Lower intensity of physical activity strengthens the effect of dietary inflammatory index on the risk of all-cause and cause-specific mortality. Mech. Ageing Dev. 2023, 211, 111777. [Google Scholar] [CrossRef]
- Zheng, J.; Zhu, T.; Li, F.; Wu, H.; Jiang, S.; Shivappa, N.; Hébert, J.R.; Li, X.; Li, Y.; Wang, H. Diet Quality and Mortality among Chinese Adults: Findings from the China Health and Nutrition Survey. Nutrients 2023, 16, 94. [Google Scholar] [CrossRef]
- Shivappa, N.; Godos, J.; Hébert, J.R.; Wirth, M.D.; Piuri, G.; Speciani, A.F.; Grosso, G. Dietary Inflammatory Index and Cardiovascular Risk and Mortality—A Meta-Analysis. Nutrients 2018, 10, 200. [Google Scholar] [CrossRef]
- Crippa, M.; Solazzo, E.; Guizzardi, D.; Monforti-Ferrario, F.; Tubiello, F.N.; Leip, A. Food systems are responsible for a third of global anthropogenic GHG emissions. Nat. Food 2021, 2, 198–209. [Google Scholar] [CrossRef]
- Nelson, M.E.; Hamm, M.W.; Hu, F.B.; Abrams, S.A.; Griffin, T.S. Alignment of Healthy Dietary Patterns and Environmental Sustainability: A Systematic Review. Adv. Nutr. 2016, 7, 1005–1025. [Google Scholar] [CrossRef]
- Hemler, E.C.; Hu, F.B. Plant-Based Diets for Personal, Population, and Planetary Health. Adv. Nutr. 2019, 10, S275–S283. [Google Scholar] [CrossRef] [PubMed]
- Fanzo, J.; Davis, C. Can Diets Be Healthy, Sustainable, and Equitable? Curr. Obes. Rep. 2019, 8, 495–503. [Google Scholar] [CrossRef] [PubMed]
- Zhang, H.; Xu, Y.; Lahr, M.L. The greenhouse gas footprints of China’s food production and consumption (1987–2017). J. Environ. Manag. 2022, 301, 113934. [Google Scholar] [CrossRef]
- Rampalli, K.K.; Blake, C.E.; Frongillo, E.A.; Montoya, J. Why understanding food choice is crucial to transform food systems for human and planetary health. BMJ Glob. Health 2023, 8, e010876. [Google Scholar] [CrossRef] [PubMed]
- Popkin, B.M.; Du, S.; Zhai, F.; Zhang, B. Cohort Profile: The China Health and Nutrition Survey—Monitoring and understanding socio-economic and health change in China, 1989-2011. Int J Epidemiol 2010, 39, 1435–1440. [Google Scholar] [CrossRef]
- Zhang, B.; Zhai, F.Y.; Du, S.F.; Popkin, B.M. The China Health and Nutrition Survey, 1989-2011. Obes. Rev. 2014, 15 (Suppl. S1), 2–7. [Google Scholar] [CrossRef]
- Wang, L.; Wang, H.; Zhang, B.; Popkin, B.M.; Du, S. Elevated Fat Intake Increases Body Weight and the Risk of Overweight and Obesity among Chinese Adults: 1991-2015 Trends. Nutrients 2020, 12, 3272. [Google Scholar] [CrossRef]
- Zhao, J.; Zuo, L.; Sun, J.; Su, C.; Wang, H. Trends and Urban-Rural Disparities of Energy Intake and Macronutrient Composition among Chinese Children: Findings from the China Health and Nutrition Survey (1991 to 2015). Nutrients 2021, 13, 1933. [Google Scholar] [CrossRef]
- Yu, D.; Zhang, X.; Xiang, Y.B.; Yang, G.; Li, H.; Gao, Y.T.; Zheng, W.; Shu, X.O. Adherence to dietary guidelines and mortality: A report from prospective cohort studies of 134,000 Chinese adults in urban Shanghai. Am. J. Clin. Nutr. 2014, 100, 693–700. [Google Scholar] [CrossRef]
- Ren, Z.; Zhao, A.; Wang, Y.; Meng, L.; Szeto, I.M.; Li, T.; Gong, H.; Tian, Z.; Zhang, Y.; Wang, P. Association between Dietary Inflammatory Index, C-Reactive Protein and Metabolic Syndrome: A Cross-Sectional Study. Nutrients 2018, 10, 831. [Google Scholar] [CrossRef]
- Zhai, F.; Guo, X.; Popkin, B.M.; Ma, L.; Ma, L.; Wang, Q.; Yu, W.; Jin, S.; Ge, K. Evaluation of the 24-Hour Individual Recall Method in China. Food Nutr. Bull. 1996, 17, 1–7. [Google Scholar] [CrossRef]
- Su, C.; Zhao, J.; Wu, Y.; Wang, H.; Wang, Z.; Wang, Y.; Zhang, B. Temporal Trends in Dietary Macronutrient Intakes among Adults in Rural China from 1991 to 2011: Findings from the CHNS. Nutrients 2017, 9, 227. [Google Scholar] [CrossRef] [PubMed]
- Yang, Y.X.; Wang, G.Y.; Pan, X.Z. China Food Composition Table 2002; Peking University Medical Press: Beijing, China, 2002. [Google Scholar]
- Yang, Y.X.; Wang, G.Y.; Pan, X.Z. China Food Composition Table 2004; Peking University Medical Press: Beijing, China, 2005. [Google Scholar]
- Yang, Y.X.; Wang, G.Y.; Pan, X.Z. China Food Composition Table, 2nd ed.; Peking University Medical Press: Beijing, China, 2009. [Google Scholar]
- Hu, F.B.; Stampfer, M.J.; Rimm, E.; Ascherio, A.; Rosner, B.A.; Spiegelman, D.; Willett, W.C. Dietary fat and coronary heart disease: A comparison of approaches for adjusting for total energy intake and modeling repeated dietary measurements. Am. J. Epidemiol. 1999, 149, 531–540. [Google Scholar] [CrossRef] [PubMed]
- Neufcourt, L.; Assmann, K.E.; Fezeu, L.K.; Touvier, M.; Graffouillère, L.; Shivappa, N.; Hébert, J.R.; Wirth, M.D.; Hercberg, S.; Galan, P.; et al. Prospective Association Between the Dietary Inflammatory Index and Cardiovascular Diseases in the SUpplémentation en VItamines et Minéraux AntioXydants (SU.VI.MAX) Cohort. J. Am. Heart Assoc. 2016, 5, e002735. [Google Scholar] [CrossRef]
- Hébert, J.R.; Shivappa, N.; Wirth, M.D.; Hussey, J.R.; Hurley, T.G. Perspective: The Dietary Inflammatory Index (DII)-Lessons Learned, Improvements Made, and Future Directions. Adv. Nutr. 2019, 10, 185–195. [Google Scholar] [CrossRef]
- He, P.; Baiocchi, G.; Hubacek, K.; Feng, K.; Yu, Y. The environmental impacts of rapidly changing diets and their nutritional quality in China. Nat. Sustain. 2018, 1, 122–127. [Google Scholar] [CrossRef]
- Qiu, W.; Cai, A.; Xiao, X.; Xia, S.; Li, L.; Feng, Y. Alcohol intake masked the protective effects of tea consumption against all-cause mortality and blood pressure progression: Findings from CHNS cohort, 1993–2011. Nutrition 2023, 111, 112003. [Google Scholar] [CrossRef]
- Zhuang, P.; Wang, W.; Wang, J.; Zhang, Y.; Jiao, J. Polyunsaturated fatty acids intake, omega-6/omega-3 ratio and mortality: Findings from two independent nationwide cohorts. Clin. Nutr. 2019, 38, 848–855. [Google Scholar] [CrossRef]
- Qiu, W.; Cai, A.; Li, L.; Feng, Y. Longitudinal Trajectories of Alcohol Consumption with All-Cause Mortality, Hypertension, and Blood Pressure Change: Results from CHNS Cohort, 1993–2015. Nutrients 2022, 14, 5073. [Google Scholar] [CrossRef]
- Desquilbet, L.; Mariotti, F. Dose-response analyses using restricted cubic spline functions in public health research. Stat. Med. 2010, 29, 1037–1057. [Google Scholar] [CrossRef]
- Laukkanen, J.A.; Kurl, S.; Voutilainen, A.; Mäkikallio, T.; Kunutsor, S.K. Cardiorespiratory Fitness, Inflammation, and Risk of Sudden Cardiac Death in Middle-Aged Men. Am. J. Cardiol. 2022, 174, 166–171. [Google Scholar] [CrossRef] [PubMed]
- Fritsche, K.L. The science of fatty acids and inflammation. Adv. Nutr. 2015, 6, 293s–301s. [Google Scholar] [CrossRef] [PubMed]
- Festa, A.; D’Agostino, R., Jr.; Howard, G.; Mykkänen, L.; Tracy, R.P.; Haffner, S.M. Chronic subclinical inflammation as part of the insulin resistance syndrome: The Insulin Resistance Atherosclerosis Study (IRAS). Circulation 2000, 102, 42–47. [Google Scholar] [CrossRef] [PubMed]
- Moslehi, N.; Ehsani, B.; Mirmiran, P.; Shivappa, N.; Tohidi, M.; Hébert, J.R.; Azizi, F. Inflammatory Properties of Diet and Glucose-Insulin Homeostasis in a Cohort of Iranian Adults. Nutrients 2016, 8, 735. [Google Scholar] [CrossRef]
- Kim, J.A.; Montagnani, M.; Koh, K.K.; Quon, M.J. Reciprocal relationships between insulin resistance and endothelial dysfunction: Molecular and pathophysiological mechanisms. Circulation 2006, 113, 1888–1904. [Google Scholar] [CrossRef]
- Fulop, T.; Larbi, A.; Pawelec, G.; Khalil, A.; Cohen, A.A.; Hirokawa, K.; Witkowski, J.M.; Franceschi, C. Immunology of Aging: The Birth of Inflammaging. Clin. Rev. Allergy Immunol. 2023, 64, 109–122. [Google Scholar] [CrossRef]
- Di Giosia, P.; Stamerra, C.A.; Giorgini, P.; Jamialahamdi, T.; Butler, A.E.; Sahebkar, A. The role of nutrition in inflammaging. Ageing Res. Rev. 2022, 77, 101596. [Google Scholar] [CrossRef]
- Huang, Y.; Zhang, L.; Zeng, M.; Liu, F.; Sun, L.; Liu, Y.; Xiao, L. Energy-Adjusted Dietary Inflammatory Index Is Associated With 5-Year All Cause and Cardiovascular Mortality Among Chronic Kidney Disease Patients. Front. Nutr. 2022, 9, 899004. [Google Scholar] [CrossRef]
- Zheng, G.; Cai, M.; Liu, H.; Li, R.; Qian, Z.; Howard, S.W.; Keith, A.E.; Zhang, S.; Wang, X.; Zhang, J.; et al. Dietary Diversity and Inflammatory Diet Associated with All-Cause Mortality and Incidence and Mortality of Type 2 Diabetes: Two Prospective Cohort Studies. Nutrients 2023, 15, 2120. [Google Scholar] [CrossRef]
- Casas, R.; Sacanella, E.; Urpí-Sardà, M.; Corella, D.; Castañer, O.; Lamuela-Raventos, R.M.; Salas-Salvadó, J.; Martínez-González, M.A.; Ros, E.; Estruch, R. Long-Term Immunomodulatory Effects of a Mediterranean Diet in Adults at High Risk of Cardiovascular Disease in the PREvención con DIeta MEDiterránea (PREDIMED) Randomized Controlled Trial. J. Nutr. 2016, 146, 1684–1693. [Google Scholar] [CrossRef]
- Mayr, H.L.; Thomas, C.J.; Tierney, A.C.; Kucianski, T.; George, E.S.; Ruiz-Canela, M.; Hebert, J.R.; Shivappa, N.; Itsiopoulos, C. Randomization to 6-month Mediterranean diet compared with a low-fat diet leads to improvement in Dietary Inflammatory Index scores in patients with coronary heart disease: The AUSMED Heart Trial. Nutr. Res. 2018, 55, 94–107. [Google Scholar] [CrossRef] [PubMed]
- Aleksandrova, K.; Koelman, L.; Rodrigues, C.E. Dietary patterns and biomarkers of oxidative stress and inflammation: A systematic review of observational and intervention studies. Redox Biol. 2021, 42, 101869. [Google Scholar] [CrossRef]
- Kim, J.; Wilkens, L.R.; Haiman, C.A.; Le Marchand, L.; Park, S.Y. Plant-based dietary patterns and mortality from all causes, cardiovascular disease, and cancer: The Multiethnic Cohort Study. Clin. Nutr. 2024, 43, 1447–1453. [Google Scholar] [CrossRef] [PubMed]
- Chen, H.; Wang, X.; Ji, J.S.; Huang, L.; Qi, Y.; Wu, Y.; He, P.; Li, Y.; Bodirsky, B.L.; Müller, C.; et al. Plant-based and planetary-health diets, environmental burden, and risk of mortality: A prospective cohort study of middle-aged and older adults in China. Lancet Planet. Health 2024, 8, e545–e553. [Google Scholar] [CrossRef]
- Ahmad, S.; Moorthy, M.V.; Lee, I.M.; Ridker, P.M.; Manson, J.E.; Buring, J.E.; Demler, O.V.; Mora, S. Mediterranean Diet Adherence and Risk of All-Cause Mortality in Women. JAMA Netw. Open 2024, 7, e2414322. [Google Scholar] [CrossRef]
- Soltani, S.; Arablou, T.; Jayedi, A.; Salehi-Abargouei, A. Adherence to the dietary approaches to stop hypertension (DASH) diet in relation to all-cause and cause-specific mortality: A systematic review and dose-response meta-analysis of prospective cohort studies. Nutr. J. 2020, 19, 37. [Google Scholar] [CrossRef]
- Clark, M.A.; Springmann, M.; Hill, J.; Tilman, D. Multiple health and environmental impacts of foods. Proc. Natl. Acad. Sci. USA 2019, 116, 23357–23362. [Google Scholar] [CrossRef]
- Willett, W.; Rockström, J.; Loken, B.; Springmann, M.; Lang, T.; Vermeulen, S.; Garnett, T.; Tilman, D.; DeClerck, F.; Wood, A.; et al. Food in the Anthropocene: The EAT-Lancet Commission on healthy diets from sustainable food systems. Lancet 2019, 393, 447–492. [Google Scholar] [CrossRef]
- Gavrilov, L.A.; Gavrilova, N.S. New Trend in Old-Age Mortality: Gompertzialization of Mortality Trajectory. Gerontology 2019, 65, 451–457. [Google Scholar] [CrossRef]
- Yang, S.L.; Zhang, L.L.; Zhu, X.; Tu, J.X.; Huang, H.L.; Yu, C.; Wu, L. Big data on the prevalence of injury deaths among 187 488 elderly Chinese in the past 20 years (2000-2020): A systematic review and meta-analysis. BMC Geriatr. 2023, 23, 340. [Google Scholar] [CrossRef]
- Bupp, M.R.G. Sex, the aging immune system, and chronic disease. Cell Immunol. 2015, 294, 102–110. [Google Scholar] [CrossRef] [PubMed]
- Zhang, J.G.; Wang, Z.H.; Wang, H.J.; Du, W.W.; Su, C.; Zhang, J.; Jiang, H.R.; Zhai, F.Y.; Zhang, B. Dietary patterns and their associations with general obesity and abdominal obesity among young Chinese women. Eur. J. Clin. Nutr. 2015, 69, 1009–1014. [Google Scholar] [CrossRef] [PubMed]

| Variables | Total | Quintiles of DII | Quintiles of E-DII | ||||
|---|---|---|---|---|---|---|---|
| Q1 | Q3 | Q5 | Q1 | Q3 | Q5 | ||
| N | 15,318 | 3063 | 3063 | 3063 | 3064 | 3064 | 3063 |
| DII | −0.01 (−1.01, 1.00) | −1.84 (−2.25, −1.51) | −0.01 (−0.21, 0.19) | 1.85 (1.51, 2.31) | −1.22 (−2.00, −0.25) | −0.09 (−0.81, 0.75) | 1.23 (0.46, 2.01) |
| E-DII | −0.01 (−0.88, 0.88) | −1.08 (−1.80, −0.44) | −0.08 (−0.63, 0.74) | 1.10 (0.24, 1.87) | −1.69 (−2.16, −1.35) | −0.01 (−0.18, 0.16) | 1.67 (1.36, 2.14) |
| Age, years | 46 ± 15 | 44 ± 14 | 45 ± 15 | 49 ± 17 | 48 ± 15 | 45 ± 15 | 45 ± 15 |
| Male, n (%) | 7760 (50.7) | 1911 (62.4) | 1529 (49.9) | 1200 (39.2) | 1332 (43.5) | 1581 (51.6) | 1688 (55.1) |
| BMI, kg/m2 | 22.6 (20.6, 25.1) | 22.7 (20.7, 25.2) | 22.7 (20.6, 25.1) | 22.4 (20.4, 24.8) | 23.2 (21.0, 25.6) | 22.6 (20.6, 25.0) | 22.1 (20.2, 24.5) |
| SBP, mm Hg | 120.0 (110.0, 130.0) | 120.0 (110.0, 130.0) | 120.0 (110.0, 130.0) | 120.0 (110.0, 131.7) | 120.0 (110.0, 131.3) | 120.0 (110.0, 130.0) | 119.3 (108.7, 129.0) |
| DBP, mm Hg | 79.3 (70.0, 84.0) | 80.0 (70.0, 84.7) | 78.7 (70.0, 83.3) | 78.7 (70.0, 83.3) | 79.7 (70.0, 85.0) | 79.3 (70.0, 83.3) | 77.3 (70.0, 82.7) |
| Education level, n (%) | |||||||
| Primary | 7186 (46.9) | 1401 (45.7) | 1398 (45.6) | 1569 (51.2) | 1252 (40.9) | 1463 (47.7) | 1492 (51.2) |
| Middle | 4353 (28.4) | 925 (30.2) | 883 (28.8) | 783 (25.6) | 844 (27.5) | 898 (29.3) | 892 (29.1) |
| High | 3779 (24.7) | 737 (24.1) | 782 (25.5) | 711 (23.2) | 968 (31.6) | 703 (22.9) | 679 (22.2) |
| Urbanization index, n (%) | |||||||
| Low | 5085 (33.2) | 1243 (40.6) | 993 (32.4) | 845 (27.6) | 785 (25.6) | 1154 (37.7) | 982 (32.1) |
| Medium | 5089 (33.2) | 817 (26.7) | 1042 (34.0) | 1173 (38.3) | 793 (25.9) | 956 (31.2) | 1294 (42.2) |
| High | 5144 (33.6) | 1003 (32.7) | 1028 (33.6) | 1045 (34.1) | 1486 (48.5) | 954 (31.1) | 787 (25.7) |
| Region, n (%) | |||||||
| Northern | 6400 (41.8) | 1465 (47.8) | 1198 (39.1) | 1073 (35.0) | 1551 (50.6) | 1398 (45.6) | 799 (26.1) |
| Southern | 8918 (58.2) | 1598 (52.2) | 1865 (60.9) | 1990 (65.0) | 1513 (49.4) | 1666 (54.4) | 2264 (73.9) |
| Current smokers, n (%) | 4813 (31.4) | 1156 (37.7) | 940 (30.7) | 754 (24.6) | 774 (25.3) | 962 (31.4) | 1069 (34.9) |
| Currently drinking alcohol, n (%) | 5600 (36.6) | 1404 (45.8) | 1083 (35.4) | 829 (27.1) | 1034 (33.7) | 1153 (37.6) | 1139 (37.2) |
| Physical activity status, n (%) | |||||||
| Low | 5053 (33.0) | 813 (26.5) | 976 (31.9) | 1262 (41.2) | 1177 (38.4) | 910 (29.7) | 1017 (33.2) |
| Medium | 5158 (33.7) | 1013 (33.1) | 1024 (33.4) | 1069 (34.9) | 1101 (35.9) | 1059 (34.6) | 1000 (32.6) |
| High | 5107 (33.3) | 1237 (40.4) | 1063 (34.7) | 732 (23.9) | 786 (25.7) | 1095 (35.7) | 1046 (34.1) |
| Variables | ALL Participants | Quintiles of DII | P a | Quintiles of E-DII | P a | ||||
|---|---|---|---|---|---|---|---|---|---|
| Q1 | Q3 | Q5 | Q1 | Q3 | Q5 | ||||
| N | 15,318 | 3063 | 3063 | 3063 | 3064 | 3064 | 3063 | ||
| Total energy, kcal | 2213.0 ± 741.5 | 2845.6 ± 733.5 | 2215.3 ± 588.5 | 1593.7 ± 556.2 | <0.0001 | 1952.2 ± 679.8 | 2207.8 ± 697.5 | 2436.0 ± 822.4 | <0.0001 |
| Carbohydrate, % E | 56.0 ± 13.4 | 57.7 ± 13.3 | 55.9 ± 13.0 | 53.7 ± 14.0 | <0.0001 | 54.6 ± 12.9 | 57.9 ± 13.3 | 52.8 ± 13.7 | <0.0001 |
| Protein, % E | 12.3 ± 3.0 | 13.1 ± 3.0 | 12.3 ± 2.8 | 11.7 ± 3.1 | <0.0001 | 14.5 ± 3.3 | 12.1 ± 2.4 | 10.5 ± 2.7 | <0.0001 |
| Fat, % E | 30.0 ± 12.8 | 26.8 ± 12.0 | 30.1 ± 12.3 | 33.4 ± 14.1 | <0.0001 | 28.8 ± 11.5 | 28.3 ± 12.5 | 35.2 ± 13.8 | <0.0001 |
| SFA, % E | 7.0 ± 3.6 | 5.8 ± 3.2 | 7.0 ± 3.3 | 8.4 ± 4.2 | <0.0001 | 6.3 ± 3.1 | 6.4 ± 3.2 | 9.1 ± 4.2 | <0.0001 |
| MUFA, % E | 11.9 ± 6.0 | 9.9 ± 5.6 | 12.0 ± 5.9 | 14.0 ± 7.0 | <0.0001 | 10.4 ± 5.4 | 11.1 ± 5.8 | 15.3 ± 6.7 | <0.0001 |
| PUFA, % E | 7.6 ± 4.8 | 7.7 ± 4.5 | 7.6 ± 4.8 | 7.3 ± 5.3 | <0.0001 | 8.4 ± 4.4 | 7.4 ± 4.7 | 7.2 ± 5.6 | <0.0001 |
| Cholesterol, mg | 157.7 ± 180.2 | 174.4 ± 202.2 | 163.0 ± 185.7 | 134.6 ± 142.8 | <0.0001 | 148.4 ± 170.2 | 145.4 ± 177.7 | 190.2 ± 191.0 | <0.0001 |
| Dietary fiber, g | 11.7 ± 8.9 | 19.9 ± 12.2 | 10.8 ± 6.0 | 5.9 ± 2.8 | <0.0001 | 16.1 ± 11.2 | 11.7 ± 8.6 | 7.5 ± 5.0 | <0.0001 |
| Vitamin A, RE | 472.0 ± 786.6 | 639.2 ± 791.4 | 509.5 ± 1264.6 | 282.8 ± 345.6 | <0.0001 | 625.2 ± 764.7 | 454.9 ± 1199.6 | 365.0 ± 364.2 | <0.0001 |
| Thiamine, mg | 1.0 ± 0.5 | 1.4 ± 0.6 | 1.0 ± 0.3 | 0.6 ± 0.2 | <0.0001 | 1.0 ± 0.5 | 1.0 ± 0.5 | 0.9 ± 0.4 | <0.0001 |
| Riboflavin, mg | 0.8 ± 0.3 | 1.0 ± 0.4 | 0.8 ± 0.3 | 0.5 ± 0.2 | <0.0001 | 0.9 ± 0.4 | 0.7 ± 0.3 | 0.7 ± 0.3 | <0.0001 |
| Niacin, mg | 14.8 ± 6.2 | 19.6 ± 7.0 | 14.8 ± 5.0 | 10.2 ± 4.0 | <0.0001 | 15.3 ± 7.1 | 14.7 ± 6.0 | 14.3 ± 5.7 | <0.0001 |
| Vitamin B6, μg | 0.4 ± 0.2 | 0.6 ± 0.3 | 0.3 ± 0.2 | 0.2 ± 0.1 | <0.0001 | 0.5 ± 0.3 | 0.4 ± 0.2 | 0.2 ± 0.2 | <0.0001 |
| Folic acid, μg | 190.8 ± 92.5 | 275.5 ± 103.2 | 187.1 ± 72.0 | 117.0 ± 53.0 | <0.0001 | 226.8 ± 109.1 | 186.9 ± 86.6 | 160.9 ± 71.2 | <0.0001 |
| Vitamin B12, g | 1.6 ± 2.8 | 1.8 ± 3.0 | 1.7 ± 3.3 | 1.0 ± 1.4 | <0.0001 | 1.9 ± 3.0 | 1.5 ± 3.3 | 1.3 ± 1.9 | <0.0001 |
| Vitamin C, mg | 82.2 ± 69.3 | 126.9 ± 108.3 | 78.2 ± 43.0 | 44.6 ± 27.1 | <0.0001 | 112.6 ± 100.7 | 78.7 ± 51.0 | 60.2 ± 39.7 | <0.0001 |
| Vitamin E, mg | 31.0 ± 23.0 | 44.1 ± 25.2 | 30.4 ± 21.7 | 19.6 ± 17.6 | <0.0001 | 32.8 ± 19.2 | 30.5 ± 20.7 | 30.2 ± 30.1 | <0.0001 |
| Na, mg | 5618.5 ± 16,111.0 | 6485.7 ± 6791.6 | 5479.7 ± 9000.8 | 4454.5 ± 13,459.2 | <0.0001 | 5197.6 ± 5020.1 | 5424.9 ± 8796.1 | 6364.3 ± 17,765.5 | 0.0004 |
| K, mg | 1662.8 ± 872.4 | 2519.7 ± 1288.5 | 1572.4 ± 344.3 | 992.6 ± 295.9 | <0.0001 | 2080.0 ± 1283.8 | 1610.4 ± 590.0 | 1318.9 ± 470.9 | <0.0001 |
| Mg, mg | 311.7 ± 140.4 | 466.8 ± 175.8 | 298.2 ± 70.7 | 186.7 ± 56.1 | <0.0001 | 359.4 ± 182.5 | 312.0 ± 123.9 | 255.8 ± 91.3 | <0.0001 |
| Fe, mg | 22.6 ± 11.9 | 33.1 ± 16.9 | 21.8 ± 7.7 | 14.3 ± 5.7 | <0.0001 | 25.2 ± 16.5 | 22.3 ± 10.2 | 20.4 ± 9.0 | <0.0001 |
| Zn, mg | 11.5 ± 4.4 | 15.3 ± 4.6 | 11.4 ± 3.3 | 7.7 ± 2.7 | <0.0001 | 11.5 ± 4.8 | 11.5 ± 4.2 | 11.0 ± 4.1 | <0.0001 |
| Se, μg | 41.5 ± 25.9 | 54.0 ± 30.9 | 41.7 ± 23.8 | 29.0 ± 14.8 | <0.0001 | 43.7 ± 27.1 | 41.5 ± 27.7 | 38.9 ± 23.7 | <0.0001 |
| Whole grains, g | 19.9 ± 58.3 | 40.8 ± 90.5 | 15.8 ± 49.4 | 7.1 ± 24.2 | <0.0001 | 29.1 ± 71.3 | 21.4 ± 59.3 | 7.0 ± 45.6 | <0.0001 |
| Fruits, g | 27.3 ± 72.2 | 42.3 ± 102.5 | 26.4 ± 65.0 | 13.1 ± 37.3 | <0.0001 | 58.3 ± 113.0 | 22.8 ± 58.7 | 9.9 ± 34.5 | <0.0001 |
| Vegetables, g | 272.7 ± 149.9 | 384.0 ± 185.6 | 270.1 ± 118.4 | 168.6 ± 87.7 | <0.0001 | 342.5 ± 179.4 | 263.7 ± 136.4 | 219.2 ± 120.9 | <0.0001 |
| Nuts, g | 3.2 ± 12.4 | 5.9 ± 18.8 | 3.1 ± 11.1 | 1.1 ± 5.7 | <0.0001 | 5.3 ± 15.7 | 3.0 ± 12.2 | 1.5 ± 7.6 | <0.0001 |
| Legumes, g | 49.3 ± 67.5 | 86.6 ± 85.6 | 47.4 ± 65.5 | 20.5 ± 34.1 | <0.0001 | 77.4 ± 80.4 | 44.6 ± 64.3 | 29.2 ± 45.9 | <0.0001 |
| Dairy products, g | 16.0 ± 56.1 | 20.1 ± 66.2 | 15.4 ± 55.1 | 11.8 ± 43.6 | 0.0028 | 30.6 ± 76.7 | 14.5 ± 52.8 | 6.8 ± 37.1 | <0.0001 |
| Eggs, g | 23.6 ± 31.9 | 28.0 ± 35.6 | 23.6 ± 31.6 | 18.9 ± 25.3 | <0.0001 | 30.1 ± 33.7 | 22.6 ± 32.0 | 19.3 ± 26.3 | <0.0001 |
| Fish, g | 19.3 ± 34.2 | 23.7 ± 43.3 | 19.5 ± 32.7 | 15.3 ± 25.6 | 0.1372 | 24.0 ± 40.7 | 17.8 ± 31.1 | 17.8 ± 30.5 | <0.0001 |
| Red and processed meat, g | 76.8 ± 77.0 | 77.7 ± 89.6 | 83.2 ± 79.1 | 66.1 ± 57.4 | <0.0001 | 65.5 ± 69.3 | 70.4 ± 72.3 | 98.8 ± 86.1 | <0.0001 |
| Variables | Quintiles | P-Trend | per SD | P | ||||
|---|---|---|---|---|---|---|---|---|
| Q1 | Q2 | Q3 | Q4 | Q5 | ||||
| DII | ||||||||
| Range | (−4.08, −1.30) | (−1.30, −0.44) | (−0.44, 0.38) | (0.38, 1.30) | (1.30, 4.49) | |||
| Median | −1.91 | −0.84 | −0.04 | 0.80 | 1.97 | |||
| Cases (rate, %) a | 185 (6.04) | 220 (7.18) | 249 (8.13) | 281 (9.17) | 408 (13.32) | |||
| Person year | 36,138 | 34,544 | 32,944 | 29,688 | 21,172 | |||
| Model 1 b | 1.00 (ref) | 1.22 (1.00–1.49) | 1.19 (0.98–1.44) | 1.35 (1.12–1.63) | 2.07 (1.72–2.50) | <0.0001 | 1.32 (1.24–1.40) | <0.0001 |
| Model 2 c | 1.00 (ref) | 1.26 (1.03–1.54) | 1.22 (0.99–1.50) | 1.32 (1.06–1.64) | 1.82 (1.45–2.30) | <0.0001 | 1.25 (1.16–1.35) | <0.0001 |
| E-DII | ||||||||
| Range | (−4.31, −1.13) | (−1.13, −0.36) | (−0.36, 0.31) | (0.31, 1.14) | (1.14, 5.10) | |||
| Median | −1.71 | −0.72 | −0.02 | 0.70 | 1.72 | |||
| Cases (rate, %) a | 204 (6.66) | 254 (8.29) | 270 (8.81) | 311 (10.15) | 304 (9.92) | |||
| Person year | 28,985.46 | 33,236.96 | 33,207.36 | 31,980.06 | 27,075.31 | |||
| Model 1 b | 1.00 (ref) | 1.26 (1.04–1.53) | 1.57 (1.25–1.96) | 1.93 (1.49–2.50) | 2.37 (1.76–3.19) | <0.0001 | 1.38 (1.25–1.52) | <0.0001 |
| Model 2 c | 1.00 (ref) | 1.15 (0.94–1.39) | 1.37 (1.10–1.72) | 1.58 (1.22–2.06) | 1.86 (1.38–2.52) | <0.0001 | 1.27 (1.15–1.41) | <0.0001 |
| Variables | Quintiles | P-Trend | ||||
|---|---|---|---|---|---|---|
| Q1 | Q2 | Q3 | Q4 | Q5 | ||
| DII | ||||||
| Model 1 a | 4990.16 (4882.44–5099.06) | 4906.67 (4801.43–5013.07) | 4894.34 (4791.00–4998.79) | 4791.91 (4690.55–4894.35) * | 4402.96 (4307.14–4499.84) **** | <0.0001 |
| Model 2 b | 4582.44 (4481.66–4684.35) | 4838.87 (4739.72–4939.04) **** | 4957.32 (4857.97–5057.67) **** | 5022.64 (4920.23–5126.11) **** | 4950.56 (4840.60–5061.75) **** | <0.0001 |
| E-DII | ||||||
| Model 1 a | 4495.76 (4399.91–4592.65) | 4345.75 (4250.13–4442.45) | 4528.93 (4430.27–4628.68) | 4979.91 (4876.66–5084.25) **** | 5624.87 (5514.96–5735.86) **** | <0.0001 |
| Model 2 b | 4762.48 (4665.98–4859.96) | 4706.90 (4610.81–4803.98) | 4763.71 (4666.36–4862.07) | 4928.21 (4828.19–5029.25) * | 5218.12 (5113.71–5323.59) **** | <0.0001 |
Disclaimer/Publisher’s Note: The statements, opinions and data contained in all publications are solely those of the individual author(s) and contributor(s) and not of MDPI and/or the editor(s). MDPI and/or the editor(s) disclaim responsibility for any injury to people or property resulting from any ideas, methods, instructions or products referred to in the content. |
© 2025 by the authors. Licensee MDPI, Basel, Switzerland. This article is an open access article distributed under the terms and conditions of the Creative Commons Attribution (CC BY) license (https://creativecommons.org/licenses/by/4.0/).
Share and Cite
Yao, Z.; Lv, Y.; Yang, W.; Wu, M.; Li, S.; Meng, H. Associations Between Inflammatory Potential of Diet with the Risk of All-Cause Mortality and Greenhouse Gas Emissions in Chinese Adults. Nutrients 2025, 17, 1218. https://doi.org/10.3390/nu17071218
Yao Z, Lv Y, Yang W, Wu M, Li S, Meng H. Associations Between Inflammatory Potential of Diet with the Risk of All-Cause Mortality and Greenhouse Gas Emissions in Chinese Adults. Nutrients. 2025; 17(7):1218. https://doi.org/10.3390/nu17071218
Chicago/Turabian StyleYao, Zhihan, Yiqian Lv, Wenhui Yang, Man Wu, Shun Li, and Huicui Meng. 2025. "Associations Between Inflammatory Potential of Diet with the Risk of All-Cause Mortality and Greenhouse Gas Emissions in Chinese Adults" Nutrients 17, no. 7: 1218. https://doi.org/10.3390/nu17071218
APA StyleYao, Z., Lv, Y., Yang, W., Wu, M., Li, S., & Meng, H. (2025). Associations Between Inflammatory Potential of Diet with the Risk of All-Cause Mortality and Greenhouse Gas Emissions in Chinese Adults. Nutrients, 17(7), 1218. https://doi.org/10.3390/nu17071218