Low-Protein Diets in Diabetic Chronic Kidney Disease (CKD) Patients: Are They Feasible and Worth the Effort?

 ,
,  , ,
, ,  ,
, 
Abstract
:1. Introduction
2. Experimental Section
2.1. Study Setting, Patient Selection and Inclusion Criteria
2.2. Diets and Controls
2.3. Collected Data
2.4. Statistical Analysis
2.5. Ethical Issues
3. Results
3.1. Baseline Data
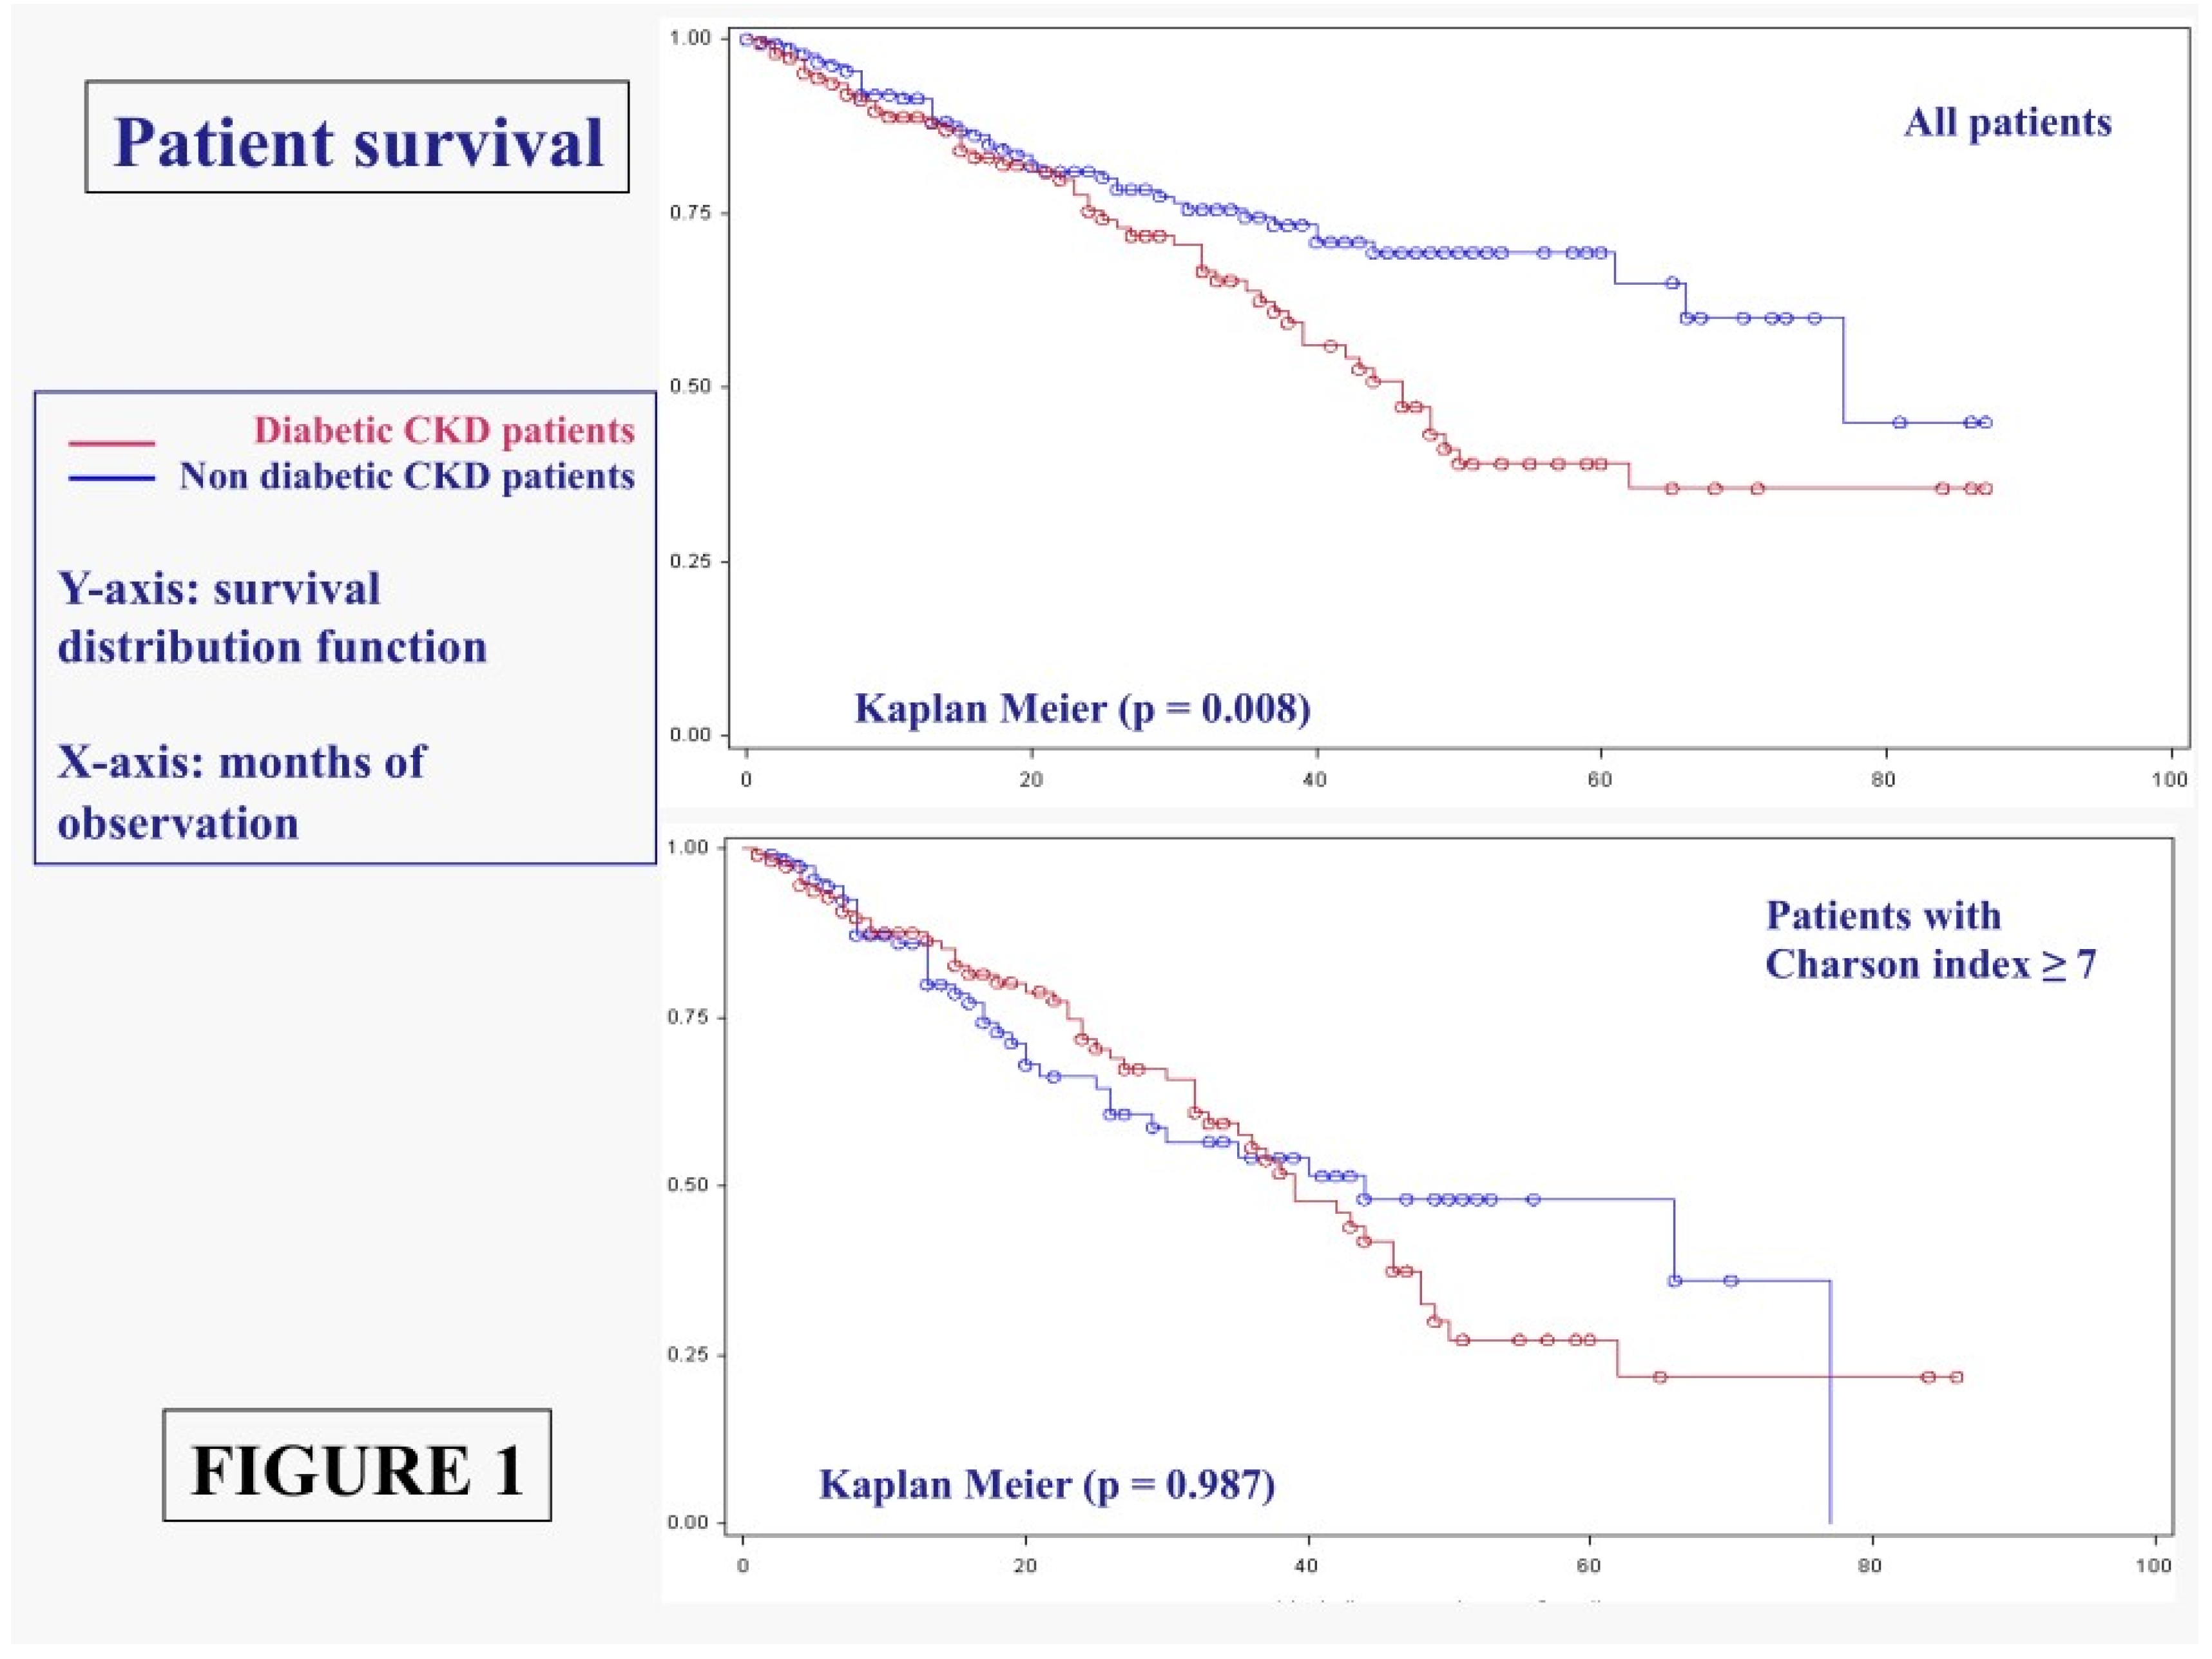
3.1.1. Main Outcomes: Patient Survival
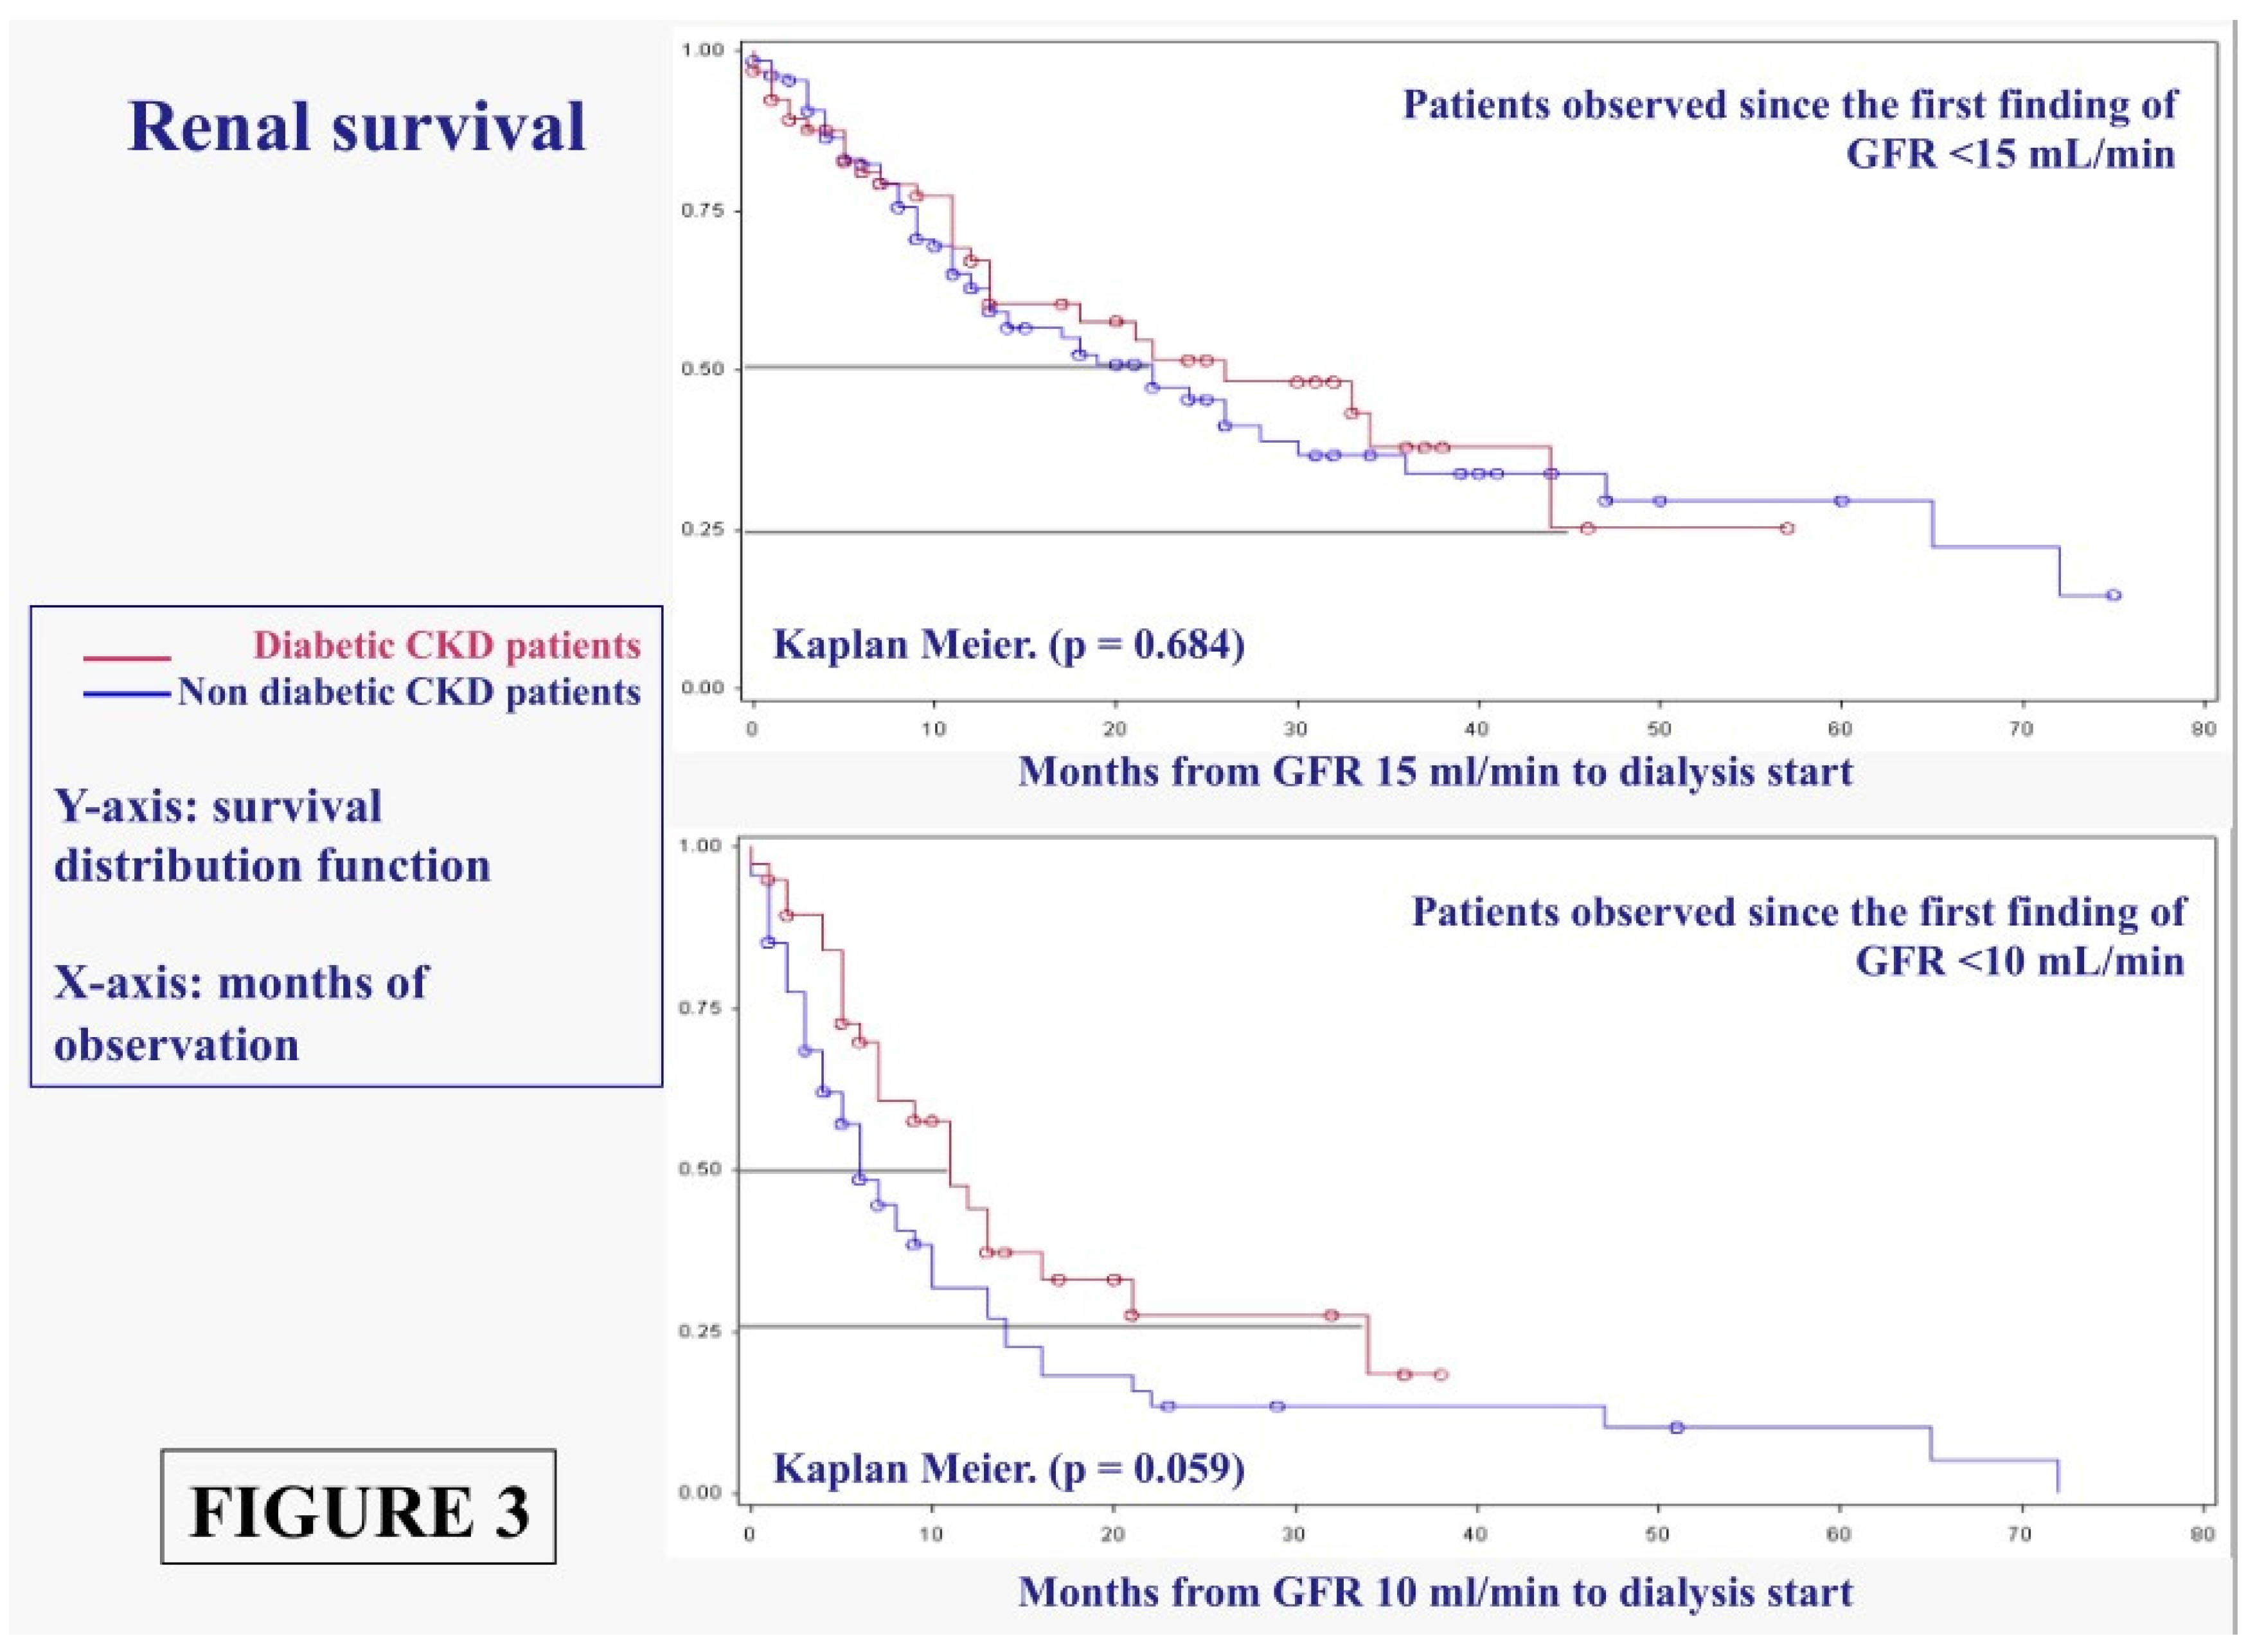
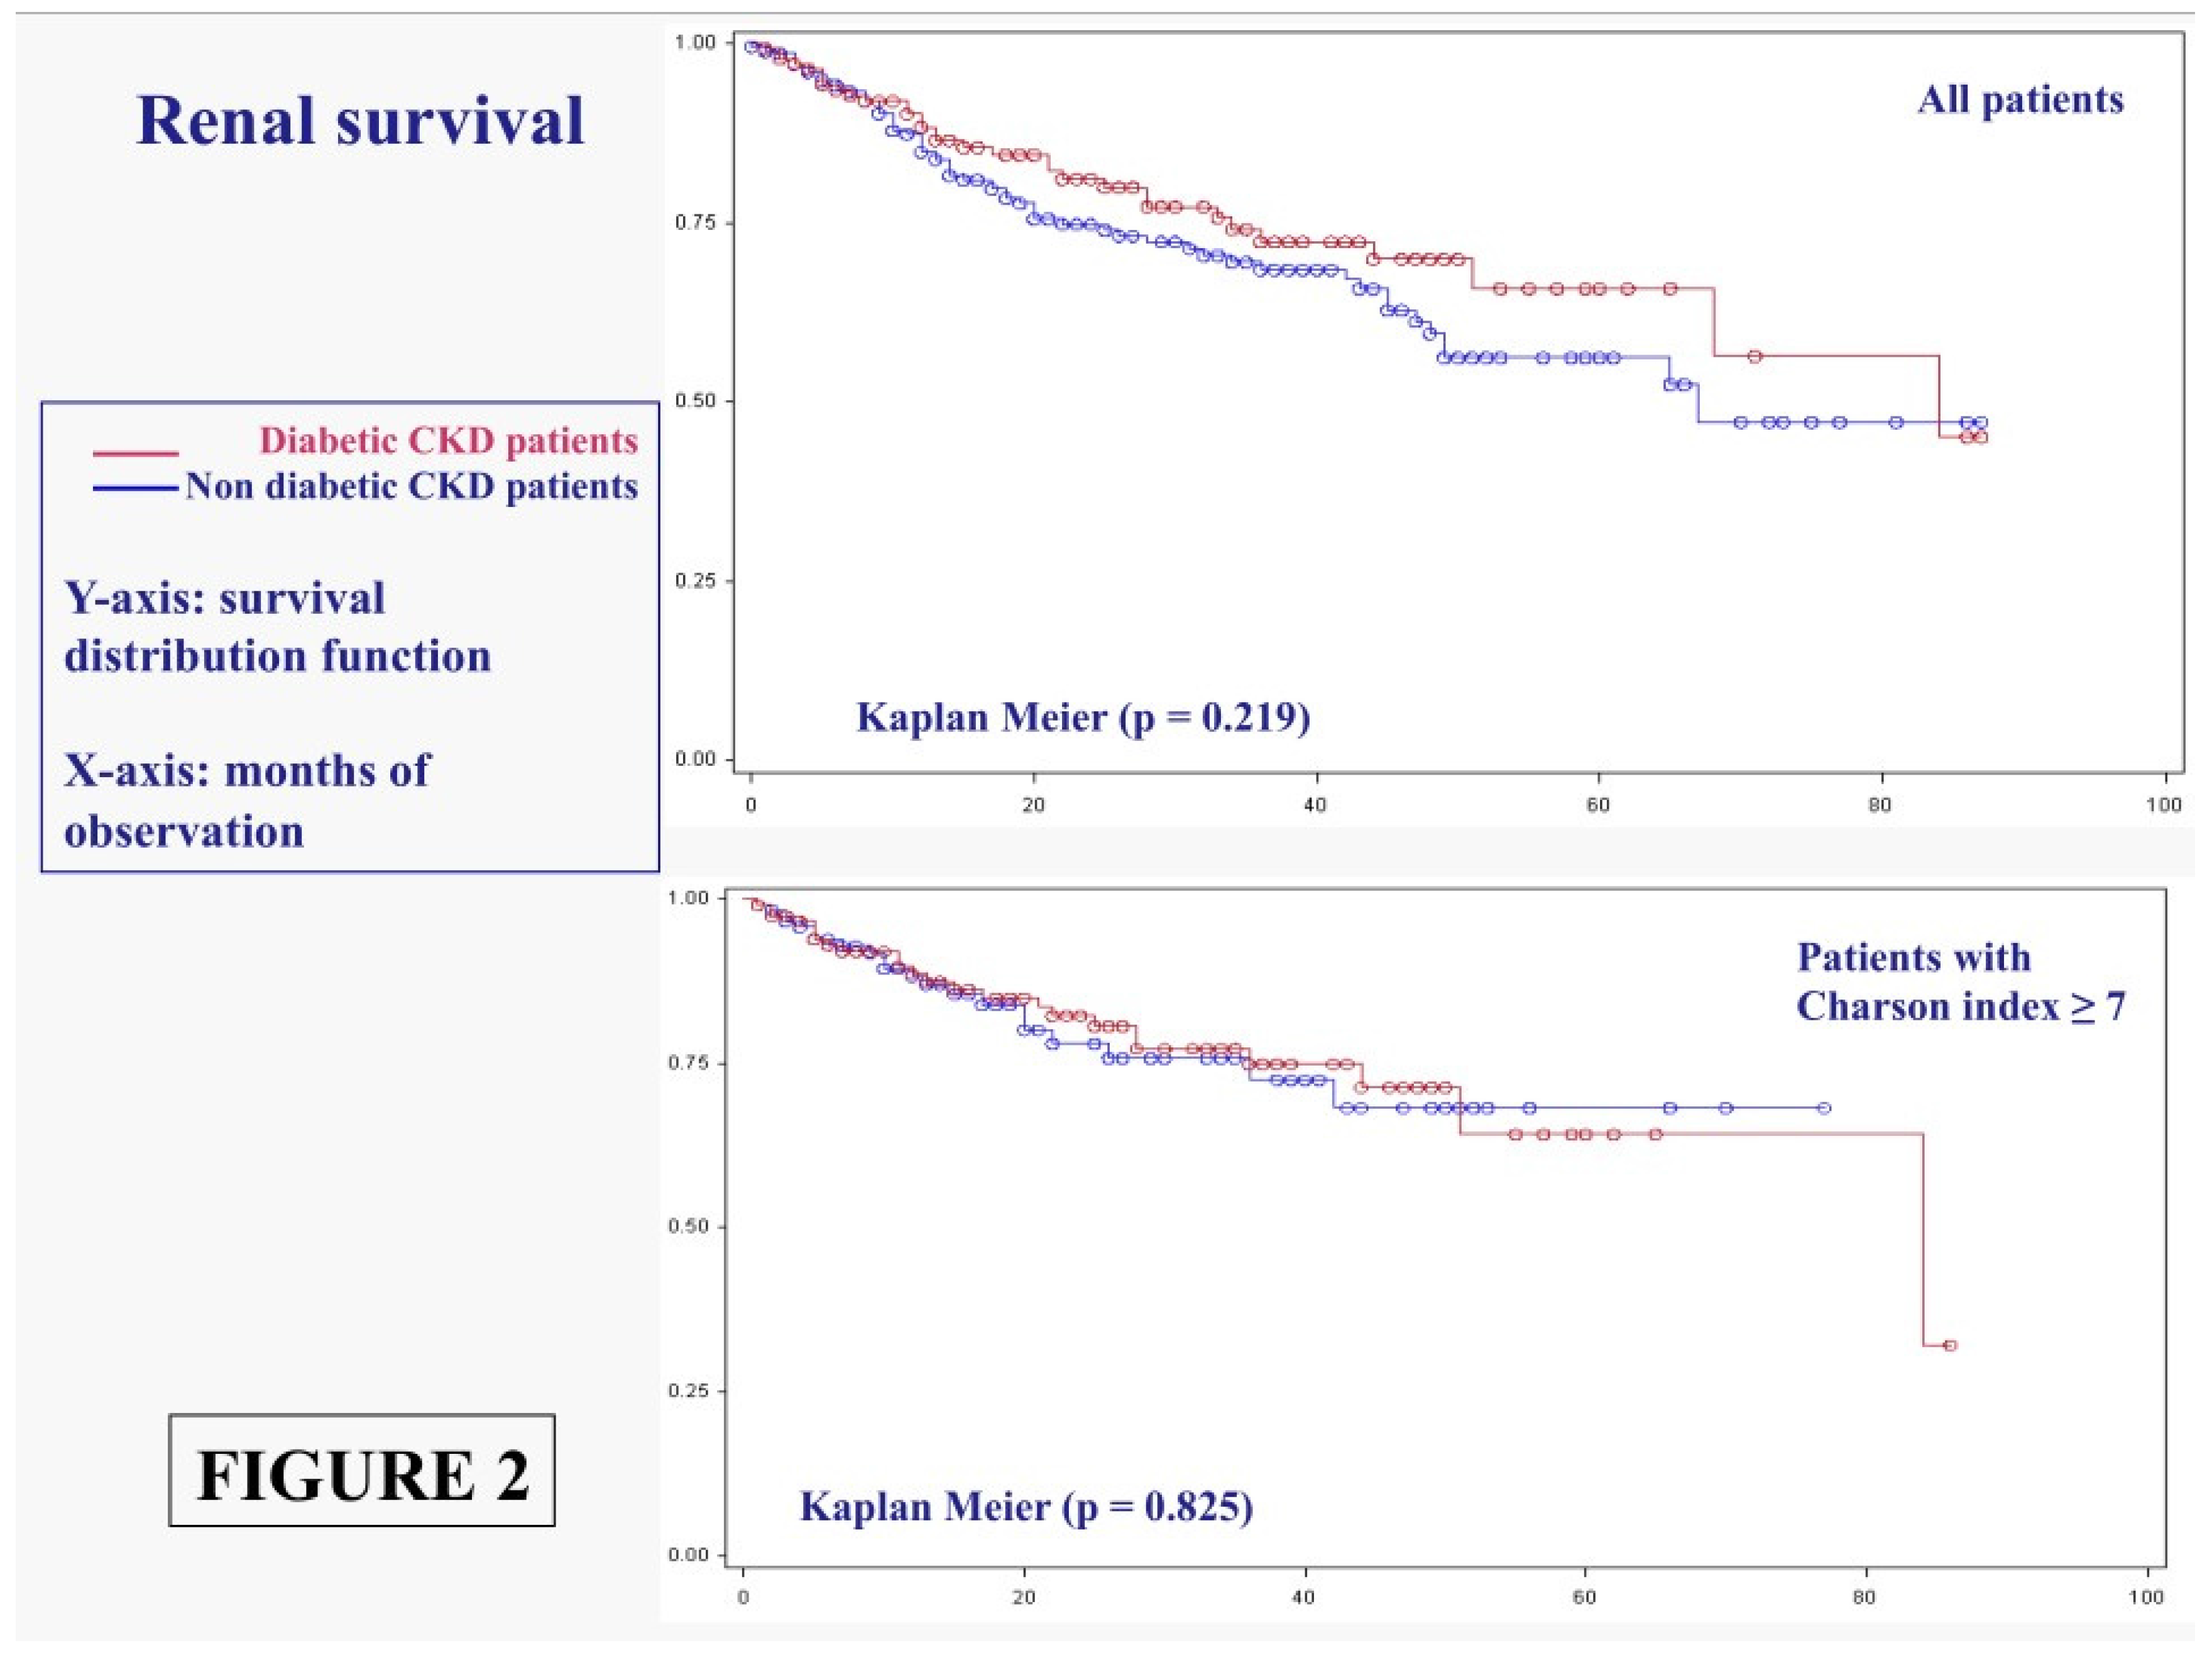
3.1.2. Main Outcomes: Dialysis Start
4. Diabetes as CKD or Diabetes as Comorbidity
5. Compliance and Metabolic Balance

| Diabetes | No Diabetes | p | |
|---|---|---|---|
| Diabetes vs. Diabetes | |||
| n (Overall: 449) | 149 (33.18%) | 300 (66.82%) | - |
| Continues n (%) | 59 (39.60%) | 166 (55.33%) | 0.002 |
| Discontinued n (%) | 3 (2.01%) | 5 (1.66%) | 0.793 |
| Transferred n (%) | 0 (0%) | 6 (2%) | 0.082 |
| Lost To Follow-up n (%) | 3 (2.01%) | 2 (0.66%) | 0.200 |
| On Dialysis n (%) | 32 (21.48%) | 70 (23.33%) | 0.658 |
| Dead n (%) | 52 (34.90%) | 51 (17%) | 0.001 |
| Mean Follow-up (Months) Mean ± SD | 25.80 ± 21.04 | 21.35 ± 20.41 | 0.321 |
6. Discussion
7. Conclusions
Acknowledgments
Author Contributions
Conflicts of Interest
References
- Mogensen, C.E.; Christensen, C.K.; Vittinghus, E. The stages in diabetic renal disease: With emphasis on the stage of incipient diabetic nephropathy. Diabetes 1983, 32 (Suppl. 2), 64–78. [Google Scholar] [CrossRef] [PubMed]
- Richards, N.T.; Greaves, I.; Lee, S.J.; Howie, A.J.; Adu, D.; Michael, J. Increased prevalence of renal biopsy findings other than diabetic glomerulopathy in type II diabetes mellitus. Nephrol. Dial. Transplant. 1992, 7, 397–399. [Google Scholar] [PubMed]
- An, Y.; Xu, F.; Le, W.; Ge, Y.; Zhou, M.; Chen, H.; Zeng, C.; Zhang, H.; Liu, Z. Renal histologic changes and the outcome in patients with diabetic nephropathy. Nephrol. Dial. Transplant. 2015, 30, 257–266. [Google Scholar] [CrossRef] [PubMed]
- Soni, S.S.; Gowrishankar, S.; Kishan, A.G.; Raman, A. Non diabetic renal disease in type 2 diabetes mellitus. Nephrology (Carlton) 2006, 11, 533–537. [Google Scholar] [CrossRef] [PubMed]
- Teng, J.; Dwyer, K.M.; Hill, P.; See, E.; Ekinci, E.I.; Jerums, G.; MacIsaac, R.J. Spectrum of renal disease in diabetes. Nephrology (Carlton) 2014, 19, 528–536. [Google Scholar] [CrossRef] [PubMed]
- Halimi, J.M. The emerging concept of chronic kidney disease without clinical proteinuria in diabetic patients. Diabetes Metab. 2012, 38, 291–297. [Google Scholar] [CrossRef] [PubMed]
- Esser, N.; Legrand-Poels, S.; Piette, J.; Scheen, A.J.; Paquot, N. Inflammation as a link between obesity, metabolic syndrome and type 2 diabetes. Diabetes Res. Clin. Pract. 2014, 105, 141–150. [Google Scholar] [CrossRef] [PubMed]
- Greenfield, J.R.; Campbell, L.V. Relationship between inflammation, insulin resistance and type 2 diabetes: ‘Cause or effect’? Curr. Diabetes Rev. 2006, 2, 195–211. [Google Scholar] [CrossRef] [PubMed]
- Piccoli, G.B.; Grassi, G.; Cabiddu, G.; Nazha, M.; Roggero, S.; Capizzi, I.; de Pascale, A.; Priola, A.M.; di Vico, C.; Maxia, S.; et al. Diabetic Kidney Disease: A Syndrome Rather Than a Single Disease. Rev. Diabet. Stud. 2015, 12, 87–109. [Google Scholar] [CrossRef] [PubMed]
- Catalano, C.; Postorino, M.; Marino, C. The impact of diabetes on patients’ survival in dialysis patients with non-diabetic renal disease and in patients who develop diabetes during chronic dialysis. Nephrol. Dial. Transplant. 1996, 11, 1124–1128. [Google Scholar] [CrossRef] [PubMed]
- Schroijen, M.A.; van de Luijtgaarden, M.W.; Noordzij, M.; Ravani, P.; Jarraya, F.; Collart, F.; Prütz, K.G.; Fogarty, D.G.; Leivestad, T.; Prischl, F.C.; et al. Survival in dialysis patients is different between patients with diabetes as primary renal disease and patients with diabetes as a co-morbid condition. Diabetologia 2013, 56, 1949–1957. [Google Scholar] [CrossRef] [PubMed]
- Chang, T.I.; Park, J.T.; Kim, J.K.; Kim, S.J.; Oh, H.J.; Yoo, D.E.; Han, S.H.; Yoo, T.H.; Kang, S.W. Renal outcomes in patients with type 2 diabetes with or without coexisting non-diabetic renal disease. Diabetes Res. Clin. Pract. 2011, 92, 198–204. [Google Scholar] [CrossRef] [PubMed]
- Wong, T.Y.; Choi, P.C.; Szeto, C.C.; To, K.F.; Tang, N.L.; Chan, A.W.; Li, P.K.; Lai, F.M. Renal outcome in type 2 diabetic patients with or without coexisting nondiabetic nephropathies. Diabetes Care 2002, 25, 900–905. [Google Scholar] [CrossRef] [PubMed]
- Ghavamian, M.; Gutch, C.F.; Kopp, K.F.; Kolff, W.J. The sad truth about hemodialysis in diabetic nephropathy. JAMA 1972, 222, 1386–1389. [Google Scholar] [CrossRef] [PubMed]
- Jones, C.A.; Krolewski, A.S.; Rogus, J.; Xue, J.L.; Collins, A.; Warram, J.H. Epidemic of end-stage renal disease in people with diabetes in the United States population: Do we know the cause? Kidney Int. 2005, 67, 1684–1691. [Google Scholar] [CrossRef] [PubMed]
- Ritz, E.; Rychlík, I.; Locatelli, F.; Halimi, S. End-stage renal failure in type 2 diabetes: A medical catastrophe of worldwide dimensions. Am. J. Kidney Dis. 1999, 34, 795–808. [Google Scholar] [CrossRef]
- Bergrem, H.; Leivestad, T. Diabetic nephropathy and end-stage renal failure: The Norwegian story. Adv. Ren. Replace Ther. 2001, 8, 4–12. [Google Scholar] [CrossRef] [PubMed]
- ESRD Incidence Study Group; Stewart, J.H.; McCredie, M.R.; Williams, S.M. Divergent trends in the incidence of end-stage renal disease due to type 1 and type 2 diabetes in Europe, Canada and Australia during 1998–2002. Diabet. Med. 2006, 23, 1364–1369. [Google Scholar] [PubMed]
- Assogba, F.G.; Couchoud, C.; Hannedouche, T.; Villar, E.; Frimat, L.; Fagot-Campagna, A.; Jacquelinet, C.; Stengel, B.; French Renal Epidemiology and Information Network Registry. Trends in the epidemiology and care of diabetes mellitus-related end-stage renal disease in France, 2007–2011. Diabetologia 2014, 57, 718–728. [Google Scholar] [CrossRef] [PubMed]
- Smith, C.; da Silva-Gane, M.; Chandna, S.; Warwicker, P.; Greenwood, R.; Farrington, K. Choosing not to dialyse: Evaluation of planned non-dialytic management in a cohort of patients with end-stage renal failure. Nephron Clin. Pract. 2003, 95, C40–C46. [Google Scholar] [CrossRef] [PubMed]
- O’Connor, N.R.; Kumar, P. Conservative management of end-stage renal disease without dialysis: A systematic review. J. Palliat. Med. 2012, 15, 228–235. [Google Scholar] [CrossRef] [PubMed]
- Joly, D.; Anglicheau, D.; Alberti, C.; Nguyen, A.T.; Touam, M.; Grünfeld, J.P.; Jungers, P. Octogenarians reaching end-stage renal disease: Cohort study of decision-making and clinical outcomes. J. Am. Soc. Nephrol. 2003, 14, 1012–1021. [Google Scholar] [CrossRef] [PubMed]
- Jones, J.W.; McCullough, L.B. Extending life or prolonging death: When is enough actually too much? J. Vasc. Surg. 2014, 60, 521–522. [Google Scholar] [CrossRef] [PubMed]
- Burns, A.; Carson, R. Maximum conservative management: A worthwhile treatment for elderly patients with renal failure who choose not to undergo dialysis. J. Palliat. Med. 2007, 10, 1245–1247. [Google Scholar] [CrossRef] [PubMed]
- Nesrallah, G.E.; Mustafa, R.A.; Clark, W.F.; Bass, A.; Barnieh, L.; Hemmelgarn, B.R.; Klarenbach, S.; Quinn, R.R.; Hiremath, S.; Ravani, P.; et al. Canadian Society of Nephrology. Canadian Society of Nephrology 2014 clinical practice guideline for timing the initiation of chronic dialysis. CMAJ 2014, 186, 112–117. [Google Scholar] [CrossRef] [PubMed]
- Mitch, W.E.; Remuzzi, G. Diets for patients with chronic kidney disease, still worth prescribing. J. Am. Soc. Nephrol. 2004, 15, 234–237. [Google Scholar] [CrossRef] [PubMed]
- Robertson, L.; Waugh, N.; Robertson, A. Protein restriction for diabetic renal disease. Cochrane Database Syst. Rev. 2007. [Google Scholar] [CrossRef]
- Abaterusso, C.; Lupo, A.; Ortalda, V.; de Biase, V.; Pani, A.; Muggeo, M.; Gambaro, G. Treating elderly people with diabetes and stages 3 and 4 chronic kidney disease. Clin. J. Am. Soc. Nephrol. 2008, 3, 1185–1194. [Google Scholar] [CrossRef] [PubMed]
- Otoda, T.; Kanasaki, K.; Koya, D. Low-protein diet for diabetic nephropathy. Curr. Diabetes Rep. 2014, 14, 523. [Google Scholar] [CrossRef] [PubMed]
- Giordano, M.; Ciarambino, T.; Castellino, P.; Cataliotti, A.; Malatino, L.; Ferrara, N.; Politi, C.; Paolisso, G. Long-term effects of moderate protein diet on renal function and low-grade inflammation in older adults with type 2 diabetes and chronic kidney disease. Nutrition 2014, 30, 1045–1049. [Google Scholar] [CrossRef] [PubMed] [Green Version]
- Willingham, F. The dietary management of patients with diabetes and renal disease: Challenges and practicalities. J. Ren. Care 2012, 38 (Suppl. 1), 40–51. [Google Scholar] [CrossRef] [PubMed]
- Piccoli, G.B.; Motta, D.; Martina, G.; Consiglio, V.; Gai, M.; Mezza, E.; Maddalena, E.; Burdese, M.; Colla, L.; Tattoli, F.; et al. Low-protein vegetarian diet with alpha-chetoanalogues prior to pre-emptive pancreas-kidney transplantation. Rev. Diabet. Stud. 2004, 1, 95–102. [Google Scholar] [CrossRef] [PubMed]
- Piccoli, G.B.; Deagostini, M.C.; Vigotti, F.N.; Ferraresi, M.; Moro, I.; Consiglio, V.; Scognamiglio, S.; Mongilardi, E.; Clari, R.; Aroasio, E.; et al. Which low-protein diet for which CKD patient? An observational, personalized approach. Nutrition 2014, 30, 992–999. [Google Scholar] [CrossRef] [PubMed]
- Piccoli, G.B.; Ferraresi, M.; Deagostini, M.C.; Vigotti, F.N.; Consiglio, V.; Scognamiglio, S.; Moro, I.; Clari, R.; Fassio, F.; Biolcati, M.; et al. Vegetarian low-protein diets supplemented with keto analogues: A niche for the few or an option for many? Nephrol. Dial. Transplant. 2013, 28, 2295–2305. [Google Scholar] [CrossRef] [PubMed]
- National Kidney Foundation. K/DOQI clinical practice guidelines for chronic kidney disease: Evaluation, classification, and stratification. Am. J. Kidney Dis. 2002, 39 (2 Suppl. 1), S1–266. [Google Scholar] [PubMed]
- Levey, A.S.; Stevens, L.A.; Schmid, C.H.; Zhang, Y.L.; Castro, A.F., 3rd; Feldman, H.I.; Kusek, J.W.; Eggers, P.; van Lente, F.; Greene, T.; et al. A new equation to estimate glomerular filtration rate. Ann. Intern. Med. 2009, 150, 604–612. [Google Scholar] [CrossRef] [PubMed]
- Piccoli, G.B.; Vigotti, F.N.; Leone, F.; Capizzi, I.; Daidola, G.; Cabiddu, G.; Avagnina, P. Low-protein diets in CKD: How can we achieve them? A narrative, pragmatic review. Clin. Kidney J. 2015, 8, 61–70. [Google Scholar] [CrossRef] [PubMed]
- D’Alessandro, C.; Piccoli, G.B.; Calella, P.; Brunori, G.; Pasticci, F.; Egidi, M.F.; Capizzi, I.; Bellizzi, V.; Cupisti, A. “Dietaly”: Practical issues for the nutritional management of CKD patients in Italy. BMC Nephrol. 2016, 17, 102. [Google Scholar] [CrossRef] [PubMed]
- Ciarambino, T.; Ferrara, N.; Castellino, P.; Paolisso, G.; Coppola, L.; Giordano, M. Effects of a 6-days-a-week low protein diet regimen on depressive symptoms in young-old type 2 diabetic patients. Nutrition 2011, 27, 46–49. [Google Scholar] [CrossRef] [PubMed]
- Maroni, B.J.; Steinman, T.I.; Mitch, W.E. A method for estimating nitrogen intake of patients with chronic renal failure. Kidney Int. 1985, 27, 58–65. [Google Scholar] [CrossRef] [PubMed]
- Charlson, M.E.; Pompei, P.; Ales, K.L.; MacKenzie, C.R. A New Method of Classifying Prognostic Comorbidity in Longitudinal Studies: Development and Validation. J. Chronic Dis. 1987, 40, 373–383. [Google Scholar] [CrossRef]
- Rothmans, K.J.; Greenland, S.; Lash, T.L. Modern Epidemiology, 3rd ed.; Lippincott Williams and Wilkins: Philadelphia, PA, USA, 2008. [Google Scholar]
- Young, B.A.; Katz, R.; Boulware, L.E.; Kestenbaum, B.; de Boer, I.H.; Wang, W.; Fülöp, T.; Bansal, N.; Robinson-Cohen, C.; Griswold, M.; et al. Risk Factors for Rapid Kidney Function Decline Among African Americans: The Jackson Heart Study (JHS). Am. J. Kidney Dis. 2016, 68, 229–239. [Google Scholar] [CrossRef] [PubMed]
- Rughooputh, M.S.; Zeng, R.; Yao, Y. Protein Diet Restriction Slows Chronic Kidney Disease Progression in Non-Diabetic and in Type 1 Diabetic Patients, but Not in Type 2 Diabetic Patients: A Meta-Analysis of Randomized Controlled Trials Using Glomerular Filtration Rate as a Surrogate. PLoS ONE 2015, 10, e0145505. [Google Scholar] [CrossRef] [PubMed]
- Piccoli, G.B.; Grassi, G.; Mezza, E.; Gai, M.; Iacuzzo, C.; Bechis, F.; Biancone, L.; Jeantet, A.; Dani, F.; Perin, P.C.; et al. Early referral of Type 2 diabetic patients: Are we ready for the assault? Nephrol. Dial. Transplant. 2002, 17, 1241–1247. [Google Scholar] [CrossRef] [PubMed]
- Koya, D.; Haneda, M.; Inomata, S.; Suzuki, Y.; Suzuki, D.; Makino, H.; Shikata, K.; Murakami, Y.; Tomino, Y.; Yamada, K.; et al. Long-term effect of modification of dietary protein intake on the progression of diabetic nephropathy: A randomised controlled trial. Diabetologia 2009, 52, 2037–2045. [Google Scholar] [CrossRef] [PubMed]
- Cianciaruso, B.; Pota, A.; Bellizzi, V.; di Giuseppe, D.; di Micco, L.; Minutolo, R.; Pisani, A.; Sabbatini, M.; Ravani, P. Effect of a Low-Versus ModerateProtein Diet on Progression of CKD: Follow-up of a Randomized Controlled Trial. Am. J. Kidney Dis. 2009, 54, 1052–1061. [Google Scholar] [CrossRef] [PubMed]
- Larsen, R.N.; Mann, N.J.; Maclean, E.; Shaw, J.E. The effect of high-protein, low-carbohydrate diets in the treatment of type 2 diabetes: A 12 month randomised controlled trial. Diabetologia 2011, 54, 731–740. [Google Scholar] [CrossRef] [PubMed]
- Jesudason, D.R.; Pedersen, E.; Clifton, P.M. Weight-loss diets in people with type 2 diabetes and renal disease: A randomized controlled trial of the effect of different dietary protein amounts. Am. J. Clin. Nutr. 2013, 98, 494–501. [Google Scholar] [CrossRef] [PubMed]
- Pedrini, M.T.; Levey, A.S.; Lau, J.; Chalmers, T.C.; Wang, P.H. The effect of dietary protein restriction on the progression of diabetic and nondiabetic renal diseases: A meta-analysis. Ann. Intern. Med. 1996, 124, 627–632. [Google Scholar] [CrossRef] [PubMed]
- Nezu, U.; Kamiyama, H.; Kondo, Y.; Sakuma, M.; Morimoto, T.; Ueda, S. Effect of low-protein diet on kidney function in diabetic nephropathy: Meta-analysis of randomised controlled trials. BMJ Open 2013, 3. [Google Scholar] [CrossRef] [PubMed]
- Fouque, D.; Laville, M. Low protein diets for chronic kidney disease in non diabetic adults. Cochrane Database Syst. Rev. 2009. [Google Scholar] [CrossRef]


| Qualitative Strategies | ||
|---|---|---|
| 0.6 g/Kg/day with Protein-Free Food | 0.6 g/Kg/day Vegan Supplemented | 0.6–0.8 g/Kg/day Vegan not Supplemented |
| The strategy is to replace bread and pasta or rice, and regular flour with protein-free products. No restriction regards vegetables; fruits may be limited in diabetic patients. Food of animal origin, including dairy products, can be used as “seasoning” for the pasta, or as part of the “main course” that has to be completed with vegetables. | The diet is based on plant-derived food (fruit, vegetables, sugars, starches such as pasta and bread, cous-cous, polenta and legumes) supplemented by a mixture of amino acids and ketoacids. Supplements allow choosing any preferred plant-derived food without needing to integrate grains and legumes at each meals. The supplements are calculated as 1 tablet per 8–10 kg of body weight, the difference depending on proteinuria and nutritional status. | The diet is strictly vegan and includes only foods of plant origin (fruit, vegetables, starches, legumes); they must be combined to allow a balanced intake of essential amino acids. In order to integrate the proteins, the role of thumb is to integrate during the day at least two sources of starches with two kinds of legumes, or at least one type of starch and legume at each meal. |
| Other strategies, qualitative and quantitative: 0.6 g/Kg/day non-supplemented or 0.3 g/Kg/day vegan supplemented | ||
| Traditional 0.6 diets are employed in patients who prefer to keep a wide variety of food in the diet, and weigh them. Such a diet is usually designed with the dietician and is based upon a series of “equivalences” in protein portions. At least 40% of the proteins should be of animal origin. | ||
| Vegan supplemented very low-protein diet (0.3 g/kg/day): This is a combination of vegan supplemented and protein-free food: starches are substituted with protein-free food and supplement doses are doubled (1 for each 5 kg of BW). The quantity of legumes may have to be restricted to adhere to the 0.3 target. | ||
| Wine and beer are allowed in moderate quantities. Natural fruit juices are allowed, taking care to avoid sweeteners, taste enhancers and preservatives. Other commercial beverages (sodas) should be avoided. | ||
| 1–3 unrestricted meals per week are allowed: i.e., without any qualitative or quantitative restrictions, unless required for other diseases (diabetes, celiac disease, food intolerances etc.). | ||
| Qualitative and quantitative modifications may be suggested according to the results of the blood and urinary controls. | ||
| Diabetic Patients | Non-Diabetic Patients | p (Diab-Non-Diab) | |
|---|---|---|---|
| N | 149 | 300 | - |
| (33.18%) | (66.82%) | ||
| Males (%) | 87 | 190 | 0.315 |
| (58.39%) | (63.33%) | ||
| BMI | 27.14 | 25.71 | 0.07 |
| median (min–max) | (15.5–44.92) | (13.32–46.67) | |
| IQR | 4.8 | 4.79 | |
| Age | 70 | 70 | 0.467 |
| median (min–max) | (19–92) | (23–97) | |
| IQR | 13 | 22.5 | |
| Age over 65 (%) | 78 | 118 | 0.006 |
| (52.35%) | (39.33%) | ||
| Age over 80 (%) | 23 | 66 | 0.141 |
| (15.44%) | (22.00%) | ||
| Charlson | 8 | 6 | 0.002 |
| median (min–max) | (2–13) | (2–13) | |
| IQR | 3 | 4 | |
| Charlson ≥ 7 (%) | 122 | 124 | <0.001 |
| (81.88%) | (41.33%) | ||
| Charlson ≥ 10 (%) | 44 | 27 | <0.001 |
| (29.53%) | (9.00%) | ||
| Cardiopathy (%) | 63 | 145 | 0.171 |
| (42.28%) | (48.33%) | ||
| sCreatinine (mg/dL) | 2.78 | 2.8 | 0.436 |
| median (min–max) | (0.90–6.80) | (0.55–16) | |
| IQR | 1.47 | 1.88 | |
| eGFR-EPI (mL/min) | 20 | 20 | 0.797 |
| median (min–max) | (6.3–79.7) | (3–127.10) | |
| IQR | 11.2 | 15.9 | |
| GFR < 15 mL/min at enrolment n (%) | 35 | 90 | 0.147 |
| (23.49%) | (30.00%) | ||
| GFR < 10 mL/min at enrolment n (%) | 13 | 31 | 0.589 |
| (8.72%) | (10.33%) | ||
| Proteinuria (g/day) | 0.8 | 0.7 | 0.553 |
| median (min–max) | (0.08–15.80) | (0.04–11) | |
| IQR | 2.95 | 1.7 | |
| Proteinuria ≥ 1 g/day (%) | 78 | 124 | 0.027 |
| (52.35%) | (41.33%) | ||
| Proteinuria ≥ 3 g/day (%) | 41 | 41 | 0.002 |
| (27.52%) | (13.67%) |
| Diabetic Patients | Vegan Suppl. | With Protein-Free Food | Other | All Cases | p among Groups |
|---|---|---|---|---|---|
| N (%) | 59 | 70 | 20 | 149 | - |
| (39.60%) | (46.98%) | (13.43%) | (100%) | ||
| Males (%) | 40 | 39 | 8 | 87 | 0.076 |
| (67.80%) | (55.71%) | 40% | (58.39%) | ||
| BMI | 27.11 | 27.26 | 27.15 | 27.14 | 0.95 |
| median (min–max) | (18.49–42.03) | (17.45–44.92) | (20.31–36.32) | (15.5–44.92) | |
| IQR | 4.07 | 4.89 | 7.65 | 4.8 | |
| Age | 68 | 73 | 65 | 70 | <0.001 |
| median (min–max) | (19–85) | (50–92) | (29–85) | (19–92) | |
| IQR | 11 | 10 | 19.5 | 13 | |
| Age over 65 (%) | 28 | 44 | 6 | 78 | 0.013 |
| (47.46%) | (62.86%) | (30%) | (52.35%) | ||
| Age over 80 (%) | 4 | 16 | 3 | 23 | 0.001 |
| (6.78%) | (22.86%) | (15%) | (15.44%) | ||
| Charlson | 8 | 9 | 8.5 | 8 | 0.022 |
| median (min–max) | (2–11) | (5–13) | (2–12) | (2–13) | |
| IQR | 2 | 2 | 5.5 | 3 | |
| Charlson ≥ 7 (%) | 45 | 63 | 14 | 122 | 0.043 |
| (76.27%) | (90%) | (70%) | (81.88%) | ||
| Charlson ≥ 10 (%) | 10 | 27 | 7 | 44 | 0.023 |
| (16.95%) | (38.57%) | (35%) | (29.53%) | ||
| Cardiopathy (%) | 28 | 28 | 7 | 63 | 0.54 |
| (47.46%) | (40%) | (35%) | (42.28%) | ||
| SCreatinine (mg/dL) | 2.9 | 2.7 | 2.5 | 2.78 | 0.761 |
| median (min–max) | (0.90–6.80) | (1–6.40) | (1.15–4.90) | (0.90–6.80) | |
| IQR | 1.7 | 1.3 | 1.75 | 1.47 | |
| eGFR-EPI (mL/min) | 20.4 | 19.85 | 18.9 | 20 | 0.214 |
| median (min–max) | (6.30–79.70) | (7.70–61) | (8.80–67.80) | (6.3–79.7) | |
| IQR | 19.3 | 9.1 | 10.8 | 11.2 | |
| GFR < 15 mL/min at enrolment n (%) | 16 | 15 | 4 | 35 | 0.693 |
| (27.12%) | (21.43%) | (20%) | (23.49%) | ||
| GFR < 10 mL/min at enrollment n (%) | 7 | 5 | 1 | 13 | 0.522 |
| (11.86%) | (7.14%) | (5%) | (8.72%) | ||
| Proteinuria (g/day) | 1.6 | 0.5 | 1.4 | 0.8 | 0.017 |
| Median (min–max) | (0.10–10) | (0.08–15.80) | (0.20–10.40) | (0.04–15.80) | |
| IQR | 4.1 | 1.8 | 2.8 | 2.95 | |
| Proteinuria ≥ 1 g/day (%) | 40 | 27 | 11 | 78 | 0.004 |
| (67.80%) | (38.57%) | (55%) | (52.35%) | ||
| Proteinuria ≥ 3 g/day (%) | 23 | 13 | 5 | 41 | 0.001 |
| (38.98%) | (18.57%) | (25%) | (27.52%) |
| Non Diabetics | Vegan Suppl. | With Protein-Free Food | Other | All Cases | p among Groups |
|---|---|---|---|---|---|
| N (%) | 156 (52%) | 89 (29.67%) | 55 (18.33%) | 300 (100%) | - |
| Males (%) | 104 (66.67%) | 59 (66.29%) | 27 (49.09%) | 190 (63.33%) | 0.053 |
| BMI | 25.72 | 26.3 | 24.87 | 25.71 | 0.08 |
| median (min–max) | (13.32–41.03) | (17.96–42.52) | (17.81–46.67) | (13.32–46.67) | |
| IQR | 4.74 | 5.24 | 5.5 | 4.79 | |
| Age | 63 | 78 | 72 | 70 | <0.001 |
| median (min–max) | (23−86) | (26–97) | (23−88) | (23–97) | |
| IQR | 25 | 12 | 22 | 22.5 | |
| Age over 65 (%) | 58 | 38 | 22 | 118 | 0.692 |
| (37.18%) | (42.70%) | (40%) | (39.33%) | ||
| Age over 80 (%) | 16 | 27 | 13 | 66 | 0.001 |
| (10.26%) | (30.13%) | (23.64%) | (22%) | ||
| Charlson | 5 | 7 | 6 | 6 | <0.001 |
| median (min–max) | (2–12) | (2–13) | (2–11) | (2–13) | |
| IQR | 4 | 2 | 4 | 4 | |
| Charlson ≥ 7 (%) | 46 | 55 | 23 | 124 | <0.001 |
| (29.48%) | (61.80%) | (41.81%) | (41.33%) | ||
| Charlson ≥ 10 (%) | 7 | 15 | 5 | 27 | 0.005 |
| (4.49%) | (16.85%) | (9.09%) | (9%) | ||
| Cardiopathy (%) | 73 | 39 | 33 | 145 | 0.144 |
| (46.80%) | (43.82%) | (60%) | (48.33%) | ||
| SCreatinine (mg/dL) | 3.2 | 2.4 | 2.49 | 2.8 | <0.001 |
| median (min–max) | (0.55–16) | (1.05–7) | (0.60–6.70) | (0.55–16) | |
| IQR | 2.5 | 1.3 | 1.38 | 1.88 | |
| eGFR-EPI (mL/min) | 17.15 | 21.4 | 24.3 | 20 | 0.367 |
| median (min–max) | (3–125.70) | (6.60–73.10) | (5.70–127.1) | (3–127.10) | |
| IQR | 14.2 | 13.8 | 17.8 | 15.9 | |
| GFR < 15 mL/min at enrolment n (%) | 64 | 17 | 9 | 90 | 0.001 |
| (41.02%) | (19.10%) | (16.36%) | (30%) | ||
| GFR < 10 mL/min at enrolment n (%) | 22 | 5 | 4 | 31 | 0.107 |
| (14.10%) | (5.62%) | (7.28%) | (10.33%) | ||
| Proteinuria (g/day) | 1 | 0.2 | 0.8 | 0.7 | <0.001 |
| Median (min–max) | (0.10–8.20) | (0.04–6.10) | (0.10–11) | (0.04–11) | |
| IQR | 2.1 | 0.45 | 1.8 | 1.7 | |
| Proteinuria ≥ 1 g/day (%) | 85 (54.49%) | 15 (16.85%) | 24 (43.64%) | 124 (41.33%) | 0.001 |
| Proteinuria ≥ 3 g/day (%) | 27 (7.31%) | 6 (6.74%) | 8 (14.55%) | 41 (13.67%) | 0.096 |
| Diabetic Patients | Type 1 | Type 2 | p | Type 2 CKD | Type 2 Comorb | p | Type 2 PtU ≥ 1 g | Type 2 PtU < 1 g | p |
|---|---|---|---|---|---|---|---|---|---|
| 149 | 12 | 137 | 42 | 95 | - | 70 | 67 | - | |
| Males (%) | 4 | 83 | 0.076 | 26 | 57 | 0.833 | 47 | 36 | 0.109 |
| (33.33%) | (60.58%) | (61.90%) | (60%) | (67.10%) | (53.70%) | ||||
| BMI | 23.24 | 27.39 | 0.014 | 27.97 | 27.18 | 0.17 | 27.55 | 26.99 | 0.84 |
| median (min–max) | (18.49–29.32) | (18.33–44.92) | (18.77–41.03) | (20.37–44.92) | (19.15–41.03) | (20.37–44.92) | |||
| IQR | 4.98 | 4.61 | 6.28 | 3.99 | 4.57 | 4.37 | |||
| Age | 43.5 | 71 | 0.031 | 66.5 | 72 | 0.181 | 68 | 73 | 0 |
| median (min–max) | (29–62) | (19–92) | (46–85) | (19–92) | (47–86) | (19–92) | |||
| IQR | 15.5 | 12 | 10 | 11 | 11 | 13 | |||
| Age over 65 (%) | 0 | 119 (86.86%) | - | 31 (73.81%) | 88 (92.63%) | 0.001 | 46 (65.70%) | 61 (91%) | 0 |
| Age over 80 (%) | 0 | 40 (29.20%) | - | 6 (14.28%) | 34 (35.79%) | 0.011 | 5 (7.1%) | 18 (26.90%) | 0.002 |
| Charlson | 4 | 9 | 0.06 | 8 | 9 | 0.032 | 8 | 9 | 0.035 |
| median (min–max) | (2–8) | (2–13) | (5–11) | (2–13) | (5–11) | (2–13) | |||
| IQR | 1.5 | 3 | 2 | 2 | 2 | 2 | |||
| Charlson ≥ 7 (%) | 2 (16.17%) | 120 (87.59%) | 0 | 33 (78.57%) | 87 (91.58%) | 0.033 | 58 (82.90%) | 62 (92.50%) | 0.071 |
| Charlson ≥ 10 (%) | 0 (0%) | 44 (32.12%) | 0.019 | 6 (14.29%) | 38 (40%) | 0.0002 | 14 (20.29%) | 30 (44.12%) | 0.003 |
| Cardiopathy (%) | 3 (25%) | 93 (67.88%) | 0.009 | 25 (59.52%) | 68 (71.58%) | 0.163 | 41 (58.60%) | 52 (77.60%) | 0.013 |
| SCreatinine | 2.45 | 2.8 | 0.393 | 2.6 | 2.9 | 0.858 | 2.89 | 2.7 | 0.695 |
| median (min–max) | (0.9–4.7) | (1–6.8) | (1–6.4) | (1.1–6.8) | (1–6.8) | (1.4–5) | |||
| mg/dL IQR | 1.95 | 1.4 | 1.5 | 1.4 | 1.6 | 2.4 | |||
| eGFR-EPI (mL/min) | 24.95 | 19.8 | 0.026 | 20.85 | 19.5 | 0.993 | 19.3 | 19.9 | 0.875 |
| median (min–max) | (12.10–79.70) | (6.3–75.5) | (6.3071.60) | (7.4–77.7) | (6.3–75.5) | (7.7–54.5) | |||
| IQR | 21.3 | 10.7 | 14.1 | 11.2 | 11.5 | 10.1 | |||
| GFR < 15 at start n (%) | 3 (25%) | 32 (23.36%) | 0.897 | 8 (19.05%) | 24 (25.26%) | 0.428 | 16 (22.90%) | 16 (23.90%) | 0.524 |
| GFR < 10 at start n (%) | 0 | 13 (9.49%) | 0.264 | 5 (11.90%) | 8 (8.42%) | 0.472 | 10 (14.30%) | 3 (4.5%) | 0.05 |
| PtU (g/day) | 3.05 | 1 | 0.041 | 3.25 | 0.5 | 0 | 3 | 0.25 | 0 |
| median (min–max) | (0.2–10.4) | (0.1–15.8) | (0.2–15.8) | (0.08–7) | (1–15.8) | (0.1–0.9) | |||
| IQR | 4.1 | 2.67 | 3.5 | 1.3 | 3.2 | 0.3 |
| MORTALITY | |||||
|---|---|---|---|---|---|
| n/N | Crude RR (95% CIs) | p Value | Adjusted HR (95% CIs) | p Value | |
| Diabetes | 52/149 | 1.4534 | <0.0001 | 1.146 | 0.5173 |
| No-Diabetes | 51/300 | (1.1831–1.7855) | (0.758–1.733) | ||
| Charlson index | <0.0001 | <0.0001 | |||
| <7 | 14/203 | 4.0188 | 5.155 | ||
| ≥7 | 89/246 | (2.4465–6.6014) | (2.851–9.320) | ||
| Proteinuria (g/day) | <0.0001 | 0.0615 | |||
| <1 | 74/247 | 0.6959 | 0.654 | ||
| ≥1 | 29/202 | (0.5928–0.8170) | (0.419–1.021) | ||
| GFR (mL/m) | 0.1065 | 0.0928 | |||
| <30 | 85/344 | 0.9071 | 0.644 | ||
| ≥30 | 18/105 | (0.8144–1.0104) | (0.385–1.076) | ||
| RRT START | |||||
| n/N | Crude RR (95% CIs) | p Value | Adjusted HR (95% CIs) | p Value | |
| Diabetes | 32/149 | 0.9658 | 0.6584 | 0.781 | 0.3175 |
| No-diabetes | 70/300 | (0.8303–1.1234) | (0.481–1.268) | ||
| Charlson index | 0.0138 | 0.1098 | |||
| <7 | 57/246 | 0.7529 | 0.692 | ||
| ≥7 | 45/203 | (0.6090–0.9308) | (0.441–1.087) | ||
| Proteinuria (g/day) | <0.0001 | <0.0001 | |||
| <1 | 34/247 | 1.8415 | 3.703 | ||
| ≥1 | 68/202 | (1.3823–2.4533) | (2.409–5.691) | ||
| GFR (mL/m) | <0.0001 | <0.0001 | |||
| <30 | 96/344 | 0.7594 | 0.115 | ||
| ≥30 | 6/105 | (0.6994–0.8245) | (0.005–0.267) | ||
| Patients | Diabetes | No Diabetes | p Diab Non-Diab |
|---|---|---|---|
| N 168 | 41 | 127 | - |
| sCreatinine mg/dL | 2.89 | 2.67 | 0.587 |
| median (min–max) | (1.27–4.93) | (1.20–9) | |
| IQR | 3.33 | 1.7 | |
| Proteinuria g/day | 0.73 | 0.8 | 0.924 |
| median (min–max) | (0.02–11) | (0–7.9) | |
| IQR | 1.94 | 1.79 | |
| s-albumin g/dL | 3.72 | 3.8 | 0.627 |
| median (min–max) | (1.8–4.7) | (2.39–5.7) | |
| IQR | 0.7 | 0.6 | |
| Albumin < 3 g/dL n (%) | 9 (21.95%) | 12 (9.45%) | 0.021 |
| PTH pg/mL | 114 | 94.9 | 0.014 |
| Median (min–max) | (41–734) | (8–848) | |
| IQR | 88.95 | 94.4 | |
| Urea mg/dL | 96 | 90 | 0.335 |
| median (min–max) | (37–232) | (19–280) | |
| IQR | 63 | 61 | |
| HCO3 mEq/dL | 26.1 | 25.1 | 0.891 |
| median (min–max) | (17.7–39) | (14.3–34) | |
| IQR | 5.35 | 4.4 | |
| Protein intake (Mitch formula) g/kg/day | 0.47 | 0.47 | 0.894 |
| median (min–max) | (0.27–0.76) | (0.21–0.86) | |
| IQR | 0.21 | 0.17 | |
| Hb1ac (%) | 7.2 | ||
| Median (min–max) | (4.5–9.8) | ||
| IQR | 11.5 |
© 2016 by the authors; licensee MDPI, Basel, Switzerland. This article is an open access article distributed under the terms and conditions of the Creative Commons Attribution (CC-BY) license (http://creativecommons.org/licenses/by/4.0/).
Share and Cite
Piccoli, G.B.; Ventrella, F.; Capizzi, I.; Vigotti, F.N.; Mongilardi, E.; Grassi, G.; Loi, V.; Cabiddu, G.; Avagnina, P.; Versino, E. Low-Protein Diets in Diabetic Chronic Kidney Disease (CKD) Patients: Are They Feasible and Worth the Effort? Nutrients 2016, 8, 649. https://doi.org/10.3390/nu8100649
Piccoli GB, Ventrella F, Capizzi I, Vigotti FN, Mongilardi E, Grassi G, Loi V, Cabiddu G, Avagnina P, Versino E. Low-Protein Diets in Diabetic Chronic Kidney Disease (CKD) Patients: Are They Feasible and Worth the Effort? Nutrients. 2016; 8(10):649. https://doi.org/10.3390/nu8100649
Chicago/Turabian StylePiccoli, Giorgina B., Federica Ventrella, Irene Capizzi, Federica N. Vigotti, Elena Mongilardi, Giorgio Grassi, Valentina Loi, Gianfranca Cabiddu, Paolo Avagnina, and Elisabetta Versino. 2016. "Low-Protein Diets in Diabetic Chronic Kidney Disease (CKD) Patients: Are They Feasible and Worth the Effort?" Nutrients 8, no. 10: 649. https://doi.org/10.3390/nu8100649